geology and ground-water features of shasta valley · that descended the northwest flanks of mount...
TRANSCRIPT

Geology and Ground- Water Features of Shasta Valley, Siskiyou County CaliforniaBy SEYMOUR MACK
GEOLOGICAL SURVEY WATER-SUPPLY PAPER 1484
Prepared in cooperation with the California Division of Heater Resources
Property of
GROUND WATER BRANCH
UNITED STATES GOVERNMENT PRINTING OFFICE, WASHINGTON : I960

UNITED STATES DEPARTMENT OF THE INTERIOR
FRED A. SEATON, Secretary
GEOLOGICAL SURVEY
Thomas B. Nolan, Director
The U.S. Geological Survey Library has cataloged this publication as follows:
Mack, Seymour, 1922 Geology and ground-water features of Shasta Valley, Siskiyou
County, Calif. Washington, U.S. Govt. Print. Off., 1959.V, 115 p. illus., maps (2 fold, in pocket) diagrs., tables.
24 cm. (U.S. Geological Survey. Water-supply paper 1484)Prepared in cooperation with the California Division of Water
Resources.Bibliography: p. 110-111.
1. Geology California Siskiyou Co. 2. Water, Under ground California Siskiyou Co. 3. Water Supply California Siskiyou Co. I. California. Dept. of Water Resources. II. Title: Shasta Valley, Siskiyou County, Calif. (Series)
For sale by the Superintendent of Documents, U.S. Government Printing Office Washington 25, D.C.

CONTENTS
PageAbstract. _ ________________________________________________________ 1Introduction-_____________________________________________________ 3
Purpose and scope of the investigation-__________________________ 3Location of the area____-_---___________--__----___-_--________ 3Methods of investigation._________-_-_____-_----___-___________ 5Previous investigations.________________________________________ 5Acknowledgments. ____________________________________________ 6Well-numbering system._______________________________________ 6
Geography.___________________________________ ___________________ 7Topography and drainage-_____________________________________ 7Climate-__---_--_____-_-___-______-_____-_-___-------___---_- 11Transportation._______________________________________________ 15Population____ _ _______________________________________________ 15Agriculture._____-___-____-___-__--_-__---_---___-_---_-____-- 16Mineral resources.______.___________________-_-_--_-__-___-___- 16
Geology-------_-_________-_-___-____-_______---_-_---__-___-----_ 17General character and age of the rocks_ _________-_----_-_________ 17Hydrologic properties of aquifers___________-_-_-__-_-_--___--_-_ 23Geologic units and their water-bearing properties._________________ 24
Rocks of pre-Late Cretaceous age____----------_-------__--_- 24Consolidated sedimentary rocks of Cretaceous and Eocene age_ _ 26
Chico formation (Upper Cretaceous)________---_-_____--_ 26Umpqua formation (Eocene)__-_----------_-------__-__- 29
Volcanic rocks of Tertiary and Quaternary age________________ 31Volcanic rocks of the western Cascades (Eocene to Miocene)- 31Volcanic rocks of the high Cascades (Pliocene to Recent) _ . _ 38Plutos Cave basalt (Recent)____________________________ 41
Unconsolidated deposits of Quaternary age.________--_---__-_ 43Terrace deposits (Pleistocene)___________________________ 43Morainal and fluvioglacial deposits (Pleistocene and Recent) _ 44Older alluvium (Pleistocene and Recent)_____-_______---_ 45Younger alluvium (Recent)_____________________________ 47
Structure. _-_-_-_________________-___--______-__-___---_--_--- 49Geologic history.______________________________________________ 50
Ground water_----______-______________________--_-__-_--_-__-_--- 54Occurrence and movement._-______-.__________--_--_--_-___---_ 54Springs__ _ ____________________________________________________ 57Fluctuations of water levels._______-_-_______-__-_--_--__----_-- 60Recharge.____________________________________________________ 62Discharge._--_________--____________--______-_-------_--__--_ 63
Water utilization. _--___-_--_____________-____-_______-_-_________- 66Quality of water.__________________________________________________ 67
Relation to use____-___--___--________---_-___-_-___---_____--- 68Relation to geology.-__________________----__-_-___-_--___----- 71
References cited.__________________________________________________ 110Index______________________________________________________________ 113

IV CONTENTS
ILLUSTRATIONS
[Plates in pocket] PLATE 1. Geologic map of Shasta Valley, Calif., showing location of
wells and springs.2. Map of Shasta Valley, Calif., showing location of wells and
water-level contours, spring 1954.Page
FIGURE 1. Map of Siskiyou County, Calif., showing location of valleysinvestigated for Upper Klamath project.________________ 4
2. Annual discharge of Shasta River near Yreka and precipita tion at Yreka_ _______________________________________ 12
3. Geologic section A-A' across Shasta Valley________________ 194. Tuff-breccia in the volcanic rocks of the western Cascades on
the southwest side of Sheep Rock_____________________ 345. Owls Head, a jointed rhyolitic lava dome in the volcanic rocks
of the western Cascades.______________________________ 356. Mount Shasta, looking southeast from vicinity of Montague;
low hillock in foreground underlain by volcanic rocks of western Cascades; and older alluvium in middle distance-- 40
7. Collapsed lava tube in Plutos Cave basalt near Pluto Cave__ 418. Diagrammatic sections B-B' and C-C" across Shasta Valley
illustrating geologic structure._________________________ 519. Hydrographs of wells 44/5-34C1, 45/5-28D1, and 44/6-20Al_ _ 60
10. Hydrographs of wells 43/6-21J1 and 43/6-21J2, ____________ 6111. Cation relationships of Shasta River water at five sampling
localities in Shasta Valley-__________________--__-----_ 7212. Graphical presentation of analyses of selected samples of
ground water in Shasta Valley..________________________ 78

CONTENTS
TABLES
PageTABLE 1. Measured discharge in acre-feet, of Shasta and Little Shasta
Rivers and Parks Creek at gaging stations near the entrance to Shasta Valley______ _____--_______________________ 10
2. Annual precipitation, in inches, at Yreka, Montague, andEdgewood, Calif____________________________________ 13
3. Average monthly precipitation at Yreka, Calif., 1872-1954-- 154. Average monthly temperature at Yreka, Calif., 1903-55____- 155. Summary of yield characteristics of wells tapping the volcanic
rocks of the western Cascades in Shasta Valley___________ 366. Summary of yield characteristics of wells tapping Plutos
Cave basalt in Shasta Valley__________________________ 427. Summary of yield characteristics of wells tapping morainal
and fluvioglacial deposits in Shasta Valley_______________ 458. Summary of yield characteristics of wells tapping the younger
alluvium in Shasta Valley.______________-_-__--_--_-__ 499. Flow at Cold Spring from January to May 1954____________ 58
10. Gaged and estimated surface-water inflow to Shasta Valley inthe year ending September 30, 1953___________--___-_-_ 64
11. Principal water-service agencies in Shasta Valley in 1953____ 6612. Chemical features of water draining the serpentine___ _______ 7113. Chemical features of water draining known limestone beds___ 7314. Chemical features of water draining the Chico formation.- __ 7415. Chemical features of water from springs near Table Rock and
well 46/5-8P2..._-____-_-_----_--_---_--_------------ 7516. Chemical features of water from the Umpqua formation..--- 7517. Chemical features of water from wells tapping the Plutos
Cave basalt__________________________--_----_---_-- 7618. Chemical features of water from wells tapping the volcanic
rocks of the western Cascades..___-___________--__----_ 7719. Description of water wells______-___-___-----___--_------ 7920. Weekly water-level measurements-_______________________ 8721. Selected drillers' logs of wells in Shasta Valley.________-_-- 9522. Chemical analyses of ground water.___________--_____-_-- 10023. Chemical analyses of surface water. ___-_-_--------_---_-- 108

GEOLOGY AND GROUND-WATER FEATURES OF SHASTA VALLEY, SISKIYOU COUNTY, CALIFORNIA
By SEYMOUR MACK
ABSTRACT
Shasta Valley is in the central part of Siskiyou County, Calif., and about 12 miles south of the Oregon border. It lies between the Klamath Mountains on the west and the Cascade Range 011 the east. The valley has an area of about 250 square miles; the north-south length is about 30 miles and the maxi mum width is about 15 miles. The average precipitation from July 1 to June 30 at Yreka and Montague is about 17 and 12 inches, respectively, and the av erage annual temperature at Yreka is 51.5°F. The area has a population of about 12,000, most of whom are employed in farming, cattle raising, and lum bering. The farm income is derived chiefly from livestock, principally beef cattle, hogs, and sheep. Alfalfa, wheat, barley, oats, and rye are the main crops grown in the valley.
The Klamath Mountains are underlain by metamorphic and sedimentary rocks of Paleozoic age and by intrusive rocks of Mesozoic age that form the basement complex. Near Yreka the Chico formation of Late Cretaceous age, which is composed of shale, sandstone, and some conglomerate, overlies the older rocks with profound unconformity. The Chico formation in turn is overlain disconformably by the Umpqua formation of Eocene age, which con sists mainly of black shale. These rocks are covered by a thin veneer of older alluvium which floors much of the northern part of the valley.
Volcanic rocks make up much of the valley floor from Montague southward to Edgewood. The southeastern, flatter part of the valley is occupied by the Plutos Cave basalt, which is a relatively large single flow erupted from the northeast flank of Mount Shasta within the last few thousand years. The western half of the valley floor is occupied largely by the older volcanic rocks of the western Cascades, which range in age from Eocene to Miocene and which have been eroded into hillocks that range in height from a few feet to as much as 300 feet. Between these hillocks lie many small ponds and marshes and the alluvial flats formed by slow, winding streams.
The valley is drained principally by the Shasta River and Parks Creek, which rise in the Klamath Mountains, and the Little Shasta River, which rises in the high Cascades. The volcanic rocks of the high Cascades were built by eruptions that commenced at the close of the Miocene epoch and con tinued intermittently to Recent time. Mount Shasta was built mainly during the Pleistocene epoch.
Morainal and fluvioglacial deposits, which are concentrated at the south end of the valley, were formed mainly during Pleistocene time by glaciers that descended the northwest flanks of Mount Shasta. Glaciers still remain

2 GEOLOGY AND GROUND WATER, SHASTA VALLEY, CALIF.
on Mount Shasta and have supplied fluvioglacial debris to the valley during Recent time.
The Plutos Cave basalt constitutes the principal aquifer in the valley, yielding abundant water for irrigation, stock, and domestic wells in the vicinity of Big Springs. Yields of irrigation wells in the basalt average about 1,300 gpm (gallons per minute). The andesitic lavas of the western Cascades supply sufficient water for domestic and stock uses. Yields of wells tapping the andesites vary greatly because of rapid changes in lateral and vertical permeability. Abundant water for irrigation is yielded from fractures in the volcanic rocks of the western Cascades in the Gazelle-Grenada area.
The basement complex and the Chico and Umpqua formations are tapped by relatively few wells in the area, although locally these wells seem to yield sufficient water for domestic and stock uses. The basement complex yields water from joints, faults, shear zones, and openings along foliation planes.
The morainal and fluvioglacial deposits generally yield sufficient water for domestic and stock uses. Several irrigation wells tapping glacial materials east of Edgewood yield 600 to 1,500 gpm. The younger and older alluviums of Recent and Pleistocene age yield water sufficient for domestic and stock uses. Along the west side of the valley the younger alluvium yields sufficient water for irrigation and supplies Yreka with abundant water for municipal uses.
Ground water moves generally northward in the southern part of Shasta Valley and troughward from the east and west, converging toward the Shasta River along the valley axis. At the north end of the valley an eastward- trending divide separates the ground water that moves north to Willow Creek from ground water that moves south to the Shasta River.
Recharge to ground water is effected by deep infiltration of precipitation that falls on the tributary drainage area, principally the western slopes of Mount Shasta, and by seepage from streams. The mean annual precipitation on the valley floor of 12-15 inches probably is not sufficient to contribute much re charge to ground water, but during years of above-average precipitation some deep penetration probably occurs. Recharge from irrigation water in 1953 was about 15,000 acre-feet from a total surface-water diversion of 58,000 acre-feet, and recharge from ground water pumped for irrigation was about 2,000 acre-feet.
Ground-water discharge in Shasta Valley occurs principally by seepage into streams, which is estimated crudely to have been 70,000 acre-feet in 1953. Big Springs has an annual discharge of about 30,000 acre-feet. Evapotranspiration from subirrigated crops is estimated to have been 28,000 acre-feet in 1953. Pumpage for all uses in 1953 was approximately 6,000 acre-feet, and net draft was about 4,000 acre-feet. Ground-water discharge in 1953 by all these princi pal means was about 130,000 acre-feet. In addition, there was minor discharge from flowing wells, unestimated discharge from small springs on the valley floor, and evapotranspiration losses from relatively small areas of phreatophytes.
Because of the relatively small pumpage in the valley, water levels in wells show declines of only 5-10 feet during the summer and autumn. So far as is known, the levels each winter and spring recover nearly completely, and as of 1953 there had been no indication of a long-term decline of water levels in the valley.
Surface water and ground water are generally low in dissolved mineral content and with few exceptions meet minimum standards for irrigation and domestic use. A close correlation exists between the composition of the various rock types in the area and the mineralization of surface and ground waters in areas adjacent to each rock type.

GEOLOGY AND GROUND WATER, SHASTA VALLEY, CALIF. 3
INTRODUCTION
PURPOSE AND SCOPE OP THE INVESTIGATION
In June 1953 the United States Geological Survey undertook a reconnaissance investigation of the geology and ground water of Shasta Valley, Siskiyou County, Calif., as part of a cooperative pro gram with the California Division of Water Resources (now Cali fornia Department of Water Resources). The investigation and report were to include the following elements: The extent and thick ness of the water-bearing rocks, the physical character and hydro- logic properties of the rocks, the occurrence and movement of ground water, the chemical character of ground water and its relation to occurrence, movement, and use, and an estimate of the ground-water storage capacity of the rocks insofar as practicable. The last ele ment estimating the ground-water storage capacity was aban doned, finally, because of the difficulty in assigning rational values to the specific yield of the volcanic rocks that underlie much of Shasta Valley. All the other elements of the investigation are dis cussed in the present report. In addition the report contains records of water wells, chemical analyses, water-level fluctuations, and drillers' logs of wells.
This study was started under the general supervision of J. F. Poland and was completed under the supervision of his successor, G. F. Worts, Jr., district geologist of the Ground Water Branch of the Geological Survey in charge of ground-water investigations in California; and under the direct supervision of A. R. Leonard, geologist. P. R. Wood, geologist, inventoried the springs and made periodic water-level measurements in wells in Shasta Valley.
LOCATION OP THE AREA
Shasta Valley, which is in the central part of Siskiyou County, lies between the Klamath Mountains 011 the west and the Cascade Range on the east. The valley area investigated has a north-south length of about 30 miles, a maximum width of about 15 miles, and an area of about 250 square miles. The area mapped lies between long 122°15' and 122°40' W., and lat 41°25' and 41°55' N. and is included within the Yreka, Macdoel, Etna, and Dunsmuir topo graphic quadrangle maps of the Geological Survey (scale 1:125,000). Figure 1 shows the location of Shasta Valley and other areas in the upper Klamath River basin of California for which reconnais sance ground-water investigations have been made by the Geological Survey. Plate 1 shows the geology of Shasta Valley and the loca tion of wells and springs.

FIG
UR
E 1. M
ap
of
Sis
kiyo
u C
ount
y,
Cal
if.,
show
ing
loca
tion
of
va
lley
s in
ves
tig
ated
fo
r U
pper
K
lam
ath
pro
ject
.

INTRODUCTION 5
METHODS OF INVESTIGATION
During the summer and autumn of 1954, the writer spent about 3 months in the field inventorying wells, mapping the geology, and studying the ground-water hydrology of Shasta Valley. Water-level measurements were made in the spring and autumn of 1953 and the spring of 1954 by the Geological Survey and the California Division of Water Eesources. The land-surface altitude at each well was determined by interpolation between 5-foot contours on topographic maps of Shasta Valley, scale 1:24,000, prepared in 1922 by the Geo logical Survey in cooperation with the U.S. Bureau of Reclamation and the State of California. General information regarding the character and thickness of the water-bearing materials and yields of wells was obtained from drillers' logs and from the well owners in the area.
Geologic boundaries were mapped on aerial photographs at a scale of 1:47,000, and later were transferred to the base map at a scale of 1:62,500, which had the Yreka, Macdoel, Etna, and Duns- muir quadrangles. Wells were located by measuring distances with an odometer from section corners, section lines, and roads.
Howel Williams (1949) mapped the geology of the eastern part of the valley which composes approximately 65 percent of the area shown on plate 1. The writer mapped the remainder of the valley for the present report, namely the area west of Montague and south of Gazelle.
PREVIOUS INVESTIGATIONS
In an early report, Waring (1915) described several springs along the east side of Shasta Valley, and in 1923 Watson, Wank, and Smith mapped the soils in the valley. Averill (1931, 1935) and O'Brien (1947) described the mineral resources of the area. Averill's 1931 report was accompanied by a geologic map (scale 1:250,000) of the Shasta quadrangle, prepared by the Geological Department of the Southern Pacific Company. The geology of the valley floor was not mapped, and only the broader geologic features along the west side of Shasta Valley are sho\vn on the map.
Hinds (1931,1932,1933) described the stratigraphy of the southern Klamath Mountains, much of which is especially pertinent to the pre-Cretaceous rocks along the west side of the valley. Heyl and Walker (1949) described the geology of a limestone deposit near Gazelle. Callaghan (1933) and Callaghan and Buddington (1938) described the volcanic sequence in the Cascade Range in Oregon, which is similar to that found in the Shasta Valley area.

6 GEOLOGY AND GROUND WATER, SHASTA VALLEY, CALIF.
In a report on the Macdoel quadrangle, Williams (1949) described the geology of the eastern part of Shasta Valley and the surrounding high Cascades volcanoes. Williams mapped and established many of the geologic units discussed in the present report, and a large part of the geologic map (pi. 1) is based on Williams' map. Circular soil structures in the fluvioglacial deposits at the south end of the valley were described by Masson (1949).
ACKNOWLEDGMENTS
Acknowledgment is made to the residents of Shasta Valley who assisted in the collection of field data used in this report and sup plied hydrologic data concerning their wells. Messrs. E. B. Bond, S. T. Pyle, B. H. Hoffmaster, B. T. Bower, E. E. Franson, and H. J. Peters of the California Division of Water Eesources supplied various hydrologic data used by the writer and canvassed about 80 percent of the wells shown in table 19. Messrs. Don Enloe and E. C. Maples, well drillers, furnished logs and hydrologic data on wells drilled in Shasta Valley. Mr. John M. Nichols of the Montague Soil Conservation District and Mr. C. B. Kay of Montague furnished valuable information concerning the local geology and hydrology.
WELL-NUMBERING SYSTEM
The well-numbering system used by the Geological Survey in California since 1940 shows the location of wells and springs accord ing to the rectangular system for the subdivision of public land. For well 45/7-35B1, the part of the number preceding the hyphen indicates the township and range (T. 45 N., E. Y W.); the digits between the hyphen and the letter indicate the section (sec. 35), and the letter indicates the 40-acre subdivision of the section as shown in the accompanying diagram.
D
E
M
N
C
F
L
P
B
G
K
Q
A
H
J
R

GEOGRAPHY /
Within each 40-acre tract the wells and springs are numbered serially, as indicated by the final digit of the number, thus, well 45/7-36D2 is the second well to be listed in the NW^NW^ sec. 36. Because all the area in Shasta Valley is north and west of the Mount Diablo baseline and meridian, the foregoing abbreviations of the township and range are sufficient.
Incomplete numbers which lack the final digit, such as 45/6-4P, indicate locations of sampling points or rock outcrops described in the text that are approximate to the 40-acre tract indicated by the letters.
GEOGRAPHY
TOPOGRAPHY AND DRAINAGE
Shasta Valley is a nearly oval intermontane basin. The valley floor lies between altitudes of 2,400 and 2,800 feet and slopes gen erally northward. West of the valley the Klamath Mountains are underlain, in the area studied, by metamorphic and sedimentary rocks of Paleozoic age and intrusive rocks of Mesozoic age. Many of the higher peaks are snow covered in early summer. The highest peak, Mount Eddy (not shown on fig. 1), about 9 miles southwest of Weed, attains an altitude of 9,038 feet.
The western part of Shasta Valley is underlain (pi. 1) chiefly by Quaternary alluvium deposited by the Shasta River and its tribu taries, and by volcanic rocks of Eocene, Oligocene, and Miocene age characteristic of the western Cascades (Callaghan and Buddington, 1938, p. 6). Williams (1949, p. 11) described the topography de veloped on the volcanic rocks as follows:
The western half [of the valley] consists of older volcanic rocks eroded into a myriad of hillocks that range from a few feet to 200 and rarely to 300 feet in height. Most, of these hillocks are domical, some are conical, others are mesas, and a few are long, hogback ridges. Together they form a strange landscape, deceptively like the products of recent volcanic activity.
The eastern half of the valley, which is much flatter than the western part, is occupied largely by an extensive flow of basaltic lava relatively recently erupted from the flanks of Mount Shasta. This flow, named by Williams (1949) the Plutos Cave basalt, covers more than 50 square miles and is featured topographically by caves or lava tubes, schollendomes (oval mounds formed by hydrostatic pressure of liquid lava under the congealed crust), pressure ridges along the margins, and collapse depressions in the lower part of the flow. Despite these irregularities, the surface of the Plutos Cave basalt is fairly uniform when viewed from a distance. The slope of the surface of the flow is about 5° near the area of eruption on

8 GEOLOGY AND GROUND WATER, SHASTA VALLEY, CALIF.
the flanks of Mount Shasta and to nearly horizontal in the heart of Shasta Valley.
On the east, Shasta Valley is bounded by the Cascade Kange, a broad northward-trending series of giant volcanoes ranging in age from Pliocene to Recent. The volcanoes of Pliocene age are deeply eroded, whereas the more youthful volcanoes, which were formed by effusions during Pleistocene and Recent time, have been only slightly dissected. The most prominent volcano of the high Cas cades (Callaghan and Buddington, 1938, p. 6) is Mount Shasta, which rises to an altitude of 14,162 feet at the south end of the valley. Its peak, snow-covered the year round, is the most conspicuous fea ture of the landscape and can be seen from all parts of the valley. Several glaciers lie on its upper slopes. On its north slope Whitney, Bolam, and Hotlum Glaciers descend to altitudes of about 10,000 feet. On the south slope the Koiiwakiton Glacier descends to an altitude of 12,000 feet, and the Clear Creek and Winton Glaciers to about 11,000 feet.
During the Pleistocene epoch, glaciers that descended the north west slopes of Mount Shasta spread into Shasta Valley to an altitude of about 2,800 feet. The record of this glaciation is preserved in the southern part of the valley in the form of morainal hills and ridges, remarkably similar in appearance to the erosional remnants of the volcanic rocks of the western Cascades and in bouldery outwash deposits that extend from the shores of Dwinnel Reservoir south ward to Weed. Fluvioglacial materials derived from the Whitney, Bolam, and Hotlum Glaciers are still being deposited on the lower northwest flank of Mount Shasta as broad fans which are spreading over the edges of the Plutos Cave basalt.
The northern part of Shasta Valley is underlain by a wide belt of older alluvium deposited for the most part as fans upon the eroded surface of sandstone of Late Cretaceous age (Chico forma tion), sandstone and shale of Eocene age (Unipqua formation), and the volcanic rocks of the western Cascades. The landscape in this part of the valley is gently rolling, particularly in the area west of Montague where only a thin veneer of alluvium rests on the Chico formation.
The drainage basin of the Shasta River and its tributary streams has an area of about 800 square miles. The floor of Shasta Valley occupies about 250 square miles of this area and contributes little runoff in years of average or below-average precipitation. Local runoff in the valley may flow into depressions and then percolate into the ground .without reaching the main surface streams, but the volume probably is small. Most of the runoff occurs along that part

GEOGRAPHY 9
of the west side of the valley adjacent to the Klamath Mountains. By contrast, most of the east-side streams that cross the lava flows of the high Cascades normally do not maintain a flow as far west as Shasta Valley, owing to the porous nature of the lava. The major streams that drain the area are the Shasta River, Parks Creek, and the Little Shasta River. The Shasta River and Parks Creek rise in the mountains southwest of Shasta Valley in an area that has an annual precipitation of 40-50 inches. Because of the heavy precipitation, the steep mountainous slopes, and the relatively impermeable nature of the serpentine bedrock in its drainage system, the Shasta River has the highest runoff rate of any stream entering the valley. Discharges of 58,400 acre-feet in 1952-53 and 53,100 acre-feet in 1953-54 were recorded at the gaging station near Edgewood.
About 4 miles downstream from Edgewood, the Shasta River enters Dwinnel Reservoir, and then flows through the hillocks and knolls of lava of the western Cascades for several miles to its junction with Parks Creek about 2 miles southwest of Big Springs. From this point the Shasta River is a sluggish stream trending northwestward through the Grenada and Montague areas until it leaves the valley about 5 miles northwest of the town of Montague. At the valley outlet the river becomes a vigorous downcutting stream and tumbles through a narrow, rocky gorge carved in resistant, strongly jointed greenstone through which it descends to join the Klamath River at a point immediately northwest of the area shown on plate 1. The Little Shasta River, which rises in the high Cas cades between Goosenest and Willow Creek Mountain (east of the area shown on pi. 1), flows sluggishly westward across the north- central part of Shasta Valley for approximately 9 miles to join the Shasta River about 2 miles south of Montague. Table 1 lists the measured discharge for the water years 1953 and 1954 of the Shasta and Little Shasta Rivers and Parks Creek near the entrance to Shasta Valley at gaging stations maintained by the California Division of Water Resources. The water year covers the period October 1 to September 30, and each year is designated by only one calendar year; thus, 1953 is used rather 1952-53.
The Geological Survey has maintained a gaging station on the Shasta River downstream from the valley outlet about 6 miles north of Yreka, the station being designated in published reports as Shasta River near Yreka. Records are available for the years 1932-33 to 1940-41 and 1945-46 to 1952-53. The average annual discharge for the 17 years was 167 cfs (cubic feet per second), or

TA
BL
E 1
. M
easu
ted
disc
harg
e in
acr
e-fe
et,
of S
hast
a an
d L
ittl
e Sh
asta
Riv
ers
and
Par
ks C
reek
at
gagi
ng s
tati
ons
near
the
ent
ranc
e to
Sha
sta
Val
ley
[Dat
a fr
om C
alif
orni
a D
ivis
ion
of W
ater
Res
ourc
es]
Wat
er y
ear
Oct
ober
Nov
em
ber
Dec
em
ber
Janu
ary
Feb
ruar
yM
arch
Apr
ilM
ayJu
neJu
lyA
ugus
tSe
ptem
be
rT
otal
Shas
ta R
iver
at
Edg
ewoo
d
1952-53___---_____
1953-54___________
841
1,24
21,
644
6,914
6,12
14,
338
13, 40
06,869
4,85
48,
075
5, 127
6,807
6,853
7,36
38,
555
7,22
26,889
2, 251
3,04
134
449
5728
571
910
58, 391
53, 06
3
Par
ks C
reek
wes
t of
Yre
ka D
itch
1952-53_____._____
1953
- 54
_ __
____
____
408
i 380
1,500
600
1,03
14,056
1,069
1,751
1,853
1,386
2,370
2,99
34,
887
3,933
4,59
64,832
1,392
1,674
365
413
212
207
i 200
22, 025 ±
19, 883 ±
Lit
tle
Shas
ta R
iver
nea
r T
able
Roc
k
1952
-53
1953-54___________
i 400
455
280
963
419
1,308
2,22
580
41, 543
1,77
52,
517
2, 261
2,719
3,299
4,961
2,39
44, 179
1,047
1,349
507
659
401
539
337
21, 790 ±
15, 55
1
1 Est
imat
ed m
onth
ly r
unof
f ba
sed
on in
com
plet
e da
ta.
O I
GEOGRAPHY 11
about 120,900 acre-feet (Wells and others, 1956, p. 543). Figure 2 shows the annual discharge reported by the Geological Survey and the annual precipitation recorded by the U.S. Weather Bureau at Yreka. The plotted discharge figures are for the water year Oc tober 1 to September 30; the precipitation figures are for the clima- tological year July 1 to June 30. In general the two graphs show a rather close correlation. However, the ratio of stream discharge to precipitation does vary, as may be seen by comparing the records for the years 1937-38 and 1940-41. In 1937-38, precipitation of 26.5 inches resulted in runoff of 208,500 acre-feet; in 1940-41, pre cipitation was 6.22 inches less than the 1937-38 total, yet runoff was 210,600 acre-feet. Deviations such as these are caused mainly by variations in the storm-frequency pattern of rainfall, and partly by regulation of the flow of the Shasta Eiver at Dwinnel Reservoir at the south end of Shasta Valley. The flow of the stream is affected also by the many irrigation diversions upstream from the gaging station.
CLIMATE
The climate of Shasta Valley is of the Mediterranean type and is well suited to stock raising and grain growing, the principal agri cultural pursuits in the area. The growing season, from the last killing frost in the spring to the first killing frost in the autumn, averages about 130 days.
The annual rainfall cycle is common to most of the Pacific North west summer and autumn are dry, and precipitation occurs mainly during the winter and early spring. The wet season lasts from October to April, when temperatures are moderate to low. In Shasta Valley the temperature at times drops to zero, and some snow falls nearly every winter. During the summer, temperatures higher than 100°F are often recorded, but such hot periods generally are short. The mean annual temperature at Yreka is 51.5°F. During the wet season it averages about 41 °F and during the dry season, approximately 62°F. July, the hottest month, has an average temperature of 7l.5°F, and January, the coldest month, 33.6°F.
In general the amount of precipitation at any place and the pro portion of precipitation that falls as snow are related directly to the altitude. The upland regions of the Klamath Mountains and Cascade Range, which receive the heaviest snowfall and greatest total precipitation in the area, are covered by thick stands of ponderosa pine, Douglas fir, white fir, incense-cedar, and tamarack pine and scattered groves of aspen, maple, and oak. The eastern part of the Klamath Mountains receives 20-50 inches of precipita-
506344

12 GEOLOGY AND GROUND WATER, SHASTA VALLEY, CALIF.
LL. QQ
200
150
:,- 1°° cc
ui O
50
20
02 15
10
op oo oo oo oo oo o>j oo <* 10 10 r^
O^ ^D r~* CVJ OO ^" IO CO f^ 00 O^ ^D r~'^titttttttt 1?^oo<nOrHC\joo^:inigr-..oocriO
FIGURE 2. Annual discharge of Shasta River near Yreka and precipitation at Yreka.

GEOGRAPHY 13
tion annually, and the Cascade Range receives 30-70 inches (Cali fornia State Water Resources Board, 1951, pi. 3). Precipitation on the valley floor is much less than in the surrounding mountains. At Yreka, which is separated from Shasta Valley by the north eastward-trending ridge known locally as Butcher Hill, the mean annual (July 1 to June 30) precipitation for the 73 years, 1872- 1907, 1916-44, and 1947-54 was 17.49 inches. The extremes of an nual precipitation for the period of record are a low of 7.89 inches in 1923-24 and a high of 31.29 inches in 1903-04. At Montague, about 6 miles east of Yreka, the annual precipitation for the period 1889-1952 averaged 12.20 inches. Precipitation extremes there were 4.14 inches in 1897-98 and 24.19 inches in 1889-90. Near the south end of the valley at Edgewood the annual precipitation for the period 1888-89 to 1914-15 averaged 20.42 inches, and the extremes were 9.42 inches in 1898-99 and 36.34 inches in 1889-90.
U.S. Weather Bureau records of annual precipitation at Yreka, Montague, and Edgewood are summarized in table 2. Average monthly precipitation and temperature data for the station at Yreka are summarized in tables 3 and 4, respectively.
TABLE 2. Annual precipitation, in inches, at Yreka, Montague, and Edgewood,Calif.
[Data from publications of the, U.S. Weather Bureau]
Year ending June 30
1871-72_. _________________________1872-73-_--_-____-_--__-__----____1873-74________ ___________________1874-75______ _____________________1875-76___ ________________________1876-77________ ___________________1877-78___ ________________________1878-79___ ___________________ _ __1879- 80____ _____________________1880-81________________ ___________1881-82____ _______________________1882-83__. _______________________1883-84_____ ______________________1884-85_._____ ____________________1885-86____ _______________________1886-87__ ____ __ _ _1887-88_________________ __________1888-89_____________ ______________1889-90.. ____ _ ______1890-91____ _______________________1891-92__. ____________________ __1892-93-_---_-_-_-_-__. __________1893-94___. _______________________1894r-95.__ ---__________ ___________1895-96___ _______ _________..__..__1896-97.. _--_---___-___.___.______1897-98-_-_--________.____ _______1898-99.._. _______________________1899-1900.. ______________ ________1900-01_____________ __ .__.__- __
Yreka
142512.0412. 7710. 2022.0414.0218. 7313. 3217. 5720.4813.0812. 1616. 2019. 6818. 9519.0315. 7010. 4230. 4212.9214. 1216. 5330. 5019.7523. 2820. 8413.0512. 4118. 1123. 55
Montague
7. 3724. 199.875. 639. 26
17. 277.05
11. 0411. 42
4. 146. 31
11. 42
Edgewood
15.9036. 3413. 3511. 1124. 4618. 3221.8419. 8919. 1816. 76
9. 4219. 1016. 36

14 GEOLOGY AND GROUND WATER, SHASTA VALLEY, CALIF.
TABLE 2. Annual precipitation, in inches, at Yreka, Montague, and Edgewood,Calif. Continued
[Data from publications of the U.S. Weather Bureau]
Year ending June 30
1901-021902-031903-04____ _______________________1904-05 -_1905-06. __ __________________ __1906-07____ _______________________1907-081908-09.__ ________________________1909-101910-11___ _-------__-______ -----1911-12___ ________________________1912-13.. _____________________ ._-1913-14.. _________________________1914-15--_ ________________________1915-16 _ .1916-171917-18___ ________________________1918-19 ________________________1919-201920-21.-. ________________________1921-22.. _________________________1922-23 ______1923-241924-25___ ________________________1925-26___ -___-_--_____-____-__ ___1926-27-1927-28-.- _---_--__--_---_._- --__-1928-29______ _____________________1929-301930-31____ _______________________1931-32____ _______________________1932-33____ -____- _________________1933-34______ _____________________1934-35___----____ _________________1935-36___ ________________________1936-371937-381938-39 - -- -_-___--_____1939-40___ ________________________1940-41___ ________________________1941-421942-43__. _-_-_____-__--__-_______1943-44___ ________________________1944-45___ __--__--____--___--.____1945-461946-471947-48___.__ -__-_____--___-______1948-49 .__ _ _ _1949-501950-511951-52_____ ______________________1952-53____ _______________________1953-54______ _____________________
Average __
Yreka
19. 3416. 1231. 2920. 2822. 1025.54
17. 2912. 6711.0819. 63
9. 2521.9614. 6113.807.89
26. 2511.8327. 3815. 3911. 3314. 8813. 4615. 3213.7511.0714. 4419. 8113.8526. 5010. 1622. 2920. 2823. 6321. 8510. 89
11. 6118. 3115. 3014. 2124. 6024. 4224. 2320. 50
17. 49
Montague
21. 7112. 6813. 1715. 6012.05143710. 1113. 8914. 9713. 6919.0412. 9911.0311.07
7. 9314. 12
6. 8416. 16
9. 7611. 96
6. 7414. 15
9. 8020. 5112. 52
8. 9112. 16
7. 7811.04
7. 818. 22
10. 7412. 9010. 9618. 20
6. 3517. 9916. 2417. 1315.5110. 5514. 5811. 35
8. 8613. 4312. 16
9. 2514. 1216.36
12. 20
Edgewood
22.06
26. 7120. 7225. 4216. 4623. 9115. 4514. 8033. 5828. 71
20.42

GEOGRAPHY 15
TABLE 3. Average monthly precipitation at Yreka, Calif., 1872-1954 [Data from publications of the U.S. Weather Bureau]
Month
April .May _
Precipitation (inches)
3.062. 331. 651.03.99. 67
Month
July.. ____.___..__
November, __ __ ___December _
Precipitation(inches)
6. 35.28.47
1. 232. 383.04
_--..17. 49
TABLE 4. Average monthly temperature at Yreka, Calif., 1903-55 [Data from publications of the F.S. Weather Bureau]
Month
January __FebruaryMarch_April _ _May _ _ _June-
Temperatuie (°F)
33. 638. 443. 749. 256.263. 6
Month
July. _ _ __ ____ ______August _ _ .-_-___
November. _ _ _____
Temperature C°F)
71.570. 562.552. 441.635.0
_._51. 5
TRANSPORTATION
U.S. Highways 97 and 99 connect the Shasta Valley area with nearby cities in Oregon and northern California. Highway 97, linking Weed, Calif., with Klamath Falls, Oreg., crosses the valley on the east side, following the main line of the Southern Pacific Railroad; Highway 99, along the west side of the valley, links Weed with Yreka and with Medford, Oreg. A system of State and county roads branches from Highways 97 and 99 and provides access to points within the flat farming country of the valley. The Siskiyou County Airport at Montague provides air transportation via South west Airlines to many communities in Oregon and northern Cali fornia.
POPULATION
According to the 1950 census, Yreka, the county seat of Siskiyou County, had a population of 3,139, and Montague, a dairying and stockraising center east of Yreka, a population of 571. Weed, a large unincorporated town at the south end of Shasta Valley, is a logging and lumbering center whose estimated population is 4,000.

16 GEOLOGY AND GROUND WATER, SHASTA VALLEY, CALIF.
Edgewood, Gazelle, and Grenada are small unincorporated towns in the valley having a total population of about 400. The total urban and farm population in the Shasta Valley area in 1953 was estimated by the California Division of Water Resources (Horn and others, 1954, p. 28) to be about 12,000.
AGRICULTURE
Most of the farm income in Shasta Valley is derived from the sale of livestock, principally beef cattle, hogs, and sheep. Cattle are herded over large areas of mountainous rangeland in the summer, and many more are pastured on the poorer lands on the valley floor. Cattle that summer in the mountains usually are driven down into the valley in November and fed on alfalfa hay for about 3 months before marketing. Most of the cattle shipped from the valley are marketed in central California. The ranges and pasturelands un- suited to cattle are profitably devoted to sheep grazing. The dairy industry is developed around the towns of Montague, Grenada, and Edgewood.
Alfalfa, wheat, barley, oats, and rye are the most important crops grown in the valley. Small areas of wild grasses, timothy, and clover occupy the poorly drained parts of the valley in which the soils are underlain by liardpan and are not suited to growing alfalfa. Alfalfa is grown on the best soils of the valley where abundant water is available. Most of the alfalfa is used for livestock feed in the valley; only the surplus is baled and shipped. Onions, lettuce, radishes, squash, and melons are grown for local use.
MINERAL RESOURCES
Coal. Thin beds of lignite and subbituminous coal, which dip to the northeast at angles of 15° to 20°, are found in the Umpqua formation at several localities along the west side of the valley (Williams, 1949, p. 57). The principal workings are about 5 miles south of Ager and a few hundred feet west of the Ager-Montague road. The main coal seam averages about 2 feet in thickness and reaches a maximum thickness of 6 feet. The deposits were not being mined in 1954.
Copper and molybdenum. Small amounts of copper and molyb denum have been obtained from the Yellow Butte mine in the W1/^ sec. 25, T. 43 N., R. 4 W., on the northeast slope of Yellow Butte. Production came from highly fractured and mineralized shear zones in a body of coarse-grained hornblende-biotite quartz monzonite near the contact with siliceous schist and quartzite of the Abrams

GEOLOGY 17
mica schist. The incline shaft is caved and the old workings are inaccessible, but the dump shows specimens of white quartz con taining pyrite, chalcopyrite, and some molybdenite.
Construction materials. Most of the different types of rocks in the area are used locally for building stone, concrete aggregate, or road metal. Sandstone of Cretaceous age has been quarried for building stone from an outlier about 2 miles northeast of Yreka. The strongly jointed Plutos Cave basalt, owing to the ease with which it breaks into cuboidal blocks, is used extensively by ranchers in the construction of stone fences. Platy-jointed andesite from the western Cascade lavas is quarried on a large scale from a hillock in sec. 25, T. 45 N., R. 6 W., for use in road surfacing. Several other quarries in the andesite have been worked for road metal, but on a much smaller scale. Rhyolitic lava from Owls Head in sec. 16, T. 44 N., R. 5 W., and near Little Shasta River in sec. 36, T. 45 N., 11. 5 W., also has been used for road surfacing. Basaltic cinders are quarried for road metal from a cinder cone in sec. 26, 27, T. 43 N., R. 4 W., near Yellow Butte.
Sand and gravel of the Recent alluvium in Yreka Creek, north of the Yreka city limits, have been found well suited for concrete aggregate, road material, and general construction in the area. Near U.S. Highway 97 fluvioglacial deposits from a large fan built up by Whitney Creek have been worked on a small scale for local use on roads.
Gold. The original settlement of the area by white men dates from the discovery of gold in Trinity County in 1848. Many placer deposits were worked along the west side of Shasta Valley in those days, but in the 1850's, as ever increasing numbers of miners came into the area and as the available gold became scarce, some of the settlers turned to agriculture and started raising such staple com modities as corn, wheat, and beef for the growing population. In recent years, in addition to small-scale placer operations, gold has been recovered from quartz veins generally occurring in greenstone, and by dredging operations along Yreka Creek and other west-side streams. Gold mining came virtually to a halt with the advent of World War II and has not recovered since the end of the war, owing to the fixed price of gold and the rising cost of labor.
GEOLOGY
GENERAL CHARACTER AND AGE OF THE ROCKS
The rocks of the Shasta Valley area range in age from early Paleozoic to Recent. The oldest rocks are the Abrams mica schist of

18 GEOLOGY AND GROUND WATER, SHASTA VALLEY, CALIF.
early Paleozoic age and the Chanchelulla formation of Hinds (1931), which underlie the Klamath Mountains from the vicinity of Gazelle northward to Yreka. The Abrams mica schist makes up most of Yellow Butte, an elongate fault block at the foot of Mount Shasta. Meta-andesite, correlative with either the Copley greenstone of pre- Middle Devonian age or the Applegate group of Triassic(?) age, underlies the rugged hills known as Paradise Crags or Paradise Craggy in the area north of Yreka. The older rocks are intruded by serpentinized ultrabasic rocks and by granitic rocks of Late Jurassic or Early Cretaceous age. These rocks of pre-Late Cre taceous age were not differentiated on the geologic map (pi. 1) and are mapped together as "basement complex."
Near Yreka, at the western margin of Shasta Valley, marine sandstone and conglomerate of Late Cretaceous age, the Chico formation, overlie the older rocks with profound unconformity. The Chico in turn is overlain disconformably by the Umpqua forma tion of Eocene age, which consists mainly of shale, sandstone, and conglomerate, among which are a few thin beds of coal. Volcanic rocks make up much of the valley floor. The western half is underlain largely by volcanic rocks of the western Cascades which consist principally of lava and pyroclastic beds ranging in age from Eocene to Miocene. The high Cascades, which border Shasta Valley on the east, were built by volcanic eruptions that commenced at the close of the Miocene epoch and continued intermittently to Recent time. Mount Shasta was built mainly during the Pleistocene epoch. The Plutos Cave basalt, which covers an extensive area in the southeastern part of the Valley, was erupted during Recent time, probably no more than a few thousand years ago.
Morainal and fluvioglacial (outwash) deposits at the south end of the valley were laid down during the later part of the Pleistocene epoch by glaciers that descended the northwest flank of Mount Shasta. Alluvial fans of outwash, supplied by melt waters from the Whitney Glacier, are still accumulating. Older alluvium mantles much of the northern part of Shasta Valley in the vicinity of Montague, and although the deposits are now being dissected they are probably at least in part of Recent age. At the present time the Shasta River and its tributaries are alluviating their courses.
The various stratigraphic (geologic) units that were distinguished in this study, their general character, and their water-bearing prop erties are summarized as follows, and their areal distribution is shown on plate 1. Stratigraphic relations and structure are shown by the cross sections on figures 3 and 8.

$9=
24O
O' »
4
22O
O'
zooo
'
28
OO
'
26
OO
'
Z4O
O'
IJ_
J_5
Mile
s
Ver
tical
sca
le e
xagg
erat
ed 5
2.1
times
FIG
URE
3
. G
eolo
gic
se
ctio
n A
-A'
acro
ss
Sha
sta
Val
ley.

Geo
logi
c un
its
of S
hast
a V
alle
y,
Cal
ifor
nia
1Quaternary
Age
Rec
ent
Rec
ent
to
Ple
isto
cene
Geo
logi
c un
it o
n pi
. 1
You
nger
al
luvi
um
Plu
tos
Cav
e ba
salt
Old
er
allu
vium
Flu
viog
laci
al
and
mor
aina
l de
posi
ts
Thi
ckne
ss (
feet
)
0-14
0 ±
0-40
0 ±
0-90
±
0-30
0 ±
Gen
eral
cha
ract
er
Unc
onso
lida
ted
stre
am-c
hann
el,
floo
d-pl
ain,
an
d al
luvi
al-t
an
depo
sits
co
nsis
ting
of
lens
es o
f sa
nd,
grav
el,
and
som
e cl
ay.
Bla
ck v
esic
ular
oli
vine
-ric
h au
gite
ba
salt
.
Unc
onso
lida
ted
depo
sits
con
sist
ing
of p
oorl
y so
rted
bou
lder
s, g
rave
l, sa
nd,
and
clay
. C
onta
ins
a pe
rsis
tent
la
yer
of
hard
pan
abou
t 1
foot
thi
ck w
hich
co
m
mon
ly
is
foun
d 10
-16
inch
es
belo
w
land
su
rfac
e.
Und
erli
es
muc
h of
th
e no
rthe
rn
par
t of
th
e va
lley
in
th
e vi
cini
ty
of
Mon
tagu
e.
Unc
onso
lida
ted
mat
eria
ls r
angi
ng
in
size
fr
om
clay
to
bo
ulde
rs,
high
ly v
aria
ble
in p
erm
eabi
lity
fr
om p
lace
to
plac
e ac
cord
ing
to
the
prop
orti
on o
f fi
ne m
ater
ials
to
coa
rse.
Wat
er-b
eari
ng p
rope
rtie
s
Fai
rly
perm
eabl
e.
Yie
ld s
uffi
cien
t w
ater
for
dom
esti
c an
d st
ock
uses
an
d lo
call
y al
ong
the
wes
t si
de o
f th
e va
lley
fo
r ir
riga
tion
us
e.
Gra
vell
y de
posi
ts
near
Y
reka
C
reek
yie
ld
abu
nd
ant
wat
er f
or
mun
icip
al u
se t
o Y
reka
.
Con
stit
utes
the
pri
ncip
al a
quif
er i
n S
hast
a V
alle
y, y
ield
ing
abundan
t w
ater
to
ir
riga
tion
, st
ock,
an
d do
mes
tic
wel
ls i
n th
e vi
cini
ty o
f B
ig S
prin
gs.
The
am
ount
s fr
om
irri
gati
on
wel
ls
vary
co
nsid
er
ably
but
aver
age
abou
t 1,
300
gpm
.
Gen
eral
ly l
ess
perm
eabl
e th
an t
he
youn
ger
allu
vium
. Y
ield
s ar
e sm
all,
but
gene
rall
y ar
e su
ffic
ient
fo
r do
mes
tic
and
stoc
k us
es.
Wid
e di
ffer
ence
s in
pe
rmea
bili
ty
exis
t w
ithi
n re
lati
vely
sho
rt d
is
tanc
es.
Irri
gati
on w
ells
tap
ping
gl
acia
l de
posi
ts e
ast
of E
dgev
^ood
yi
eld
600-
1,50
0 gp
m.
bo o

>> cl G
fe 1
<§ >> a -u §3 H Cretaceo
us
Ple
isto
cene
Rec
ent
to
Pli
ocen
e
Mio
cene
to
E
ocen
e
Eoc
ene
Lat
e C
reta
ceou
s
Ter
race
de
posi
ts
Vol
cani
c ro
cks
of t
he
high
C
asca
des
Vol
cani
c ro
cks
of t
he
wes
tern
C
asca
des
Um
pqua
fo
rmat
ion
Chi
co
form
atio
n
0-50
±
15, 0
00 ±
800-
2, 0
00
Unc
onso
lida
ted;
gra
vel
and
sand
y cl
ay a
long
wes
t si
de o
f va
lley
.
Lav
a fl
ows,
co
nsis
ting
mai
nly
of
oliv
ine
basa
lt a
nd b
asal
tic
ande
- si
te.
Com
pose
d ch
iefl
y of
an
desi
tic
lava
s an
d py
rocl
asti
c ej
ecta
and
su
bord
inat
e fl
ows
of b
asal
t an
d da
cite
, be
ds o
f rh
yoli
te t
uff,
and
a
few
rhy
olit
e do
mes
.
Sed
imen
tary
be
ds
of
fres
h-w
ater
or
igin
, co
nsis
ting
mai
nly
of t
hin-
be
dded
bl
ack
shal
e an
d si
lty
shal
e,
alth
ough
sa
ndst
one
and
cong
lom
erat
e ar
e pr
esen
t.
Dom
inan
tly
wel
l be
dded
yel
low
to
gree
nish
-gra
y ar
kosi
c sa
ndst
one
and
gray
wac
ke.
In t
he
uppe
r
mos
t p
art
of t
he f
orm
atio
n, b
eds
of
blac
k sh
ale
alte
rnat
e w
ith
laye
rs o
f sa
ndst
one.
Uni
mpo
rtan
t hyd
rolo
gica
lly
beca
use
of r
ather
lim
ited
ext
ent
and^
posi
- ti
on
gene
rall
y ab
ove
the
wat
er
tabl
e.
Ver
y pe
rmea
ble;
im
po
rtan
t as
a
stor
age
rese
rvoi
r fo
r m
uch
of t
he
grou
nd
wat
er
that
ev
entu
ally
fi
nds
its
way
int
o S
hast
a V
alle
y.
Spr
ings
is
sue
near
co
ntac
t w
ith
unde
rlyi
ng v
olca
nic
rock
s of
the
w
este
rn C
asca
des.
Yie
lds
of w
ells
var
y gr
eatl
y be
caus
e of
rap
id c
hang
es i
n pe
rmea
bili
ty
both
la
tera
lly
and
vert
ical
ly.
Sup
ply
suff
icie
nt w
ater
for
dom
es
tic
and
stoc
k us
es.
Yie
ld a
bun
d
ant
wat
er
for
irri
gati
on
in
Gaz
elle
-Gre
nada
are
a.
Yie
ld
is
gene
rall
y sm
all.
Loc
ally
yi
eld
suff
icie
nt w
ater
for
dom
es
tic
and
stoc
k us
es.
Tap
ped
by o
nly
a fe
w w
ells
in
the
area
. Y
ield
s ar
e ge
nera
lly
smal
l. L
ocal
ly y
ield
s su
ffic
ient
wat
er f
or
dom
esti
c an
d st
ock
uses
.

Geo
logi
c un
its
of S
hast
a V
alle
y, C
ali
forn
ia C
onti
nued
§3 s'o TJ £ S3 CO 3 O OJ o S3 f» O) (4 O
Age
Pre
-Lat
eC
reta
ceou
s
Geo
logi
c un
it o
n pi
. 1
Bas
emen
tco
mpl
ex(i
nclu
des
Abr
ams
mic
asc
hist
,C
hanc
helu
lla
form
atio
n of
Hin
ds (
1931
)an
d ot
her
rock
s, u
ndif
-fe
rent
iate
d)
Thi
ckne
ss (
feet
)G
ener
al c
hara
cter
Com
pose
s th
e be
droc
k al
ong
the
wes
tern
par
t of
S
hast
a V
alle
y.C
onsi
sts
of
quar
tzit
ic
schi
st;
slig
htly
m
etam
orph
osed
sa
nd
ston
e,
shal
e,
and
lim
esto
ne;
met
avol
cani
c gr
eens
tone
; an
din
trus
ive
ultr
amaf
ic
and
gra
niti
c ro
cks.
Wat
er-b
eari
ng p
rope
rtie
s
Tap
ped
by o
nly
a fe
w w
ells
in
the
area
. Y
ield
s ar
e ge
nera
lly
smal
l,but
stru
ctura
l op
enin
gs
such
as
join
ts,
faul
ts,
shea
r zo
nes,
an
dop
enin
gs
alon
g fo
liat
ion
plan
eslo
call
y tr
ansm
it
suff
icie
nt
wat
erfo
r do
mes
tic
and
stoc
k us
es.
to
to o a o I H
S3 B I $ H

GEOLOGY 23
HYDROLOGrlC PROPERTIES OF AQUIFERS
The permeability of any rock is a measure of its capacity to trans mit water. Nearly all the rocks that immediately underlie the surface of the earth contain open spaces or interstices which range in size from the minute pores in clay to large lava tunnels such as those found in the Plutos Cave basalt, or great caverns in limestone such as Carlsbad Caverns. The porosity, or percentage of the total volume of the rock occupied by openings, is not necessarily a measure of the ease with which fluids may be transmitted through the rock. If the pore spaces or fractures are not interconnected or if the openings are very small, the rock may have a very low permeability even though the porosity is high. A formation sufficiently permeable to transmit water readily is termed an aquifer.
The permeability of an aquifer can be determined in the field by test pumping. When water is pumped from a well, the water table or piezometric surface develops a depression which has virtually the form of an inverted cone. The apex of the cone is at the water level in the pumped well, and the base is at the original water surface. The height of the cone is equal to the drawdown in the pumped well. The area affected by a pumped well (area of influence) is the land area that has the same horizontal extent as the part of the water surface that is lowered; it is controlled by several factors, one of which is the rate of pumping. The height and slope of the cone in a specific aquifer vary directly with the pumping rate of a well in that aquifer. A well in an aquifer of low permeability will have a larger drawdown than a well in a more permeable aquifer, if both wells are pumped at equal rates.
Specific capacity, a term used to indicate the productivity of a well, is defined as the amount of water in gpm (gallons per minute) that is yielded for each foot of drawdown in the pumped well. It gen erally is determined after the well has been pumped long enough to stabilize the drawdown. Specific capacities of different wells tapping the same deposit, however, are not necessarily comparable, largely because of differences in depth and in the methods of construction and development of the wells.
To obtain a rough measure of the permeability of the material yielding water to a well, a comparative index termed "yield factor" is sometimes used. As originally defined (Poland and others, 1945, p. 57), the yield factor is the specific capacity of the well divided by the thickness in feet of the aquifers yielding or assumed to yield water to the well, multiplied by 100. For the purposes of this report the yield factor is defined as the specific capacity divided by a figure taken to represent the total thickness of saturated material

24 GEOLOGY AND GROUND WATER, SHASTA VALLEY, CALIF.
tapped by the well (total depth of well minus the depth to water), multiplied by 100. For a well in which the casing is perforated throughout its length the yield factor, as determined here, affords an approximate measure of the average permeability of the saturated material penetrated by the well. For wells perforated only at selected intervals the yield factor is likely to be a conservative measure of the permeability of the water-producing beds.
In practice it has been found that a crude estimate of the permea bility of the deposits can be obtained by multiplying the yield factor by 15 (water-table conditions) or 20 (confined conditions). In several areas of California (Thomasson and others, 1959, p. 220-223) it has been found that under semiconfined conditions, multiplying the yield factor by 17 has given permeability estimates which com pare reasonably well with aquifer-test results.
GEOLOGIC UNITS AND THEIR WATER-BEARING PROPERTIES
ROCKS OF PRE-LATE CRETACEOUS AGE
Exposures of the basement complex (pi. 1) are limited to the Klamath Mountains, which border the west side of Shasta Valley, and to Yellow Butte, a narrow northward-trending horst at the northern base of Mount Shasta. No attempt was made to differenti ate the various formations of pre-Late Cretaceous age on the geologic map (pi. 1), because the aim of the study was concentrated upon those formations considered to be possible present or future sources of water supply. The basement rocks, however, were mapped and described in the Scott Valley area (Mack, 1955) and include, from oldest to youngest the Abrams mica schist, the Chanchelulla formation of Hinds "(1931), greenstone, serpentine, and granitic rocks.
The Abrams mica schist underlies much of the Klamath Mountains from Grenada northward to the vicinity of Paradise Craggy. Ex cept for beds of quartz-epidote-albite schist, which probably are metamorphosed basic tuff, the Abrams mica schist in the Shasta Valley area represents the accumulation of several thousand feet of argillaceous, arenaceous, and calcareous sediments that have under gone considerable recrystallization. Siliceous metasediments appear to compose most of the section throughout the area. Yellow Butte consists mainly of nearly vertical beds of dense bluish-white quartzite and metachert which strike dominantly north.
The Chanchelulla formation of Hinds (1931) forms the bedrock in the Klamath Mountains from the vicinity of Grenada south to Willow Creek. Near Grenada the rocks of the Chanchelulla forma tion are dominantly beds of gray quartzose sandstone which have

GEOLOGY 25
been cut by closely spaced quartz veinlets. Original thin argillaceous interbeds have been converted to slate and phyllite. Beds of blue- gray limestone are prominent in the formation east of Gazelle along Willow Creek.
Strongly jointed volcanic rocks, altered to greenstone and to a lesser extent greenstone schist, compose much of the bedrock along the northwestern part of Shasta Valley in the area immediately north of Yreka. The greenstone, which forms a belt more than 3 miles wide, underlies most of the rugged hills known as Paradise Craggy and is incised deeply by the precipitous gorge of the Shasta River where it crosses the mountains.
Serpentine, presumably of Jurassic age and presumably derived from the autometamorphism of peridotite, intrudes the older forma tions of the Klamath Mountains in the Willow Creek area and in the vicinity of Yreka. The southern mass extends from Willow Creek southward more than 30 miles and underlies much of the mountainous area between the Sacramento and Trinity Rivers. The northern body of serpentine is a tabular sill-like sheet several miles in width that extends from Yreka southwestward into Scott Valley. Smaller bodies of serpentine crop out along the edges of the alluvium in. Shasta Valley from Yreka to the vicinity of Paradise Craggy and may be apophyses from the main serpentine body.
Silicic intrusive rocks of Late Jurassic or Early Cretaceous age crop out at several isolated places in the Shasta Valley area. Along the east flank of Yellow Butte the siliceous beds of the Abrams mica schist are intruded by coarse-grained hornblende-biotite quartz mon- zonite and thin dikes of aplite. West of Gazelle along Willow Creek, Heyl and Walker (1949, p. 517) report small bodies of diorite and quartz diorite which intrude the folded beds of the Chanchelulla formation of Hinds (1931).
Water-bearing properties. The Upper-Cretaceous rocks are for the most part dense and crystalline and ordinarily would not be ex pected to yield water in amounts sufficient for irrigation in the Shasta Valley area. However, in almost all these rocks there are joints, faults, shear zones, and foliation openings which are capable of transmitting sufficient water for domestic and stock uses. In the Klamath Mountains such fractures feed the springs that supply water to streams entering Shasta Valley from the west.
Domestic well 45/6-3Q1, 120 feet deep and completed in the Abrams mica schist along the northwestern part of the valley, pene trated approximately 5 feet of sandstone of Late Cretaceous age and 115 feet of the Abrams mica schist. Approximately 20 gpm of water was obtained, mostly from the bottom 20 feet, which suggests that a zone of water-bearing fractures was found.

26 GEOLOGY AND GROUND WATER, SHASTA VALLEY, CALIF.
E. C. Maples, a well driller in Montague, reports that a well drilled near the west edge of Yreka penetrated 195 feet of serpen tine and, when tested, yielded only 8 gallons per hour. This very small yield, however, is an isolated case and may not be representa tive of the serpentine where it is strongly sheared.
CONSOLIDATED SEDIMENTARY ROCKS OF CRETACEOUS ANDEOCENE AGE
CHICO FOKMATION (UPPER CRETACEOUS)
General character. The basement complex is overlain with strong unconformity by marine Upper Cretaceous sedimentary rocks which form an arcuate, discontinuous series of outcrops along the western margin of Shasta Valley from 5 miles southeast of Yreka to the vicinity of Black Mountain in the northern part of the valley. The Cretaceous rocks extend eastward at depth beneath the younger sedimentary and volcanic rocks in Shasta Valley and perhaps be neath the Cascade Range.
The Upper Cretaceous rocks in Shasta Valley were correlated by Williams (1949, p. 16) with the Chico group of formation, one of the most extensive subdivisions of the Cretaceous of the Pacific Coast. The formation consists dominantly of well-bedded yellow to greenish- gray arkosic sandstone and graywacke firmly cemented with calcite and limonite. The weathered sandstone and the soil derived from it are characteristically deep brownish red. The basal part of the formation consists of conglomerate, containing poorly sorted, well- rounded pebbles. Higher in the formation, arkose and graywacke predominate, although beds of coarse conglomerate are common. In the uppermost part, beds of black shale alternate with sandstone. The basal conglomerate and the overlying sandstone reflect the mineralogy of the Jurassic and older bedrock in the area. Williams (1949, p. 16) states that north of Shasta Valley, where the basal conglomerate is crossed by the Klamath River, it is crowded with pebbles and cobbles of greenstone. In Shasta Valley the conglomerate contains abundant pebbles of milky quartz, quartzite, and chert derived from the siliceous beds of the Abrams mica schist.
Anderson noted two distinctive fossil horizons in the Upper Cretaceous rocks in the area (Averill, 1931, p. 10-14). From the lower zone below the middle of the sandstone, near U.S. Highway 99 west of Hornbrook, he reported numerous species of marine bi valves and gastropods, such as Trigonia evansana Meek, Chione varians Gabb, Glycymeris veatchi Gabb, and Cucullaea decurtata Gabb. From the upper zone, at the contact of the uppermost sandstone beds and the overlying shales, he collected a variety of cephalopods including Pachydiscus henleyensis Anderson, Barroisiceras knighteni

GEOLOGY 27
Anderson, Placenticeras pacificum Smith, and Placenticeras cdli- fomicum Anderson.
The Chico formation was deposited in a shallow sea that occupied the present sites of the southern part of the Cascade Eange and the flanks of the Klamath Mountains. The coarse clastic sediments, the large shallow-water fossils, and the rapid variation in lithology of beds in the Chico formation are indicative of nearshore marine deposition adjacent to a land mass of fairly rugged relief.
The beds of the Chico formation generally dip to the east and northeast at relatively flat angles. Dips are rarely more than 20°. However, Williams reports that on the flanks of Black Mountain the beds dip as much as 25° NE. Locally south of Delphic School in sec. 6, T. 44 N., K. 6 W., the beds dip 14° NW., 9° NE., and 4° SE., possibly reflecting the surface irregularity of the metachert on which they were deposited. Where the Chico formation occupies the higher lands adjacent to Shasta Valley, it holds little or no soil cover and hence is easily recognizable from a distance. On the valley floor the Chico formation is covered by a thin veneer of soil and crops out as ridges and mounts of very low relief which slope gently valleyward from their more conspicuous position at the valley margins.
On the flanks of Black Mountain the Chico formation is about 1,000 feet thick and is overlain disconformably by the Umpqua formation of Eocene age. At the valley margin west of Montague only several hundred feet of the lower part of the formation is ex posed. In the Medford quadrangle, Wells and others (1939) reports a maximum thickness of 600 feet for the two formations.
Water-bearing properties. The beds of the Chico formation are in most places firmly cemented and crop out within a rather re stricted area of the valley. Hence, they .are unfavorable in both character and position for recharge and are of minor importance as an aquifer in Shasta Valley. A few deep wells have been drilled into the formation, and the yields, although generally small, are sufficient for domestic uses.
Well 45/7-36D2, at the valley margin about 4 miles west of Montague, penetrated 307 feet of conglomerate and sandstone in the Chico formation and yielded 50 gallons per hour. Well 45/7-36D1, only a few hundred feet to the northwest, penetrated 290 feet of blue and yellow sandstone of the Chico and 105 feet of the Abrams mica schist and yielded no water. Approximately half a mile to the west, a domestic well in the Chico (45/7-35B1), 38 feet deep, yields about 10 gpm. The following log of unused well 45/7-24K1 is indicative
506344 O 60 3

28 GEOLOGY AND GROUND WATER, SHASTA VALLEY, CALIF.
of the lithology of the basal part of the Chico formation in the area west of Montague.
Drillers' log of well 45J7-24R1 l
Older alluvium of Recent and Pleistocene age:
Chico formation of Late Cretaceous age:
Black clay___. _ ___ _ _ ___________
Black mud ___ _ _ __ _ _ _ _ _ _.Basement complex of pre-Late Cretaceous age:
Thickness (feet)
40
405
157
10510
13
Deptli (feet)
40
8085
100107212222
235
1 Stratigraphy interpreted by Seymour Mack.
Salt water, probably of connate origin, accompanied by considera ble gas is yielded by artesian well 44/6-3D1, which taps the Chico formation about 2 miles south of Montague. The well was drilled near the Shasta Eiver during the latter part of the 19th century for F. J. King. The owner extracted salt from the water for table, stock, and dairy uses. An account of observations made during con struction of the well is given by Wells (1881, p. 193-194). The well was drilled to a depth of 450 feet and flowed about 100 gpm, the water rising in pipes to 30 feet above the surface. Artesian water was found at 4 horizons, at a depth of 107 feet from an 11-foot bed of quicksand and gravel and at depths of 357, 384, and 409 feet in sandstone of the Chico formation. Fossil shells of marine animals were found in the sandstone at depths of 285 and 317 feet. The log of the well follows:
Drillers' log of well 44/6-SDl »
Younger alluvium (Recent) : Soil with alkalL _ ________ _ __ __Clay and fine gravel, somewhat cementedBoulders, hard and difficult to drill through _ _ __
Umpqua(?) formation (Eocene) : Hard cemented clay ____ _ _____Quicksand and gravel _______
Chico formation (Upper Cretaceous) : Sand rock, marine fossils at 285 and 317 feet
Thickness (feet)
663
7
3111
332
Depth (feet)
66976
107118
450
Stratigraphy interpreted by Seymour Mack.
GEOLOGY 29
FOKMATION (EOCENE)
General character. Sedimentary rocks of fresh-water origin dis- conformably overlie the Chico formation in Shasta Valley and are probably correlative with the Umpqua formation, which underlies broad areas west of the Cascade Kange from the vicinity of Koseburg, Oreg., to northern California. Fossil flora in coal beds in the Umpqua formation near Ashland, Oreg., are reported to be Eocene in age (Diller, 1907, p. 405). Williams (1949, p. 19) believed that there is little doubt that fossil leaves in the Umpqua in Shasta Valley also are of Eocene age.
The Umpqua formation crops out in two widely separated areas in Shasta Valley. Along the northern part of the valley it forms a belt that ranges in width from half a mile on the west flank of Black Mountain to 3 miles in the vicinity of Willow School. Along the east edge of the valley near Pluto Cave, the Umpqua formation constitutes the bedrock in an area of about 1.5 square miles. In terpretation of drillers' logs of wells suggests that the Umpqua formation underlies older alluvium at shallow depth throughout much of the area from Montague northeast to Snowdon School.
Thin-bedded black shale and silty shale make up most of the formation, although beds of sandstone and conglomerate also are present. The sandstone is medium to coarse and rather weakly cemented with calcite and clay. Along the Ager-Montague Koad are many outcrops of massive sandstone which can be dug easily by hand. The sandstone ranges from white to light brown, but yellow brown is dominant. Soils overlying the sandstone are characteristically yellow brown, in contrast to the soils developed on the Chico formation which generally are brownish red. Miner- alogically, the sandstone of the Umpqua formation differs from that of the Chico formation in that it contains less feldspar and ferromagnesian minerals, such as hornblende and chlorite.
A few hundred feet west of the Ager-Montague Koad, near Snow don School, a bed of subbituminous coal, having a maximum thickness of 6 feet, lies about 300 feet stratigraphically above the base of the Umpqua formation. Above this the Umpqua formation consists of alternating sandstone, sandy shale, and shale. The following log of unused well 46/5-18L1 illustrates the lithology of the Umpqua in the upper part of the formation.

30 GEOLOGY AND GROUND WATER, SHASTA VALLEY, CALIF.
Drillers' log of unused well, 4^15 18L1 l
Umpqua formation (Eocene) :Soii_._- ___--______ ---_-___---- ----------------Sand. _-_ __ _ - Shale --- -
Shale ____._.________________ _______________________
Shale __.________._______________________--_-----_-__
Hard sand _ _
Black sandy shale _ _
Brown sand _
Thickness (feet)
22315
55
10101045253010102017
Depth (feet)
225404550607080
125150180190200220237
1 Stratigraphy interpreted by Seymour Mack.
The Umpqua formation in Shasta Valley has a maximum thick ness of about 2,000 feet and generally dips 15°-20° NE. It can be traced from the flanks of Black Mountain northward across the Klamath River to the Oregon-California border. Williams (1949, p. 19) reported that banded shale and silty shale predominate but that layers of tuffaceous material increase in number and thickness toward the Oregon-California boundary, particularly in the upper part of the formation. Near Hilt (north of area shown on pi. 1) a few lava flows appear in the uppermost part of the formation. The sandstone in the area shows strong crossbedding, and channel de posits of conglomerate as much as 15 feet in thickness occur within the sandstone beds.
In Shasta Valley the Umpqua formation appears to be wholly of fresh-water origin. Concerning its origin, Williams states (1949, p. 20) :
* * * the shales and silty shales composing the major part of the formation presumably represent deposits laid down on wide alluvial flats bordering slug gish streams that drained a country of low relief to the west * * *.
Water-bearing properties. The water supply of wells drilled in the Umpqua formation is generally small but appears to be sufficient locally for domestic uses. Drillers' logs indicate that in the lower part of the formation the ratio of sandstone to shale, silty shale, and "hard" sandstone is approximately 1:3. In the Ager area the alternation of eastward-dipping beds of sandstone and impermeable shale and silty shale sets up favorable conditions for the confinement of water under artesian pressure. Well 46/6-24L1, which is unused, has a small artesian flow for most of the year. During the late

GEOLOGY 31
summer and early autumn, when ground-water replenishment in the area is at a minimum, the flow of the well ceases and the water level drops 2-3 feet below the top of the casing. Well 46/6-24E1, a quarter of a mile to the north, yields 75 gpm with 70 feet of draw down, thus having a specific capacity of about 1 gpm per foot of drawdown.
East of the Ager-Montague Road and stratigraphically higher in the formation, the percentage of shale gradually increases. Hence, it would appear that the shale should yield less water in this direction. However, irrigation well 46/6-24E1, nearly 1 mile east of the road, yields 400 gpm with a drawdown of 65 feet. The specific capacity, therefore, is 6 gpm per foot of drawdown. An extensive fracture system associated with a major fault less than 1 mile east (pi. 1) of the well may account for the relatively large supply of water.
Drillers' logs indicate that in the vicinity of Montague the Umpqua formation is relatively shallow. The log of well 45/6-23E1, which is about half a mile northeast of Montague, records black shale from 30 to 120 feet below the land surface. Well 45/6-14P1, about half a mile farther north, penetrates sticky black clay from a depth of 34 feet to the bottom of the well at 40 feet. According to local residents, the old Montague city wells, which were drilled to depths of 900- 1,000 feet, penetrated mostly blue mud. Some water was obtained from a depth of 600 feet but was insufficient for municipal supply. In a later attempt to obtain water a tunnel was driven at shallow depth to connect the wells with Oregon Slough, but the supply developed by this project also was inadequate. Present municipal supplies are obtained by ditch from Dwinnel Reservoir in summer and from the Little Shasta River in winter.
VOLCANIC ROCKS OF TERTIARY AND QUATERNARY AGE
VOLCANIC ROCKS OF THE WESTERN CASCADES (EOCENE TO MIOCENE)
General character. From Mount Hood in northern Oregon to Mount Shasta the Cascade Range has been divided longitudinally into two physiographic subprovinces the high Cascades and the western Cascades (Callaghan and Buddington, 1938, p. 6). The western Cascades are underlain by a belt of Tertiary lava and pyro- clastic rocks which border the western flank of the towering, youthful volcanic cones of the high Cascades. The lava of the western Cas cades probably issued from a north-south series of cones and fissures close to or coincident with the present position of the volcanoes of the high Cascades. In Jackson County, Oreg., flora ranging in age from late Eocene to middle Miocene were identified from the rocks

32 GEOLOGY AND GROUND WATER, SHASTA VALLEY, CALIF.
of the western Cascades (Callaghan and Buddington, 1938, p. 8). In the northern part of Shasta Valley the volcanic rocks of the western Cascades overlie unconformably the Umpqua formation of Eocene age, and along the eastern margin of the valley they are in turn overlain unconformably by the Pliocene and younger lava of the high Cascades.
The rocks of the western Cascades are chiefly andesitic lavas and pyroclastic ejecta and subordinate flows of basalt and dacite, beds of rhyolite tuff, and a few rhyolite domes. They underlie much of the western part of Shasta Valley from the vicinity of Edgewood to Montague. From Montague northward they constitute the bedrock along the eastern margin of the valley. The lava and fragment al ejecta dip about 15° E. and northeast, The maximum exposed thickness in Shasta Valley is about 15,000 feet, although nowhere are the beds exposed to their full thickness because of overlap by the younger lava of the high Cascades.
The topography developed 011 the belt of rocks of the western Cascades in Shasta Valley is entirely erosional, consisting of a myriad of hillocks that range in height from a few feet to as much as 300 feet. Most of the hillocks are symmetrical, but some are quite irregular. They form a strange landscape which at first glance suggests that very recent volcanism has taken place from hundreds of scattered centers of eruption. Their origin has been ascribed to such activity in previous reports. Diller and others (1915, p. 61) mentioned the valley briefly and said:
Scattered over Shasta Valley are many small knolls of lava and tuff, which appear to be, in part at least, the products of minor and local eruptions that broke through the Cretaceous beds, each vent contributing its little pile of material. Such feeble and diffuse volcanic activity is in marked contrast with the vigorous outbursts that built up the great cone of Shasta.
Fenner (1923, p. 49), upon fleeting observation of Shasta Valley, believed that the hillocks might have originated in much the same manner as the great tuff deposit in the Valley of the Ten Thousand Smokes in Alaska, which may have been formed by the intrusion at shallow depth of a sill composed of highly gaseous acid magma. The strata overlying the sill, being extremely thin, were fractured extensively by the force of the intrusion, thus allowing the magma to reach the surface from many centers of eruption. Fenner (1923, p. 49) made the following comparison between the two areas:
The form of intrusion suggested here (Valley of the Ten Thousand Smokes) is one- that would occur only under special conditions, and its surface ex pression would not survive for a long period, but I have seen one region where the same sort of process is indicated. This is in Shasta Valley, Cali fornia, and does not seem to have been studied in detail. * * * The fact that

GEOLOGY 33
the extruded lava built up cones here (Shasta Valley), while in the Katmai region it formed a great sandflow, would appear to be due to the basic composi tion and relatively gas-free condition of one and the siliceous composition and highly gas-charged condition of the other * * *.
There can be little doubt, however, that the exceptional topography developed on the rocks of the western Cascades is of erosional origin as described by Williams (1949, p. 11) and not due to the processes suggested by Diller and Fenner. This conclusion is supported by the consistent eastward dip of the lava in the hillocks by the paucity of volcanic necks in the area, and by what appears to have been a singular absence of fumarolic or solfataric activity in the vicinity of the hillocks.
Hypersthene-augite andesite makes up the greatest proportion of the lava flows in the rocks of the western Cascades in Shasta Valley. Several flows of hydrothermally altered dacite occur near the base of the unit in the hills south of Ager. Basalt flows are found north of Shasta Valley in the vicinity of Willow Creek. Williams (1949, p. 21) distinguished two types of andesite, one a pale-gray pilotaxitic variety rich in large phenocrysts of basic plagioclase and pyroxene, the other a much finer grained dark-gray to black variety having fewer phenocrysts in a glassy matrix. In Oregon, Callaghan and Buddington (1938, p. 9) also reported the occurrence of two varieties of andesite in the rocks of the western Cascades and noted that in the vicinity of the Rogue River the gray andesitic lava appears to interfinger with the black, but farther north the gray appears to be stratigraphically higher than the black. In Shasta Valley the black lava is localized in a narrow belt along the western part of the valley, and because of the prevailing eastward dip of the beds, it probably occupies a lower stratigraphic position than the gray lava.
The andesite generally is only slightly vesicular and is cut either by widely spaced joints (blocky jointing) or by closely spaced joints (platy jointing). Blocky jointing is more common in the black andesite, platy jointing in the gray andesite. A notable oc currence of the platy jointing is in a quarry south of Montague at locality 44/6-33H. The andesite is graj and contains abundant phenocrysts of calcic plagioclase, hypersthene, and augite averaging about 3 millimeters in length. Hypersthene and augite phenocrysts are much less abundant than the plagioclase, making up only about 5 percent of the total phenocrysts. The lava is highly fractured, the fracture planes being spaced about half an inch apart, Near the base of the quarry the joints are nearly vertical, but they curve gently and near the top of the quarry wall dip about 70° NE. Similar platy cleavage in the gray andesite was observed in a quarry at locality 45/6-25D near the Montague-Little Shasta road. The andesite, by

34 GEOLOGY AND GROUND WATER, SHASTA VALLEY, CALIF.
virtue of its closely spaced joints, has been found particularly useful for crushed rock and has proved satisfactory for surfacing the Siskiyou County Airport. Williams (1949, p. 21) ascribed the origin of much of the platy jointing in the lava of the western Cascades to shearing of the flows during the final stages of advance.
The proportion of tuffaceous beds in the volcanic rocks of the western Cascades increases toward the top of the unit. North of the valley dense rhyolite tuffs are found near the top of Bogus Mountain. Sheep Rock, which lies about 2 miles northeast of Yellow Butte, is composed of a large amount of andesitic tuff-breccia of probable mudflow origin. The breccia is characterized by a chaotic assemblage of large angular and subangular blocks set in a tuffaceous matrix (fig. 4). Where U.S. Highway 97 cuts through the tuff-breccia of
FIGURE 4. Tuff-breccia in the volcanic rocks of the western Cascades on the southwestside of Sheep Rock.
Sheep Rock, many fracture planes in the rock are coated with small thin crystalline plates of hematite, probably formed as a sublimation product of volcanic emanations. What is apparently a mudflow deposit, consisting of large boulders of andesite, rhyolite, and quartz- ite set in a matrix of red tuffaceous clay, is exposed in a quarry at locality 45/5-7Q about 2 miles south of Snowdon.
There are few volcanic necks in Shasta Valley. The largest forms Gregory Mountain, which is about 1 mile southeast of Montague and consists of nearly vertically jointed dusky-yellow fine-grained

GEOLOGY 35
hornblende andesite. The small peak at locality 46/5-19, about 2 miles north of Snowdon, is a neck of fine-grained black basalt. Viscous protrusions of rhyolitic lava form a northeastward-trending series of domes extending from Owls Head (fig. 5) in sec. 16, T. 44 N.,
FIGURE 5. Owls Head, a jointed rhyolitic lava dome in the volcanic rocks of the western Cascades.
E. 5 W., to the vicinity of Table Rock. The rhyolite in a quarry ad jacent to the cemetery in Little Shasta is a white fine-grained rock almost indistinguishable from quartzite. A similar sample was ob tained from the east flank of Owls Head where the rhyolite is a pale-cream fine-grained rock containing scattered minute crystals of biotite and feldspar which are barely visible with a hand lens.
Water-bearing character. Because of rapid changes in water bearing character of the rocks, both laterally and vertically, yields of wells that tap the rocks of the western Cascades vary greatly, not only in different parts of the valley but also locally. Wells that obtain water from these rocks are either in areas where they penetrate

36 GEOLOGY AND GROUND WATER, SHASTA VALLEY, CALIF.
alluvium at the surface and bottom in the volcanics, or are located along the flanks of hillocks of lava that jut out of the alluvium. Water-yielding zones in the rocks of the western Cascades may occur in jointed lavas, buried veneers of talus surrounding the hillocks, reworked volcanic sand and gravel, or clinkery contacts between the flows. Outcrops of the rocks lack vesicles and cavities caused by the expansion of gases during the cooling of the lava, and such open ings are presumed to have virtually no effect on the ability of the lava to yield water. Table 5 lists the yield characteristics of wells tapping the volcanic rocks of the western Cascades in various parts of the valley.
TABLE 5. Summary of yield characteristics of wells tapping the volcanic rocks of the western Cascades in Shasta Valley
[Discharge and drawdown data obtained from drillers' logs]
Well
43/6-10Kl__________10Q1__________21J2_______ _22A1__________23N1__________
44/4-5 Fl______ __5K1 __ ____ __
44/5-Ul___________1J2___________1J3______.____18B1__________
45/5-18D !__________45/6-28Al_ _________
Discharge (gpm)
840120800
1,400800300400250125100600
135
Drawdown (feet)
305Q40
560745847386015107
Specific capacity '
282. 0
20280
134. 06 Q5. 33. 32.0
401. 3
. 7
Saturated thickness
(feet)
953 100
2189593
3 1303 330
16056
12767
3 14030
Yield factor 2
302. 09. 2
30014
3. 12. 13. 35. 91. 6
60. 9
2. 3
1 Gallons per minute per foot of drawdown.2 Gallons per minute per foot of drawdown per foot of saturated thickness penetrated by the well, times
100.3 Based on estimated depth to water.
The most productive wells that obtain water from the rocks of the western Cascades are in the southwestern part of Shasta Valley be tween Gazelle and Grenada. Yields of irrigation wells in that area ranged from 120 gpm reported for well 43/6-10Q1 to 1,400 gpm for well 43/6-22A1 (table 5). The specific capacity of 280 gpm per foot of drawdown for the latter well is the highest value obtained for any well tapping these rocks. Striking differences in water-bearing properties of the rocks are shown by the yield characteristics of wells 43/6-10K1 and 43/6-10Q1, which are about 2,000 feet apart. The two wells are of about equal depth and both are on the flanks of isolated hillocks of lava standing above the alluvium deposited by Willow Creek. Well 43/6-10K1 had a specific capacity of 28, based on a discharge of 840 gpm and a drawdown of 30 feet, whereas well

GEOLOGY 37
43/6-lOQl, which evidently penetrates rocks considerably less pro ductive of water had a specific capacity of 2.0, based on a discharge of 120 gpm and a drawdown of 59 feet.
Well 43/6-21J2 yielded 800 gpm with 40 feet of drawdown, whereas well 43/6-21J1, about 300 feet away, yielded about 200 gpm but briefly was pumped dry within a few minutes after the pump was started. The drillers' logs do not suggest marked lateral differences in water-yielding properties in either the alluvium and or the volcanic rocks across the 300-foot distance separating the wells. Well 43/6-21J2 is 47 feet deeper than 43/6-21J1 and probably pene trates a productive zone of lava not tapped by the other well. More over, the logs indicate that well 43/6-21J2 penetrated about 19 feet more of alluvium before entering the rocks of the western Cascades than did well 43/6-21J1. The drillers' logs of the two wells follow:
Logofwell43/6-2lJl l
Thickness (feet)
Depth(feet)
Alluvium (Recent and Pleistocene?):Clay______._________________________________________ 17 17Gravel_-__-____-_____________._.______.________---Clay-_-_--____--____-_.___-____..__-_________-___-__ 23^ 42Gravel...___________________________________________ 1 43Glay.____________._._..____ __._.__.___ ._________ 43 86Boulders, sand and gravel.--_-________---_-____-__-_-- 10 96Coarse gravel_---_----_--___-___-___--_-_______-___-- 9 105Clay______._________________________________________ 29 134
Volcanic rocks of the western Cascades:Lava_____________.____.______.________.___._.__.___- 42 176Clay and gravel--_-_-__--_-_____.____________________ 22 198Boulders_____-_--__-_-__________.____________________ 5 203
Log of well 4SI6-21J2 1
Thickness Depth (feet) (feet)
Alluvium (Recent and Pleistocene?):Clay with occasional thin gravel seams__-___--___--__-__ 60 60 Gravel and clay______________________________________ 55 115
Volcanic rocks of the western Cascades:Cinders, boulders, and clay____________-__------_-__-_- 135 250
1 Stratigraphy interpreted by Seymour Mack.
Many of the drillers' logs report beds of red cinders in the rocks of the western Cascades from which copious supplies of water are obtained. Cinder beds are not known to crop out in Shasta Valley, however, and the materials logged as cinders may represent the tops of individual flows that have been oxidized by weathering and by

38 GEOLOGY AND GROUND WATER, SHASTA VALLEY, CALIF.
the baking effect of overlying flows. For example, in well 44/5-18B1, which yielded 600 gpm, the driller logged the materials from the major water-bearing horizon as red cinders and gravel. Samples of this material were examined by the author and were found to con sist of angular fragments of nonvesicular reddish andesite and well- rounded pebbles of dark-gray andesite, probably derived from stream action over the weathered top of a flow. The log of well 44/5-18B1 is as follows:
Log of well 4415-18Bl
Volcanic rocks of the western Cascades (Eocene to Miocene) :
Boulders and sand, water-bearing
Boulders _ _ _ _
Thickness (feet)
1817221018
Depth(feet)
1835576785
Although generally sufficient for domestic and stock use and locally for irrigation, yields of wells tapping the volcanic rocks of the western Cascades in other parts of Shasta Valley are considerably smaller than those obtained in the Gazelle-Grenada area. .At some places the smaller yields undoubtedly are due to the poor water- yielding character of the lava and pyroclastic rocks. In the vicinity of Montague, however, the older alluvium receives only slight in fluent seepage from streams entering the valley, and mean annual pre cipitation on the valley floor (12-15 inches) is probably too small to contribute much recharge to the ground-water body.
Along the east side of the valley near Little Shasta, 5 irrigation wells had an average yield of 235 gpm and a drawdown of 55 feet, for an average specific capacity of about 4 gpm per foot of draw down. Domestic wells in this area yield 10-15 gpm. Mudflow de posits and fine-grained pyroclastic rocks which underlie much of the cultivated lands bordering Little Shasta Valley on the north, are generally poor aquifers. Domestic well 45/5-7Q1, several hun dred feet south of a quarry in mudflow deposits, found mostly clay and boulders to a depth of 125 feet. The well produced about 10 gpm and became dry during the late summer after periods of ex tensive pumping.
VOLCANIC ROCKS OF THE HIGH CASCADES (PLIOCENE TO RECENT)
East of the hummocky valley land of the western Cascades, the more youthful high Cascades form a broad northward-trending

GEOLOGY 39
chain of large volcanic peaks extending from the north end of the Sierra Nevada virtually to the Canadian border. The older peaks of the high Cascades that bound Shasta Valley are a series of basaltic shield volcanos built up by quiet effusions of highly fluid lava during Pliocene and Pleistocene time. These include Miller~
Mountain, Eagle Eock, and the partly buried shields under Goosenest and Willow Creek Mountain (outside area shown on pi. 1). Miller Mountain, the western part of which occupies the area shown on the geologic map in T. 44 N., E. 4 W., is the most deeply eroded of the shields and may have been the first to become extinct, possibly dur ing late Pliocene or early Pleistocene time. Its flanks have been eroded by the sapping action of springs and streams that have cut readily into the less resistant underlying volcanic rocks of the western Cascades. To the north, the flanks of Eagle Rock volcano, whose summit (altitude 6,970 feet) is approximately 8 miles east of Bogus Mountain, have been only slightly modified by erosion, sug gesting that eruptions continued after the Miller Mountain vol cano became extinct. The presence of the old shields under the more youthful volcanic rocks of Goosenest and Willow Creek Moun tain is indicated by the distribution and altitudes of older basaltic lavas around the bases of the younger flows. Outliers of basalt re lated to the shield volcano beneath Willow Creek Mountain form Solomons Temple, Temple Eock, and Table Eock.
The present Willow Creek Mountain and Goosenest are steep-sided volcanoes built up by flows of hypersthene-rich andesite. Willow Creek Mountain is not shown on the geologic map but lies 6 miles north of Goosenest and 7 miles east of Foothill School. The top of Goosenest is about 3 miles east of the area shown on plate 1, but the flanks occupy the area between Little Shasta Eiver and Walbridge Gulch. The southeast side of Goosenest has a slope of 8°, whereas the other flanks have slopes of 14°-18°, flattening grad ually toward the base. The andesitic cone of Willow Creek Moun tain has slopes of 10°-13°. The larger of the two cinder cones atop Goosenest is between 600 and 700 feet high and has a well-preserved crater in the top. Flows from Goosenest occupy most of the area mapped (pi. 1) as volcanic rocks of the high Cascades between Davis Gulch and Little Shasta Eiver. Williams (1949, p. 48) stated that the remarkably fresh appearance of the latest flows from Goose nest indicates that they were extruded probably less than a thousand years ago.
Mount Shasta, one of the highest and most spectacular of the volcanoes of the high Cascades (fig. 6), lies at the southeastern margin of the valley and its peak is about 10 miles east of Weed.

40 GEOLOGY AND GROUND WATER, SHASTA VALLEY, CALIF.
1
FIGURE 6. Mount Shasta, looking southeast from vicinity of Montague ; low hillock in foreground underlain by volcanic rocks of western Cascades; and older alluvium in middle distance.
The principal activity that built Mount Shasta took place during Pleistocene time, at first almost wholly by effusions of andesitic lava but in the final stages by eruptions of dacite and basalt as well (Williams, 1949, p. 14). The latest flows from Mount Shasta, one of which presents a steep blocky front along Highway 97 between Weed and Yellow Butte, are probably not more than a few centuries old, as is indicated by their perfectly preserved steep fronts and the paucity of vegetation on the tops of the flows.
Water-bearing properties. The volcanic rocks of the high Cas cades that are adjacent to Shasta Valley serve chiefly as a large in take area and storage reservoir for ground water much of which eventually finds its way into the valley. Most of the steep, moun tainous area of the high Cascades is mantled with thin rocky soils that overlie highly fractured volcanic rocks, and hence can readily absorb large quantities of water derived from rain and snow. That part of the precipitation that passes beyond the reach of native plants passes through the many fractures and crevices within and between the interbedded lava flows. With the exception of Whitney Creek, which obtains its flow from melt water of the Whitney Glacier atop Mount Shasta, Little Shasta River and other streams along the east side of Shasta Valley derive most of their flow from springs and seeps issuing from the volcanic rocks of the high Cascades.

GEOLOGY
PLUTOS CAVE BASALT (RECENT)
41
General character. An extensive basalt flow occupying an area of more than 50 square miles in the southeastern part of the valley and exceeding 20 miles in length was named the Plutos Cave basalt by Williams (1949, p. 42). The name is adopted in this report. Although the Plutos Cave basalt is a product of Recent volcanic activity in the area and hence could be considered a part of the volcanic rocks of the high Cascades, it is here discussed separately because it was mapped separately by Williams and because of its hydrologic importance in Shasta Valley.
The Plutos Cave basalt appears to have issued from fissures close to the northeastern base of Mount Shasta, probably no more than several thousand years ago, and may attain a thickness of 400 feet (fig. 3) near its south end (Williams, 1949, p. 43). The flow is com posed of black vesicular olivine-rich augite basalt. The name is de rived from a large lava tube near its south end at the locality named Pluto Cave on the geologic map (pi. 1). The lava tube, one of several in the Plutos Cave basalt, was formed as the roof and sides of the flow solidified leaving a cavity through which molten lava continued to stream. The lava then escaped through fractures in the sides or at the front of the flow, leaving the underground passageway. Sections of the roof have fallen along the length of the tube, forming long, narrow trenches and many short caves filled with broken rock (fig. 7). The author walked through one section of the cave for several hundred feet before being stopped by huge blocks of basalt, which had fallen from the ceiling.
FIGURE 7. Collapsed lava tube in PLutos Cave basalt near Pluto Cave.

42 GEOLOGY AND GROUND WATER, SHASTA VALLEY, CALIF.
Water-bearing character. The Plutos Cave basalt constitutes the most prolific aquifer in Shasta Valley, yielding abundant water to wells and springs for irrigation and domestic uses. Yields of ir rigation wells range from small to large but average about 1,300 gpm. Well 44/5-34H1 has a specific capacity of 120 gpm per foot of draw down, yielding 4,000 gpm with 34 feet of drawdown. Nearby well 44/5-34G1 has a specific capacity of only 11 gpm per foot of draw down, based on a yield of 900 gpm with 80 feet of drawdown. Large well yields are obtained from the Plutos Cave basalt in two areas one in the vicinity of Big Springs and the other at the northern terminus of the basalt near Little Shasta. The area near Big Springs is the major ground-water-producing area in the valley. Table 6 lists the yield characteristics of wells tapping the Plutos Cave basalt.
TABLE 6. Summary of yield characteristics of wells tapping the Plutos Cave basaltin Shasta Valley
[Discharge and drawdown data obtained from dsilleis' logs]
Well
44/5- 2K1___ _______12L1__ ___ ___21H1_.________34G1__________34H1_,_ _ ____34J1___________34Q1__________35L1_. _ . __
Disci1 arre (fpm)
1,000900120900
4,000900
1,2501,300
Drawdown (feet)
321512803441
920
Specific capacity '
31601011
12022
14065
Saturated thickness
(feet)
6080
25511576763929
Yield factor 2
5275
3. £9. e
16029
360220
100.
1 Gallons per minute per foot of drawdown.2 Gallons per minute per foot of drawdown per foot of saturated thickness penetrated by the well, times in
Fractures and other permeable zones through which water moves in the basalt are related intimately to the fluidity and history of cooling of the flow. The basalt in surface exposures contains many lava tunnels. Below the water table, such tunnels undoubtedly are present and act as huge channels for the conveyance of subsurface water from the recharge area at the southeastern part of the valley to the Big Springs area. No drillers' logs specifically indicate that lava tunnels have thus far been penetrated, but many of the zones described as bouldery may possibly be caves filled with debris fallen from the sides and ceiling of the tunnels.
Shrinkage fractures formed during cooling of the basalt provides routes for the transmission of water through the flow, and are the means by which excess irrigation water and precipitation percolate downward to become ground \vater. The rapidity with which the basalt receives and transmits water is illustrated by the Big Springs (pi. 1), which supply copious amounts of water to the Big Springs

GEOLOGY 43
Irrigation District. Excess irrigation water, derived from applica tions in the area above the springs from May to August, seeps downward through the strongly jointed basalt and results in an in creased flow of 6 to 8 cfs at the springs during the irrigation season.
The surface of the basalt contains numerous pressure domes (schollendomes) which are believed to have originated by buckling of the flow crust caused by the pressure of the underlying fluid lava. In general the domes are elliptical in plan, with a principal axis not more than 30 feet in length, and are not more than 15 feet high. An open crack extends along the summit paralleling the long axis of the dome. In places, additional cracks are disposed radially from the summit. Fractures such as these undoubtedly provide access for the infiltration and vertical transmission of water.
Contacts between individual flow units may be among the most productive water-yielding zones in the basalt. As described by Nichols (1936, p. 617), flow units are tongue-shaped structures within a flow formed by lava which flows in a series of spurts rather than at a constant velocity. At the front of the flow and also on its margins, tongues a few hundred feet wide break out and flow for con siderable distances. A number of tongues form, crusts appear on them, and these tongues are buried by later tongues. This process may be repeated several times, and what is to all intents and purposes a single eruption is actually composed of several flow units. Three, and in places four, superimposed flow units with clinkery tops and bottoms can be seen on the walls of Pluto Cave. The contacts be tween these flow units are characterized by marked vesicularity and by many openings, some of which are quite extensive and appear to be capable of transmitting large quantities of water. These openings were formed when succeeding gushes of lava failed to fill completely the irregularities developed on the rough, broken upper crust of preceding flow units.
UNCONSOLIDATED DEPOSITS OF QUATERNARY AGE
TERRACE DEPOSITS (PLEISTOCENE)
Two terrace deposits of probable Pleistocene age are found along the west side of Shasta Valley. About 3 miles south of Grenada a dissected terrace deposit, which mantles sandstone of the Chanchelulla formation, has a maximum thickness of about 50 feet. The deposit consists of very well rounded cobbles of lava of the western Cascades and of granitic rocks in a matrix of brown sandy clay. Southwest of Gazelle, a terrace underlain by tuffaceous clay and gravel lies about 20 feet above the Recent alluvium deposited by Willow Creek.
No wells tap the terrace deposits, perhaps because they are of rather small extent and are generally above the water table.
506344 O 60 4

44 GEOLOGY AND GROUND WATER, SHASTA VALLEY, CALIF.
MORAINAL AND FLTJVIOGLACIAL DEPOSITS (PLEISTOCENE AND RECENT)
Morainal and fluvioglacial deposits have been distinguished on the geologic map (pi. 1). However, because the two units are genetically closely related and because they are restricted to about 35 square miles in the southeastern part of Shasta Valley, they are discussed together in this section of the report.
General character. At the close of the Wisconsin stage of the Pleistocene epoch, glaciers which had descended the northwestern slopes of Mount Shasta and which had spread into Shasta Valley retreated leaving terminal moraines along the shores of the present Dwinnell Reservoir and recessional moraines as far south as Weed. Wide sheets of bouldery fluvioglacial deposits containing abundant sand, silt, and clay were laid down beyond the ends of the glaciers. At the surface, the fluvioglacial deposits appear to be poorly strati fied, but their surficial jumbled nature may result at least in part from frost action, and at depth they may be well stratified. Along the northwest shore of Dwinnell Reservoir abutting against the volcanic rocks of the western Cascades, are well-bedded sand and gravel cut by small faults, probably of slump origin. This sand and gravel, some of which was used in the construction of the earth-fill dam for the reservoir, represents deposits of stratified drift which were probably laid down in contact with the wasting glacial ice. Alluvial fans composed of sandy and gravelly outwash also spread down the northwest flank of Mount Shasta during the retreat of the glaciers. These outwash deposits are still accumulating debris provided by the existing glaciers on Mount Shasta.
The long bouldery ridge of outwash material that extends from the recessional moraines west of Weed northward to Cedar Park School (pi. 1) has been cut to a depth of about 50 feet by Parks Creek and Shasta River and forms a terracelike surface above the Recent alluvium of the stream. A similar surface is also formed by Pleistocene outwash a short distance eastward, at locality 42/5-21. Both these areas of outwash have on their surface many closely spaced bare mounds encircled by rings of loose stones, a phenomenon once thought by local residents to have been the work of early Indians. Masson (1949, p. 61-71) examined the stone circles at these and other localities in Siskiyou County, and explained their origin as follows: alternate freezing and thawing caused the concentration of clay into local centers; the upfreezing of stones to the surface; and radial or centrifugal movement of the stones away from the clay centers. Near the south end of Butte Valley, similar stone rings have also developed on an outwash deposit that surficially consists of a poorly stratified mass of boulders in an unconsolidated matrix of sand, silt, and clay.
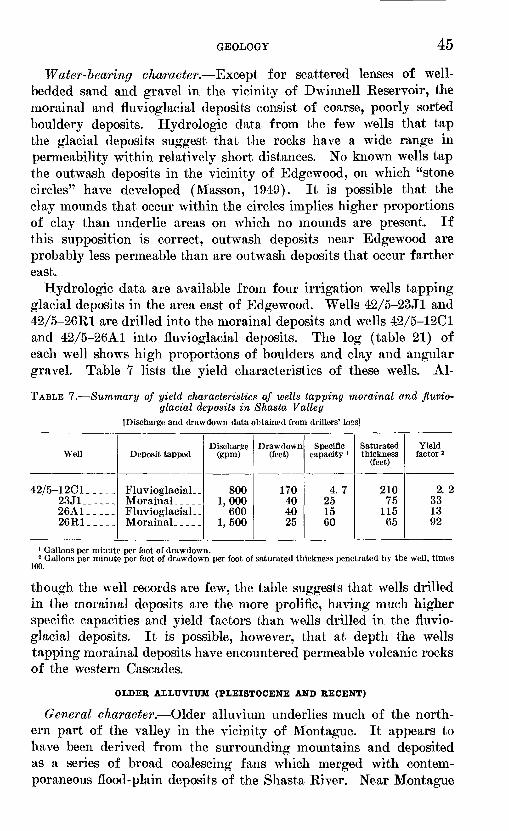
GEOLOGY 45
Water-bearing character. Except for scattered lenses of well- bedded sand and gravel in the vicinity of Dwinnell Reservoir, the morainal and fluvioglacial deposits consist of coarse, poorly sorted bouldery deposits. Hydrologic data from the few wells that tap the glacial deposits suggest that the rocks have a wide range in permeability within relatively short distances. No known wells tap the outwash deposits in the vicinity of Edgewood, on which "stone circles" have developed (Masson, 1949). It is possible that the clay mounds that occur within the circles implies higher proportions of clay than underlie areas on which no mounds are present. If this supposition is correct, outwash deposits near Edgewood are probably less permeable than are outwash deposits that occur farther east.
Hydrologic data are available from four irrigation wells tapping glacial deposits in the area east of Edgewood. Wells 42/5-23J1 and 42/5-26R1 are drilled into the morainal deposits and wells 42/5-12C1 and 42/5-26A1 into fluvioglacial deposits. The log (table 21) of each well shows high proportions of boulders and clay and angular gravel. Table 7 lists the yield characteristics of these wells. Al-
TABLE 7. Summary of yield characteristics of wells tapping morainal and fluvio glacial deposits in Shasta Valley
[Discharge and drawdown data obtained from drillers' loss]
Well
42/5-12C !_.._,23Jl____-_26A1__._.26R1.____
Deposit tapped
FluvioglacialMorainal
Morainal
Discharge (gpm)
8001,000
6001,500
Drawdown(feet)
170404025
Specific capacity '
4.7251560
Saturated thickness
(feet)
21075
11565
Yield factor s
2. 2331392
1 0 allons per minute per foot of drawdown.2 Gallons per minute per foot of drawdown per foot of saturated thickness penetrated by the well, times
100.
though the well records are few, the table suggests that wells drilled in the morainal deposits are the more prolific, having much higher specific capacities and yield factors than wells drilled in the fluvio glacial deposits. It is possible, however, that at depth the wells tapping morainal deposits have encountered permeable volcanic rocks of the western Cascades.
OLDER ALLUVIUM (PLEISTOCENE AND RECENT)
General character. Older alluvium underlies much of the north ern part of the valley in the vicinity of Montague. It appears to have been derived from the surrounding mountains and deposited as a series of broad coalescing fans which merged with contem poraneous flood-plain deposits of the Shasta River. Near Montague

46 GEOLOGY AND GROUND WATER, SHASTA VALLEY, CALIF.
the present flood plain of the Shasta River has a maximum width of half a mile and is entrenched about 15 feet below the surface of the older flood-plain and alluvial-fan deposits.
Thin remnant patches of material interpreted (pi. 1) as older alluvium occur along the valley margins west of Montague. In this alluvium are boulders identified as of the Plutos Cave basalt. If the identification is correct, and if Williams' assumption (1949, p. 5) that the basalt was extruded only a few thousand years ago is cor rect the material mapped as older alluvium must be of Recent age at least in part. However, the generally advanced stage of dissection of the older alluvium and the almost universal presence of a well- cemented hardpan suggest that the greater part of the older alluvium is of Pleistocene age.
The soil formed on the older alluvium is a brown sandy loam containing abundant gravel derived mostly from metamorphic rocks of the Klamath Mountains and from quartzose conglomerate of the Chico formation. The topography is characterized by gently sloping to undulating treeless plains, in places marked by low mounds. The mounds are 8-15 feet in diameter and 1-2 feet in height. They are especially prominent in the area west of Montague where they are underlain at shallow depth by sandstone of the Chico formation.
In the older alluvium a persistent hardpan layer about a foot thick commonly is found 10-16 inches below the land surface. The hard- pan is brown to yellowish brown and cemented principally with iron minerals, although seams and incrustations of calcareous material also occur.
Between the valley margins and the vicinity of Montague, the thickness of the older alluvium ranges from 0 to 100 feet. Well 45/6-27A1 is 116 feet deep and penetrates older alluvium from the land surface to 90 feet. The interval between 90 and 116 feet prob ably is the Umpqua formation of Eocene age, although it might be older alluvium. The log of the well follows:
Log of well 45/6-27Al
Older alluvium (.Recent and Pleistocene) : * Soil________ ___ .Boulders water.. _ __ __ _ _______Clay_______ _ __ _ _ _ ____Cement gravel _ _____
Umpqua(?) formation (Eocene): Black clay _______Black sand water_ _ _
Thickness(feet)
1025
550
224
Depth(feet)
10354090
92116
Stratigraphy interpreted by Seymour Mack.
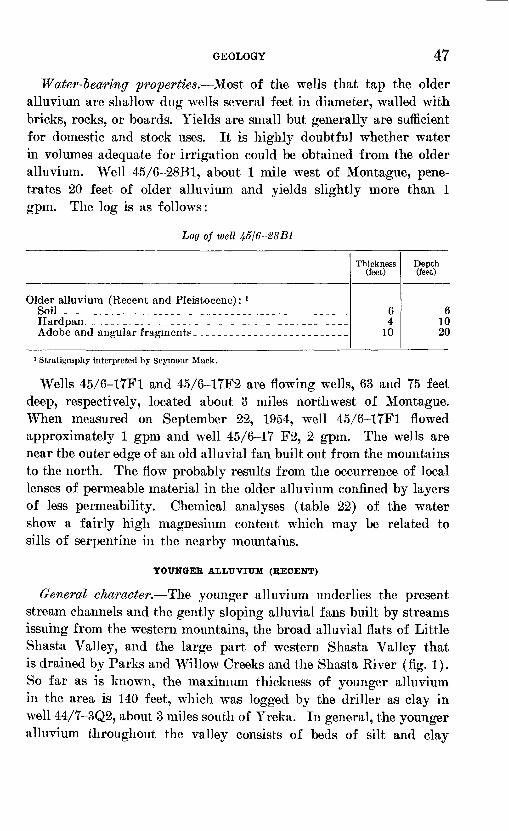
GEOLOGY 47
Water-bearing properties, Most of the wells that tap the older alluvium are shallow dug wells several feet in diameter, walled with bricks, rocks, or boards. Yields are small but generally are sufficient for domestic and stock uses. It is highly doubtful whether water in volumes adequate for irrigation could be obtained from the older alluvium. Well 45/6-28B1, about 1 mile west of Montague, pene trates 20 feet of older alluvium and yields slightly more than 1 gpm. The log is as follows:
Log of well 45I6-28B1
Older alluvium (Recent and Pleistocene) : l Soil _ _ .
Adobe and angular fragments
Thickness (feet)
64
10
Depth(feet)
61020
1 Stratigraphy interpreted by Seymour Mack.
Wells 45/6-17F1 and 45/6-17F2 are flowing wells, 63 and 75 feet deep, respectively, located about 3 miles northwest of Montague. When measured on September 22, 1954, well 45/6-17F1 flowed approximately 1 gpm and well 45/6-17 F2, 2 gpm. The wells are near the outer edge of an old alluvial fan built out from the mountains to the north. The flow probably results from the occurrence of local lenses of permeable material in the older alluvium confined by layers of less permeability. Chemical analyses (table 22) of the water show a fairly high magnesium content which may be related to sills of serpentine in the nearby mountains.
YOUNGEB ALLUVIUM (BECENT)
General character. The younger alluvium underlies the present stream channels and the gently sloping alluvial fans built by streams issuing from the western mountains, the broad alluvial flats of Little Shasta Valley, and the large part of western Shasta Valley that is drained by Parks and Willow Creeks and the Shasta River (fig. 1). So far as is known, the maximum thickness of younger alluvium in the area is 140 feet, which was logged by the driller as clay in well 44/7-3Q2, about 3 miles south of Yreka. In general, the younger alluvium throughout the valley consists of beds of silt and clay

48 GEOLOGY AND GROUND WATER, SHASTA VALLEY, CALIF.
with intercalated lenses of sand and gravel. The logs of two wells that tap younger alluvium on the flood plain of Yreka Creek follow:
Drillers' log of well 45J7-27R2
Younger alluvium (Recent) : 1 Soil, gravelly _GravelClay, gravelly__-_--__-________________-_-_ __.___.___GravelClay, gravelly _ _Gravel, dirty _ __ _ _ _ __Clay, gravelly
Basement complex of pre-Late Cretaceous age: Shale__-_______ ______________________________________
Thickness (feet)
2754
217
50
5
Depth (feet)
29
1418394696
101
Drillers' log of well 45/7-34K1
Younger alluvium (Recent) : * Soil and gravelDirty gravel .
Basement complex of pre-Late Cretaceous age : Hard broken gray rock
Thickness (feet)
44
124
25283812
355
Depth (feet)
48
20244977
115127
130135140
1 Stratigraphy interpreted by Seymour Mack.
The younger alluvium in Little Shasta Valley was derived mainly from basic volcanic rocks of high calcium content. As a result, considerable calcium carbonate has been concentrated in the subsoil, cementing the subsoil into a hardpan. The alluvial strip from Gazelle northward to Grenada, however, contains no hardpan and forms the main body of valuable agricultural land in Shasta Valley.
Water-bearing character. Most of the wells tapping younger al luvium are shallow dug w^ells used for domestic and stock uses. Some irrigation wells obtain water from the younger alluvial de posits, but most of those are along the western margin of the valley. Important exceptions are well 45/5-34C1 in Little Shasta Valley and well 42/5-8P1 on the flood plain of Parks Creek. Yreka obtains its municipal supply from an infiltration gallery (45/7-14N1) about 8 feet in diameter which induces flow from nearby Yreka Creek. The

GEOLOGY 49
gallery has a yield of 1,200 gpm and a drawdown of 5 feet, and hence a specific capacity of 240 gpm per foot of drawdown. A sup plemental supply for Yreka is obtained from well 45/7-34B1, near Greenhorn Creek, which yields approximately 300 gpm. Table 8 lists the yield characteristics of wells drawing water from the younger alluvium.
TABLE 8. Summary of yield characteristics of wells tapping the younger alluviumin Shasta Valley
[Discharge and drawdown data obtained from drillers' logs]
Well
42/5- 8P1- ________42/6- 9F1_________.43/6-33Jl__. _______45/5-34C1. _________45/7-34K1. _________
Discharge (gpm)
1,000400150250128
Drawdown (feet)
158
1070
110
Specific capacity 1
6750153.61.2
Saturated thickness
(feet)
65122
46100132
Yield factor 2
1004133
3. 6. 9
1 Gallons per minute per foot of drawdown.2 Gallons per minute per foot of drawdown per foot of saturated thickness penetrated by the well, times 100.
STRUCTURE
The sedimentary and metamorphic rocks of pre-Late Cretaceous age along the western side of Shasta Valley generally strike northeast and either stand vertically or dip at high angles. In the vicinity of Yreka these rocks generally are intruded conformably by sill-like bodies of serpentine ranging in width from several tens of feet to several thousand feet. At Yellow Butte the metamorphic rocks strike dominantly north, and the bedding in few places dips at less than 80°.
The beds in the Chico and Umpqua formations generally strike northwest and dip 15°-20° NE. At some localities, such as that about a mile southwest of Delphic School in 44/6-6, the Chico forma tion locally dips westward, possibly reflecting the surface irregularity of the Abrams mica schist on which it was deposited. Near the western part of the valley the strikes and dips of the volcanic rocks of the western Cascades are similar to those of the Chico and Umpqua formations, but farther east along the margin of the high Cascades the dips flatten to approximately 5°. The eastward dips of all these formations are probably the result of subsidence of the valley under the rapid accumulation of 10,000-15,000 feet of rocks of the western Cascades. Subsidence may have resulted in part also from the transfer of rock materials to the surface from an underlying mag- matic reservoir and the subsequent subsidence of the roof of the magma chamber.

50 GEOLOGY AND GROUND WATER, SHASTA VALLEY, CALIF.
The major structural elements in Shasta Valley are two narrow northwestward-trending fault blocks, one in the northern part of the valley, and the other at its eastern margin (pi. 1). North of Snowdon an upthrown block contained between two faults is trace able for about 5 miles. To the south it is concealed beneath alluvium, and to the north it disappears near the Klamath Kiver. Williams (1949, p. 52) reported that the downthrow on the east side of the horst diminished northward from a maximum of about 400 feet; the downthrow on the west side diminished northward from a maxi mum of 200 feet.
The horst at Yellow Butte, which bounds the valley on the east in the Pluto Cave area, is traceable for about 8 miles northwest and is the more prominent of the two structures. Near the south end of this horst at Yellow Butte, faulting has brought to the land surface metasedimentary rocks of Paleozoic age and quartz mon- zonite of probable Jurassic age. Three miles to the north the Ump- qua formation has been brought into fault contact with rocks of the western Cascades. The observed dips and stratigraphic relations of the two rock units suggest that the eastern fault may have a dis placement of about 1,000 feet. The contact locally is marked by springs, and artesian wells are obtained east of the fault. A short distance north of Yellow Butte a scarplet about 15 feet high in the Plutos Cave basalt indicates movement of the eastern fault within the last few thousand years.
The western fault of the Yellow Butte horst is concealed by the Plutos Cave basalt throughout its extent. The position of the Ump- qua formation in the horst and the dip of the Umpqua formation beneath the rocks of the western Cascades west of the fault, shown diagrammatically on figure 3, imply that the displacement of the fault is at least 2,000 feet.
Geologic structure sections across Shasta Valley are shown on figure 8. Section B-B' extends east-northeastward from the vicinity of Paradise Craggy to Bogus Mountain and crosses the horst some 3.5 miles north of Snowdon. Section C-C' trends east-southeastward from the vicinity of Yreka to the Goosenest volcano. That part of the cross section (fig. 8) east of the point Cf is after Williams (1949).
GEOLOGIC HISTORY
The oldest formation in the area is the Abrams mica schist of the basement complex, a series of highly siliceous beds probably of early Paleozoic (pre-Silurian) age, which show evidence not only of ex tensive sedimentation but also of an epoch of metamorphism and erosion which antedates the deposition of the sediments of the

GEOLOGY 51

52 GEOLOGY AND GROUND WATER, SHASTA VALLEY, CALIF.
Chanchelulla formation of Hinds (1931). During Silurian and early Devonian time deep seas covered a great part if not all of the region occupied by the Klamath Mountains. The beds of the Chanchelulla formation that record the Silurian phase of deposition in the Shasta Valley area are chiefly sandstone and shale and scattered lenses of limestone in which corals and other forms of marine life were abundantly preserved. The next event recorded by the rocks in the area is a period of vigorous volcanic activity when a great mass of andesitic lava, now converted to greenstone and greenstone schist, was extruded. The age of the greenstone is problematical; it may be correlative with the Copley greenstone of pre-middle Devonian age or with the Applegate group of Triassic (?) age in southern Oregon. It seems probable that, as has occurred elsewhere in the southern Klamath Mountains area, during the latter part of the Paleozoic and continuing into the Mesozoic era a great thickness of sedimentary and volcanic rocks was deposited and subsequently eroded from the Shasta Valley area. The close of the Jurassic period and possibly the Early Cretaceous were marked by the Ne- vadan orogeny, one of the great mountain-building epochs of the Pacific coast of the United States. The rocks were strongly folded, faulted, uplifted, and intruded by igneous rocks that ranged in composition from peridotite to granodiorite.
With the termination of the Nevadan orogeny the land began to subside more or less continuously, the sea advanced upon the land, and the Chico formation was deposited. Near the close of Cretaceous time the Shasta Valley area probably was covered completely by water, but at the close of the Cretaceous period the Klamath Moun tains again were uplifted. During Eocene time the Umpqua forma tion, which is of fresh-water origin and which is composed of shale, sandstone, conglomerate, and a few thin beds of coal, was deposited on the eroded Cretaceous and older rocks at the present sites of the east flank of the Klamath Mountains and Shasta Valley. Northward in the vicinity of Roseburg, Oreg., the Umpqua formation is marine and includes abundant flows of pillow basalt.
Late Eocene time ushered in a period of extensive volcanic activity which continued through the Miocene epoch. Most of the volcanoes lay to the east of Shasta Valley and possibly now are covered by the lavas of the younger volcanoes of the high Cascades. Williams (1949, p. 33) states that the volcanoes of the western Cascades never could have been very high, because fossil redwood forests, which pre sumably required abundant moisture as do modern redwoods, have been found east of the Cascade Range in upper Miocene beds. Their occurrence is taken by Williams to indicate that the volcanoes were

GEOLOGY 53
not high enough to check moisture-laden ocean winds and therefore did not reduce the rainfall on the lee side by more than a few inches. Because the volcanic rocks of the western Cascades accumulated to thicknesses greater than 10,000 feet, the area must have subsided many thousands of feet as the eruptions continued if the land sur face remained relatively low as postulated.
At the close of the Miocene epoch the entire Cascade belt was up heaved on a broad scale. This upheaval was accompanied by the formation of north-northwestward-trending faults along the bases of the volcanic cones and by the opening of fissures along the crest of the range, from which poured the Pliocene and younger lavas that built the giant cones of the high Cascades (Williams, 1949, p. 35). During Pliocene and early Pleistocene time a northward- trending chain of shield volcanoes was built up by quiet effusions of fluid olivine basalt and basaltic andesite. At the same time ande- site flows were discharged by other volcanoes along the crest of the range. Mount Shasta was built mainly during the Pleistocene epoch, at first principally by andesitic flows but in the final stages by eruptions of dacite and basalt as well.
The glacial history of Mount Shasta is not well enough known to determine whether there were several stages such as those recorded in the Cascade Range of Oregon and in the Sierra Nevada of Califor nia. At their maximum extent, which may have occurred during the late Pleistocene at the climax of the Tioga stage of Blackwelder (1931), the glaciers that descended the northwest slopes of Mount Shasta spread into Shasta Valley to an altitude of about 2,800 feet. The maximum advance is well marked by the position of the ter minal moraines.
After the close of the Pleistocene epoch, while the glaciers of Mount Shasta were retreating to their present position, many new volcanoes were formed in the Cascade Range. Some of the flows and associated cones are hardly modified by erosion and must have been formed within the last few thousand years. Products of the most recent volcanism in the area include the last flows of Mount Shasta and Goosenest and the Plutos Cave basalt.
The ancestral Shasta Valley probably was formed at the close of the Miocene epoch prior to the growth of the Pliocene shield vol canoes. Drainage then was different from that of today, as the Shasta River formerly ran close to the edge of the high Cascades. Today the Shasta River makes a sharp westward bend on leaving the Dwinnell Reservoir site and flows parallel to the margin of the Plutos Cave basalt for about 10 miles. This course was established only a few thousand years ago when the former channel was occupied by the flow.

54 GEOLOGY AND GROUND WATER, SHASTA VALLEY, CALIF.
GROUND WATER
OCCURRENCE AND MOVEMENT
In the unconsolidated sediments of Shasta Valley, such as the younger and older alluviums and the glacial deposits near the south end of the valley, ground water occupies the openings between the constituent grains which make up the sediments. In consolidated sedimentary rocks, such as the sandstone beds of the Chico and Umpqua formations, the size and number of these openings have been reduced by compaction and by the deposition of cementing material between the mineral grains. Additional interstices, how ever, are present in the rocks of the Chico and Umpqua formations in the form of openings along bedding and joint planes. The rocks of the basement complex of the Klamath Mountains along the west side of the valley also contain fracture openings such as those along bedding planes, joints, faults, sheer zones, and foliation planes. Openings in the volcanic rocks of the western Cascades and the Plutos Cave basalt are found mainly in the form of joints and the clinkery contacts between flows. Buried lava tubes are numerous in the Plutos Cave basalt and are thought to be especially important for the transmittal of water through the basalt.
The ground-water body in Shasta Valley appears to be hydro- logically continuous within all the geologic units in the valley, al though the irregular topography and the distribution of the geologic units suggests that the valley might be divided into several distinct hydrologic units. That illusion is fostered by the northward-trending central belt of rocks of the western Cascades (pi. 1) which extends the length of the valley on the surface. The rocks rise to heights of several hundred feet above contiguous parts of the valley area and appear to form imposing hydrologic barriers between lithologic units that crop out on the east and west flanks of the valley. On the north they separate older alluvium in the Montague area from the younger alluvium of Little Shasta Valley, and on the south they separate the Plutos Cave basalt and glacial deposits from the younger alluvium in the Gazelle-Grenada area. However, geologic and hy drologic evidence indicates that the rocks of the western Cascades do not form barriers to ground-water movement, except perhaps locally. They are highly permeable in some areas of the valley, as is indicated by high yields of irrigation wells that tap them in the Gazelle-Grenada area. Reported high seepage losses through the rocks of the western Cascades which form the western wall of Dwinnell Reservoir also attest to their permeability.

GROUND WATER 55
Plate 2 shows contours representing the surface of the ground- water body in Shasta Valley. The altitudes of the water levels in wells were determined from measurements made during April 1954. The direction of ground-water movement is at right angles to the contours in a downslope direction from the areas of recharge to the areas of discharge. The water-level contours on plate 2 show that ground water moves generally northward in the southern part of Shasta Valley and troughward toward the Shasta River in the eastern and western parts. From about Weed northward the con tours intersect the channels of the major streams, indicating that ground-water discharge supplements the surface-water flow in the Shasta River system. At the north end of the valley, an eastward- trending ground-water divide occurs about at Snowdon to the north ground water moves out of the valley between Bogus and Black Mountains and to the south ground water moves toward the Shasta River.
The hydraulic gradient varies considerably in the different types of material underlying the valley. In the vicinity of Big Springs the water surface in the Plutos Cave basalt slopes to the west at about 25 feet per mile. The water table in the glacial material between Mount Shasta and Dwinnell Reservoir slopes northwestward at about 150 feet to the mile, reflecting the steep terrain at the foot of the mountain or low permeability, or both. Hydraulic gradients in the volcanic rocks of the western Cascades average about 30 feet per mile throughout most of the valley. Immediately west of Dwinnell Reservoir, however, the gradient in these rocks steepens, sloping to the northwest at about 100 feet per mile. This steepening may reflect sizable recharge to the volcanic rocks from Dwinnell Reser voir. Hydraulic gradients in the Gazelle-Grenada alluvial belt and in Little Shasta Valley average about 30 feet per mile.
The depth to the water table varies greatly throughout Shasta Valley. The depths are greatest at the south end of the valley near its eastern and western margins. The depths are least near the valley trough. Near Pluto Cave the water table lies at a depth of about 300 feet. Northward and westward the land surface declines rapidly and many large springs issue from the basaltic lava. In Little Shasta Valley the water table locally intersects the land sur face and ponds and meadows occupy the depressions. The maximum depth to water along the western margin of the valley was that in well 43/6-29Q1, near the head of an alluvial fan built out from the Klamath Mountains about 2i/£ miles northwest of Gazelle. The measurement at this location in the spring of 1954 indicated the water level to be 82.4 feet below the land surface.

56 GEOLOGY AND GROUND WATER, SHASTA VALLEY, CALIF.
So far as is known, water-table conditions exist throughout most of the valley, but artesian conditions exist locally. For example, at the north end of the valley, well 46/6-24L1, which penetrates 200 feet of sandstone and shale of the Umpqua formation, overflows during the winter and spring. Ground water in the fairly permeable sandstone beds in the Umpqua formation is confined between beds of impermeable shale. Near Gazelle, well 43/6-21J2, which pumps about 800 gpm, shows rapid and nearly complete recovery of water level, amounting to about 40 feet, within 10 minutes after pumping ceases. This rapid recovery may reflect artesian conditions; however, it might reflect instead a high entrance loss. The well is drilled through alluvium but penetrates volcanic rocks of the western Cascades. Well logs in this area suggest that water is confined in a permeable zone of rocks of western Cascades, possibly a contact zone between flows, between overlying, and underlying impermeable lava. Big Springs yield considerable water under pressure from the Plutos Cave basalt. The w^ater may originate in snowmelt from Mount Shasta and flow through a lava tube which nears the surface at Big Springs.
The Plutos Cave basalt is the most important aquifer in Shasta Valley, yielding abundant wTater to wells and springs in the vicinity of Big Springs. The north slopes of Mount Shasta, which comprise an area of almost 170 square miles, receive as much as 70 inches of precipitation annually, mostly as snow, and supply abundant re charge to the Plutos Cave basalt. Yields of irrigation wells that tap the basalt range from 120 to 4,000 gpm and average about 1,300 gpm.
Wells that tap the volcanic rocks of the western Cascades vary greatly in yield, as the permeability of the lavas depends upon the somewhat random distribution of joints or clinkery contacts, or both. However, in most parts of the valley the rocks of the western Cas cades generally supply sufficient water for domestic and stock uses. In the Gazelle-Grenada area, irrigation wells in these rocks yield 120-1,400 gpm and average 800 gpm. North of the Little Shasta River they contain a high percentage of tuffaceous beds and mud- flow deposits which appear to be less permeable, and hence less suited to development, than the areas underlain by the andesitic lava of the western Cascades exposed elsewhere in the valley. The rhyolite lava domes and andesite volcanic necks also are presumed to be of lower permeability than the main body of andesitic lava, chiefly because they lack the openings provided by the clinkery contacts between the individual flows.
The basement complex and the Chico and Umpqua formations are tapped by relatively few wells in the area. Locally these rocks,

GROUND WATER 57
where strongly jointed, are capable of yielding sufficient water for domestic and stock uses.
Morainal and fluvioglacial deposits generally yield sufficient water for domestic and stock supplies. Irrigation wells that tap the bouldery glacial deposits east of Edgewood have yields ranging from 600 to 1,500 gpm. The elongate outwash deposit immediately west of Edgewood is not tapped by wells but probably is only poorly permeable because of the high clay content suggested by the forma tion of the ubiquitous clay-centered stone rings exposed on the surface.
The younger and older alluviums generally yield water sufficient for domestic and stock uses. Locally along the west side of the valley in the vicinity of Gazelle, well that tap the younger alluvium obtain sufficient water for irrigation. Yreka obtains its municipal supply of about 1,200 gpm from an infiltration gallery constructed in the younger alluvium. The older alluvium commonly is poorly sorted and probably not capable of yielding water in amounts ade quate for irrigation.
SPRINGS
Springs and seeps occur in some exposures of all the formations in the Shasta Valley area, particularly near the borders of the valley and along the courses of the major streams. In the Klamath Moun tains, springs issuing from fractures in the basement complex supply water to many streams entering Shasta Valley from the west. Frac tures in the Chico and Umpqua formations supply small springs in the northern part of the valley. In the high Cascades, springs issue from the porous top and bottom parts of lava flows and from joints in the lava; other springs issue from the rims of de pressions between adjacent shields; still others occur in fault zones cutting the lavas; and some springs issue from tubes in basaltic flows. The following discussion relates primarily to the occurrence of springs in the volcanic rocks along the east side of Shasta Valley, because these springs are of far greater quantitative importance than those found elsewhere in the valley.
Numerous springs and seeps occur in the valley of Parks Creek along the western base of the long northeastward-trending ridge of andesite that forms the western wall of Dwinnell Reservoir. There, water flows from closely spaced fractures in the andesite and from the foot of talus slopes. One of these springs, at location 42/5-4B1, was flowing 2.7 cfs (cubic feet per second) on September 24, 1954. According to residents of the area, seep areas always have been present in this vicinity, but the springs did not attain their present high rate of flow until after the construction of Dwinnell Reservoir.

58 GEOLOGY AND GROUND WATER, SHASTA VALLEY, CALIF.
About 2 miles to the north, at location 43/5-28B1, a flow of approxi mately 6 cfs was recorded on September 24, 1954, from two vents in fractured lava at the base of a hill.
Several springs, including spring 44/4-28H1 which supplies the major flow of Spring Creek, are oriented along the fault that marks the east side of Yellow Butte. At spring 44/4-28H1 water gushes from several slits in the lava of the high Cascades and flows down a steep slope to join Spring Creek. On October 15, 1954, the flow in Spring Creek below the main spring was about 1 -cfs. Above the junction with the main spring the flow was only about 0.2 cfs.
Along the east edge of Shasta Valley, springs are common close to the contact between the volcanic rocks of the western Cascades and the overlying flows of the high Cascades. Cold Spring (also called Cleland Spring), 45/4-17Q1, gushes from numerous vents for a dis tance of about 200 feet along the toe of a Kecent lava flow from Goosenest. At one place water jets from fractured basalt as though forced from a pipe. At the most southerly vent, water flows quietly from clinkers and talus blocks lying beneath massive black finely vesicular basalt. Water from the spring area is collected in a channel and is used for irrigation in Little Shasta Valley. Table 9 shows (the variation in flow at Cold Spring from January to May 1954.
TABLE 9. Flow at Cold Spring from January to May 1954 l
Date
1954 Jan. 22Feb. 11. _______________ .____..__ ________Mar. 25-. _____ __ _ _ _ _______Apr. 14 _ ________________ _ _._ ___ _May 11____________________ ____________________.-__-_---
Flow (cfs)
12. 713. 513. 810. 811. 2
1 Data from unpublished records In the flies of the California Division of Water Resources.
Numerous springs issue from the Plutos Cave basalt. The best known of these is the Big Springs, from which about 30,000 acre- feet of water is discharged yearly. Water from Big Springs flows westward and is impounded in an artificial lake and thence diverted to ditches for use by the Big Springs Irrigation District. Big Springs Creek flows from beyond the lake to the Shasta Kiver a distance of about a mile. Water rises in many places in the creek bed, and evidence of spring sapping in the banks is widespread. Measurements made in 1918 (Watson and others, 1923, p. 149) sum marize spring discharge in the immediate area: flow of Big Springs at outlet, 32 cfs; Little Springs (located 1 mile southwest of Big Springs) near outlet, 6 cfs; Big Springs Creek at junction with Shasta River, 103 cfs. The results of these measurements show an

GROUND WATER 59
increase of about 65 cfs derived mainly from springs in the bed of the stream downstream from Big Springs between the outlet of the two springs and the Shasta River.
Two clusters of highly saline carbonated springs are in Shasta Valley and vicinity one near Table Rock, and the other near Bogus School about 6 miles northeast of Ager (north of area shown on pi. 1). The temperature of Bogus Springs ranges from 73°F to 81°F. A qualitative analysis made in 1947 showed the presence of sodium chloride, magnesium and calcium carbonate, sodium phosphate, silica, iron, and traces of lithium and hydrogen sulfide (Williams, 1949, p. 56). The different outlets of Table Rock Springs yield water ranging in temperature from 57°F to 65°F. The waters have a high content of calcium and sodium bicarbonate and sodium chloride. Water from one of the Table Rock springs, a few hundred yards north of Little Shasta River near the northern base of Table Rock, formerly was bottled as a carbonated mineral water.
The Bogus Springs issue from low mounds of dazzling white calcareous tufa, in an area about 400 feet across, at the base of a hillside near the county road between Ager and the Copco Reser voir north of the mapped area. Gas bubbles from all the springs. Volcanic rocks of the western Cascades, probably andesite or basaltic andesite, cover the slopes in the immediate vicinity of the springs. North and east of the springs are a series of flat-topped hills capped by flow remnants of Pliocene (?) olivine basalt derived from the Eagle Rock volcano. The main tufa mound, which contains 4 vents, measures about 20 feet in height and 30 yards in diameter. The largest vent on this mound forms an oval pool, 5 by 3 feet, in which a temperature of 81 °F was measured. Although the water bubbled vigorously, no flow occurred over the sides of the vent. Southeast of this deposit are 10 smaller mounds of tufa. Six of these did not flow water but the water was seen to bubble feebly in the summer of 1954.
Along the east side of Shasta Valley, at the spring near the base of Table Rock (45/4-20D1) on the Terwilliger Ranch, an estimated flow of 2 to 3 gpm of carbonated water issues from the top of a low mound of calcareous tufa about 100 yards in diameter. Two miles downstream from that spring, at location 45/5-25B1, strongly car bonated water rises from the lava-rock gravel at the south edge of the Little Shasta River. The spring there discharges about 1 gpm at a temperature of 57°F. The rocks in the vicinity of the spring are strongly iron-stained and cemented by calcareous tuff a. Cemented gravel is exposed in the stream bed several hundred feet upstream from the present spring, suggesting that carbonated water formerly issued from vents at that place. The third of the carbonated springs
506344 O 60 5

60 GEOLOGY AND GROUND WATER, SHASTA VALLEY, CALIF.
in the Table Rock area (45/4-29M1) is near the southern base of Table Rock on the Martin Ranch. About 1 gpm issues from a vent some 75 yards west of a tufa mound, 10 feet high, which formerly was the principal outlet.
FLUCTUATIONS OF WATER LEVELS
The rise and decline of water levels in wells in Shasta Valley is related to the amount of recharge to the ground-water reservoir and the amount of discharge from the reservoir. When recharge exceeds discharge the water levels rise, and conversely, when the draft ex ceeds the inflow the water levels decline. The principal factors that influence the rise and fall of water levels are infiltration of rainfall into permeable rocks within the tributary drainage area, ground- water discharge into streams, evapotranspiration, pumping from wells, and recharge from excess application of irrigation water.
Figure 9 shows hydrographs of wells 44/5-3-iCl, 45/5-28D1, and
\
\
\
44/5-34C1
\45/5-28D1
44/6-20A1
July August September
1953
October November
FIGDRE 9. Hydrographs of wells 44/5-34C1, 45/5-28D1, and 44/6-20A1.

GROUND WATER 61
44/6-20A1 for the period July to November 1953. Automatic water- stage recorders were installed on wells 44/5-34C1 and 45/5-28D1, and weekly measurements were made in the third well. The hydrograph for well 44/6-20A1 illustrates the normal seasonal downward trend of the water table during the summer and fall. The hydrographs for wells 44/5-34C1 and 45/5-28D1 probably would have maintained almost the same seasonal slope as well 44/6-20Al, had it not been for several peaks caused by the infiltration of excess irrigation water to the water table. The graphs show that the net declines ranged from about 5 feet in wells 44/5-34C1 and 44/6-20A1 to nearly 11 feet in well 45/5-28D1.
Figure 10 shows hydrographs of wells 43/6-21J1 and 43/6-21J2 in which weekly water-level measurements were made from July to November 1953. The wells are about 300 feet apart and are near the west edge of an alluvial fan extending valleyward from the Klamath Mountains about 2 miles north of Gazelle. The nonpump- ing water levels in both wells are almost the same, and, instead of
30
40
50
60
<
<:
i Pum > 10m
^
-o~ np off nutes
r -o-.r~-
0 '^ X
Pumping levels
_.
i
- -c
r*-43/6-21J2
> 0 Nonpumping water levels
70
80
30
3543/6-21Jl
Nonpumping water level
September
1953
OctoberJuly August
FIGURE 10. Hydrographs of wells 43/6-21J1 and 43/6-21J2.
November

62 GEOLOGY AND GROUND WATER, SHASTA VALLEY, CALIF.
reflecting the normal seasonal decline, change remarkably little. Apparently the addition of recharge from an excess of water applied for irrigation in the area virtually balanced the seasonal decline, thus maintaining a nearly static level. Well 43/6-21J2 has a draw down when pumping of about 40 feet. Despite the short distance between the wells, pumping in well 43/6-21J2 had no apparent effect on the water level in 43/6-21J1. This may be due to the difference in depth of wells 43/6-21J1 and 43/6-21J2, which are 203 and 250 feet deep, respectively. Drillers' logs suggest that the pumped well penetrates a permeable zone of rocks of the western Cascades that is not reached by well 43/6-21J1. This and the rapid rise in water level suggest the possibility of artesian conditions. Water-level measurements taken on July 20, 1953, showed a pumping level of Y7.8 feet below the land-surface datum (table 20). After the pump had been shut down for 10 minutes, the water rose about 40 feet or to within 36 feet of the land-surface datum.
Water-level measurements made in Shasta Valley during the spring of 1953 and 1954 indicate that only a slight net change in water levels, and hence in ground-water storage, occurred in that period. In the vicinity of Big Springs, there was a net rise averag ing approximately 1 foot. Near Ager the change was so small as to be nearly immeasurable. In the Edgewood area, the net rise was about 1.5 feet, and in the Gazelle-Grenada and Little Shasta areas the net rise averaged 0.5 foot. The Montague area showed the only net decline in water levels during the year, about 1.5 feet.
RECHARGE
Most of the recharge to the ground-water body in Shasta Valley is effected by infiltration (deep percolation) of precipitation that falls on the tributary drainage area. From this area water moves into the valley in part underground and in part as spring discharge. Kecharge is effected also by seepage from streams draining the up land areas, and by influent seepage of surface water used for irriga tion. Probably a small proportion of the total recharge comes from precipitation that falls directly on the valley floor.
The water-level contour map (pi. 2) shows that ground water moves troughward towards the Shasta Kiver from areas of recharge along the eastern and western margins of the valley. From the east the high Cascades contribute abundant recharge because of the high precipitation in the area and the extremely porous and perme able nature of the soil and the underlying volcanic rocks. The north ern slopes of Mount Shasta, which comprise about 1YO square miles, or approximately 20 percent of the total drainage area, probably

GROUND WATER 63
contribute more recharge to the ground-water reservoir in Shasta Valley than does any other part of the basin. The sedimentary and crystalline rocks of the Klamath Mountains on the west are not nearly as porous or permeable as the volcanic rocks of the high Cascades. Direct runoff from the Klamath Mountains is consider ably higher than that from the Cascade Range, and some recharge in the fanhead areas is effected by seepage loss from streams issuing from the Klamath Mountains.
Eecharge resulting from irrigation with surface water constitutes an important source of ground water in the area. In 1953 about 25,000 acres was irrigated with about 60,000 acre-feet of water. Of this total, about 58,000 acre-feet was surface water diverted from streams and from Dwinnell Eeservoir and the remainder was ground water. The average irrigation efficiency (percentage of water ap plied that is used by the crops) throughout Shasta Valley was esti mated at about 75 percent by the California Division of Water Re sources (Horn and others, 1954). Applying this estimate, recharge from surface-water irrigation in 1953 was about 15,000 acre-feet.
It is doubtful whether any significant amount of precipitation falling on the vally floor percolates below the root zone in Shasta Valley in years of average or below-average rainfall. The mean annual precipitation on the valley floor, which is only about 12-15 inches, probably is not sufficient to contribute much recharge to the ground-water body, but it appears sufficient to supply the soil- moisture requirements for all the valley's vegetation, except that along watercourses which in part may be phreatophytic. However, in years of above-average rainfall the precipitation probably supplies some recharge to ground water.
DISCHARGE
Ground water in Shasta Valley is discharged by both natural and artificial means. Natural discharge occurs by seepage into streams and by evapotranspiration (evaporation directly from the soil, and plant transpiration). Little ground water moves out of the valley as underflow through the thin alluvial deposits of the Shasta River and through the underlying bedrocks. Artificial discharge results from the pumping and flow of water from wells. The discharge from flowing wells is small.
In 1953 about 6,000 acre-feet of water was pumped from the ground-water reservoir in Shasta Valley. This figure includes 3,500 acre-feet withdrawn for use in urban miscellaneous water-service areas and 2,500 acre-feet for irrigation. These figures, however, represent the pumpage; the net draft, or water permanently removed

64 GEOLOGY AND GROUND WATER, SHASTA VALLEY, CALIF.
from the reservoir, probably was about 4,000 acre-feet. The differ ence represents return irrigation water.
Natural discharge from the area far exceeds artificial discharge. In 1953 natural subirrigation was received by about 13,000 acres of pasturelaiid and grainland, for the most part in areas of the younger alluvium bordering the major streams in the valley. It was esti mated by the California Division of Water Resources (Horn and others, 1954) that about 28,000 acre-feet of water was lost to the atmosphere by evapotranspiration from these subirrigated areas.
The water-level contours on plate 2 indicate that the Shasta River is a gaining stream throughout most of its course through the valley as a result of movement of ground water troughward from the valley margins. A crude estimate of the ground-water discharge to the Shasta River and its tributaries in Shasta Valley can be made by subtracting the total gaged and estimated surface-water inflow, less the net surface-water diversions for irrigation, from the total gaged outflow of the Shasta River near Yreka. This estimate is derived below.
The Geological Survey and the California Division of Water Resources have gaged the principal streams in the area, the Shasta and Little Shasta Rivers and Parks Creek. The discharge of Big Springs is included as an element of surface-water inflow only be cause it is a gaged quantity that flows into the Shasta River and therefore is distinguished from rising ground water along the stream courses. Estimates of the discharge of minor streams that flow into the Shasta River are based on drainage area and precipitation data and have been obtained from unpublished records in the files of the California Division of Water Resources. Table 10 shows the gaged and estimated surface-water inflow to Shasta Valley for the water year ending September 1953:
TABLE 10. Gaged and estimated surface-water inflow to Shasta Valley in the yearending September 30, 1953
Stream
Shasta River at Edgewood _ _ . __.Parks Creek near west edge of vallev _ - ..Little Shasta River near east, edge of vallevBig Springs _ . _ .All streams along western part of valley from north of Parks Creek
to the mouth of the Shasta River - - -Other minor streams
Total about _. ___.____._______._._____.________.____-.
Discharge 1 (acre-feet)
58, 00023, 00022, OOd
' 30, 000
3 35, 0004 5, 000
1 70, 000
1 All figures are rounded to the nearest thousand acre-feet.2 Discharge of Big Spring is gaged and is a known contribution to streamfiow.3 Estimated by the California Division of Water Resources.4 Estimated by the Geological Survey.

GROUND WATER 65
The table shows that the total surface-water inflow to Shasta Valley in the water year 1952-53 was about 170,000 acre-feet, includ ing the discharge of 30,000 acre-feet from Big Springs. Of this total, a part is diverted for irrigation and a part is evaporated from Dwin- nell Keservoir and from the surfaces of the streams and detention reservoirs. The California Division of Water Kesources has esti mated the annual evaporation from Dwinnell Keservoir to be about 5,000 acre-feet from a water-surface area of about 1,300 acres. Evaporation from the approximately 500 acres of stream surface and detention reservoirs is estimated to be 2,000 acre-feet.
The estimated surface-water diversion for irrigation in 1953 was 58,000 acre-feet. Of this total a small part was diverted upstream from the stream gages, and must be deducted from the estimated diversion because it was not included in the estimate of total surface- water inflow. In addition, a small part of the diverted water applied to field crops near river banks returned to the streams as tail waste. Accordingly, the net water diverted was somewhat less than 58,000 acre-feet.
The net water diverted plus the surface water lost by evaporation in 1953 probably was about 60,000 acre-feet. This total subtracted from the estimated total surface-water inflow of 170,000 acre-feet leaves a residual of 110,000 acre-feet, which, if the above estimates are reasonable, would have been the total surface-water outflow at th valley outlet north of Yreka had there been no added increment due to ground-water discharge into the streams. However, the flow of Shasta River near Yreka in the 1953 water year was 181,400 acre-feet (Wells and others, 1955, p. 545). The gaged outflow less the residual of 110,000 acre-feet is 70,000 acre-feet, which is a crude measure of the ground-water discharge into the Shasta River and its tributaries in the 1953 water year.
In the preceding paragraphs of this section the principal elements of ground-water discharge from Shasta Valley have been estimated for the 1953 water year. These rough estimates include the follow ing: Discharge into the river, 70,000 acre-feet; net pumpage, about 4,000 acre-feet; evapotranspiration from subirrigated lands, about 28,000 acre-feet; and gaged discharge from Big Springs, 30,000 acre-feet, most of which is discharged from the valley as streamflow, or a total of about 130,000 acre-feet. This total constituted the bulk of the ground-water discharge from Shasta Vallev in the 1953 water year. Unestimated elements are minor and include the uncontrolled flow from a few wells, the discharge of small springs on the valley floor, and evapotranspiration losses in small areas of phreatophytes.

66 GEOLOGY AND GROUND WATER, SHASTA VALLEY, CALIF.
WATER UTILIZATION
Most of the wells in Shasta Valley are dug wells about 20 feet deep which supply water for domestic and stock uses. Most of the irrigation wells are in the Gazelle-Grenada and the Big Springs areas. Municipal supplies are obtained from wells. Yreka has a municipally owned water system, whereas the smaller towns in the valley are served by either private water companies or individually owned wells.
The California Division of Water Kesources' interim report on the Klamath Kiver basin (Horn and others, 1954) contains figures on water utilization and the present land-use pattern in relation to water requirements in Shasta Valley. Three categories of land-use pat tern are listed:1. An irrigated land group which includes all agricultural lands
dependent upon surface application of water, as well as those agricultural lands utilizing water from a shallow-water table (subirrigation) or from winter flooding.
2. Urban lands which include the developed area of towns within the valley.
3. Miscellaneous water-service areas which include farmsteads, parks, golf courses, cemeteries, airports, and industrial sites, which are not within urban boundaries.
Total water applied for all uses in Shasta Valley in 1953 was about 64,000 acre-feet. Urban use was about 2,500 acre-feet, based on an estimated daily per capita consumption of 200 gallons. Miscellaneous water-service areas used about 1,000 acre-feet, most of the supply coming from wells. By far the greatest part of the water used in Shasta Valley was applied for irrigation. A total of about 25,000 acres was irrigated with about 2,500 acre-feet of ground water and 58,000 acre-feet of surface water (California Division of Water Resources, written communication).
Four organized irrigation districts provide water for approxi mately 10,000 acres of irrigated land in Shasta Valley (table 11).
TABLE 11. Principal water-service agencies in Shasta Valley in 1958 [Based on Horn and others (1954, table 3)]
Agency
Montague Water Conservation DistrictGrenada Irrigation DistrictShasta River Water Users AssociationBig Springs Irrigation District
Source of water supply
Shasta Riverdo
___. _do__. -...__ Big Springs
Approximate area irrigated
(acres)
5,0001,0002, 5001,500

QUALITY OF WATER 67
The Montague Water Conservation District, containing a gross area of about 21,000 acres, is the largest, Others are the Grenada Irri gation District, containing about 2,000 acres, the Big Springs Irri gation District, containing 3,700 acres, and the Shasta River Water Users Association, covering about 5,100 acres.
The Montague District has maintained Dwinnell Reservoir for regulation of the Shasta River and as a facility for diversion of water into the district's distribution system. The dam was designed originally to impound 70,000 acre-feet of water, but because of ex cessive leakage through the sides of the reservoir the water stage is maintained at or below an elevation of 2,796 feet, providing an effective storage capacity of about 34,000 acre-feet. During the 1953 irrigation season, 13,900 acre-feet of water was diverted into the district's main canal from the reservoir. Inflow to the reservoir is supplemented by a diversion from Parks Creek, a tributary of the Shasta River.
The Big Springs Irrigation District obtains its water by pumping from a pond fed by copious flows from the Big Springs. The Shasta River Water Users Association and Grenada Irrigation District both pump directly from the Shasta River. The Shasta River and its major tributaries constitute an adjudicated stream system, from which lands outside organized districts are served by individual di versions from the stream system.
QUALITY OF WATER
Minerals in the earth's crust are attacked and dissolved by water at the land surface and water percolating through the rocks above and within the zone of saturation. The solvent action of water is greatly increased by the presence in solution of carbon dioxide, derived from the atmosphere and the soil, and by organic substances leached from the soil. The character of the dissolved mineral matter in natural waters is thus intimately related to the composition of the soils and rocks in a particular area. The concentration of mineral constituents is controlled partly by rainfall. Where rainfall is abundant, concentrations tend to be low because the volumes of water are relatively large and rates of movement relatively fast. The converse is true in arid regions; where water stays for a long time in contact with the rocks, the concentrations of dissolved min erals in natural waters tend to be high.
In natural waters most of the mineral constituents occur in ionic form, but some occur as colloidal suspensions. The common ionized constituents generally reported in water analyses are the cations (basic or positive ions) calcium (Ca), magnesium (Mg), sodium (Na), and potassium (K) and the anions (acid or negative ions)

68 GEOLOGY AND GROUND WATER, SHASTA VALLEY, CALIF.
carbonate (CO3 ), bicarbonate (HCO3 ), sulfate (SO*), and chloride (Cl). The constituents that may occur in colloidal form include silica (SiO2 ) and iron and aluminum oxides and usually are reported as total quantities present of silica, iron, and aluminum. In addition, in many analyses other constituents such as boron (B), fluoride (F), and nitrate (NO3 ), which in part affect the quality of water with respect to its use for agricultural or domestic uses, are reported. The chemical analyses of water were made by the U. S. Geological Survey, Quality of Water Branch.
Chemical analyses of water are commonly expressed in terms of ppm (parts per million) or of equivalents per million or both. Parts per million expresses the concentration of an ion (such as calcium or chloride) by weight when compared to the weight of a million parts of water, the unit of measurement being the same. Equivalents per million expresses the concentration of the chemical constituents dissolved in the water in terms of their chemical combining weights; in this form or expression one equivalent per million of any ion present is chemically equal to one equivalent per million of any other ion in solution.
In the following discussions of water chemistry another term, percentage reacting value (or percentage equivalents per million) is also employed. Percentage reacting value is defined as the pro portion of one cation (in equivalents per million) to the sum of all the cations (in equivalents per million) expressed as a percentage, or the proportion of one anion (in equivalents per million) to the sum of all the anions (in equivalents per million).
RELATION TO USE
In the spring and autumn of 1953 the California Division of Water Resources collected 109 samples of ground water and 27 samples of surface water in Shasta Valley for analysis at the U.S. Geological Survey Quality of Water Laboratory at Sacramento, Calif. The results of these analyses are assembled in tables 22 and 23 and show that the Shasta Valley waters are virtually of the calcium magnesium bicarbonate type and are generally satisfactory, except for hardness, for domestic uses, and excellent for irrigation.
The physical, chemical, and bacteriological quality of drinking water in the United States may be judged by the U.S. Public Health Service Drinking Water Standards (1946, p. 13). Although these standards apply officially only to drinking water and water-supply systems used by interstate carriers subject to Federal Quarantine Regulations, they have been accepted voluntarily by the departments of public health of most States as criteria for the evaluation of public

QUALITY OF WATER 69
water supplies. The recommended maximum concentration for the more common mineral constitutents follows:
Maximum concentration for mineral constituents
Constituents
Fluoride _ __ . _ .. _ _ _ _ _ ____
Magnesium _ _
Sulfate_____- _______________________________________________
Maximum con centration
(ppm)
1. 50.3
125250250
i 500
i Dissolved solids of 1,000 ppm permitted if water of better quality is not available.
The waters in Shasta Valley generally conform to the listed standards for drinking water. Several ground-water samples, how ever, contained concentrations of chloride higher than those sug gested in the standards, and rather high concentrations of nitrate as well, probably owing to local contamination by livestock and human wastes. For the most part the contaminated waters are restricted to the older alluvium in the northern part of the valley, where water is obtained mainly from dug wells that average only 20 feet in depth. Water from two springs in the vicinity of Table Kock had a very high chloride content, but the chloride is probably of deep-seated origin. Water from these springs has a mineral concentration in excess of 4,000 ppm and formerly was bottled for sale as carbonated mineral water. The water of East and West Lakes, which are about 3 miles east of Grenada, contains about 1,100 ppm of dissolved solids as a result of evaporation of the water and concentration of the dis solved mineral matter.
Hardness is caused mainly by salts of calcium and magnesium and when using soap with this water it is difficult to obtain a lather. It is expressed as an equivalent amount of calcium carbonate (CaCO3 ). According to Bateman (1950, p. 866), soft waters range in hardness from 0 to 55 ppm, slightly hard waters from 56 to 100 ppm, moderately hard waters from 101 to 200 ppm, and hard waters from 200 ppm. In general, Shasta Valley waters are hard, the hardness ranging from 30 to 582 ppm, and averaging about 250 ppm through out the valley. The hardest waters, averaging 314 ppm in hardness, are from wells tapping the older alluvium. The softest waters are from two wells tapping the Umpqua formation at the north end of the valley. There the hardness of waters from wells 46/5-18L1 and 45/5-6E1 was 30 and 44 ppm, respectively.

70 GEOLOGY AND GROUND WATER, SHASTA VALLEY, CALIF.
The most important factors that affect the quality of water for irrigation are the total amount of dissolved salts, the bicarbonate content, the boron content, and the relative proportion of sodium. These factors may vary independently, so that water adequate in several respects may be rendered unsuitable because of a high con centration of one constituent.
Water having a high sodium ratio (percent sodium) adversely affects the soil texture by the chemical process of cation exchange, in which sodium replaces calcium and magnesium in the soil complex and the soil particles then have a tendency to become disaggregated or dispersed. Studies have shown that the dispersion of soil particles may occur when the percent sodium in irrigation water exceeds 50. Dispersion may cause the soil to become relatively impermeable to the downward movement of water (puddled) and thereby may ac centuate drainage problems and bring about alkali conditions and crop damage.
Wilcox (1948, p. 27) presents a table (see following table) based on field observations that classifies water for irrigation on the basis of total concentration as indicated by the electrical conductivity (see table 22) and percent sodium.
Classification of water for irrigation
Rating
12345
Classes of water
Grade
Excellent _ _ - _Good---_-__-_-_-_-PermissibleDoubtful___- _-__--_Unsuitable
Specific conductance (micromhosat 25° C.)
250-750--------------750-2,000------------2,000-3,000-----------More than 3,000
Percent sodium
Less than 20.20-40.40-60.60-80.More than 80.
Boron is an essential element for normal plant growth, but at concentrations only slightly above optimum it is exceedingly toxic to many plants. Natural waters containing more than 2 ppm of boron are likely to cause injury to many plants.
If water having a high concentration of bicarbonate is used for ir rigation there is a tendency for calcium and magnesium to precipi tate as carbonates as the soil solution becomes more concentrated and carbon dioxide is lost from solution. As the concentrations of cal cium and magnesium are thereby reduced, the relative proportion of sodium is increased. If the amount of carbonate and bicarbonate equals or exceeds the amount of calcium and magnesium, all ex pressed in equivalents per million, nearly all the calcium and mag-
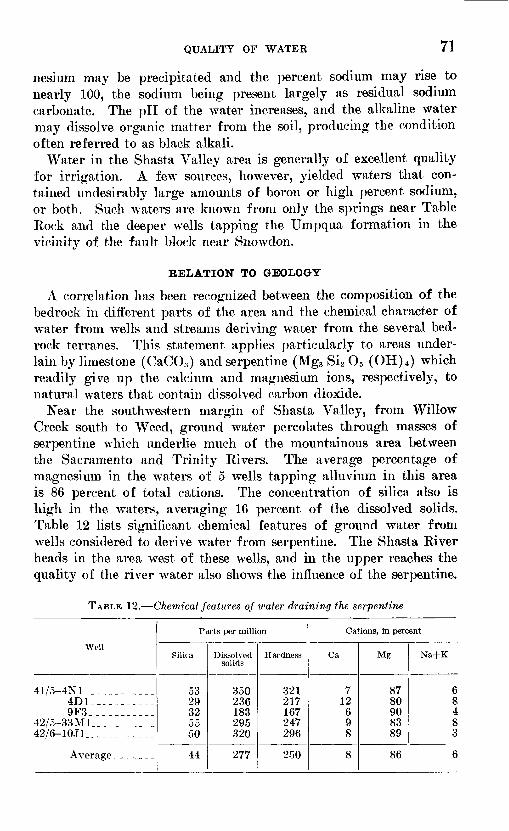
QUALITY OF WATER 71
nesium may be precipitated and the percent sodium may rise to nearly 100, the sodium being present largely as residual sodium carbonate. The pH of the water increases, and the alkaline water may dissolve organic matter from the soil, producing the condition often referred to as black alkali.
Water in the Shasta Valley area is generally of excellent quality for irrigation. A few sources, however, yielded waters that con tained undesirably large amounts of boron or high percent sodium, or both. Such waters are known from only the springs near Table Rock and the deeper wells tapping the Umpqua formation in the vicinity of the fault block near Snowdon.
RELATION TO GEOLOGY
A correlation has been recognized between the composition of the bedrock in different parts of the area and the chemical character of water from wells and streams deriving water from the several bed rock terranes. This statement applies particularly to areas under lain by limestone (CaCO3 ) and serpentine (Mg3 Si2 O 5 (OH) 4 ) which readily give up the calcium and magnesium ions, respectively, to natural waters that contain dissolved carbon dioxide.
Near the southwestern margin of Shasta Valley, from Willow Creek south to Weed, ground water percolates through masses of serpentine which underlie much of the mountainous area between the Sacramento and Trinity Rivers. The average percentage of magnesium in the waters of 5 wells tapping alluvium in this area is 86 percent of total cations. The concentration of silica also is high in the waters, averaging 16 percent of the dissolved solids. Table 12 lists significant chemical features of ground water from wells considered to derive water from serpentine. The Shasta River heads in the area west of these wells, and in the upper reaches the quality of the river water also shows the influence of the serpentine.
TABLE 12. Chemical features of water draining the serpentine
Well
41/5-4Nl____________4D1. __________9F3___________
42/6-33Ml___________42/6-10J1 ______ __
Parts per million
Silka
53 29 32 55 50
44
Dissolved solids
350 236 183 295 320
277
Hardness
321 217 167 247 296
250
Cations, in percent
Ca
7 12 6 98
8
Mg
87 80 90 83 89
86
Na+K
68 4 8 3
6

72 GEOLOGY AND GROUND WATER, SHASTA VALLEY, CALIF.
Figure 11 shows cation relationship of Shasta River water at several localities in the valley. Close to the mountains at sampling locality 41/5-9P, magnesium in the river water made up 91 percent of the total cations. About 4 miles downstream at locality 42/5-20J, the magnesium percentage dropped to 56, because of mixing with ground water from glacial deposits near Edgewood. At locality 44/6-23H, near Grenada, the magnesium content decreased further to 45 per cent. Near the mouth of the river, at locality 46/7-24H, the mag nesium percentage rose to 53, presumably indicating the presence of several small sill-like bodies of serpentine that are intruded into the Siskiyou Range north of Yreka.
Samples from Parks and Willow Creeks also indicate the presence of the large serpentine mass at the south end of the valley. A sample from Yreka Creek at location 45/7-34L near the county fairgrounds shows a magnesium content of 74 percent. There, drainage is over
FIGURE 11. Cation relationships of Shasta Kiver water at five sampling localities inShasta Valley.

QUALITY OF WATER 73
a southeastward-dipping sill-like body of sepentine which extends from Yreka 15 miles south-southwest into Scott Valley.
Like serpentine, limestone has influenced the chemical quality of ground water in localized areas in Shasta Valley. Beds of limestone included within the Abrams mica schist and the Chanchelulla forma tion of Hinds (1931), are found in the mountains bordering the valley on the west. Along Willow Creek, in the Chanchelulla forma tion, a resistant blue-gray limestone bed that averages about 200 feet in thickness forms prominent scarps and high cliffs. Smaller lenses of limestone are included in a zone extending from 35 to 325 feet below the main limestone. Analyses of water from wells 42/6-3L1 and 42/6-8H1 show calcium percentages of 54 and 60, respectively. Similarly, about 5 miles northwest of Grenada, beds of dark-gray limestone in the Abrams mica schist have imparted a high calcium concentration to the ground water. There, water from wells 44/7-13C2 and 44/7-13J1 shows a calcium percentage of 75. Table 13 shows the chemical features of analyses of well water from known limestone areas in Shasta Valley.
TABLE 13. Chemical features of water draining known limestone beds
Well
42/6- 3L1. __________8H1. __________
44/6-18M4__ _ __ __44/7-13C2. _._. __.__
13J1.. __________
Parts per million
Silica
25 19 25 28 17
23
Dissolved solids
301 315 266 217 203
260
Hardness
259 278 209 165 172
217
Cations, in percent
Ca
54 60 70 75 75
67
Mg
38 33 16 15 18
24
Na+K
8 6
14 107
9
Excluding those areas containing known limestone beds, surface waters draining over the Abrams mica schist and the Chanchelulla formation of Hinds (1931) are of the calcium magnesium bicar bonate type and show average calcium and magnesium percentages of 51 and 35 percent, respectively. The average dissolved solids and hardness are 299 and 234 ppm, respectively.
The predominant anion in Shasta Valley waters is bicarbonate, which generally constitutes 80-90 percent of the total anions. How ever, water draining the Chico formation west of Montague has an average sulfate content of 35 percent, possibly due to the oxidation of pyrite which is present in beds of black shale in the uppermost part of the formation. Three wells, each exceeding 200 feet in depth, tap the Chico formation in the vicinity of Montague. Those are the salt-water artesian well 44/6-3D1, well 45/7-24R1, and well

74 GEOLOGY AND GROUND WATER, SHASTA VALLEY, CALIF.
45/6-19E1. Water from the latter 2 wells has an average percent sodium of 44, (table 14) which is considerably higher than the average for water obtained from rocks of the Chico formation at shallow depth and may indicate a base-exchange reaction.
TABLE 14. Chemical features of water draining the Chico formation
Well
45/6-19E1 _ _45/7-24Rl__. ___ _45/6-30D1 _____45/7-25.N2___ ______
Average _
Depth of well (feet)
425 235
Shallow Shallow
Parts per million
Silica
23 20 40 16
25
Dissolved solids
252 307 332482
343
Hardness
114 142 203 303
190
Cations, in percent
Ca
32 27 36 33
32
Mg
2427 37 42
32
Na+K
44 46 27 25
36
No analysis was made of the artesian salt water from well 44/6-3D1, which taps the Chico formation, but the water is probably of connate origin. The percentage of sodium chloride in the water is undoubtedly very high, because in the latter part of the 19th century, the owner was known to have extracted common salt from the water. (See discussion of Chico formation.)
Water from the springs near Table Rock is virtually a sodium bicarbonate water (percent sodium 85), the chloride making up about 26 percent of the total anions. In addition to high concentra tions of sodium and chloride, these waters have an average of about 4,700 ppm of dissolved solids, and high concentrations of boron (14 ppm). Water from the cluster of carbonated springs near Bogus School also is highly mineralized and similar in composition to the water from the Table Rock Springs. It is possible that the sodium chloride in both these spring areas originates from the Chico formation at great depth. However, the high sodium chloride con tent might reflect instead the recent volcanic activity in the region, particularly because a high boron content is characteristic of springs in volcanic areas. According to Williams (1949, p. 56), no major faults are known to be present in either of these areas, but probably the springs lie on fractures of small displacement.
In the northern part of the valley, well 46/5-8P2, which is 200 feet deep, penetrates volcanic rocks of the western Cascades at land surface, but it probably enters the Umpqua formation at shallow depth. Water from the well contains more than 800 ppm dissolved solids and has a relatively high content of sodium, chloride, and boron. The percentages of these constituents are similar to per-
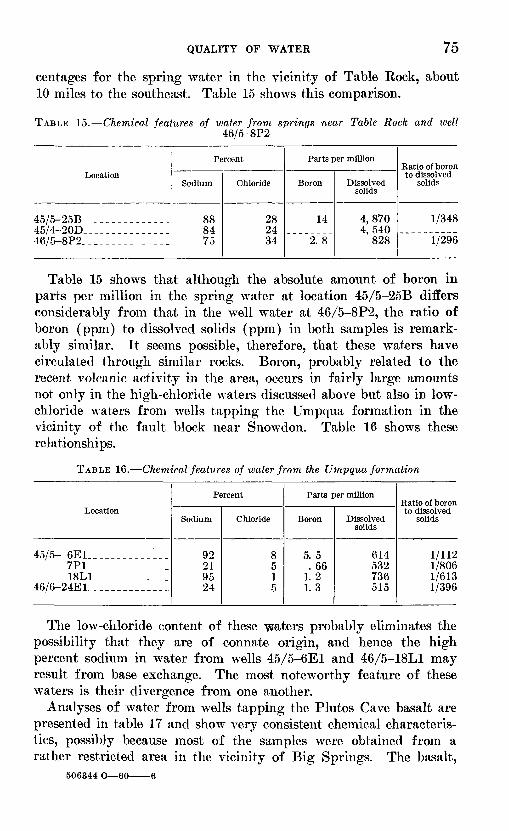
QUALITY OF WATER 75
centages for the spring water in the vicinity of Table Rock, about 10 miles to the southeast. Table 15 shows this comparison.
TABLE 15. Chemical features of water from springs near Table Rock and well46/5-8P2
Location
45/5-25B___-_-___-_--__45/4~20D_____-_-_-_-___46/5-8P2 ______________
Percent
Sodium
88 84 75
Chloride
28 24 34
Parts per million
Boron
14
2. 8
Dissolved solids
4,870 4, 540
828
Ratio of boron to dissolved
solids
1/348
1/296
Table 15 shows that although the absolute amount of boron in parts per million in the spring water at location 45/5-25B differs considerably from that in the well water at 46/5-8P2, the ratio of boron (ppm) to dissolved solids (ppm) in both samples is remark ably similar. It seems possible, therefore, that these waters have circulated through similar rocks. Boron, probably related to the recent volcanic activity in the area, occurs in fairly large amounts not only in the high-chloride waters discussed above but also in low- chloride waters from wells tapping the Umpqua formation in the vicinity of the fault block near Snowdon. Table 16 shows these relationships.
TABLE 16. Chemical features of water from the Umpqua formation
Location
45/5- 6E1 ____________7P1______________18L1_____________
46/6-24E1 ___________
Percent
Sodium
92 21 95 24
Chloride
8 5 1 5
Parts per million
Boron
5. 5 . 66
1. 2 1.3
Dissolved solids
614 532 736 515
Ratio of boron to dissolved
solids
1/112 1/806 1/613 1/396
The low-chloride content of these waters probably eliminates the possibility that they are of connate origin, and hence the high percent sodium in water from wells 45/5-6E1 and 46/5-18L1 may result from base exchange. The most noteworthy feature of these waters is their divergence from one another.
Analyses of water from wells tapping the Plutos Cave basalt are presented in table 17 and show very consistent chemical characteris tics, possibly because most of the samples were obtained from a rather restricted area in the vicinity of Big Springs. The basalt,
506344 O 60 6

76 GEOLOGY AND GROUND WATER, SHASTA VALLEY, CALIF.
however, was extruded as a single flow; hence, it might be expected to be of uniform mineral composition and to yield waters of uniform character. The analyses of waters from the volcanic rocks of the western Cascades are shown in table 18. The waters are not as uni form in composition as the waters from the Plutos Cave basalt, per haps because samples were collected from a larger area throughout the valley but more probably because the rocks of the western Cas cades lack the homogeneity of composition of the Plutos Cave basalt. Ground-water samples from the Plutos Cave basalt have an average concentration of silica of 63 ppm (highest in the valley) compared to 45 ppm for waters draining the dominantly andesitic rocks of the western Cascades.
The high silica content of water from wells tapping the Plutos Cave basalt probably is not derived entirely from the basalt. It may be derived in large part from the pyroclastic debris and glacial out- wash deposits which mantle a large part of the recharge area on the north slopes of Mount Shasta. Because of the large surface area they present in relation to their volume, finely comminuted particles of glacial flour and volcanic ash would be likely to impart a high silica content to natural waters. This supposition is sup ported by analyses of water from Garrick Creek (42/5-22P), which flows through an extensive area of fluvioglacial material near the south end of the valley. The sample from Garrick Creek, collected April 27, 1953, contained 75 ppm of silica and the sample collected October 1, 1953, contained 60 ppm of silica. By contrast, the average silica content of other surface waters in Shasta Valley is only about 30 ppm.
TABLE 17. Chemical featiires of water from wells tapping the Plutos Cave basalt
Well
43/5- 3R1. __________9C1___________
23A1___________23M1___________
44/5- 2R1___________34G1.______.___34H1___________34J1____________34N1___________34Q1___________35L1_______.___
Average _ _ _ _ _ _
Parts per million
Silica
63 67 7574 51 61 66 60 58 58 63
63
Dissolved solids
246 482 388 340 301 385 408 453 324 363 449
376
Hardness
120 279 226 188 169 257 240 246 148 204 250
194
Cations in percent
Ca
23 21 24 22 38 31 31 26 23 28 26
27
Mg
42 45 46 47 30 45 40 36. 5 36 39 38
40
Na+K
33.5 34 30 31 32 24 30 37. 5 41 34 35
33

QUALITY OF WATEK 77
TABLE 18. Chemical features of water from wells tapping the volcanic rocks of thewestern Cascades
Well
44/5- 1J2__ __________45/5- 4N1___._.___._
19P1. __________21P1___________24Rl__. ________27A1___________28D1___________28M2___________29B1___________29B2___________
46/5-21Jl____________
Average _ __
Parts per million
Silica
47 35 61 46 49 49 33 41 50 51 28
45
Dissolved solids
416 317 262 308 327 456 224 543 335 328 309
348
Hardness
274 208 168 208 239 368 128 382 214 214 201
237
Cations in percent
Ca
46 51 39 41 38 39 44 37 37 42 43
42
Mg
29 28 46 37 46 47 24 45 37 33 22
36
Na+K
25 20 15 21 16 14 31 18 26 24 34
22
In summary, ground and surface waters draining the different formations in the Shasta Valley area generally can be distinguished by their chemical character. The predominant anion in all the waters is bicarbonate (fig. 12), which usually averages between 80 and 90 percent of the total anion content. Along the west side of the valley the waters draining areas of serpentine have a very high percentage of magnesium (86 percent), and waters draining limestone beds have a high percentage of calcium (67 percent). Waters from the near-surface Chico formation west of Montague have nearly equal percentages of calcium, magnesium, and sodium plus potassium. Saline water is found principally at the Table Rock Springs, the cluster of carbonated springs near Bogus School, and the salt-water artesian well at locality 44/6-3D1. The salt water in well 44/6-3D1 is probably of connate origin, whereas the waters of Table Rock Springs and the springs near Bogus School may receive substantial mineralization from a volcanic source. The most diagnostic chemical features of these spring waters are the high salinity, high sodium, and high boron content (as high as 14 ppm). The chloride content averages about 30 percent of total anions. Two wells tapping the Umpqua formation at the north end of the valley show a percent sodium as high as 90, which is possibly due to base exchange. The boron content of 4 samples from this source averaged about 2.3 ppm, and may have been derived from the low-grade coal beds near the base of the Umpqua formation. Water from the Plutos Cave basalt has an unusually large amount of silica, which averages about 63 ppm. Silica averages about 45 ppm in water from the volcanic rocks of the western Cascades.

78 GEOLOGY AND GROUND WATER, SHASTA VALLEY, CALIF.
Formations tapped by wells1. Umpqua formation2. Volcanic rocks of the
western Cascades3. Plutos Cave basalt4. Older alluvium5. Younger alluvium
Sodium and potassium
Chloride and nitrate
46/5-18L1 44/5-1J2 44/5-34G1 45/6-29K1 43/6-29Q2
FIGURE 12. Graphical presentation of analyses of selected samples of ground water InShasta Valley.

TAB
LE 19.
Des
crip
tion
of
wat
er w
ells
in t
he S
hast
a V
alle
y ar
ea,
Cal
ifor
nia
Alt
itud
e of
lan
d-su
rfac
e da
tum
: A
ltit
ude
Inte
rpol
ated
to
the
near
est
foot
fro
m t
opo
gr
aphi
c m
aps
of S
hast
a V
alle
y pr
epar
ed i
n 19
22 b
y th
e G
eolo
gica
l Sur
vey
in c
oope
r
atio
n w
ith
the
Bur
eau
of R
ecla
mat
ion.
Dep
th:
Rep
orte
d by
the
owne
r or
was
obt
aine
d fr
om t
he d
rill
er's
log.
Typ
e of
wel
l: D
u, d
ug;
P,
drill
ed w
ith
perc
ussi
on o
r ca
ble-
tool
equ
ipm
ent;
R,
drill
ed
with
rot
ary
tool
s.
Dis
char
ge a
nd d
raw
dow
n: T
he d
isch
arge
, in
gal
lons
per
min
ute,
and
the
dra
wdo
wn,
in f
eet,
are
liste
d as
rep
orte
d by
the
ow
ner
or w
ell
drill
er.
Use
of
wat
er:
D,
dom
estic
; G
, ga
rden
; I,
irr
igat
ion;
M, m
unic
ipal
; S,
sto
ck;
U,
unus
edw
ell.
Oth
er d
ata
avai
labl
e: A
ddit
iona
l ba
sic
data
ava
ilab
le i
n th
e fli
es o
f th
e G
eolo
gica
lSu
rvey
: C
, ch
emic
al a
naly
sis;
L,
dril
ler's
log
.
Wel
l
41/5
- 4D
1. ...
...
4N
1.......
9F
3
42/5
- 8E
1........
8P1.
.. _ ..
12
C1
20J1
. .......
23J1
-
26
A1
26
R1
...
28
D1.
...
...
33
M1
....
...
33
M2
....
...
42/6
- 3L
1_,._
_._
_
8H
1.......
9F
1.
..
Ow
ner
or t
enan
t
Lee
Bry
an. _
________
. do
J. W
. K
ing . .
W.
H.
Kin
g..
....
... .
.... ..
.
M.
L.
Bri
dwel
l. ---
D.
C. S
hell
ey... ..
....
...
Yea
r co
mpl
eted
1950
... ..
....
. .1
95
2...........
1953 -
19
53
...........
1946
-
19
50
.
19
41
Old
..
Old
....
....
...
1950
Alt
itud
e of
la
nd-s
urfa
ce
datu
m
(fee
t) 3,08
6
3,16
1
3,20
7
2,71
2 2,
708
2,93
3 2,
882
3,22
5 3,
218
3,34
5 2,
930
3,04
1 3,
041
2,79
6
2,98
1 2,
956
Dep
th(f
eet) 20 68
31
5 40 205
205
160 32
148 28 147
Typ
e of
w
ell
Du
Du
P P
P
P P
P
P P
P Du
Du
Du
P
Dia
met
er
of w
ell
casi
ng
(inc
hes) 24
6 16
20 8 16
16
20 6 10
48 10
Wat
er le
vel
Dat
e m
easu
red
4- 2
-53
10-2
5-53
5-
4-5
4 4-
2-5
310
-25-
53
5- 4
-54
4- 2
-53
10-2
5-53
5-
4-5
4 5-
20-5
4 5-
20-5
4
4- 2
-53
10-2
5-53
5-
4-5
4 6-
15-
54
6-15
-54
6-15
-54
4- 2
-53
10-2
5-53
5-
4-5
4 4-
6-5
3 10
-19-
53
5- 3
-54
10-3
1-53
12
-11-
52
4- 6
-53
10-3
1-53
5-
3-5
4
Dis
tanc
e ab
ove
(+)
or b
elow
la
nd-s
urfa
ce
datu
m
(fee
t) 2.5
2.5
1.9
4.0
3.3
3.3
7.8
8.2
4.1
5.7
3.3
6.2
6.4
3.8
130 90
96 6.75
6.
10
6.60
7.
80
25.0
9.
30
9.10
24
.9
25.9
26
.0
27.5
Dis
ch
arge
(g
pm)
1,00
0 80
0
1,00
0 60
0 1,
500
400+
Dra
w-
dow
n (f
eet) 15
17
0 44
40
25 8
Use
of
wat
er
D
D
D D
I I D I I D
D U D D
I
Oth
er
data
av
aila
ble
C
C
C L
C L
L
L
C
C C
C
CO

TAB
LE 19.
Des
crip
tion
of
wat
er w
ells
in
the
Shas
ta V
alle
y ar
ea,
Cali
forn
ia C
onti
nued
Wel
l
42/6
- 9N
2___
__ -
10J1
-
43/4
- 2E
1.......
3A
1...... ..
3A
2..
_
4J1-
- ...
4R
1 -
1
0A
1........
10E
1_. ......
43/5
- 3C
1___
.___
_
4G1_
_.._
__
8R
1_
....
..9C
1.._
____
.
19
F1_
....
..19
L1_
_....
..23
AL
. ......
23M
1.......
43/6
- 3D
1. ...
...
3L1
. ...
10K
1. ...
...
10Q
1_.......
15
F2_
_......
21E
1___
.....
Ow
ner
or t
enan
t
.....d
o..-.
... .. ...
... .
d
o
-. d
o__. -
H.
J. H
ight.
...
....
. ........
K. W
ate
rs..................
....
.do
. ..
....
....
....
....
.- do .
Yea
r co
mpl
eted
19
46
. .
19
50
.
Old
....
....
.. .
1953
1954
1954
..
.
1954
Old
. -
Old
.
Old
Old
...... ..
...
1949 .
.....
1954
1953
1952
-
1952 ..
1952
Alti
tude
of
land
-sur
face
da
tum
(fe
et)
2,95
8
2,84
1
3,32
5 3,
380
3,38
0 3,
075
3,05
0 3,
215
3,10
0 2,
616
2,59
2
2,60
0 2,
601
2,63
8 2,
628
2,68
7
2,66
8 2,
610
2,58
8
2,63
8
2,63
5 2,
663
2,75
8
Dep
th
(fee
t) 12
110
175
119
105
203
300
285
335 16 10
10
0±
44
64 27 105 92
94
125±
Typ
e of
w
ell
Du
P P P P P P P P P P Du
P
Du
P P P P P P
Dia
met
er
of w
ell
casi
ng
(inch
es) 6 16
10 16
16
10 10 10
6 6 36
0 8 8 10 16 14
14
Wat
er le
vel
Dat
e m
easu
red
4- 6
-53
10-3
1-53
5-
3-5
4 4-
6-5
3 10
-31-
53
5- 3
-54
9- 3
-54
7- 5
-54
4- 2
-53
10-2
5-53
5-
4-5
4 4-
2-5
3 10
-25-
53
5- 4
-54
5-14
-54
4- 2
-53
5- 4
-54
5-14
-54
5-14
-54
4- 2
-53
10-2
5-53
4- 6
-53
5- 3
-54
4- 6
-53
5- 3
-54
4- 6
-53
10-3
1-53
5-
3-5
4
Dis
tanc
e ab
ove
(+)
or b
elow
la
nd-s
urfa
ce
datu
m
(fee
t) 6.0
6.2
4.7
6. 2
9.
3 2.
9
Flo
win
g
3.45
11.6
9.
9 10
.5
6.8
6.7
6.5
4.9
12.9
5 9.
6 12
.00
.4
32.9
34
.7 2.5
2.5
9.75
10
.50
51.7
46
.4
46.4
Dis
ch
arge
(g
pm)
400
Flow
ing
13
200 10 840
120
Dra
w
dow
n (f
eet) 30 59
Use
of
wat
er
D
D I I U
U u 8 U u u D
D U
D D
D
D 1,8
1,8
I D
Oth
er
data
av
aila
ble
O L
L
L
L L O O O
L
C L L,
O
L,
O
O
00
O

91 T
1
21
J2
.
99
A 1
22P
2-. ...
...
23N
1. ......
23
N2
....
...
29Q
1..._
.__
29Q
2.-
30K
1___
._._
33J1
. ---
----
44/4
- 5F
1.__
5K1.
...
...
8P
L .._-.
.8K
1-
17P
1.... .
18F1
18
Q1
----
44
/5-
1J1_
_
1J2.
._.._..
1J3
.. - .
1R
1. .
...._
2K1.
__
__
2Q1.
......
2R
1._
.._
._4
01.......
11M
1_......
12L
1........
.__
..d
o_
_ .
....
....
....
....
.
....
.do.-
.. . -
.d
o-.
. ..
..
C
lela
nd
.. ---
--
.-.d
o.-
--do..... - -
-do--
-
--.d
o.-
. - --
_
-.d
o. --
- do.-
..-. ..
.d
o--
.
-do-...-
R.
E. H
art
--.d
o.-
-.-.
..
....
---d
o.. .
..d
o--.-
-
.d
o-.
..
--
do.. . -
19
51
1952
1952
1952
.. __
____
___
19
22
-..
.
1930.-
-
19
36
-
1950
.
19
27
---
----
19
37
19
51
.
1942
1950--
----
----
1951
- - -
1951
-- _
_._
--.
1950
.. -
1927
.- _
---
--
Old
.
Old
..--
- -
1952-.
---
----
-
2,72
9
2,73
3 2,
665
271
*\
2,67
2
2,67
6
2O
CQ
2O
CQ
2Q
ftft
2,75
2
3,04
03,
025
317K
2Q
AA
2 78
02
OO
K
2,77
4
2,77
1
2,76
2
2,76
52,
698
2,69
9
2,72
02
Cft
ft
2,74
2
203
250
100 36 100 50 440
1 ^ft
1 *i
7
60 i f^n
*JQ
K
275
8pn
94
fi
165 59 135 62 80
±
120
P P
P P P P P P P P P R P R P P P P P P P Du
Du
16 16
16 14 14 10 8 10 8 6 12 18 16 18 18 16 10 60 48 16
7-20
-53
11-1
6-53
11-1
6-53
12
-11-
52
10-3
1-53
5- 3
-54
4- 6
-53
5-11
-53
12-1
1-62
5- 3
-54
12-1
1-52
1f
t ^i
^
5- 3
-54
1 9_
1 1 _
£9
4- 6
-53
4- 6
-53
12-1
1-52
7- 7
-54
12-1
0-52
4-
8-5
35-
6-54
12-1
0-52
12-1
0-52
4- 8
-53
5-14
-54
4- 8
-53
5-12
-54
4- 8
-53
4- 8
-53
5-14
-54
33.4
32.3
533
.15
4.8
4.8
5.1
3.1
10.8
7.3
7.3
7
Q
7.3
3.2
2Q
27
77.1
80.1
Cft
C
OO
A
80.1
13.5
12
.4
9.5
4.7
4.8
2.3
1.3
2.8
1.7
12.4
10.0
2.2
1.9
1.3
1.2
10.7
5.8
6.5
40.3
41.7
200
800
1,40
0
800
2,00
0
100
150
300
400 50
60 25
0
125
100
100
1,00
0
900
76 5 60
____
____
_ 10 74 58 20 47 38 60 55 32 15
TT I I TT r> i i TT T S I T T TJ S TT TT TT I I T I TT P TT TT T
L,
C
L
H 00

TAB
LE 1
9.
Des
crip
tion
of
wat
er w
ells
in t
he S
hast
a V
alle
y ar
ea,
Cali
forn
ia C
onti
nued
Wel
l
44/5
-12Q
1 .
....
14
M1
-. _
18B
1___
_ ...
.
22
P1. ...
.2
4R
1._
__
...
28
IU--
28L
1..._
...
.32C
2..
....
.
34C
1_. .
....
.3
4G
1-.
....
.
34H
1. ......
34J1
... _
-.
34N
1-.
34Q
1........
35C
1.... _
_
35
F1
..._
_ .
35L
1.....
..35L
2 .
_ -
36L
1.... _
. 44
/6-3
Dl.
...
....
3M
1-.
.. ...
.10
F1.
...
....
Ow
ner
or t
enan
t
E. H
. Wil
liam
s....
.. _
_ ..
W. S
terc
hi.. _
_ ..
. _ . _
..
....
do
... ..
. ..
. ..
. ..
.... d
o. . .
A. J
. Q
uadr
os _
__
__
__
__
A.
S. Q
uadr
os- _
_ . _
___
Z
edik
er...
__
__
..
....
R.
E.
Hog
an _
__
. _.... .
Yea
r co
mpl
eted
1954
. ...
....
...
1954
. __ . _
..19
53. _
__
. ..
.
1954
. __
_ . ..
.19
50. -. _ .
1952
. ...
....
...
19
52
... ..
....
.
1952
. ...
....
Old
.. ..
.
19
51
....
... _
. O
ld.-
- _
_ - ...
1954
. ........
1953
. ..........
19
53
. ...
....
1949
. ..........
Pri
or
to 1
881
- .
1953
. __ ..
...
19
52
. -. .
Alti
tude
of
and-
surf
ace
datu
m
(fee
t) 2,74
8 2,
670
2,61
0 2,
675
2,66
2 2,
793
2,63
2 2,
610
2,58
3 2,
611
2,63
2 2,
628
2,63
7
2,64
0
2,60
6
2,62
5 2,
627
2, 6
57
2,64
8 2,
660
2, 7
35
2,47
0 2,
525
2,53
7
Dep
th
(fee
t) 105 85
33
5 80
700±
20
0 64
80
150
137
132 96
104 55 131 65
76
14
9 45
0 40
113
Typ
e of
w
ell
P
P P P P P P P P P P P P P P P P P P
diam
eter
of
wel
l ca
sing
(in
ches
) 14 8 16 12
14
16 6 14 20
16 16
16 16
16 16
16
16
12 6 8
Wat
er le
vel
Dat
e m
easu
red
6-20
-54
5-12
-54
5-17
-54
5-12
-54
5-12
-54
5-12
-54
5-
5-54
5-13
-54
4- 2
-53
5-
4-54
5-
5-5
4 4-
2-5
310
-25-
53
5-
5-54
11
- 2-
52
4- 2
-53
5-
5-54
12
-11-
52
4- 2
-53
10-2
5-53
5-
5-5
4 4-
2-5
310
-25-
53
5- 4
-55
4-
2-53
4-
2-5
3 10
-25-
53
5-14
-54
5-14
-54
4_ «
-53
10-3
1-53
o-
3-54
Dis
tanc
e ab
ove
(+)
or b
elow
an
d-su
rfac
e da
tum
(f
eet) 68
51.5
18
80
.5
59.2
12
9.7
34.7
33. 0
9.
6 10
.5
20.4
16
.65
11.5
14
.1
28.4
19
.8
28.6
27
.4
28.3
26
.6
27.5
8.
7 7.
4 9.9
16
.5
30.1
5 45
.4
60.9
Flo
win
g
26.3
23
.7
26.1
Dis
ch
arge
(g
pm)
1,00
0
GOO
120
150 10 900
4,00
0
900
1,25
0
1,50
0 1,
300
1,75
0 1,
100
Dra
w
dow
n (f
eet) 15
12 12 10
8 34 41 9 44
20 31
Use
of
wat
er
I U
U
U S I I D
D U U I I I U I I I I I I D D,
S
Oth
er
data
av
aila
ble
L L L L
L C
L,
C
L,C
C L, C L,
C
L
L
L
C
00
bO

10
F3-
lO
Kl. ..
....
14H
1._
15H
1. ......
18M
4..
....
.
20A
1. ......
21K
1-
22K
1- ._
22M
1..
....
.22M
2 .
...
22
Q1
.....
27D
1. ......
27Q
1... ..
...
29D
1. ...
...
34K
1. ......
34K
2.......
44/7
- 3Q
1........
3Q2
.12P
1..
13O
2. ......
13J1
. ...
....
45/5
- 4N
1___
6E1.
......
45/5
- 7H
1. .
7N
1.......
7Q
1.
. ...
18D
1. ...
...
19P
1.. .
.....
21
PL
_..
....
22P1
.23
K1.
......
24K
1. ......
26O
.1.. .
..
A
, o.e
ka f
enne
ls) .
. _
J. P
. H
eft.
.... ..
.... ..
..... .
Bra
hs B
ros.
Inc
.............
Bill
ie A
ram
i. _..............
do
S
Uva
.. ..
....
....
....
....
. B
razi
e...
----
----
----
----
-
W.
G. H
alt
er.
........ .
..H
. I.
McG
raw
. .............
Tom
Wil
liam
s.... _
_ ..
K.
D. D
ud
ley
.
Schl
ich te
r...
....
....
....
... .
19
51
Old
... ..
...
Old
..
.. ..
.O
ld. .
....
....
.
Old
....
.. .
.
Old
... ..
...
Old
....
. .
.
19
54
......
19
54
..
Old
...........
Old
. . .
Old
..... .
....
.
1954...........
19
53
1947
. ..
..1
94
6
1880 .
.......
19
49
...........
1950...........
1925 -
Old
... .
.. ..
. _.
1870
-
19
00
Old
...... ..
2,52
32,
533
2,51
22,
533
2,79
2
2,68
4
2,622
2,56
02,
590
2,60
0
2,56
02,582
2,558
2,79
8
2,574
2,574
2,78
02,
760
2,880
2,75
3
2,82
4
2,770
2,63
52,
655
2,618
2,673
2,645
2,58
42.694
2,71
02,798
2,865
0 719
28 300 12 230 25 45 49 29 135 41 40 15 80 57 140
175 95 46 22 56 21 125
168 31 20 42 fin
P P P Du
P Du
P P P P P Du
Du
Du
P P P P Du
P P Du
P P Du
Du
Du
Du
Du
Du
6 6 8 48 8 48 6 8 12 6 6 48 48 48 6 6 12 6 48 6 6 24 8 6 30 48 48 48 48 48
4- 6
-53
10-3
1-53
5- 3
-54
4- 6
-53
4- 6
-53
10-3
1-53
5- 3
-54
4- 6
-53
5- 3
-54
4- 6
-53
10-1
9-53
5- 3
-54
4- 6
-53
10-3
0-53
5- 3
-54
10-3
1-53
5-12
-53
5- 7
-54
4- 6
-53
10-3
1-53
5- 3
-54
4- 6
-53
5- 3
-54
4- 6
-53
4- 6
-53
10-3
1-53
5- 3
-54
4- 6
-53
10-1
9-53
5- 3
-54
4- 7
-53
4- 7
-53
4- 8
-53
4- 8
-53
5- 7
-53
5- 5
-54
7.9
9.8
11.5 7.70
5.10
4.40
4.90
38.5
538
.7 6.85
11.8
96.
420
.721
.118
.8
13.7
8.00
3.4
4.7
2.7
2.1
8.8
9.1
5.10
17.7
19.5
16.0
24.8
27.4
24.2 8.9
5.2
24.5
19.2
11.8
26.5
31.1
20 50 25 10 10 15 225 10 10 13
7 90 9 16
D D D S D U D D I, D
, S
U D D I U U D D D I D D S, I
, D
U D D D,I
D D,
SD D D D
, S
D
L,
CC L O L O
C
I F 00
CO

TAB
LE 19.
Des
crip
tion
of
wat
er w
ells
in t
he S
hast
a V
alle
y ar
ea,
Cali
forn
ia C
onti
nued
Wel
l
45
/5-2
7A
1
28
D1
._ _
_28
M2.
__
-
29B
1. .
29
B2
__
_ .
.33B
1__
3401........
35N
1..
36D
1- .
36E
1
36N
1--
-
45/6
- 1H
1-
2Q
1____
3Q
1._
10A
1_
10
G1
-
14
P1
...
-15F
1. -
Ow
ner
or t
enan
t
Bra
ce M
. L
ong.
.. ..........
L.
P. D
unla
p- _
_______
LeR
oy M
ille
r.. .
............
R.
E. H
art
. -
Oliv
er L
ane_
-. .-
H
ale
y -
Ver
non
Schw
anke
__
__
__
C
row
ell- _
....
....
....
..
Yea
r co
mpl
eted
19
45
.
Old
..... -.
1852
..... ..
....
1947
.- _
. _ .-
19
54
1954
-
1954
. ......
1948
Alt
itude
of
land
-sur
face
d
atu
m
(fee
t) 2,72
3
2,66
2 2,
618
2,63
5
2,93
5 2,
622
2,65
8
2,70
0
2,74
5 2,
745
2,72
1
2,62
0
2,63
1
2,64
5
2,66
2
2,57
5 2,
585
Dep
th
(fee
t) 30 183+
14 25 20
16
10
0 80
85
35 176 8
120 70
37
Type
of
wel
l
Du
P
Du
Du
Du
Du
P P
P P
Du
P Du
P
Du
Dia
met
er
of w
ell
casi
ng
(inch
es) 48 16
60 60
16 8 6 10 6 8
Wat
er le
vel
Dat
e m
easu
red
4-
8-53
10
-19-
53
5- 5
-54
5- 5
-54
4-
8-53
5-
6-5
4 4-
8-53
10
-19-
53
5- 5
-54
4-
8-53
12
-10-
52
4- 8
-53
5- 6
-54
4- 8
-53
10-1
2-53
5-
14-5
4 6-
30-5
4 6-
3-5
4 4-
8-5
3 5-
6-5
4 7-
20-5
3 11
- 3-
53
4- 7
-53
10-2
4-53
5-
6-5
4
4-
7-53
5-
6-5
4 4-
7-53
10
-24-
53
5- 6
-54
4- 7
-53
10-2
4-53
5-
6-5
4
Dis
tanc
e ab
ove
(+)
or b
elow
la
nd-s
urfa
ce
datu
m
(fee
t) 21.9
0 18
.55
18.1
0 24
.3
8.6
7.8
21.3
17
.65
22.0
8.40
.6
0 .5
0 .3
0 2.
30
4.19
3.
30
18.4
6 20
.00
11.4
0 10
.80
.75
2.50
14
.40
15.0
0 16
.40
3.50
7.
40
16.6
0 18
.90
19.3
0
21.7
0 19
.50
22.0
Dis
ch
arge
(g
pm)
250 15
20 20 60
Dra
w
dow
n
(fee
t) 70
Use
of
wat
er
D S D,
S
D
D
I U D
D
D U
D D
D,
Q
D D,
S
Oth
er
data
av
aila
ble
C C C C C C L
L C L C C L C
GO
0 o

17
F1
_.
17F
2
18K
1._ .
19E
1 -
19H
1-
20
P1
.....
2201
23E
1 .
....
26C
1 .
.. _
_2
6D
1..
_
26D
2 _
27A
1
27
E1
-
28 U
28
B1
- ...
29K
1._
30D
1__ _
32K
1-.
..
33
E1
45/7
-14N
1...
24R
1_ .....
25N
2.-
26
P1
... .....
27
R1
-
27R
2-
33
A1
34K
1-.
35B
1 ..
.36
D1.
_
36
D2
.... ..
.3
6L
1..
. _ ..
do
-.-
do -
Jack
Chu
rchi
ll..-
.- _
..K
. R
. C
ain
e .
.. _
_
Cit
y of
Yre
ka.
.. ..
... .
....
.
__
do _
____ _
__
__
_
Ass
oc.
1951
1951
.
1950
1954
Old
..
.....
1948 _
1942
.
-tf\
AK
19
45
.
1Q
J.7
iQcq
19
51
- _ - _
-1
95
4..
.
1Q
17
2,47
5
2,47
52,
442
2,53
8
2,49
02,
453
2,48
62,
543
2,56
52,
640
2,61
52,
615
2,56
02,
529
2,52
3 2,
518
2,49
8
2,55
0
2,57
2
2,56
52,
549
2,64
3
2,69
0
2,65
52,
740
2,70
1
2,76
5
2,68
52,
672
63 75 75 425 78 28 150
110
160 40 116 42 51
20 12 30 26 235 57 159
101 26 140 38 400
307 16
P P Du
P Du
Du
Du
Du
P P P P P P P
P Du
Du
Du
Du
Du
P P P P Du
P P P P Du
8 8 16 8 6 6 6 8 8 6 6 48 48 48 48 96 16 6 12 12 72 10 t> 12 12 48
4-
7-53
10-2
4-53
5- 7
-54
5- 7
-53
4-
7-53
10-2
4-53
5- 6
-54
4-
7-53
10-2
4-53
5- 6
-54
4-
7-53
4-
7-53
5- 7
-54
5-
6-54
4-
7-53
10-2
4-53
5- 6
-54
7-14
-53
6-15
-54
4-
7-53
10-2
4-53
5- 6
-54
4- 7
-53
5- 6
-54
4-
7-53
4-
7-53
10-2
4-53
5-
6-54
47
t\H
4-
7-53
6-15
-54
8-15
-54
6-15
-54
4-
7-53
5- 6
-54
15.5
015
.50
16.4
017
.60
20.7
020
.40
5.60
14.4
013
.60
1.90
4.60
4.70
4.60
7.50
21.5
320
.04.5 5.4
6.0 7.2
7.6
24.7
6.4
6.4
5.9
8.7
6.8
1.05
3.5
6.00
8.8
3.9 7.9
4.6
1 2 5 1
1,20
0 H
300
128 10 1
5
110 3
I, S
I, S
U D U D D D D D D D U S D D D,
S
D M U I U M I, D
D U D U
C c C
L,C
I 00

TA
BL
E 19.
Des
crip
tion
of
wat
er w
ells
in t
he S
hast
a V
alle
y ar
ea,
Ca
lifo
rnia
Co
nti
nu
ed
Wel
l
46/5
-7G
1-- ..
7TT1
7P
1
8P
2..
. ...
...
18L
1. ...... .
21J1
30P
1-
...
.3
1F
1 .
.. ..
46
/6-2
4E
1 -
25
B1
... .
.. ..
25D
1.......
25H
1. ......
Ow
ner
or t
enan
t
V.
C.
Stu
art.
...
... _
---
--
-d
o
do ............. .
......
Yea
r co
mpl
eted
Old
. . ..
. .
1940 .
19
50
1953
.. ..
....
. ..
1951
- -
Alt
itud
e of
la
nd-s
urfa
ce
datu
m
(fee
t) 2,38
2 2,
415
2,43
7
2,42
5
2,55
0
2,56
8
2,67
5 2,
655
2,60
0 2,
600
2,62
5 2,
700
2,66
0
Dep
th
(fee
t) 22 200
200
237 9
150 75
100
220 90
23
5
Type
of
wel
l
Du
P P P P Du
P P P P P
P P
Dia
met
er
of w
ell
casi
ng
(inc
hes) 8 6 6 16 10
fi 8 10 8 6 12
Wat
er l
evel
Dat
e m
easu
red
5- 6
-53
5-
6-53
4-
9-5
3 10
-24-
53
5- 7
-54
4- 9
-53
10-2
4-53
5-
7-5
4 4-
9-53
10
-24-
53
5- 7
-54
4- 9
-53
10-2
4-53
5-
7-5
4 10
-4 -
54
5- 7
-53
5- 6
-53
4- 9
-53
5-
7-53
5- 7
-53
Dis
tanc
e ab
ove
(+)
or b
elow
la
nd-s
urfa
ce
datu
m
(fee
t) 10.2
17
.4
3.5
3.8
4.2
18.0
26
.7
16.7
16
.8
19.0
17
.6
4.7
4.8
5.6
6.9
15.0
26
. 4
Flo
win
g
8.0
7.9
Dis
ch
arge
(g
pm) 75 400
Dra
w
dow
n
(fee
t) 65
Use
of
wat
er
D
D
D S u S D,
IU
D
D I
Oth
er
dat
a av
aila
ble
C L,
C
C L
C
C
L
C
00

QUALITY OF WATER 87
TABLE 20. Weekly water-level measurements in u'ells, in feet below land-surface datum, in the Shasta Valley, Calif.
[Symbols preceeding water-level measurements refer to pumping operations, a, pumping; b, well nearbypumping; c, recently pumped]
Date Water level Date Water level
42/6-3L1
[M. L. Bridwell. Measuring point, top of well, 1 ft above land-surface datum which is 2,796 ft abovesea level]
1953 July 16 ______________July 20 ---------------July 27 ______________Aug. 3__ _________________Aug. 10 -- -_- ___Aug. 17 -_ __- Aug. 24______. __._._._._Aug. 31_____ .._-________
7. 28a 9. 70
7 QO6. 667 "iQ
13. 8017. 6420. 15
1953 Sept. 14___._..._ _.--__.Sept. 21 --_--_- --_.Sept. 28 -------------Oct. 5 -_- -_- ---_Oct.-12 _-_----_--__---Oct. 19._..__. _.-_______.Nov. 16. ______ _ _-. _ _
23.0023. 8524. 5625. 1025.4224.0023. 30
42/6-9F1
[D. C. Shelley. Measuring point, top of casing northwest side, at land-surface datum which is 2,956 ft abovesea level]
1953 July 16 -- July 20 - ___--- July 27 __ _Aug. 3_. ___ _Aug. 10_ -------_---___Aug. 17 __ _ Aug. 24__. _ _-_ _- Aug. 31___ _____________ _
20. 6721. 1620. 9420. 2021. 7021. 9822. 3722.85
1953 Sept. 14_. ___..-_-.__ _ .Sept. 21--_---_------ -_-Sept. 28------. _ .- __ _Oct. 5____ ---------------Oct. 12__ Oct. 19..-.---- _ -------Oct. 31.. ------------Nov. 16 --_----
23. 7224. 1524. 5624. 8225. 2025. 6026.0026. 10
42/6-10J1
[Q. Q. Maxwell. Measuring point, top of casing, at land-surface datum which is 2,841 ft above sea level]
1953 July 16 July 20 July 27 -_-__--___.___Aug. 3 _______________Aug. 10 -- --- -Aug. 17 Aug. 24-____ ____________Aug. 31-. _______________
3. 053. 725. 285. 75
a 11. 455. 605. 946. 70
1953 Sept. 14 ------------Sept. 21 --------------Sept. 28 --------------Oct. 5 --------------Oct. 12- --------------Oct. 19-. ..---__- _ -----Oct. 31... ---------------
7.708. 309. 00
14. 209. 809. 609. 30
43/6-21 Jl
[Dougherty & Son. Measuring point, top of casing, 1.9 ft above land-surface datum which is 2,729 ft abovesea level]
1953 Julv20 - _July 27. _ ______________Aug. 3 _______________Aug. 10 -- _Aug. 17 _______________Aug. 24 _ __ __ ___ _Aug. 31_--_ ._--__._..__.Sept. 14 _ _
b 31. 50b 31. 26
30. 50b 30. 30
30. 90b 31. 20b 30. 64b 31. 47
1953 Sept. 21- -------------Sept. 28 ..-. __--__--__Oct. 5_-_ ________________Oct. 12 Oct. 19 ______________Oct. 31 --------------Nov. 16-. --------------
31. 8531. 1030. 5330. 4030. 4530. 6030. 45
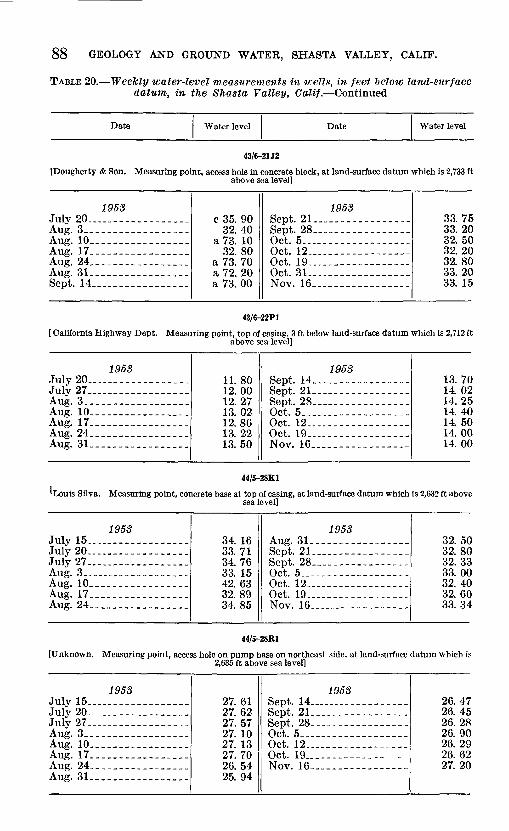
88 GEOLOGY AND GROUND WATER, SHASTA VALLEY, CALIF.
TABLE 20. Weekly ivater-level measurements in wells, in feet below land-surface datum, in the Shasta Valley, Calif. Continued
Date Water level Date Water level
43/6-21J2
[Dougherty & Son. Measuring point, access hole in concrete block, at land-surface datum which is 2,733 ftabove sea level]
1953 July 20.. ...--_.__.__..._Aug. 3_--___.___. .__..__Aug. 10_--___. _________Aug. 17__. ._..__. ___..._Aug. 24__. ______________Aug. 31-----__ ________Sept. 14_________. _______
c 35. 9032. 40
a 73. 1032. 80
a 73. 70a 72. 20a 73. 00
1953 Sept. 21-____---__-- --Sept. 28_ __ _-. _---_ __Oct. 5 Oct. 12.___ ____ _______Oct. 19 Oct. 31 . Nov. 16___ _ ___________
33. 7533. 2032. 5032. 2032. 8033. 2033. 15
43/6-22P1
[ California Highway Dept. Measuring point, top of casing, 3 ft below land-surface datum which is 2,712 ftabove sea level]
1953 July 20...._ _____ ______July 27 Aug. 3--__---.__________Aug. 10__ _----_--__-___Aug. 17______. __________Aug. 24__________ ______Aug. 31
11.8012. 0012.2713. 0212.8613. 2213. 50
1953 Sept. 14_._________--___-Sept. 21 Sept. 28_ -------------Oct. 5 _ -----. ------Oct. 12-.-.. _ ____--___.Oct. 19---. _ -_-._---_._Nov. 16 ____ -------
13. 7014. 0214. 2514. 4014. 5014. 0014. 00
44/5-28K1
'Louis Silva. Measuring point, concrete base at top of casing, at land-surface datum which is 2,632 ft abovesea level]
1953 July 15.... ... _________July 20--. __ ---_--.____July 27 Aug. 3 Aug. 10 Aug. 17 Aug. 24_________________
34. 1633.7134. 7633. 1542. 6332. 8934.85
1953 Aug. 31 Sept. 21 ___ _---__-___-Sept. 28____ _ -_-----_._Oct. 5 Oct. 12 Oct. 19, ----__--------__-Nov. 16--.-.------- _ -.-
32. 5032. 8032. 3333. 0032. 4032. 6033. 34
44/5-28R1
[Unknown. Measuring point, access hole on pump base on northeast side, at land-surface datum which is2,635 ft above sea level]
1953 July 15.. ..-_--___-_.__._July 20 July 27 Aug. 3 Aug. 10 Aug. 17 .---_-_-____Aug. 24___. _____________Aug. 31
27. 6127. 6207 K7
27. 1027. 1327. 7026. 5425.94
1953 Sept. 14.. -Sept. 21 _ ------- -.Sept. 28 -------------Oct. 5 Oct. 12 _______ ___ _-Oct. 19 ._ _ -_-__-_-Nov. 16 _ ---_---_-_
26. 4726. 4526. 2826. 9026. 2926. 6227. 20

QUALITY OF WATER 89
TABLE 20. Weekly water-level measurements in wells, in feet "below land-surface datum, in the Shasta Valley, Calif. Continued
Date Water level Date Water level
44/5-34C1
[Tony Pimental. Measuring point, top of casing, 1 ft above land-surface datum which is 2,631 ft above sealevel]
1953 July 15.. _________________July 20-- ____----_---July 27 _______________Aug. 3 Aug. 10 __---_ _-__ _Aug. 17 Aug. 24____. ______ ___ _Aug. 31 Sept. 7
17. 4813. 7415. 7015. 6414. 0812.7514. 0512. 9013. 37
1953 Sept. 14 Sept. 24 ___ _---_ _-_ _Sept. 28 __ _ _---_ -----Oct. 5 ------------Oct. 12-..,-- . __- -----Oct. 19--... -.- _ -.- .Oct. 26-.-._ ----- - - _Nov. 3 _ - - - - ___Nov. 16__ _ __ ----- -
14. 3013. 1814. 0213.0514.8215. 8416.4717. 1017. 98
44/5-34H1
[Henry Silva. Measuring point, pump base north side, at land-surface datum which is 2,637 ft above sealevel]
1953 July 16. .--_-_-__---.____July 20 _ _July 27 Aug. 3---.. .-_-__- ___ _Aug. 10 -- _ __-______-Aug. 17 Aug. 24__ ____ _ __Aug. 31 -__-__--_ -----
29.0227.3726.98
a 33. 8826. 40
a 33. 55a 33. 64
25. 40
1953 Sept. 14 Sept. 21 --_-_ - Sept. 28. _ __-----__-_ .Oct. 5______ _ ___ --. .Oct. 12.-. --------------Oct. 19-_------ ---------Nov. 16
26. 0025.8026. 4026. 7026. 9027. 4228. 30
44/6-18M4
[J. P. Heft. Measuring point, top of casing, 1 ft above land-surface datum is 2,792 ft above sea level]
1953 July 15 July 20-, .__--__-_-__.__July 27 Aug. 3_ _________________
39. 46a 41. 78
39. 1841. 60
1953 Aug. 10_____ ------- --Aug. 17 Nov. 16 _ ---. _-- . __
42.0638.7039.90
44/6-20A1
[Dr. Charles Orr. Measuring point, top of wooden cover south side, at land-surface datum which is 2,683ft above sea level]
1953 July 15____ .July 20-- July 27 ------Aug. 3 Aug. 10 .- ,_ --.____._Aug. 17 Aug. 24 _ __ _ __Aug. 31.-- _--___ _ . ..
7.497.658 148.909. 009. 259. 609.90
195S Sept. 14-_ -----------Sept. 21- -------Sept. 28_._ __ - __Oct. 5_-_._ ___ - _____Oct. 12-- - ---- --------Oct. 19__- . _______ .-Nov. 16
10.6010.8811. 1211.3811. 6511.8912.30

90 GEOLOGY AND GROUND WATER, SHASTA VALLEY, CALIF.
TABLE 20. Weekly water-level measurements in wells, in feet below land-surface datum, in the Shasta Valley, Calif. Continued
Date Water level Date Water level
44/6-21K1
[Brahs Bros. Inc. Measuring point, wooden base of pump west side, at land-surface datum which is 2,622ft above sea level]
1953 July 15-._ - _ ___July 20_-_-_---_________July 27___-__----_--.___Aug. 3-_ -- _- __.Aug. 10 __---_ _______Aug. 17_----____________Aug. 24 _______________Aug. 31---.-- ___ _____
14. 6317. 5610.0711. 6613. 9816. 66
9 1013. 22
1953 Sept. 14 _ _ Sept. 21_ _ __._-___._--_Sept. 28 __ .-...____....Oct. 5---_--------------Oct. 12.. ..__--.._-__---Oct. 19_. .__-..---------Oct. 31. ----------------Nov. 16 --------------
8. 9E11. 7013.4215. 3C17. 1518. 5021. 1C23. 15
44/6-22M2
[Billie Arami. Measuring point, top of casing concrete base, at land-surface datum which is 2,600 ft abovesea level]
1953 July 15-----__ _ -__July 20-.- __ ____ __July 23--- Aug. 3-_-----_-_._______Aug. 10 --_____- -__-_Aug. 17_-_--_____-_.____Aug. 24 -.- _ _______ _Aug. 31 --_.-.--.__.._.Sept. 14__.___. _______ __Sept. 21_______________
4. 745. 521. 282. 724. 125. 381.202.24
Q^2 on
1953 Sept. 28 --------------Oct. 5__. ---------------Oct. 12_. _______________Oct. 19____ _-_ -- Nov. 16 -------------
1954
3. 605. 056. 367.50
10. 20
3. 40
44/7-13J1
[Raymond Black. Measuring point, wooden floor below pump, at land-surface datum which is 2,824 ftabove sea level]
1953 July 15--_----__ ______Julv 20. ._-__..._.___July 27_._--_-__________Aug. 3.. ________________Aug. 10_________________Aug. 17_.__.__. _______Aug. 24_. _._ _____ ____Aug. 31_______._________
25. 69 25. 75 25. 90 26.00 26. 12 26.30 26. 38 26. 53
1953 Sept. 14 -- - -_ Sept. 21 _. ---Sept. 28 __------------Oct. 5-_----------- __ -Oct. 12___---__----_-_-_Oct. 19_-_----_-_-------Nov. 16 -----
26. 77 27.00 26. 99 27. 15 27. 40 27. 42 27. 70
45/5-19P1
[R. D. Dudley. Measuring point, at base of pumphouse north side, 0.7 ft above land-surface datum which is 2,584 ft above sea level]
1953 July 14_._______________July 20____-_-___.____July 27_________________Aug. 3_. ________________Aug. 10-____________ __Aug. 17___. __________Aug. 24_ __ __ __ _Aug. 31_-___-___________
4. 68 a 5. 26
3. 25 4. 34 3. 77 4. 25 3.28 3. 50
1953 Sept. 14 _ _ -__ -Sept. 21 __----_- Sept. 28 -- - -- Oct. 5__-_ --------------Oct. 12. ---------------Oct. 19__-----_~ -----Nov. 16 -------------
4.00 4. 43 4. 404. 47 4. 42 4. 48 4. 37

QUALITY OF WATER 91
TABLE 20. Weekly iva-ter-level measurements in wells, in feet below land-surface datum, in the Shasta, Valley, Calif. Continued
Date Water level Date Water level
45/5-21P1[S. O'Connor. Measuring point, top of brick casing, 5 feet above land-surface datum which is 2,694 ft above
sea level]
1953 July 14. ________________July 20_----_-__________July 27____-__-__-______Aug. 3--------------_.__Aug. 10 ----------- _ _Aug. 17 Aug. 24______-__________Aug. 31
13. 93 13. 19 13.05 13. 74 13. 27 14. 00 14.00 13. 30
195S Sept. 14_____.___________Sept. 21. __ --___-_..._.Sept. 28 - _--- Oct. 5_-----------------Oct. 12____ -. --Oct. 19--_ ---------Nov. 16 --------------
15.00 15. 82 16.48 16. 95 17.85 18. 60 21. 10
45/5-23R1
[Ray Soule. Measuring point, floor of pumphouse, 1 ft above land-surface datum which is 2,798 ft above sea level]
195S July 14_________________July 20__-_-----________July 27.. _______________Aug. 3-- ---- --_Aug. 10 - _ Aug. l7--_-____--_._____Aug. 24_________________Aug. 31
9.92 9. 72
10. 56 9.68 9. 65
a 10. 42 9. 84
10. 65
1953 Sept. 14.. _.---- -__ _--Sept. 21._ ______-__--_Sept. 28 ___ -______---__Oct. 5- -Oct. 12... .__._-_-__-__Oct. 19_----------------Nov. 16 --------------
9.77 11.02 12.50 12.82 12.08 12. 68 15.70
45/5-24R1
[Unknown. Measuring point, hole in floor or cover of well, at land-surface datum which is 2,865 ft above sea level]
1953 July 14. ________________July 20_____---___-_..__July 27_____. ___________Aug. 3 _Aug. 10____-____________Aug. 17__ __ ____.Aug. 24__ _ _ _ ._Aug. 31 ---------------
23. 74 23.35 23. 06 23.38 23. 70 23. 85 24. 45 24.33
1953 Sept. 14. _ __ _. _ __ _Sept. 21_---._______ _ -_Sept. 28__ _.---___-----_Oct. 5_-------- Oct. 12.__- --_. __ --_Oct. 19._--------- -----Nov. 16_-------- -------
25. 32 25.98 25. 66 26.03 26. 22 26. 88 27. 60
45/5-27 Al[Ross-Shelley. Measuring point, top of well, 2.5 ft above land-surface datum which is 2,723 ft above sea
level]
195S July 14__. ______________July 20_______________._July 27______.__________Aug. 3 - -- _ Aug. 10 -_ _--________.Aug. 17_________________Aug. 24. _ _ _ _Aug. 31 -.-----.----__.
14. 30 13.55 13.40 14. 59 14. 20 15. 20 14. 10 14. 15
1953 Sept. 14 . _ ----- ---Sept. 21__. _..______-__--Sept. 28 -------------Oct. 5--. -- ---Oct. 12___ --------Oct. 19__- ------Nov. 16 --------------
14.70 14. 60 15. 04 15. 15 15. 72 16.05 16. 72
506344 O 6C
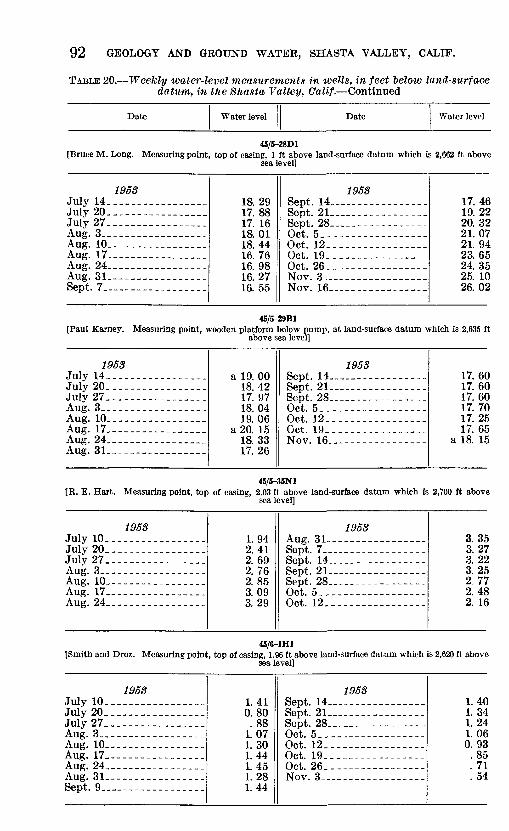
92 GEOLOGY AND GROUND WATER, SHASTA VALLEY, CALIF.
TABLE 20. Weekly water-level measurements in wells, in feet below land-surface datum, in the Shasta Valley, Calif. Continued
Date Water level Date Water level
45/5-28D1[Brace M. Long. Measuring point, top of casing, 1 ft above land-surface datum which is 2,662 ft above
sea level]
1958 July 14. -.---__-.___._..July 20-------------___July 27- Aug. 3__ _-_-__-_....._..Aug. 10.-- - ____ . _ _Aug. 17 Aug. 24 __ --_____ _ _Aug. 31. _ ___-_--_._...Sept. 7. _ . --._-_____.
18. 29 17.88 17. 16 18.01 18.44 16.76 16. 98 16.27 16.55
1958 Sept. 14 Sept. 21_ ..--_---.__-__Sept. 28 Oct. 5.- Oct. 12___ --------Oct. 19----------------Oct. 26.--. -------------Nov. 3-. _-__--_-- . _ _Nov. 16__- ----- -------
17.46 19. 22 20.32 21.07 21. 94 23. 65 24.35 25. 10 26.02
45/5-29B1[Paul Karney. Measuring point, wooden platform below pump, at land-surface datum which is 2,635 ft
above sea level]
1953 July 14-._--_---_---____July 20------_-----_._-_July 27. _.__.._._._.___.Aug. 3_ Aug. 10.-------.---.. -_.Aug. 17 -------_._._._Aug. 24. __- _________ _Aug. 31.-- --_--_.-_____
a 19. 00 18.42 17. 97 18.04 19.06
a 20. 15 18.33 17. 26
1958 Sept. 14. _ __..____.__-_Sept. 21 --------------Sept. 28 ___ ----- _-- _-Oct. 5-. -- - Oct. 12.._ ___ ---------Oct. 19-----------------Nov. 16 --------------
17. 60 17. 60 17. 60 17.70 17. 25 17.65
a 18. 15
45/5-35N1 [R. E. Hart. Measuring point, top of casing, 2.03 ft above land-surface datum which is 2,700 ft above
sea level]
1958 July 10.. _._Julv 20__----_._________July 27.. Aug. 3- Aug. 10------- _-____-_.Aug. 17 Aug. 24_ ---____ _______
1.94 2. 41 2. 69 2. 76 2.85 3.09 3.29
1958 Aug. 31------ ----------Sept. 7 ___ _____-_-____-Sept. 14 -------------Sept. 21 ------------Sept. 28- __ ------------Oct. 5_------------ _ --Oct. 12.-.----- _ _--__-
3.35 3.27 3. 22 3. 252. 77 2. 48 2. 16
45/6-1H1[Smith and Droz. Measuring point, top of casing, 1.96 ft above land-surface datum which is 2,620 ft above
sea level]
1953 July 10-- July 20_ July 27- Aug. 3 Aug. 10.--- -_- _ -.- -_Aug. 17.- ___ -_ ______Aug. 24__-_- ____ ___-_Aug. 31. _ _ . ___-____.Sept. 9 ___ -__ _ _-__-__
1.410.80.881.071 ^n1. 441. 451.281.44
1958 Sept. 14 __ . _ _______ _Sept. 21 _ ..___---____--Sept. 28 ___ ____---___-Oct. 5__ Oct. 12. -__-_-_-- -__- _Oct. 19_----------------Oct. 26-- Nov. 3 ---------------
1. 401. 341. 241. 060. 93.85. 71.54

QUALITY OF WATER 93
TABLE 20. Weekly water-level measurements in wells, in feet below land-surface datum, in the Shasta Valley, Calif. Continued
Date Water level Date Water level
45/6-19E1
[George Weldon. Measuring point, top of easing, 1 ft above land-surface datum which is 2,538 ft abovesea level]
1953 July 13._____ ___________July 20. .._.____._______July 27, _._.__._.______.Aug. 3_.-___ -___ ___Aug. 10____-_ __________Aug. 17___--__-_________Aug. 24______ -__ ______Aug. 31 __ ___
18. 66a 21. 90
19. 7020.7218. 7921.8022. 1921.70
1953 Sept. 14 -_ _ _ --Sept. 21______. __________Sept. 28 _ --_ ____ _ _Oct. 5__ - __ - Oct. 12___ ___ _________Oct. 19-_- _ ----- --_ _Nov. 16_ -------------
20.5522. 5022. 9422. 6220. 1719. 7021.39
45/6-20P1
[Ealph E. Cope. Measuring point, wooden floor of pumphouse, 1 ft above land-surface datum which is2,486 ft above sea level]
1953 July 13______ ___________July 20-____ ___ ___July 27_____ ______ ______Aug. 3 -__ ___Aug. 10--______.________Aug. 17_--___-____-_-.__Aug. 24____ --_____.____Aug. 31 ______ __ ___
2.50c9. 82
6.9812.713.055. 145.574. 04
1953 Sept. 14_ _ ____________Sept. 21 Sept. 28_ ________ .Oct. 5___ __ ___----__-_Oct. 12__ _-. ___ -.-Oct. 19---- - - - Nov. 16-.- ----- -------
6.926. 128. 022.421. 671.571. 65
45/6-20Q1
. B. Fioek. Measuring point, concrete platform top of well, 1 ft above land-surface datum which is 2,449ft above sea level]
1953 July 13_________________July 20. ...-____________July 27________ _________Aug. 3___--__-____._____Aug. 10___-_________.___Aug. 17_____-______-__._Aug. 24 ________________Aug. 31 _ _ ______
4.042 462.801. 563. 153. 15
a 4. 403.72
1953 Sept. 14 -- --- Sept. 21 ______________Sept. 28____ _ _ _ _ _Oct. 5-__ ___ . ___ - _Oct. 12___ - - Oct. 19--- - -Nov. 16 - -
3.002. 502. 173. 603.003.404.70
45/6-24N1
[R. D. Hoopes. Measuring point, top of wooden cover of well, at land-surface datum which is 2,638 ftabove sea level]
1953 July 14_____ ____________July 20. ________________July 27... _----___-.-__.Aug. 3... ..______._.-_..Aug. 10__ ____..._ __ __Aug. 17... _-_______.._..Aug. 24. ....______...._Aug. 31... --_-__--_-_-._
8. 007 8Q7. 988.347.288. 158. 907. 66
1953 Sept. 14 - -_--------_-Sept. 21 -------------Sept. 28- -.-- _ --- _Oct. 5__- -.- ------- _Oct. 12 --- Oct. 19----------------Nov. 16 --------------
a 11. 229.299.469.68
10. 6010. 1811. 26

94 GEOLOGY AND GROUND WATER, SHASTA VALLEY, CALIF.
TABLE 20. Weekly water-level measurements in wells, in feet belwv land-surface datum, in the SJiasta Valley, Calif. Continued
Date Water level Date Water level
45/6-27A1
[Mrs. Rodgers. Measuring point, top of wooden planking over well opening, at land-surface datum whichis 2,560 ft above sea level]
1958 July 13-- _July 20_--_-___--____-__July 27_--__-__-_--_____Atig. 3 - -_Aug. 10_-____..__________Aug. 17 _ __ Aug. 24_________________Aug. 31 .
11.7412. 10
a 12. 3712 4512. 3612. 4812. 5412. 60
1963 Sept. 14 _- __Sept. 21 - Sept. 28 -------------Oct. 5--- Oct. 12__ -_ _-_Oct. 19-.--- - -------Nov. 16 --------------
12.8012. 8412. 9712. 9412. 9813. 0013. 22
45/6-27E1
[Jack Churchill. Measuring point, top of casing, 3.5 ft above land-surface datum which is 2,529 ft abovesea level]
1963 July 14. .._-___.________July 20-._--__. ---------July 27_ -_ Aug. 3 -- -_Aug. 10 ----- ___ __-_Aug. 17 Aug. 24___-____._._._ _.
4. 003. 784. 383. 934. 004. 084. 12
1963 Aug. 31 -Sept. 14 --------------Sept. 21. _ _____ Sept. 28 --------------Oct. 5-. - - Oct. 12. ________________
4. 004. 204. 151. 904. 234. 22
TABLE 21. Selected drillers' logs of wells in the Shasta Valley, Calif. [Correlations by U.S. Geological Survey]
Depth (feet)
42/5-12C1
[Lee Bryan. Drilled by Don Enloe Co. Altitude 2,933 ft]
Fluvioglacial deposits: Sand rock _____________ _______ _ _ ___ _ _ ___Water sand __________ _____ ____Sand rock . _____ _______ __ ___Brown sand ._ _ _ ___ _____ _ ____
12238
11430
122160274304
42/5-23 Jl
[A. B. Hoy and son. Drilled by Don Enloe Co. Altitude 3,225 ft]
Morainal deposits: Boulders and clay ___________ ___ .__.Angular gravel .__ ____ . __ _ _
12877
128205

QUALITY OF WATER 95
TABLE 21. Selected drillers' logs of wells in the Shasta Valley, Calif. Continued
Thickness (feet)
Depth (feet)
42/5-26A1
[A. B. Hoy and son. Drilled by Don Enloe Co. Altitude 3,218 ft]
Fluvioglacial deposits:100 100
Large boulder__________________________.___._______ 10 110Sand rock_________________________________________ 90 200Clay and sand______________________________________ 5 205
43/4-4J1[Jess Martin. Drilled by Clyde Enloe Co. Altitude 3,075 ft]
Plutos Cave basalt:Soil -_--------- ---- - - - ----- ---- 4 4Lava______________________________________________ 51 55Verv hard gray rock________________________________ 5 60Lava L_ _ ___ __ __ __ 88 148Lava, broken_____________________________________ 28 176
Umpqua(?) formation:Clay____-_-_-___-_-_______-_______-_-_-_____-_---_ 27 203
43/4-4R1[Jess Martin. Drilled by Clyde Enloe Co. Altitude 3,050 ft]
Plutos Cave basalt:Sand__ 12 12Lava, badly broken.________________________________ 88 100Hard gray lava_____-______.________-___-_______-___ 6 106Lava, broken______-_________________-_____-_______ 24 130Hard gray lava_________________________-_-_______-_ 16 146Lava, broken______ _ ______ _ 127 273
Umpqua(?) formation:Clay with layer of sand and gravel on top of clay_____-_ 27 300
43/6-3D1[Riemo Capafello. Drilled by Clyde Enloe Co. Altitude 2,610 ft]
Basement complex:SoU . 4 4Shale fine softrock________________-_____________- 8 12Grayhardrock_____________________ _ ___________ t or 74? 76 or 86?
43/6-10K1[C. S. Timmons. Drilled by Don Enloe Co. Altitude 2,638 ft]
Volcanic rocks of the western Cascades:Dirt and boulders_________________________________ 12 12Red sand and cinders, ______________----______-_-_-_ 26 38Cement gravel_____ 34 72Hardpan_-_____________.__--_-._.__--__-._______-_ 22 94
6 100Yellow muck__ _ __ __ 5 105

96 GEOLOGY AND GROUND WATER, SHASTA VALLEY, CALIF.
TABLE 21. Selected drillers' logs of wells in the Shasta Valley, Calif. Continued
Thickness (feet)
Depth (feet)
44/4-18F1
[Larry Waters. Altitude 2,780 ft]
Plutos Cave basalt: Lava _ ___________________________________________Cinders with water _ _ _ _ _ _______________ ______ _Lava. ____________________________________________
1087
11
108115126
44/5-18B1
[Frank Brahs. Drilled by Don Enloe Co. Altitude 2,610 ft]
Volcanic rocks of the western Cascades: Hardpan and boulders. _ _ ___ ____ ___ ___. ___ ___Boulders and sand, water-hearing. _______________ _ _Boulders and cemented red cinders. _ _________ _ _Boulders.. ________ _____ _ ____ __ _ _____ ________Red cinders and gravel, water-bearing_____ __ ___ _ _
1817221018
1835576785
44/5-28L1
{Louis Silva. Drilled by Kilgore. Altitude 2,610 ft]
Plutos Cave basalt:
Boulders __ ___________ ________ __________________Lava rock _ ___________________ ______ ._-_____.
Older alluvium (?): Chalk, pale-yellow. __ ___ > _ _ -___-_ _ _._ _ ___Boulders and gravel. __ _ ._ _ _._ _._-_-_-_-_- __
24
34
123
26
40
4164
44/5-34J1
[John Perino. Drilled by C. Widmore. Altitude 2,640 ft]
Plutos Cave basalt: Soil__________________ _____________-_--__-------_-_ 3
2576
328
104
44/5-34Q1
[A. J. Quadros. Drilled by Don Enloe Co. Altitude 2,625 ft]
Plutos Cave basalt: Soil.. __________________-__-_---------------_------ 3
1537
31855

QUALITY OF WATER 97
TABLE 21. Selected drillers' logs of wells in the Shasta Valley, Calif. -Continued
Thickness (feet)
Depth (feet)
44/7-12P1
[ Brazie. Drilled by Buckner. Altitude 2,880 ft]
Younger alluvium: Soil, gravelly___. _________ _________________________Clay, some water at 60 feet- ______________________ __Clay______________________________________________
Basement complex: Shale.......... ____________________________________Clay__________________-_-___________-___-_____-_._
85235
154
61
86095
110114175
45/5-7Q1
[James Elsea. Drilled by Kilgore. Altitude 2,673 ft]
Volcanic rocks of the western Cascades: Soil__. ---_-__-__-___-------_-_-______----__---.___
Hard yellow clay -_-__-___---_-________----___-_-_--Cement gravel. ___________________ ________________Brown clay _______________________________________Gravel. _._.____ _____________ __________________Hardrock___ _ _____________ _____ ____________ _Black formation. ________ __ ______________________Gray hard rock____ _ ____-_._ _____________________
1015201010154
1625
10254555658084
100125
45/6-26D1
[E. J. Carlson. Drilled by Kilgore. Altitude 2,615 ft]
Volcanic rocks of the western Cascades: Soil-____-_-____---____---___-_____-_-___-___--__-_Yellow clay ________________________________________Gumbo____ ___-_____--.-_--_____ -_-_____-_____---_Rock, gravel with water.---... __ ______ ___________
530102095
5354565
160
45/6-27A1
[Kilgore. Drilled by Kilgore. Altitude 2,545 ft]
Older alluvium: Soil--_------_.-_--_ _-------___-_-_------__-_-----_Boulders, water __________ ________-__-_-______--__Clay____-.-__ -.---.._--..-.-___-_____----______-.
Umpqua(?) formation: Black clay___ _____.___-_--__-___-__________ _______
1025
550
224
10354090
92116

98 GEOLOGY AND GROUND WATER, SHASTA VALLEY, CALIF.
TABLE 21. Selected drillers' logs of wells in the Shasta Valley, Calif. Continued
Thickness (feet)
Depth (feet)
45/7-24R1
[Doug Eastlick. Drilled by H. Palmer. Altitude 2,549 ft]
Older alluvium: Yellow clay and gravel ---------- -_. -- _--__-_____
Chico formation: White sandstone_.__-__-- ____ ________________ .___Hard boulder. ___ ____ __________ ___ ______________Gray sandstone- __ __ _ __________________ _._-___--Black clay-_____-____ _ - _ _ ___- ---____-_ ____Gray sandstone _ ___-_ _______ ____________________Black mud____- ________ ___ ________ _-_..- __ ___
Basement complex: Serpentine.- __---__-_-_-__-___ __-_-_-_ __.-- ____
40
405
157
10510
13
4C
8C8£
10C107212222
23£
45/7-27R1
[Fruit Growers Supply Co. Drilled by N. R. lessee. Altitude 2,655 ft]
Younger alluvium: Soil-----...---- --_---.--__-_._-____---_-__-_-_-_._Gravel-.-.- _---___--_.-___-__-_---___ -____-_-_-_Clay, gravelly ___-_--_ _____________________________Gravel _._-_____ ___-___-_._...__-______- ________Clay, gravelly_____ ... _____-_---______.-__-___-___Clay. __________________________________________Clay, gravelly. ______________________ .______._--___
Black clay. ___________________ __ _____________ _ _ _Basement complex:
212
62
459
144
12
53
f
1-!
2C2i6'7(9(9<<
ioe15<
45/7-34K1
[10th Dist. Agricultural Assoc. Drilled by N. R. lessee. Altitude 2,701 ft]
Younger alluvium: Soil and gravel-.--... ______________________________
Yellow clay and gravel- ____________________-----_-_
Clay and gravel... _--_--______-_-_________- _-_-___Gravel, some clay _ _ _____..__._.-_- ______----_--_
Basement complex:
Broken rock and clay _________ ___ ___________ ____Hard gray rock, quartz seams... _______ ______------__
44
124
533812
355
A*
2C2^7:
iif12;13C13£14(

QUALITY OF WATER 99
TABLE 21. Selected drillers' logs of wells in the Shasta Valley, Calif. Continued
Thickness (feet)
Depth (feet)
45/7-36D1
[Ree Bowen. Drilled by Kilgore. Altitude 2,685 ft]
Chico formation:Soil_______--_-__--Blue sandstone__._____.Yellow sandstone- __.__.
Basement complex:Blue quartz.. _________Schist containing pyrite.
2138150
5105
2140290
295400
46/5-18L1
[Stan Cooley. Altitude 2,550 ft]
Umpqua formation:Soil...._-_---------.------------------------------ 2Sand______________-_________-.__-_____--______ 23Shale__..___.__.__...._____-_-.-____--__-__. 15Sand____.__._.___._.____---__.__-___-____._.__..._ 5Shale -------------------_----------- --------. 5White sand---_---.____.___._.___________ 10Slate.. ___-------------------_.____-----__ 10Brown sand___.____-_-_-__-______-______-_-__--___. 10Sandy shale______________________________________ 45Sand, hard.-------.--__________._........__ 25Black shale_---_-_----_---.--------_-_.--___------- 30Sandy black shale_______-_-__-._--__-_--__--_-.__ 10Black sand_______________________________________ 10Brown rock________________________________________ 20Black shale._------_----___-___-_-.-_--_--_-_---.-- 17
225404550607080125150180190200220237

corco»
Tfeneo
^J0
eorf-
I3
o
CO
£S
C5 I 1ro o
toeg
O LO O) ~
O O
eo
Oi CO
0*. c^ ow
4*. Oil-**-C5
O _to >-'
ol tO
s
2en CO
9° *
g oo
CO
g
en o
o
eni-i 00
f*Ci CO C2
rf". Soi-
o
CO I coo
co CO to
0*to i-1
* COen
co to
oo
* to? CO CO
W £
T ? Tr ? r CO CO CO
CO -4 00
CO CO O
Cn *. *,>- o; co to oo oa
CO tO COl-i 00 O Ol Oi H-
"-1 to to CO -4 en
CO O
CO tO CO
en <! CO d O O5CO tw CS O »KH-
f r" t°co K; ecu ' to -1 *. CCCO*-O
00 00 COco- co- cc- C. bO L^J ^J Ou ^4
0- 0^0?°tw OS in O5 *
p o to o o o o
rf*. ^ ^ to to- to OO CO Oi 00 00 CO
rf^ tOCOH- rf^H-10 o MenO co
O^^MO^ Oi O o Cn J en
i ^-l^i-f-00 H* >-»00 Oi O
OOH-l-iOO
CO CO
§
2a-4
OS
*-s
to<o en
en
o
bs
!* *. in»x^
CO
s^
o
00
* » O100
' r4Cn*.
»Jb*
00 >-
oo
so
? 2J 1S CO
r4 9° to o
to co 00 0 en -4
to to I-" W I-1 00
en en Ol O
i O
OS ~J*. t-i O )-^co CO on o:
g^8^ en ^ en H-
CO CO> to en to
i- 1*-S
l ' 00 1 '
oooo
SsD SsDrf^^CO^- CO en CO rf*
H-~JH- 00
g' ^Jl to^icn
H- -4 tO 00co w -401- tO
otoco^»SI3
2- °- SwK*.
42/5-20J1.....----- -
2m
^1OS
CO
3
to£
*. OS
'^
Sh- co en
to*. O^ CO -40
o oo to
ObO
oo
CO
§s 00 C3
i en to*
to coSo
o o- enu
oH-tO
CO
CO
21 enCO
CO
to
CO
i
g
o
to * o to
CO
iss
o?°^ u^
o >-*8U
oo
COMl-*rffc CO en 00
o to Oi 'JO CO
O !O J "Cn
o tos^
oo
*-z
jC ?X eC CO CO
r4 9°oo o
8 in O3 CO
CO CO en CO o uo
a £
o
' * 00 ent- tfk- ooeoo
en en
S333
co oo to^5 oto-aeo
tO'o- o-OiOtOOO
oooo
O5 Oi CO- CO235S
o^o-*00 -) COO
' f*' p>*. oo oo en
o- o-NS^-H- *.
pooSo
*-
T*.a
2a^1CO
1toCO
to<o
p o>
p en*.^ CO I-"
--4oc*.COC3
oJjS»*u
poco co ^400
oo
* *to en Juo to
po to *. 00 CO
pOfO S en
o§p00 en
ooo
o
s
ico ^
o o
to§
CO
£O O CO CO
to to to ~] >^ Cn00 It- CO
O> ~J ~J
gto*. -4
VI
0 0 J Oi
»J CO00 en
55 g
gOS
s
o
iCO
to S
CO CO
S 5
en *.
-to »J
Oi
1
g3£ o g. 5* CD a,
T3W
Specific conductance (mi- cromhos at 25° C)
Dissolved solids (sum)
Silica (SiOj)
Iron (Fe)
Calcium (Ca)
Magnesium (Mg)
Sodium (Na)
Potassium (K)
Carbonate (C03)
Bicarbonate (HC03)
Sulfate (SOO
Chloride (Cl)
Nitrate (NOj)
Fluoride (F)
Boron (B)
Hardness as CaCOs
Percent sodium
Upper number, parts per million Lower number, equivalents per million
'iHTIVA VI-SVHS 'H3I,VA1 QNI10HO QNV AOOlOaO QOI

23
A1
- --- .
-
23M
1. .._
----
-
43/6
- 3
L1
--
----
-
10Q
1- --
15
F2
-
21E
1-. -~
-
21J2
..-
. -
22P
1-.
-
22 P
2 -
23N
2..
....
---
29Q
2-
-..-.
33J1
--. .
44/5
- 1J2
--. ...
-
2B
1 ..
10-
l-f3
5- 8
-53
5- 8
-53
10-
1-53
5-12
-53
5-12
-E3
5-12
-.r3
5-11
-53
5-l
l-r3
5-1
1-;
3
5-11
-53
10-
5-53
5-11
-53
5-11
-53
5-ll
-5:J
5- 7
-53
5- 7
-53
10-
5-53
7.7
7.5
7.3
7.5
8.2
8.0
7.9
8.3
8.1
8.4
8.3
7.7
8.1
8.4
8.1
7.6
7.4
7.4
765
578
489
486
769
408
429
457
457
535
515
529
519
484
383
658
454
505
482
388
340
333
490
253
270
285
286
347
327
00
1
328
299
255
416
301
332
67 75 74 72
55 40 37 26 30 35 32 31 39 21 42 47 51 54
.0 .0 .3 .0 .0 .3 .0 .0 .2 .0 .0 .0 .0 .0
361.
80
311.
55
241.
20
25
1.25 45
2.30
412.
046 41
2.04
6 522.
59
572.
84
582.
89
562.
79
582.
89
492.
45
693.
44 492.
445 67
3.34
381.
896 43
2.15
453.
78
332.
93
312.
55 31
2.55 43
3.54 25
2.05
6 252.
050
292.
33 25
2.03
322.
G3 31
2.55
30
2. 4
7 322.
63
231.
89
181.
480 26
2.14
181.
480 21
1.73
642.
78
431.
87
381.
65
35
1.57 63
2.74
12.5
22
14.6
09
10 .43
9.2
.40 19 .83 16 .70 14 .61 18 .78
8.0
.35
9.0
.391
411.
78
351.
522 38
1.65
4.5
.12
2.5
.03
2.1
.05
2.2
.05
3.0
.08
1.7
.043
1.6
.041 .8 .02
1.1
.03
1.4
.04
1.1
.03 .9 .02
1.5
.04 .8 .02
1.0
.026
2.0
.05
2.9
.074
3.
0.0
8
0 0 0 0 0 0 0 0 0 0 0 0 0 0 0 0 0 0 18 .60 6
.20 0 0 0 0 10 .33 0 0 0 .0 0 .0 0 0
416
6.82
349
5.72 28
54.
09
2^2
4.62 40
46.
62
252
4.13
0
274
4.49
0
304
4.98
302
4.95
320
5.24
303
5.05
33
25.
44
323
5.33
308
5.05
244
3.99
9
375
6.15
259
4.24
5 28
24.
62
9.2
.19
6.7
.14 10 .21
9.9
.21 23 .48
7.7
.150
5.5
.115
5.8
.12
8.1
.17 10 .21 13 .27 12 .25 13 .27
7.7
.16
8.1
.169
17 .35
9.4
.196
12 .25
481.
35
21 .59 18 .51 16
.4
5 481.
35 6.2
.175
2.2
.052
4.0
.11
2.0
.06
9.0
.25
5.0
.14
3.5
.10
9.0
.25
1.5
.04
4.0
.113 26 .73 15
.423
15 .42
1.8
.03 .4 .02
1.3
.02
1.4
.02 10 .16
5.4
.037
9.1
.147 7.8
.13
4.8
.08
6.8
.11 15 .24
8.1
.13
4.6
.07
6.0
.10
3.6
.011
5.4
.09
4.4
.071
6.
7.1
1
.5 .03 .4 .01 .3 .02 .3 .02 .3 .02 .1
.005
.1.0
05
.0 0 .0 0 .0 0 .0 0 .0 0 .0 0 .0 0 .2.0
11
.1 .01 .1
.005
.1 .01
.64
.28
.28
.25 2F
.02
.04
.02
.05
.05
.03
.04
.07
.00
.02
.81
.32
.44
279
226
188
190
292
205
205
248
245
276
267
268
254
266
196
274
169
194
33
29 30 29
32 11 13 8 8 13 12 10 13 6 9 24 31 29

TAB
LE 2
2.
Che
mic
al a
naly
ses
of
grou
nd w
ater
in t
he S
hast
a V
alle
y, C
ali
f. C
onti
nued
Wel
l
44/5
-34G
1....
.......
34
H1
....
....
...
34
J1-.
-. ...
....
34N
1.._
. ...
....
34Q
1 . .
35L
1 .
.......
44/6
-lO
Fl.
. .........
10R
1.... .......
15
H1
-...
. ......
18M
4.. .
.......
Dat
e sa
mpl
ed
5- 8
-53
5- 8
-53
5- 8
-53
5- 8
-53
5- 8
-53
5- 8
-53
5-12
-53
5-12
-53
5-12
-53
10-
5-53
5-12
-53
5-12
-53
10-
5-53
PH 7.5
7.3
7.5
8.1
7.9
8.6
8.3
8.0
8.0
8.2
7.9
Specific
conductance
(mi- cromho
s at
25°
C) 586
634
690
472
549
659
654
747
586
621
575
409
428
Upp
er n
umbe
r, pa
rts
per
mill
ion
Low
er n
umbe
r, e
quiv
alen
ts p
er m
illio
n
Dissolved solids (sum
)
385
408
453
324
363
449
412
469
351
367
362
266
O S w 61
66
60
58
58
63
50 36
32
33 34 25
1 .0
.0
.0
.2
.0
.0
.0 .0 7.5 .1
1.8
'a
O "3
O
42
2.10 42
2.
10 41
2.05 23
1.14
8 34
1.70 41
2.
05 60
2.99 77
3.
84
59
2.94
55
2.
74 66
3.29 68
3.
393 66
3.
293
Magnesium (Mg
) 37
3.04 33
2.
71 352.
88 22
1.80
9 29
2.38 36
2.
96 45
3.70 26
2.
14
27
2.22
34
2.
80 18
1.48 9.6
.789
9.
0 .7
40
a _d 02
34
1.48 44
1.
91 65
2.83 34
1.
478 45
1.
96 60
2.61 17 .74 58
2.
52
29
1.26
30
1.
30 37
1.61 15
.6
52
15
.652
Potassium
(K) 4.9
.13
5.2
.13
5.1
.13 23
.588 4.6
.12
4.9
.13
1.8
.05
1.6
.04
3.2
.08
3.1
.08
1.1
.03 .9
.023
.7
.0
18
Carbonate
(CDs) 0 .0 0 0 0 0 0 .0 0 .0 20 .6
7 6 .2
0 0 .0 0 0 0 0 0
.00 0
.000
0 0
Bicarbonate (HC
03) 356
5.83 36
8 6.
03 390
6.39 23
6 3.
868
311
5.10 35
8 5.
87 367
6.01 42
8 7.
01
351
5.75
36
7 6.
01 333
5.46 29
2 4.
785
4.62
2
6"
"3 X 6.9
.14
7.6
.16 13
.2
7
8.1
.169 10
.2
1 11
.23 17
.3
5 12
.25
7.2
.15
6.9
.14
9.9
.21
2.1
.044
2.
2 .0
46
Chloride (Cl) 18
.5
1 21
.59 27
.7
6 22
.620 22
.6
2 25
.71 26
.7
3 31 .87 20
.5
6 24
.68 22
.6
2
1.0
.028
2.
0 .0
56
Nitrate
(NOs) 5.2
.08
8.0
.13 15 .24 17
.2
74 7.1
.11 12
.1
9
8.5
.14 17
.2
7 1.
0 .0
2 .3
.00
9.8
.16 .9
.015
.2
.0
03
Fluoride
(F) .2
.0
1 .1
.01 .2
.01 .5
.026 .2
.0
1 .2
.01 .2
.01 .0
.0
.1
.01 .2
.01 .1
.01 .0
.000
.0
.0
00
Boron
(B) .2
3
.26
.27
.35
.24
.26
.03
.39
.18
.19
.26
.01
.01
Hardness as
CaCOs
257
240
246
148
204
250
334
299
258
277
238
209
202
Percent
sodium
22
28
36
29
32
34
10 30
19
19 25 13
14
o
to

20A1 ~
22M1.
22M2....-----
27Q1- -
29D1-
34K2-.. ._
44/7-13C2-
13J1--.-
45/4-20D1.
..
..
46/5-4N1 -~
6E1... ..
7N1..
19P1. ..
.
21P1. ...
...
5-12-53
5-12-53
10-
5-53
5-12
-53
5-12
-53
5-12-53
5-12-53
5-12
-53
5-12
-53
5-8-
53
10- 4-53
5-8-
53
10-4-53
5- 8-5
3
5- 7
-53
5- 7-5
3
7.5
8.2
7.8
7.9
8.5
7.5
8.5
8.1
7.3
7.6
7.8
8.4
8.0
7.7
8.1
8.4
307
500
500
667
634
245
736
336
337
482
4.45 961
997
449
365
455
190
310
299
667
388
160
476
217
203
4,54
5
317
290
614
615
280
262
308
22 35 33 35 31 25 52 28 17 45 35 36 17 13 32 61 46
.0 .0 .4 .0 .0 .0 .0 .0 .3 .0 .1 .0 .0 .2
391.
946 62
3.09
59
2.94
763.
79
331.
65
281.
397 60
2.99
552.
745 55
2.74
5
138
6.90
542.69
512.
545
7.5
.37
5.5
.27 29
1.44
7 311.
547 44
2.20
131.
069 21
1.73 22
1.81
252.
06
453.
70
11.905
443.
62 6.7
.551
8.4
.691
211.
75
181.
48
161.
316
6.1
.50
4.0
.33
9.8
.806
221.
809 24
1.97
7.8
.339
15 .65 15 .65 38
1.65
431.
87
7.2
.313
462.
00
8.0
.348
5.4
.235
1,13
3 49
241.04
21.913
242
10.5
2 243
10.5
7 522.
261 13
.565
261.13
1.5
.038
1.6
.04
1.5
.04
1.8
.05
2.4
.06
1.1
.028
3.1
.08 .5
.013
.4.010 .2 .01 .3
.008
1.5
.04
2.0
.05
1.0
.026
.8.0
20 .5 .01
0.00 0
.00 0
.00 0 0 16 .53 0
.000
25 .83 0
.000
0.000 0
.000 0 0 0
.000
14 .47 0 .00 0
.000
0.0
00
18 .60
178
2.91
7
284
4.65
27
64.52
368
6.03
332
5.44
136
2.22
9
408
6.69
194
3.179
208
3.409
2,71
444.5
226
3.70
220
3.60
5
580
9.51
616
10.10
184
3.016
190
3.114
238
3.90
7.7
.160
5.4
.11
5.3
.11 12 .25 13 .27
6.1
.127
9.4
.20
7.9
.164
6.0
.125
2.9
.06 14 .29 14
.291
.4 .01
2.1
.04 24
.500
16.333
14 .29
.5.014
21 .59 19 .54 29 .82 30 .85
3.5
.099 27 .76
4.0
.113
1.8
.051
489
13.8
12 .34
9.0
.254
32 .90 32 .90 26
.733
3.8
.107 7.2
.20
11.1
77
8.7
.14
7.9
.13 17 .27 11 .18 11
.177
9.3
.15 11
.177
6.4
.103 48 .77 34
.548
.1 .00 .1 .00 15
.242
21.339
11 .18
.0 .00 .1 .01 .1 .01 .0 .00 .0 .00 .0
.000
.1 .01 .1
.005
.1.0
05 .1 .01 .3
.016
2.4
.13
2.2
.12 .4
.021
.2.011
.3 .02
.00
.05
.08
.20
.35
.01
.37
.00
.04
.00
.00
5.5
7.8 .08
.03
.12
151
241
238
292
268
115
330
165
172
208
193 44 30 113
168
208
10 12 12 22 26 12 23 10 6 84 20 19 92 94 50 14 21
o CO

£tt
? rr v s g
O 00
CD CO
§--J CO
01 If CO CO
i °
to to
ssssCO CO
h-coto >f to oo co o
P^P^ 5oSs3S
o o-COOCOI-'
ooo o
CO 00 os en OOOlf I-" CO O OS OS
OS CO 00 If-a toem-"
;- tO
COlf O-l CO -1 CO tO
tOF- l-1^ -1 ~100 CO
o- o-CO Cn tOCO
toCOttto
5-14-53
en
If8
COto00
en
o
to
S£
g£
'&£
tOCO
So
fcog°.
OS CO h->
if" tO
CO
OS OS
2 io
toCOtt
rr g
CO
§CO COen
g
o
toI-" If en CO
to
KS
£S?
o- toco
00
500too
^JOS Ol
if tO
OSOi-1
s;-
to00
§to
5 o,en -1i, enCO CO
-q 00
00 tO
00 00
g 8
g 2 CO CO
If If 00 H«
! o
if CO
en CO if OS CO tO If CO
CO ifto*, (-"en COOCO l-»
if co en co00 if to en
i-" f" h-> *COOl-1 tO
oooo
OS OS CO- CO If CO If COto to to to
-vl CO 00 If CO 00 -1 tO
oo to -i to to co os ~i
to oo co oo CO O I-1 I-*
O" O !=tooo
to00
0
? 1CCO
CO
S3CO
£§If
iS
OS
OS if CO -ICO
BBif tOIf If
I-1*, en en
o So
toCO I-1I-1 ~J -qoo
s.too
occ ^ *ooo
O Cn
to
g
? Tr v S IS
00 CO
S 2 OS 00
If If CO ento os
en if to co
i °
CO CO
OS ~J CO OS if CO if ~1
If If coenoif OS CO CO CO
to to to to OS CO tO 00
S- O' -qto os
o o oooo
00 00 Cn if CO OOOO If COOOO
ia^*8 o--ioo-q
io?0^^ wo-qo
io>- >-^aososh-0
o o tO CO I-" tO
to o>£>
T
I00
8 ^1
£If
If
o
-JCO Olf
CO I-"to os
CO
2S§
b^OS en
So
en CO
P G
OS
to o
l-<
OS en I-1-)
IfSos
2'h-
toentt
o 1
rs
If
-!
0o
If
1c?
^JIf
OS
OS CO if CO
IfCCOl OS CO
3-~ -<r§s
toooo en o
o o o
g-M*2if O
SE
"oo
to os en o
CD (0
to if
45/5-24K1-. .........
? r en y
g s
-1 OS
CO if ~1 COO 00
to co os to en -vi
en if -1 CO
! °
toSco I-" if~i to en co
to§
to os co co to co to
enOS I-1 00 tO en CO ^1 O
o to to o OOO-q-q
o §o ooo
CO If
00 00 CO O I-1 00 en to
CO l_i i_i to I-* tOeni-'O
£f*'i-c' £0-10
^ *co to to i Oi"-4 rf*. Or
S»suI-. If
§ sto to
Cn Cn en >f
CO
toIf
s
£
to£
toOS
co to CO CO
CO CO
S 8
OS OS
^J
i
sg
to i O CO
if CO
SOS 00
If If
§Ol
§
o o
Ol
0
s
g §1 tO ^J COO CD
If Ol
£
loE^CD ®a
aw
Specific conductance (mi- cromhos at 25° C)
Dissolved solids (sum)
Silica (S1O2)
Iron (Fe)
Calcium (Ca)
Magnesium(Mg)
Sodium (Na)
Potassium (K)
Carbonate (CO3)
Bicarbonate (HC03)
Sulfate (SO4)
Chloride (Cl)
Nitrate (NOj)
Fluoride (F)
Boron (B)
Hardness as CaCO3
Percent sodium
Upper number, parts per million Lower number, equivalents per million
VLLSVHS 'aNnoao CLNCV
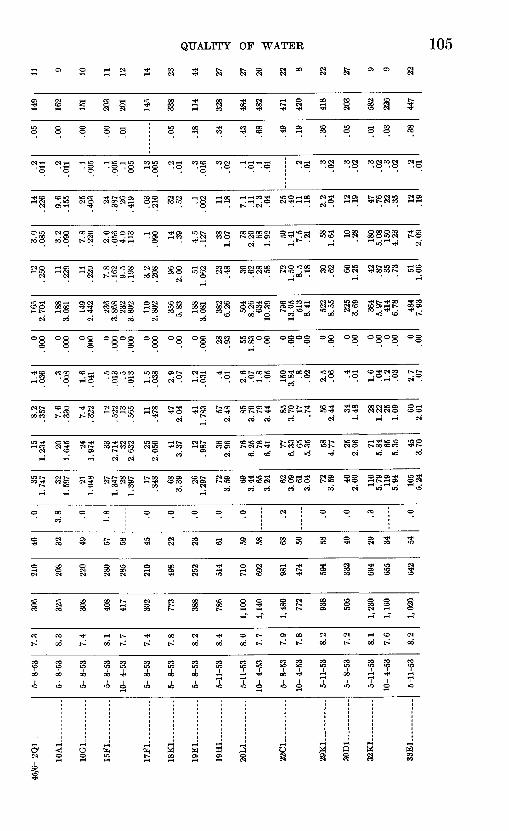
45/6- 2Q1 ---
--
10A1- --_
__
10G1 ........
16F1.. ...
....
..
17Fl___--.--._
18K1
....
. ......
19E1-.--. ......
19H1_. ...
....
20L1
.. ...
....
..
22C1.. ...
...
29K1- ...
..
30D1-...-.--...
32K1... ... ..
33E1. ...
....
5- 8
-53
5- 8
-53
5- 8
-53
5- 8-5
3
10- 4-53
5- 8
-53
5- 8
-53
5- 8
-53
5-11-53
5-11-53
10- 4-
53
5- 8-53
10- 4-53
5 11
-53
5- 8-53
5-11-53
10- 4-53
5-11-53
7.3
8.3
7.4
8.1
7.7
7.4
7.8
8.2
8.4
8.6
7.7
7 9
7.8
8.2
7.2
81
7.6
Q 9
306
325
308
408
417
302
773
388
786
1,100
1,14
0
1 48
0
772
QQQ
505
1,23
0
1,16
0
1,02
0
210
208
220
280
285
210
498
252
514
710
692
474
KQA
qqo
694
655
642
40 32 49 57 58 45 22 23 61 59 58 68 50 rQ 40 9Q 34 <;d
.0 3.8 .0 1.8 .0 .0 .0 .0 .0 .2 .0 .0 .0
351.747 32
1.597 21
1.04
8 271.347 28
1.39
7 17.8
48
683.39
261.
297 72
3.59
693.
44
653.
24
623.
09
613.04 79
3.59
402.
00
5.79
119
5.94
105
5.24
151.
234 20
1.64
5 241.
974 33
2.714 32
2.632 25
2.056 41
3.37
12.9
87
362.96
766.
25 786.
41 776.33
655.
35 (-0
4.77 OK
2.06
715.
84
655.35 AK
3.70
8.2
.357
7.6
.330
7.4
.322
12.522
13.5
65
11.4
78
472.04
411.
783
2.48
853.
70
793.44 85
3.70
17 .74
K.R
2.44
341.
48 00
1.22
251.09
602.
61
1.4
.036
.3.008
1.6
.041
.5.013 .5
.013
1.5
.038
2.9
.07
1.2
.031
.4 .01
2.6
.07
1.8
.05
150
3.84
.8 .02
2e
.06 .4 .01
.04
1.2
.03
27
.07
0.000 0
.000 0
.000 0
.000
0.0
00 0
.000 0
.00 0
.000 28 .93 55
1.83
0.0
0 0.0
0 0.0
0 0.0
0 0.0
0 0.0
0 0.0
0 0.0
0
165
2.704
188
3.08
1
149
2.442
236
3.868
232
3.802
110
2.802
356
5.83
188
3.08
1
382
6.26
504
8.26
634
10.3
9
7Qfi
13.05
513
8.41
522
8.55
225
3.69
364
5.97
414
6.78
484
7.93
12.2
50
11.2
29
11.2
29 7.8
.162
9.5
.198
3.2
.208
962.
00
511.
062 23 .48 30 .62 28 .58
79
1.50
8.5
.18
on
.62 60
1.25
42 .87 35 .73 51
1.06
3.0
.085
3.2
.090 7.8
.220
2.0
.056
4.0
.113
.1.0
90
14 .39
4.5
.127
381.07 78
2.20
68
1.92
501.
41 7.5
.21 58
1.64
10 .28
180
5.08
150
4.23
742.
09
14.226
9.6
.155
25.403 24
.387
26
.419
.03
.210
32 .52 .1
.002
11 .18
7.1
.11
2.3
.04
OK
.40 11 .18
29
.04 19 .19 47 .76
99
.35
19
.19
.2.011
.2.011
.1.005
.1.0
05
.1.005
13.005
.2 .01 .3
.016
.3 .02 .1 .01 .1 .01 .2 .01
.02
.02
.02 .3 .02 .2 .01
.05
.00
.00
.00
.01
.05
.18
.34
.43
.68 49 .19 qc .05
.01
.03
00
149
162
151
203
201
145
338
114
328
484
482
471
420
418
203
KQQ
226
447
11 9 10 11 12 14 23 44 27 27 26 22 8
99 27 9 9
99

CO
Cn 1
a00
^
sCO
tos
8
o
§360 100
Si- O 00
OT CO Cn CZ1
O.
O
00
CO
0060 COCO Cn >£h
CO
Cn 00
60 CO
CO 6O
So
O.
OT CO
8
£CO
5
Cn1rCnCO
^CO
CO
g
too
6000
CO
£>. It- tO I CO
00 l->
CO 60 h-* Ol
0 h-* 00-1
o So
60001-' 00 Irf* Ol
too to
coo
OCO Cn Cn £t
OS CO
o
o
S£
>-*
\
rCO
00
to
COo
ih-*
;_
coCn O
Cn Cn
_60
o to
S£
OO
CO 00 Ol CO^ to
o£
ooo
o-O CO
8* 60
60
COo
CO Cn
60 I
O Cn en1 1 1
CO OS OS1 1 1 Cn Cn Cn
CO CO CO
I 00 00
-JO 0,
It- CO 00 00 CO I-* 00 0
18 1h- 1 h- 1 tOCO GO O
! o o
to j-* co00 Cn OS CO CO GO CC CO Cn CO <C O
J-* Js2 CO
GO fcO 1-* fcO Ol ** i ' fcO * OS tO rf*-
Oi-* tO to- to
o o o GO O OS Cn h-1 Cn
O GO tO * ! fcO
JO GO OS
GO OCn tO O OSGO CO CD rf*- CO OO
toCO H-* ^ t-* O CD COOS OCD rfi-GO
Ol Cn
2,2. «^
O' O' O'to cc toco H- to
60 60
Cn OO OS
60 I-1 CO CO CO 00
OJ -J 60CO Cn 1
g1
Ol1
CO
00
0
Cn00
CO
Ol
CO
0
CO
CO OT
~4 tOCOh-"
0000
O'(OO1
So
CO
OOl
COCn
Cnl-'(-"OO
OOl Cn en
260
g
60
Ol
CO
^s1o
O Cn1 1
CO OT 1 1
CO CO
~4 00
Cn >*
§ iCO £>.
gen I-"
60 60
i O
CCO*- CO
>-' tO
oo to en co CO CO Cn 1 '
f to > 60COOTCOOT
O' O- 60 Ol tOCO
§CO h
ocoo
It- £>. 60' CO00 CO CO O tO It- tO O'
OOj^Cn tO
00' tO- Cn60rf* Cn OS O
ht-COCO 00 OOO 1 Cn
o- o-
I-" O CO CO
60 COOS CO
1-i 1-
CO Ol
Cn1
001
CO
M00
It-Cn
to
60
0
60
05 co
coo
h-* to oo
So
52
OT 60O CO
pi00 Cn
sS
8b
oo
OS
00
60
§to
Cn
00
CO
^,CO
i£>. 00to
OS
0
60
Ol Cn
CO
to
OO1
O'co to
So
"1It- 60
COCO
b-*0 O1O
tO^J
o-60 CO
o
COoCO
60
£>.
Cn1
00
s«,CO
it-
CO
600
CO
0
it- 60Cn CO
0-4
to
sg
sC
go
COh cp001^
I 00CO Ol
OS 60
gb
o-tO t£*
$
sIt- 01
1It) tl
a X
Specific conductance (mi- cromhos at 25° C)
Dissolved solids (sum)
Silica (Si02)
Iron (Fe)
Calcium (Ca)
Magnesium (Mg)
Sodium (Na)
Potassium (K)
Carbonate (COt)
Bicarbonate (HC03)
Sulfate (SO4)
Chloride (Cl)
Nitrate (NO3)
Fluoride (F)
Boron (B)
Hardness as CaCOa
Percent sodium
Upper number, parts per million Lower number, equivalents per million
s S-
OOaC+; 3'
go-
VI-SVHS 'aNnoao axv ADO^OHD 90 1
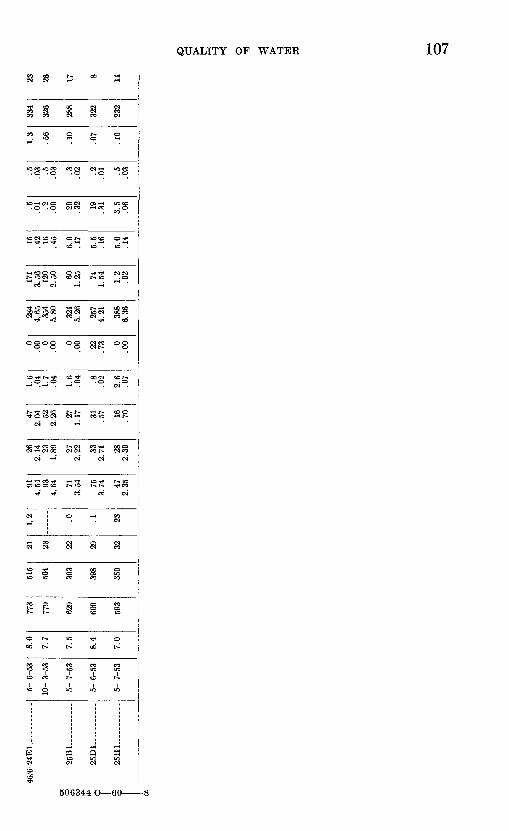
25B1
---.
-
25D1
.... ...
....
25H1
. ..
....
....
10- 3-53
5- 7
-53
5- 6-53
5- 7
-53
7.7
7.5
8.4
7.0
779
629
609
593
504
393
398
350
23 22 29 32
.0 .1 23
4.54
934.64
713.
54
753.74 47
2.35
2.14
231.
89
272.22
332.
71
282.
30
2.04
522.
26
271.17
31 .57 16 .70
.04
1.7
.04
1.6
.04 .8 .02
2.6
.07
.00 0
.00 0
.00 22 .73 0
.00
4.65
35
45.
80
321
5.26
257
4.21
388
6.36
3.56
12
02.50
601.
25 741.54
1.2
.02
.42 16 .45
6.0
.17
5.5
.16
5.0
.14
.01 .2 .00 20 .32 19 .31
3.5
.06
.03 .5 .03 .3 .02 .2 .01 .5 .03
.56
.10
.07
.10
V>R
288
322
232
26 17 8 11
£> I

TA
BL
E 2
3.
Che
mic
al a
naly
ses
of s
urfa
ce w
ater
in S
hast
a V
alle
y, C
alif
.
Nam
e of
str
eam
Sha
sta
Riv
er.. ..
.
Par
ks C
reek
_ _
Sha
sta
Riv
er
Gar
rick
Cre
ek.,..
Sha
sta
Riv
er.
....
Wil
low
Cre
ek(w
est)
.
Sha
sta
Res
ervo
ir.
Loc
atio
nnu
mbe
r
41/5
- 9P
41/6
- 1 A
_ _
42/5
-20J
...
22
P..
.
28M
._
42/6
-19A
1 .
43/5
-25E
1.
Dat
esa
mpl
ed
10-
1-53
3-18
-53
4-22
-53
5-27
-53
10-
1-53
3-18
-53
4-22
-53
5-27
-53
10-
1-53
5-27
-53
10-
1-53
4-15
-53
3-20
-53
10-
2-53
5-27
-53
w a 8.2
8.0
7.8
8.3
8.0
7.4
7.9
8.0
7.6
8.3
8.0
7.7
8.3
7.9
8.2
o w_ §? -2^
I03
§ O
259
278
162
217
334
194
186
209
252
514
711
322
461
528
265
2 "o la j fi 155
159
101
138
199
134
119
140
178
366
457
190
284
318
170
Upp
er n
umbe
r, p
arts
per
mil
lion
Low
er n
umbe
r, e
quiv
alen
ts p
er m
illi
on
O
if
co
28 21 19 28 31 36 26 34 46 75 60 28 32 37 32
^ Is "3 0
3.5
0.17
5
7.6
.379 4.2
.210 6.7
.334 11
.549 6.3
.314 4.0
.200 5.8
.'289 10
.499 33
1.65 42
2.15 8.0
.399 34
1.70 40
2.00 11
.549
g .9 '5
5 US £b 03 ^
322.
632 31
2.54
9 181.
480 25
2. 0
5;> 35
2.87
8 181.
480 21
1.72
7 221.
809 19
1.56
2 302.
47 433.
45 393.
207 43
3.54 47
3.87 22
1.80
9
jo?
3 o CO
1.8
0.07
8
4.1
.178 2.0
.087 3.1
7.4
.322 7.4
.322 3.2
.139 5.2
.226 16
.696 39
1.70 5t3
2.44 3.8
.165 3.8
.17
6.0
.26 12
.522
1-
3W "o PH
0.3
0.00
8 .1.0
03 .4.0
10 .3 .4.0
10 1.4
.036 .7
.018 .7
.018 2.0
.051 3.7
.09
4.6
.12 .4
.010 .5 .01
1.2
.03
1.6
.041
"c3O
C3^
Is 03 0
00.
000 0
.000
0.0
000 0
.000
0.0
000
.000
0.0
000
.000
0.0
0 0.0
0 0.0
00
0 0.0
0 0
£ lo IS _o « 172
2.81
9
176
2.88
4
107
1.75
414
32.
344
208
3.40
9
120
1.96
712
21.
999
134
2.19
015
22.
491
297
4.87 40
86.
69 216
3.54
0
288
4.72 33
45.
47 163
2.67
1
£^
|l
a CO
2.3
0.04
8
2.1
.044 2.4
.050 2.0
.042 3.9
.081 2.
9.0
00 2.8
.058 2.9
.060 3.0
.075 21 .44 26 .54
1.9
.040 26 .54 19 .40
6.7
.139
«S
-2o
2 o
1.8
0.05
1
6.5
.183 1.5
.042 2.2
.002 7.5
.212 2.0
.05(
31.
0.0
28 2.5
.071 6.0
.169 17 .48 24 .68
2.0
.056 1.0
.03
2.0
.06
4.2
.118
o !& s * 0.2
0.00
3 .0.0
00 .3.0
05 .2.0
03 .3.0
05 .9.0
15 .2.0
03 .5.0
08 .4.0
06 .5 .01 .5 .01 .4
.006 1.3
.02
1.7
.03 .6
.010
o> --
^
o j3 fe 0.0
0.00
0 .0.0
00 .1.0
05 .1.0
05 .0.0
00 .1.0
05 .1.0
05 .1.0
05 .2.0
11 .5 .03 .3 .02 .1
.005 .0 .00 .1 .01 .1
.005
^ « r 0.10 .12
.01
.02
.27
.07
.04
.04
.09
.15
.40
.07
.02
.08
.04
a
<SO
fl
C3£
° w 140
146 84 120
171 90 96 105
103
206
280
180
262
294
118
g 3 3 o 1 <E PH
3 6 5 5 9 15 7 10 25 29 30 4 3 4 18

Do..
.-
- -
Wes
t L
ake.
-
Eas
t L
ake.
Sha
sta
Riv
er. -
.--
Lit
tle
Sha
sta
Riv
er.
Cle
land
Spr
ings
. .
Gre
enho
rn C
reek
.
Yre
ka C
reek
__
__
Wil
low
Cre
ek(n
orth
).
Sha
sta
Riv
er. .
.. .
25L
1...
44/5
-29C
1.
29G
1.
44/6
-23H
1 .
45/4
-15C
1 .
20
B1
.
45/7
-34E
1.
34L
1..
46
/5-6
J1..
.
46/7
-24H
1 .
10-
2-53
5-27
-53
5-27
-53
10-
3-53
3-24
-53
5-27
-53
3-24
-53
5-28
-53
3-27
-53
5-28
-53
5-27
-53
5-28
-53
7.7
9.5
9.3
7.9
6.9
7.3
7.4
8.1
8.0
8.2
8.0
8.2
293
1,77
0
1,75
0
496 69
.7
76.0
89.0
356
531
525
296
515
180
1,10
0
1,19
0
321 62 71 95 210
306
309
190
320
29 13 .9 56 26 29 47 17 29 28 27 40
12.5
99 15 .75 13 .65 26
1.30 6.5
.324 7.5
.374 7.2
.359 37
1.85 30
1.50 35
1.75 32
1.59
7 221.
10
252.
056 86
7.07 19
916
.37 30
2.47 2.6
.214 2.7
.222 3.2
.263 23
1.89 57
4.69 52
4.28 9.7
.798 38
3.12
12.5
22 300
13.0
5
184
8.00 37
1.61 4.0
.174 4.3
.187 6.9
.300 4.5
.20
2.6
.11
4.1
.18 18
.783 36
1.57
1.6
.041 11 .28 23 .59
3.2
.08 .9
.023 .9
.023 1.3
.033 1.1
.03 .4 .01 .7 .02
1.4
.036 3.0
.08
0.0
00 205
6.83 26
08.
67
0.0
0 0.0
00 0.0
00
0.0
00
0.0
0 .0 .00 0
.00 0
.000
0
178
2.91
7
394
6.46 83
413
.67
276
4.52 42
.688 46
.754 58
.951 21
13.
46 366
6.00 36
45.
97 167
2.73
7
312
5.11
5.4
.112 11 .23
3.6
.07
8.1
.17 .9
.019 3.2
.067 .6
.012 22 .46
4.0
.08
6.5
.14 15
.312 10 .21
5.8
.164 25
57.
19 882.
48 23 .65 .0
.000 .0
.000 .5
.014 1.2
.03 .5 .01
1.2
.03
2.2
.062 16 .45
.8.0
13 .8 .01
1.4
.02
1.1
.02 .9
.015 .5
.008 .0
.000 .2 .00
2.5
.04
2.4
.04
2.5
.040 1.2
.02
.2.0
11 .3 .02 .2 .01 .2 .01 .0
.000 .1
.005 .0
.000 .0 .00 .0 .00 .0 .00 .3
.016 .3 .02
.10
4.0
3.6
.39
.08
.04
.05
.00
.03
.02
.04
.19
133
391
851
188 27 30 31 187
310
302
120
211
16 62 31 29 24 23 31 5 2 3 24 27
o CO

110 GEOLOGY AND GROUND WATER, SHASTA VALLEY, CALIF.
REFERENCES CITED
Averill, C. R., 1931, Preliminary report on economic geology of the Shasta quadrangle: Mining in California, v. 27, no. 1, p. 3-65.
1935, Mines and mineral resources of Siskiyou County: California Div.Mines Kept. 31, p. 255-338.
Batenian, A. M., 1950, Economic mineral deposits, New York, John Wiley andSons, 916 p.
Blackwelder, Eliot, 1931, Pleistocene glaciation in the Sierra Nevada andBasin and Ranges: Geol. Soc. America Bull., v. 42, no. 4, p. 865-922.
California State Water Resources Board, 1951, Bull. 1, Water Resources ofCalifornia: 648 p.
Callaghan, Eugene, 1933, Some features of the volcanic sequence in the CascadeRange in Oregon: Am. Geophys. Union Trans., p. 243-249.
Callaghan, Eugene, and Buddiugton, A. F., 1938, Metalliferous mineral depositsof the Cascade Range in Oregon: U.S. Geol. Survey Bull. 893, 139 p.
Diller, J. S., 1907, The Rogue River valley coal field, in Contributions to eco nomic geology, 1907, Part II, Coal and lignite: U.S. Geol. Survey Bull.341, p. 401^05.
Diller, 3. S., and others, 1915, Guidebook of the Western United States; Part D,The Shasta route and coast line: U.S. Geol. Survey Bull. 614, 142 p.
Fenner, C. N., 1923, The origin and mode of emplacement of the great tuffdeposit in the Valley of Ten Thousand Smokes: Natl. Geog. Soc., Con tributed Tech. Papers, Katmai Ser., no. 1, 74 p.
Hershey, O. H., 1901, Metamorphie formations of northwestern California: Am.Geologist, v. 27, p. 225-245.
Heyl, G. R., and Walker, G. W., 1949, Geology of limestone near Gazelle,Siskiyou County, California : California Jour. Mines and Geology v. 45,no. 4, p. 514-520.
Hinds, N. E. A., 1931, Most ancient formations in the Klaniath Mountains:Geol. Soc. America Bull., v. 42, no. 1, p. 292-293.
1932, Paleozoic eruptive rocks of the southern Klamath Mountains, California: California Univ. Dept. Geol. Sci. Bull., v. 20, no. 11, p. 375-410.
1933, Geologic formations of the Redding-Weaverville districts, northern California: California Jour. Mines and Geology, v. 29, nos. 1 and 2, p. 77-122.
Horn, W. L., and others, 1954, Interim report on Klamath River basin investi gation : California Div. Water Resources, 117 p.
Mack, Seymour, 1955, Geology and ground-water features of Scott Valley, Siskiyou County, California: U.S. Geol. Survey Water-Supply Paper 1462, 98 p.
Masson, P. H., 1949, Circular soil structures in northeastern California: California Div. Mines Bull. 151, p. 61-71.
Nichols, R. L., 1936, Flow units in basalt: Jour. Geology, v. 44, p. 617-630.O'Brien, J. C., 1947, Mines and mineral resources of Siskiyou County: Cali
fornia Jour. Mines and Geology, v. 43, no. 4, p. 413-462.Poland, J. F., 1951, Ground-water storage capacity of the Sacramento Valley,
California: California State Water Resources Board Bull. 1, p. 618-632. 1959, Hydrology of the Long Beach-Santa Ana area, California, with
special reference to the watertightness of the Newport-Inglewood struc tural zone, with a section on withdrawal of ground water, 1932-41, by

REFERENCES CITED 111
Alien Sinnott and J. F. Poland: U.S. Geol. Survey Water-Supply Paper 1471, 257 p.
Stearns, H. T., Crandall, Lynn, and Steward, W. G., 1938, Geology and ground- water resources of the Snake River Plain in southeastern Idaho: U.S. Geol. Survey Water-Supply Paper 774, 268 p.
Thomasson, H. G., Jr., Olmsted, F. H., and LeBoux, E. F., 1959, Geology, water resources, and usable ground-water storage capacity of part of Solano County, California: U.S. Geol. Survey Water-Supply Paper 1464. (In press)
Tolman, C. F., 1937, Ground water: New York, McGraw-Hill Co., 583 p.United States Public Health Service, 1946. Drinking water standards: Kept,
no. 2697, 14 p., from the U.S. Public Health Service Repts,, v. 61 no. 11, p. 371-384.
Waring, G. A., 1915, Springs of California: U.S. Geol. Survey Water-Supply Paper 338, 410 p.
Watson, E. B., Wank, M. E., Smith, Alfred, 1923, Soil survey of the Shasta Valley area, California: U.S. Dept. Agriculture, Bur. Soils, 152 p.
Wells, F. G., and others, 1939, Preliminary geologic map of the Medford quad rangle, Oregon: Oregon Dept. of Geology and Minerals Industries.
Wells, F. G., and Cater, F. W., Jr., 1950, Chromite deposits of Siskiyou County, California : California Div. Mines Bull. 134, pt. 1, p. 77-127.
Wells, H. L., 1881, History of Siskiyou County: Pacific Press.Wells, J. V. B., and others, 1956, Surface water supply of the United States,
1954; part II, Pacific slope basins in California: U.S. Geol. Survey Water-Supply Paper 1345, 574 p.
Westman, B. J., 1947, Silurian of the Klamath Mountain province: Geol. Soc. America Bull., v. 28, p. 1263.
Wilcox, L. V., 1948, The quality of water for irrigation use: U.S. Dept. Agri culture Tech. Bull. 962, 40 p.
Williams, Howel. 1949, Geology of the Macdoel quadrangle, California: Cali fornia Div. Mines Bull. 151, p. 1-60.

INDEX
Abiams mica schist, chemical quality of thewater..-........._.............. 73
description. _-_ -_-___ _ __- -_ 22,24genesis......._ 50-51
Acknowledgments...- -_---___ __....... 6Ager, coal deposit-----.....--------.-.-----.. 16,29
source of water..-________--______.-______ 30-31Agriculture 16,17Alluvium, older, description_------------ 20, 45-47
younger, description. ---------------- 20,47-49Analyses, giound water -------------------- 67-68,
71, 73,74, 75, 76, 77, 100-108surface water...................67-68, 72,108-109
Applegate group, age. _.._-____ __- ..___ 18,52Aquifer, definition . 23
principal, Plutos Cave basalt-.---.----..- 42,56 Area of influence, definition.......___-_..__ 23
B
B asement complex, desci iption............ 22,24-26Bibliography............................... 110-111Bicarbonate in water......................... 73Big Springs, chemical quality of the water._.- 75
source of water.-_........-.....--........ 42water table, slope______________________ 55
Big Springs Creek.-______________.-____-_._-- 58Black Mountain ............................. 27,29Bogus Mountain.------..--------.-.-.-- --. 34,39Bogus Springs, temperature.__.-___..-.__._.. 59 Boron in water. __-____-________________ .___ 75
Calcium carbonate in water. ______________ 71, 72,73Carbonated springs .___.__..._____ 59-60,69,74,77Cascade Range, location and physiography... 8,31 Cedar Park School, cutwash material ..____. 44Chanchelulla formation, chemical quality of
the water._.___..___..._..._.___. 73 description.___________________________ 22,24-25genesis, __.-___--._____-..-___-_.__-.__... 52
Chemical quality of the water, analyses.... 100-107,108-109
standards._ 68-71wells-.. . - _ 71,72,73,74,75,76,77
Cbico formation, description__---------- 21,26-28genesis^......._..__._....._. _.____ 52
Cleland Spring_-_-_.-__.____................. 58Climate.--___-_________-._-____.-..___.... 11-15Coal _-_ _ . _ __._ __ 16,29 Cold Spring, discharge---.--..---.___________ 58Construction materials..---.---..--.----..... 17Copley greenstone, description.-.-.-......... 18,52Copper __.._ 16-17
D
Delphic School, dip of rocks... __----.... 27, 49 Depression, cone..--------------------------- 23
PageDiller, J. S., and others, quoted.-..._______ 32Discharge.._-----------------_- 9-11,55,60,63,64,65Domes-....-.... - 35,43Domestic water supplies, chemical quality 68
wells.. _ 25,27, 30, 38,42,47,48, 56, 57, 66Drawdown definition.. ...... . . 23Dwinnel Reservoir, evidence of glacial erosion. 8
springs and seeps. 57water table, slope. _ .___ _ - 55
E
Edgewood, precipitation....-.-.... --------- 13-14source of water..----------- _. 45,57
Evaporation losses. __ - - - 65 Evapotranspiration losses........... . 60,63,64, 65
Faults, amount of displacement -------- ... 50springs.-.-._------- . . 57,58,74
Fenner, C. N., quoted - - 32-33 Fissures...- - --.. - - - -------- 41,53Fluvioglacial deposits, description.- .. 20,44-45 Fossils . --- 26-27,28,29,52Fractures, permeability._ _ 42,43,54
springs.-.--.-------------------------- 57, 58, 74
G
Gazelle, source of water. ... ------ 36,38,56,57Geologic units, generalized section and water
bearing properties.-- ---------- 20-22Glaciation.----------------- --- ----- 8Glaciers, Mount Shasta---- - - ------- 8Gold-- - - 17Goosenest, volcanic mountain..-------------- 39Grenada, source cf water....... ... .. 36,38.56Ground water, analyses...._... 67-68,71,100-107
discharge, amount ----.------ 55,60,63-64,65movement----------------------- --- 54,55,62recharge. - 56,60,61,62-63storage.- 40,54use. See Domestic water supplies, Irriga-
gation water supplies, Municipal water supplies, Stock water sup plies.
H
Hardness of water..... ... .... . 69,73High Cascades, description..... _ 21,38-40
geologic history - - - 53rechargefrom--------- - ------ --------- 62
Hilt 30Hydrographs_ 60,61
Infiltration--.-- ----- ----- --- 60,61,62Investigation, methods. ... ... ------ 5
previous..-------------------------------- 5-6purpose and scope.--.-.----------- ---- 3
113

114 INDEX
PageIrrigation, acreage .. __--____._. 66-67
water supplies, amount.____.____ 65-66chemical quality..__._....__ 68,70-71discharge----..--....-............. 63,64,65recharge_____._.___ 60,61,62,63 water-service agencies................ 66-67
wells, yield, amount-_____ 31,36,42,45,56,57 geologic units yield-....___..... 38,47.48
Irrigation efficiency, average, definition. ..... 63
Jointing................................... 17,33-34
Lava tubes, Plutos Cave basalt._.......... 7,41Limestone beds, chemical quality of the water. 73Little Shasta.---.-.__.___.._.__ 33,35,42Little Shasta River, discharge, amount_... 9-11, 64
drainage-___._._________... 9,47recharpe, seeps and springs--....-........ 40
Livestock..._.............._.............. 16Location and extent of area_. _ _......... 3
M Magnesium in water....____......_.... 71-73Martin Ranch, carbonated spring.,.--.--.-., 60 Mineral resources..__------__.._.......... 16-17Mineral water, springs....___.......... 59Molybdenum_..____..._._......... 16-17Montague, agriculture._______.......... 16
airport-------------------.-.--.--------.. 15precipitation...._.-.-..-......_...._... 13-14source of water....__.................. 27,47well logs---.-------------.-............... 28
Morainal deposits, description___....... 20,44-45Mount Shasta................................ 8,55Municipal water supplies, amount----.----.- 63,66
chemical quality._...._______._.__.______ 68-69infiltration gallery-..-..._............ 48-49,57
OOregon Slough....____._____._... 31 Owls Head.____.____.__.____.. 17,35
Paradise Craggy._____-____.___... 24,50 Parks Creek, discharge, amount----...._ 9-11,164
diversion, Dwinnell Reservoir............ 67drainage. ---------------_--...-....... 9,47
Permeability, definition.......__......... 23Pluto Cave--.-.--.--.-.,-.-..--........... 29,41,50Plutos Cave basalt, aquifer.....___....__ 54,56
chemical quality of the water...... __ 75-76,77description.____.______...... 20,41-43water table, depth to.___.____... 55
Population___...._________.___.. 15-16Porosity, definition....___.__....... .. 23Precipitation, amount_..._________ 9,11,13
recharge......__________. 56,60,61,62,63
R Recharge, irrigation.. __....._._...._ 60,61,62,63
precipitation....____.___... 56,60,62,63 springs.-....-----..............._.._..... 62
Saline carbonated springs- Salt water, well.....__.
PageSchollendomes, Plutos Cave basalt- _.. __ 7,43 Seepage, discharge......... .. ..._. - 57,63Serpentine, age.--------------------._-.--. 25
chemical quality of the water......... __ 71wells-..--.----------------------.------.- 26
Shasta River, discharge, amount .__.. 9-11,64,65 discharge, irrigation...................... 67drainage_-.-...---..----..----..--.... 9,47,53ground water, recharge.........._...... 62quality of the water.--...__..__..... 71,72
Sheep Rock........................ ....... 34Silica in water- ...._..-.._-_-_..--.-__._ 76Snowdon, volcanic neck........_........... 34-35Snowdon School..___......_...._..._ 29,50Sodium chloride in water.--__-.__--._-__.._ 73,74 Soil..--. -- ------------------------- 46Specific capacity, definition.._.............. 23Spring Creek_..................... ..... 58Spring, analyses..-. --__-----_---._------.-_ 59
discharge, amount 57,58,59mineral water.... ....-..- .. 59,60,69,74,77recharge..- -__...._ _ - 62
Stock water supplies, wells, depth to water... 66wells, geologic units ._.._._.. 25,38,47,48,56,57
Stone circles, formation of.. _. .._ ._. 44permeability-.-.---.-.-.. - .- .-.-- 57
Surface water, analyses......_..-.....-..... 108-109discharge, amount... .__... .. 9-11,64-65 irrigation. .----. -- . .---. 65
TempleRock-.- -.-- -- -- -- 39 Terrace deposits, description..-.__.__.-_.__ 21,43 Terwilliger Ranch... 59Topography - -- - - 7-8 Transportation.-.. ___--.--------------------- 15
U Umpqua formation, chemical quality of the
water.._.--_-__---------------- 74,75,77description... . - 21,29-31permeability. _. 54
Unconformity _ --- 26Underflow, discharge.._ ._ ..-. 63
WWater-bearing properties, stratigraphic nnits,
summary--.------.------- ---.-- 20See also descriptions of individual strati-
graphic units.Water table, depth to.--- - - 55
fluctuations.-------------__...__ 60, 61,62slope--__.---.-.--_----- .--.-.-__-- 55
Weed, population and transportation. ._ 15Wells, artesian. _.___.... 28,30, 50, 56,62,63, 73, 74
basement complex--.- -------- 25-26,56-57Chico formation......... 27-28,56-57,73-74depth... - - - 25,27,28,66,73,74 description...___.-.__----__-------------- 79-86discharge. - 36-37,38,60,63,66logs -. 28,30,37,38,46,47,48,95-99 morainal an d fluvioglacial deposits _._.-.- 45,47 numbering system- . 6-7older alluvium - ------- -- 47, 57Plutos Cave basalt.--.--- ----- 42,75,76Umpqua formation.. _ 30,56-57,74,75,77 water-level measurements..__ . 87-94

INDEX 115
Wells Continuedwestern Cascades--.............. 36-38,56,62,76yield characteristics............._ 36,42,45,49
\younger alluvium-.................... 48-49,57See also. Domestic water supplies, Irri
gation water supplies, Municipal water supplies, Stock water sup plies.
Western Cascades, chemical quality of thewater_......................... 77
description............................ 21,32-38geologic history.---...------.-._---_-__ 49,52-53
Page Whitney Creek. -- ---.--.-..... - 40Williams, Howel, quoted....___._____- 7,30Willow Creek, ground water, serpentine...... 71Willow School-......-.-......------.---..-..- 29
Yellow Butte, horst, description...__._ 24,49,50 Yield factor, definition... __ 23-24 Yreka, precipitation._... .-_-. .... . 13-15
source of water....--..---------------- 48-49,57Yreka Creek, logs of wells.--------.._...--- 48
U.S. GOVERNMENT PRINTING OFFICE : I960 O -506344