geological mediation of hydrologic process, channel morphology and
TRANSCRIPT

i
Geological Mediation of Hydrologic Process, Channel Morphology and Resultant Planform Response to Closure of Dwinnell Dam, Shasta River, California
By
ANDREW LARSEN NICHOLS B.A. (Middlebury College) 2001
THESIS
Submitted in partial satisfaction of the requirements for the degree of
MASTER OF SCIENCE
in
Geology
in the
OFFICE OF GRADUATE STUDIES
of the
UNIVERSITY OF CALIFORNIA
DAVIS
Approved:
______________________________________
______________________________________
______________________________________
Committee in Charge
2008

ii
Table of Contents List of Figures .............................................................................................................. iii List of Tables................................................................................................................ vi Abstract ....................................................................................................................... vii Introduction .................................................................................................................. 1 Background................................................................................................................... 3
Hydrologic Controls on Channel Form........................................................................ 3 Meander Wavelength .................................................................................................. 4 River Regulation Effects on Meander Wavelength ...................................................... 5
Study Segment............................................................................................................... 6
Geologic Characteristics of the Shasta River Basin ..................................................... 6 Geomorphic and Hydrologic Characteristics of the Study Segment ............................. 8
Methods....................................................................................................................... 11 Hydrology................................................................................................................. 11 Channel Morphology ................................................................................................ 13 Measurement of Channel Change.............................................................................. 17
Results ......................................................................................................................... 17 Longitudinal Trends in Hydrology: ........................................................................... 17 Longitudinal Trends in Channel Morphology............................................................ 19 Hydrologic Alteration ............................................................................................... 21 Post-dam change in channel planform....................................................................... 23
Discussion .................................................................................................................... 23 Geologic Controls on Hydrologic Regime Condition and Channel Morphology ........ 24 Mediation of Post-Dam Channel Planform Change ................................................... 28
Conclusions ................................................................................................................. 31
References ................................................................................................................... 56

iii
List of Figures Figure 1: Simplified geologic map of the Shasta River Basin. The study segment is
located in Shasta Valley proper between river kilometer (Rkm) 80 and Rkm 25. Field surveys were conducted at the Fontius and Nelson Ranch study areas……………..…………………………………………………33
Figure 2: Schematic defining individual meander bends. The distance between
successive bend inflection points is identified as a half wavelength (λ/2)………………………………………………………………………34
Figure 3a: Conceptual diagram illustrating mean annual flow magnitudes on the
Shasta River and Big Springs Creek……….…………………………….35 Figure 3b: Conceptual diagram illustrating longitudinal changes in estimated bankfull
discharge magnitude on the Shasta River prior to and following closure of Dwinnell Dam in 1928…………………………………………………...36
Figure 4: Longitudinal profile of Shasta Valley between Rkm 77 and Rkm 25, as
derived from a 10-meter resolution digital elevation model (DEM)….…37 Figure 5a: Hydrographs of mean daily discharge in the Shasta River at Edgewood
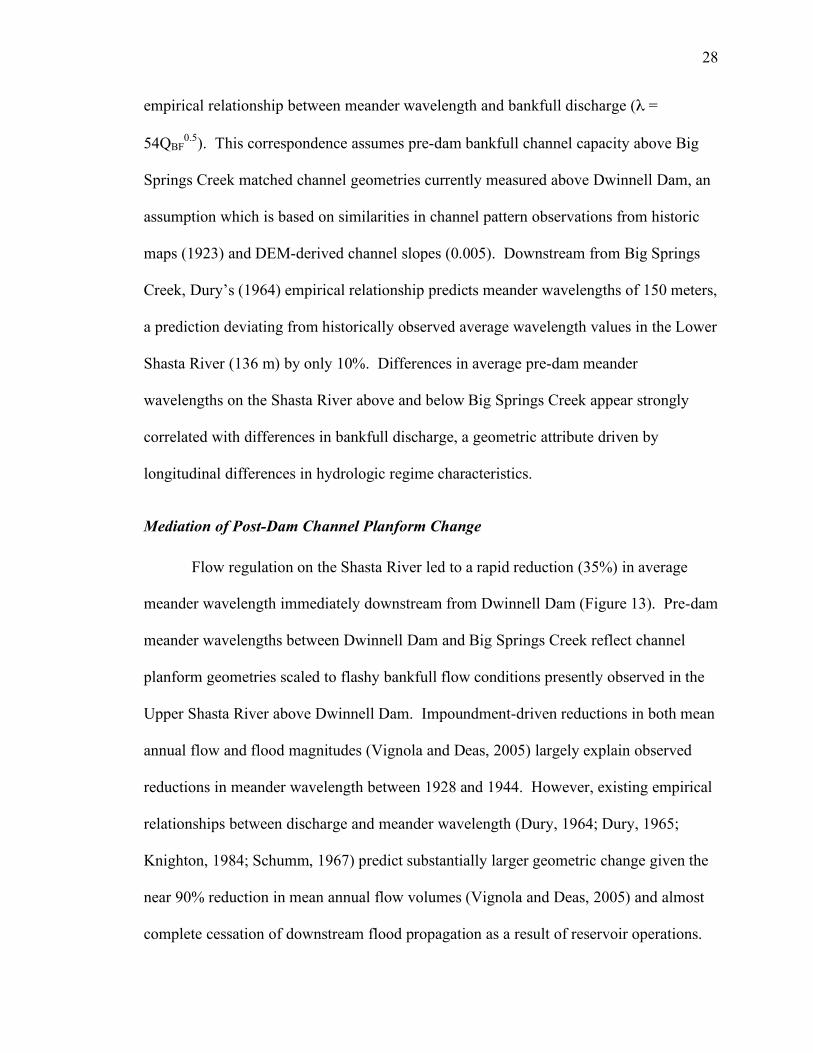
(above Dwinnell Dam) and Montague (below Dwinnell Dam). Non-irrigation season (October 1 to March 31) baseflow magnitudes at both stream gauges are identified……………..……………………………….38
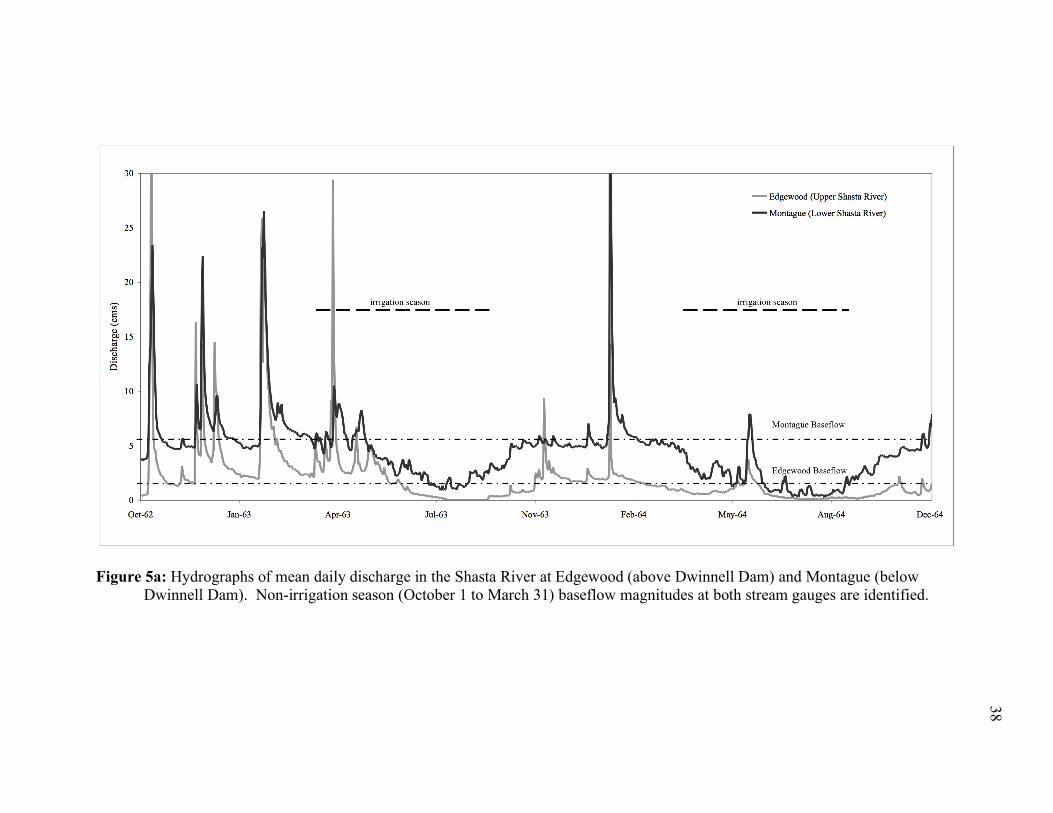
Figure 5b: Normalized by mean annual flow, the largely spring-fed hydrograph for
the Lower Shasta River at Montague exhibits significantly less flow variability than the runoff-dominated hydrograph for the Upper Shasta River at Edgewood………………………………...……………………..39
Figure 6a: ln(dQ) versus ln(Q) relationships for all streamflow recession periods
measured in the Upper Shasta River at Edgewood. Fit to a least squares regression model, the resulting slope of 1.51 indicates streamflow generation processes are dominated by surface runoff and shallow aquifer flow (see Tague and Grant, 2004)… …………………………….............40
Figure 6b: ln(dQ) versus ln(Q) relationships for all streamflow recession periods
measured in the Lower Shasta River at Montague. Fit to a least squares regression model the resulting slope of 1.58 indicates streamflow generation processes following recession periods are dominated by surface runoff and shallow aquifer flow (see Tague and Grant, 2004).…………………………………………………………………….41

iv
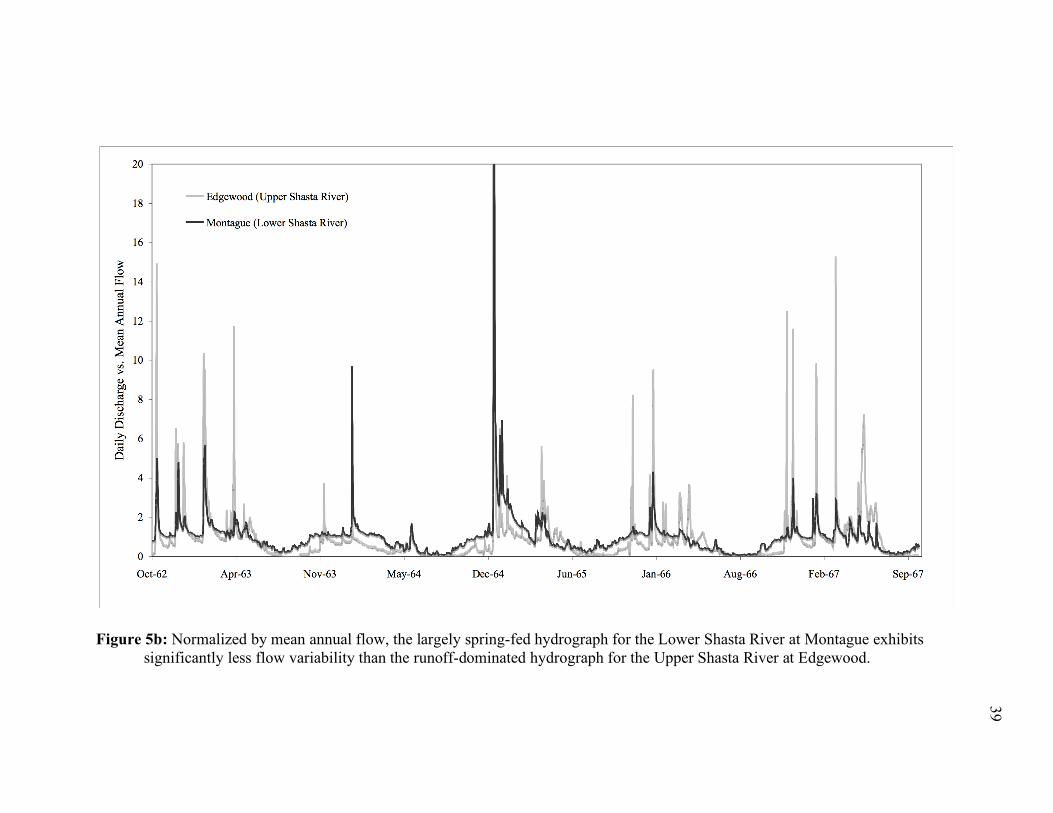
Figure 6c: ln(dQ) versus ln(Q) relationships for all streamflow recession periods measured in the Fall River, a spring-fed stream in Northern California. Fit to a least squares regression model, the resulting slope of 3.56 indicates streamflow generation processes following recession periods are dominated by deep aquifer flow paths (see Tague and Grant, 2004). This plot is presented for comparison to the largely runoff-dominated recession characteristics of both the Upper and Lower Shasta River segments…....42
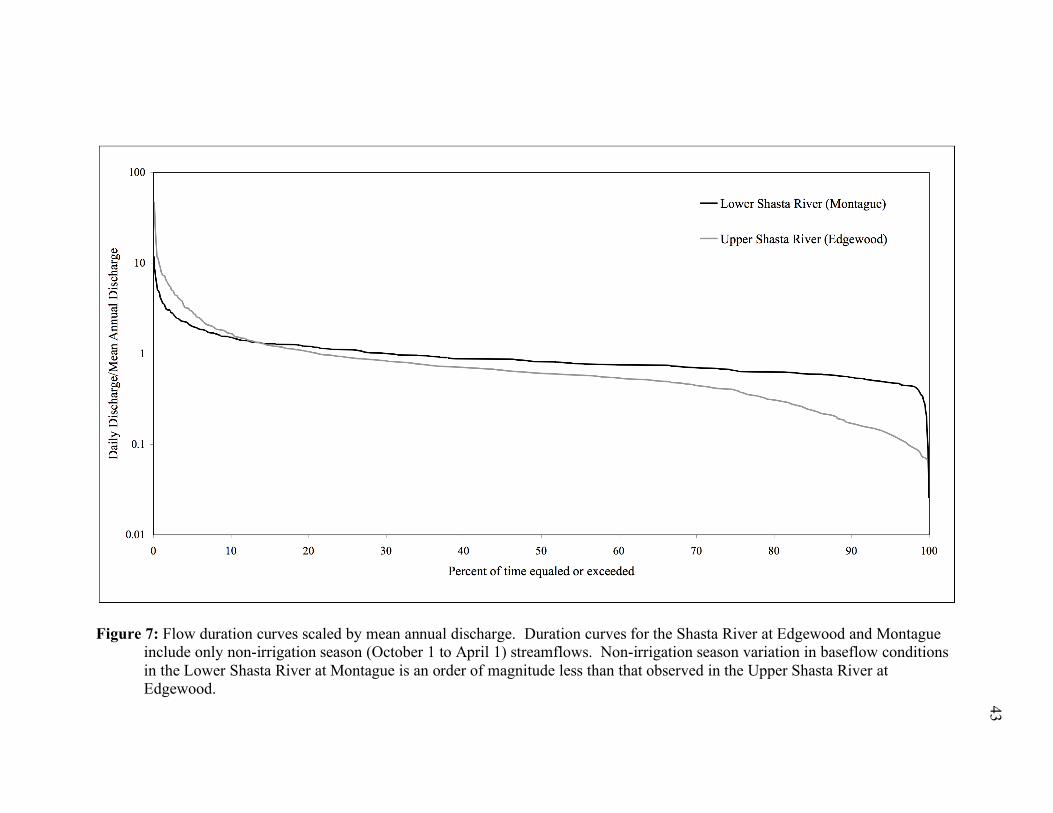
Figure 7: Flow duration curves scaled by mean annual discharge. Duration curves
for the Shasta River at Edgewood and Montague include only non-irrigation season (October 1 to April 1) streamflows. Non-irrigation season variation in baseflow conditions in the Lower Shasta River at Montague is an order of magnitude less than that observed in the Upper Shasta River at Edgewood……………………………………………………..…………43
Figure 8a: Representative channel cross-section located in the Upper Shasta River at
the Fontius study area. Mean annual flow is approximately 16% of estimated bankfull discharge in this runoff-dominated reach……………44
Figure 8b: Representative channel cross-section located in the Lower Shasta River at
the Nelson Ranch study area. Mean annual flow is approximately 57% of estimated bankfull discharge in this spring-dominated reach………...….44
Figure 9: Cumulative particle size distributions in accessible gravel patches located
at the Fontius (FON) and Nelson Ranch (NEL) study areas. Gravel patches are defined as habitat units containing gravel suitable for spawning salmonids……….......................................................................45
Figure 10: Shasta River channel pattern discrimination based on slope-discharge
relationships [modified from Church (2002)]. Field observations indicate channel patterns in Upper Shasta River reaches do not strictly conform to established criteria for “wandering” channels, and are thus here characterized as either laterally-active anabranching or single-thread meandering gravel bed reaches. Lower Shasta River reaches exhibit single-thread meandering patterns dominated by fine gravel and sand bed materials, a channel pattern consistent with Church’s (2002) slope-discharge criteria………………….……………………………………...46
Figure 11a: Maximum annual mean-daily discharge measurements recorded in the
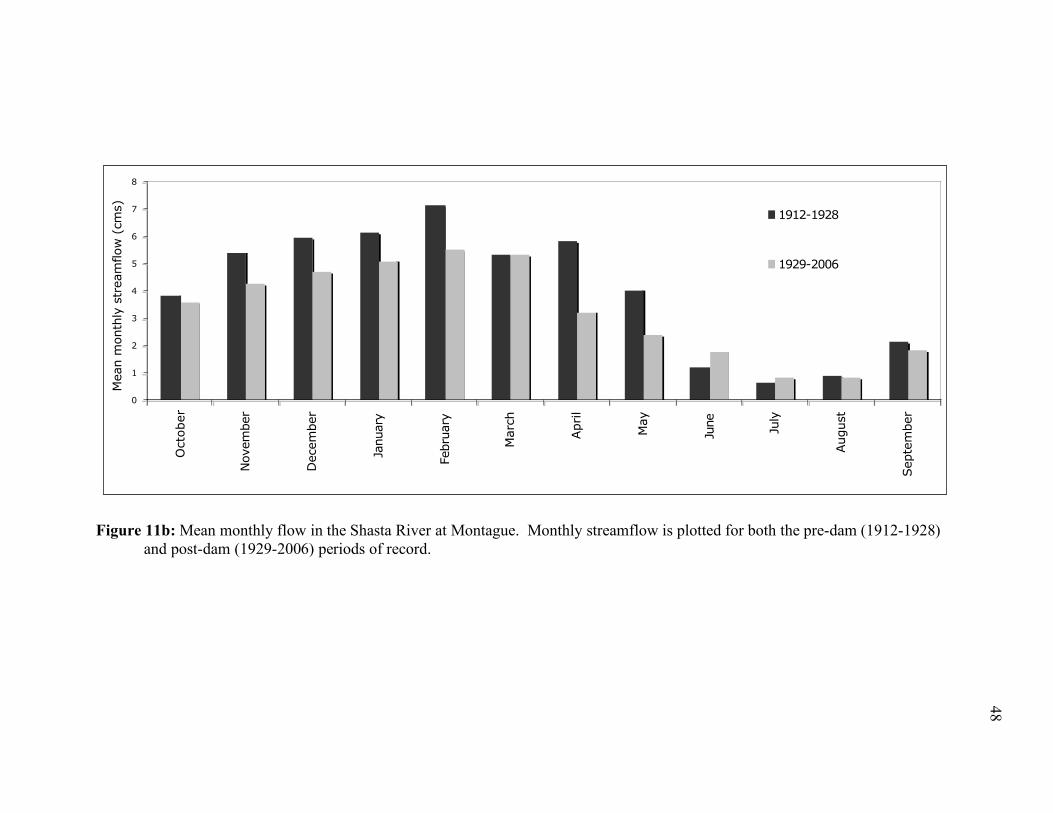
Shasta River at Montague…………...…………………………………...47 Figure 11b: Mean monthly flow in the Shasta River at Montague. Monthly streamflow
is plotted for both the pre-dam (1912-1928) and post-dam (1929-2006) periods of record…………………………………………………………48
v
Figure 12a: Half meander wavelength (λ/2) magnitudes measured along the Shasta River downstream from Dwinnell Dam in 1923……………………........49
Figure 12b: Half meander wavelength (λ/2) magnitudes measured along the Shasta
River downstream from Dwinnell Dam in 1944……...…………...…......50 Figure 12c: Half meander wavelength (λ/2) magnitudes measured along the Shasta
River downstream from Dwinnell Dam in 1998………..………………..51 Figure 13: Ten-point moving averages of half meander wavelength (λ/2) magnitudes
measured along the Shasta River below Dwinnell Dam in 1923 (pre-dam), 1944 (post-dam) and 1998 (post-dam)………………………………...…52
Figure 14: Illustration of channel planform changes on the Shasta River following
construction of Dwinnell Dam in 1928: a) Upper Shasta River at Rkm 56; b) Lower Shasta River at Rkm 41. Average meander wavelength has decreased approximately 35% between Rkm 65 and Rkm 54 following dam construction, resulting in an increase in the number of individual meander bends. Average meander wavelength has decreased by only 2% below Rkm 44……………………………………………………………53

vi
List of Tables Table 1: Comparison of hydrologic and geomorphic characteristics of the Shasta
River in channel reaches above Lake Shastina, between Dwinnell Dam and Big Springs Creek, and below Big Springs Creek…………………..54
Table 2: Gauge identification numbers and periods of record for USGS stream
gauges on the Shasta River………………………………….…………...54 Table 3: Comparison of Shasta River mean daily discharge flow characteristics, as
measured at Montague, for periods prior to (1912 to 1928) and following (1929 to 2006) construction of Dwinnell Dam…………………………..55
Appendices
Appendix A. Topographic Survey Data………………………………………………..60 Appendix B. Pebble Count Data………………………………………………..…….130

vii
Abstract
In the absence of flow regulation, alluvial channel morphologies depend on
natural hydrologic regime conditions defined by the magnitude, frequency, timing and
variability of measured streamflows. Because hydrologic regime conditions vary in part
with the spatial distribution of underlying geology, the character of downstream channel
form response to fluvial impoundment is mediated by not only hydrogeomorphic regime
changes (i.e. changes to streamflow and sediment transport characteristics) imparted by
dam operations, but also by the location of a dam with respect to the geologically-
controlled geomorphic and hydrologic organization of the fluvial system. The Shasta
River, California was selected for a case study exploring both the longitudinal variability
of channel planform geometry resulting from downstream differences in underlying
geology and dependent hydrologic regime characteristics prior to flow regulation, as well
as mediation of the longitudinal extent of channel planform change in response to
streamflow alteration associated with the construction of Dwinnell Dam in 1928. Pre-
and post-impoundment meander wavelength geometries, documented through analysis of
historic maps and aerial photographs in a GIS, were utilized to assess longitudinal trends
in geomorphic change associated with dam construction, associated flow regulation, and
downstream mediation of dam-induced hydrologic regime change in response to
voluminous spring-fed tributary inflows.
Results show that pre-dam longitudinal patterns in meander wavelength vary
directly with changes in bankfull discharge magnitude downstream from the spring-fed
tributary Big Springs Creek, located approximately 11 river kilometers below the present
impoundment location. Observed downstream changes in bankfull discharge and
viii
dependent planform channel geometry are coincident with a discrete change in
hydrologic regime below the groundwater and spring-fed tributary. Following
impoundment, meander wavelength decreased by 35% in channel reaches between
Dwinnell Dam and the Big Springs Creek-Shasta River confluence, but exhibited only a
2% reduction across freely-meandering reaches downstream from the spring-fed
tributary. Results indicate that while flow regulation has had profound impacts on
channel planform geometry immediately downstream from the dam, the longitudinal
extent of geometric change is strongly mediated by large downstream spring-fed flow
contributions, which minimize dam-induced hydrologic regime alteration. These
observations hold promise in helping river mangers identify Shasta River channel reaches
along which geomorphic process restoration activities may be effective

1
Introduction
Predicting the response of channel form to dam-induced flow regulation remains a
fundamental challenge for scientists and water resource managers. While decades of
geomorphic theory development and empirical studies (Petts and Gurnell, 2005) provide
a foundation for predicting general trends in form response to hydrogeomorphic regime
alteration (i.e. changes to streamflow and sediment transport characteristics), results of
case studies are characterized as much by variability as by pattern (Williams and
Wolman, 1984). This suggests dam-driven hydrogeomorphic changes alone cannot be
used to predict form response. It is becoming increasingly clear that physical factors
exogenous to impoundment-driven changes to streamflow and sediment transport, such
as geomorphic organization (Grams and Schmidt, 2002) and spatially variable,
geologically-controlled streamflow generation processes dominated by either surface
runoff or groundwater inflow (Tague and Grant, 2004), strongly influence the direction,
magnitude and extent of dam-induced hydrogeomorphic regime change and resultant
downstream channel form alterations. As such, case studies are needed which not only
assess hydrogeomorphic regime change resulting from dam construction and operation,
but also frame this change within a broader physical context incorporating spatially
variable geologic and hydrologic conditions - exogenous factors which drive channel
form in the absence of river regulation and moderate the downstream response following
impoundment (Grant et al., 2003).
The Shasta River in Siskiyou County, California (Figure 1) is used here as a case
study to assess how geologically-driven downstream variations in hydrologic regime,
defined as the magnitude, frequency, timing and variability of measured streamflows,

2
influence both observable differences in channel form in the absence of dam-induced
streamflow regulation, and moderation of planform response following dam closure. As
such, the hypothesis to test is: spring-fed tributary flow contributions resulting from a
discrete change in bedrock lithology and dependent groundwater aquifer characteristics
downstream from the impoundment location forced an abrupt longitudinal change in
channel form prior to dam construction - an equilibrium channel form which remained
largely unaltered by upstream flow regulation following the 1928 closure of Dwinnell
Dam. Comparison of unregulated streamflow characteristics upstream and downstream
from the Shasta River’s confluence with the predominantly groundwater-fed Big Springs
Creek (Figure 1), a large tributary with minimally-variable flow characteristics and mean
annual flow magnitudes nearly double those measured in upstream reaches, allows
identification of pre-dam differences in channel-forming flows (i.e. bankfull discharge)
(Wolman and Miller, 1960) as a result of discrete hydrologic regime change largely
driven by intra-basin differences in underlying bedrock geology.
Using data compiled from long-term flow records upstream and downstream of
Big Springs Creek, the nature of hydrologic alteration in response to closure of Dwinnell
Dam is examined. Measurements of the increase or decrease, rate and magnitude of
meander wavelength changes in response to dam closure allow assessment of the nature
and longitudinal extent of channel form alteration within the hydrologic and geologic
framework of the unregulated stream.
3
Background
Hydrologic Controls on Channel Form
Meandering alluvial streams laterally erode and deposit sediment, creating
floodplain surfaces and cross-sectional channel geometries morphologically adjusted to
accommodate bankfull discharge. Due to a general correspondence with calculated
effective discharge, or the range of discharges which cumulatively transport the majority
of sediment over time (Andrews, 1980; Wolman and Miller, 1960), bankfull flow is
viewed as a fundamental scaling variable in determining channel dimensions in
equilibrium streams. Consistent empirical relations between bankfull discharge and
channel form variables (e.g. width, depth, meander wavelength) further suggest discharge
magnitude represents a dominant control on channel forms (Knighton, 1984).
Channel size and geometry are influenced not only by discharge magnitude, but
also by hydrologic regime conditions (Pickup and Warner, 1976). By controlling the
amount of sediment transport, or geomorphic work performed by various discharges,
flow variability exerts a fundamental control on channel size. Streams with minimal flow
variation (e.g. spring-fed streams) exhibit cross-sectional channel geometries scaled to
medium and low magnitude flows (Pickup and Warner, 1976), while channel forms in
flashy river basins are principally scaled to relatively high-magnitude flows with
recurrence intervals of approximately 2 years (Wolman and Miller, 1960). As such,
streamflow generation processes, given their correlation to hydrologic regime conditions
(Tague and Grant, 2004), can also be used to understand intra and inter-basin differences
in channel size and geometry. Streams with flow regimes dominated by groundwater
discharge from springs exhibit bankfull channel forms scaled to minimally-variable flow

4
conditions (Sear et al., 1999; Whiting and Moog, 2001). Hydrologic basins characterized
by surface and shallow subsurface runoff exhibit much flashier hydrographs (Tague and
Grant, 2004) and resultant channel geometries scaled to less-frequent, large magnitude
flood events (Whiting and Moog, 2001). Relating channel form, and particularly
bankfull geometry, to hydrologic regime conditions suggests that within a basin,
downstream changes in the magnitude, frequency and variability of streamflow will elicit
a predictable response in channel bankfull capacity. Such downstream changes in
channel geometry and bankfull flow should lead to changes in discharge-dependent
channel form variables, such as meander wavelength.
Meander Wavelength
Planform geometry, and particularly meander wavelength (L) (Figure 2), in stable
alluvial rivers is principally scaled to discharge (Q) and approximated by the relationship
L ∝ Q0.5 (Knighton, 1984). While significant argument exists regarding which discharge
(e.g. bankfull, mean annual, etc.) controls meander wavelength dimensions (Carlston,
1965; Dury, 1964; Dury, 1965), it is largely agreed that a small range of flows determines
meander wavelength, the magnitude of which varies with sediment size (Knighton, 1984;
Schumm, 1967). Although shown to be inversely proportional to the cohesiveness of
boundary materials, meander wavelength in channel reaches exhibiting minimal
downstream variations in sediment load character is largely determined by available
discharge (Schumm, 1967).
5
River Regulation Effects on Meander Wavelength
Fluvial impoundment and resultant reductions in discharge and sediment transport
produce complex adjustments in channel planform in alluvial rivers (Petts, 1979;
Williams and Wolman, 1984). At the landscape scale, planform response to flow
regulation is often dominated by geometric simplification, with multi-channel braided
patterns becoming wandering/anabranching channels (Church, 1995; Wang et al., 2007),
and wandering/anabranching channels often simplifying to single-thread meandering
planforms (Wang et al., 2007). However, in regulated meandering rivers, little work has
been done to understand local changes in planform channel geometry downstream from
impoundment locations. Schumm (1969) indicates morphological pattern type in
regulated meandering streams remains relatively unchanged, with form adjustment to
hydrogeomorphic regime change principally characterized by a decrease in the average
magnitude of meander wavelength. While not specifically addressing meander geometry,
Wang et al. (2007) observed increases in the number of meanders downstream from
Sanmanexia Dam on the Yellow River, China, a response geometrically demanding a
decrease in meander wavelength across the studied reach. While these studies address
meander wavelength change, observations are made across channel reaches characterized
by consistent hydrologic alteration. No work has assessed downstream trends in meander
wavelength change across channel reaches where voluminous flow accretions minimize
the degree of dam-induced streamflow alteration at some distance below an
impoundment location.

6
Study Segment
An understanding of intra-basin differences in geology, geomorphology and
hydrology is critical to identifying driving forces behind both longitudinal differences in
channel form prior to dam construction and the character of channel form change
following reservoir impoundment. The geologic, geomorphic and hydrologic
characteristics of the Shasta River Basin are provided below.
Geologic Characteristics of the Shasta River Basin
The Shasta River, the fourth largest tributary in the Lower Klamath River system,
flows approximately 95 kilometers northwestward across the Shasta Valley in Siskiyou
County, California (Figure 1). Bounded by the Scott Mountains to the west, Siskiyou
Mountains to the north, and the Cascade Volcanic Range to the south and east, the Shasta
River drainage basin exhibits considerable spatial variability in geologic and hydrologic
characteristics. Northeasterly flowing tributaries to the Shasta River drain the eastern
slopes of the Scott and Siskiyou Mountains, flowing roughly perpendicular to the
northerly strike of the geologic province known as the Eastern Klamath Belt (Hotz,
1977). In contrast, northerly and westerly flowing tributaries to the Shasta River drain
both the northern slopes of Mount Shasta and the western slopes of the Cascade Volcanic
Range, regions underlain by porous volcanic rocks of the Western and High Cascades
geologic provinces (Wagner, 1987). The Shasta River flows for most of its length along
the floor of Shasta Valley, an area underlain principally by a complex assemblage of
volcaniclastic rocks included within the High Cascades geologic province. The segment
of the Shasta River selected for study is located entirely within Shasta Valley and spans

7
approximately 55 river kilometers from the Interstate 5 crossing (Rkm 80) to the
Montague-Grenada Bridge (Rkm 25) (Figure 1).
The Eastern Klamath Belt geologic province is formed by an assemblage of
Paleozoic sediments, schists, greenstones, partially serpentinized peridotite, Mesozoic
plutonic rocks, and small volumes of Tertiary marine sediments (Chesterman and
Saucedo, 1984; Mack, 1960; Wagner, 1987). The steep eastern faces of the Scott and
Siskiyou Mountains, ranging in elevations from 500 to 2,000 meters, are drained by the
moderately dissected drainage networks (0.6 km/km2) of the Upper Shasta River, Parks
Creek, Willow Creek, Julien Creek and Yreka Creek. Mass wasting and fluvial erosion
are the dominant geomorphic processes in this region, which receives annual
precipitation between 75 and 175 centimeters, much of which falls as snow at higher
elevations (McNab and Avers, 1994). Regional runoff is rapid across the well-drained
soils (McNab and Avers, 1994).
The Western Cascades geologic province is dominated by weathered Eocene to
Miocene-aged andesite flows exposed at elevations ranging between 800 to 1,500 meters
(McNab and Avers, 1994; Wagner, 1987). Moderately steep topography, annual rainfall
of approximately 40 to 65 centimeters, and well-drained soils contribute to relatively
rapid runoff across a moderately dissected landscape (McNab and Avers, 1994) with
drainage densities of 0.48 km/km2. The Little Shasta River is the only major stream
draining the Western Cascades in the Shasta River watershed.
Rocks of the High Cascades in Shasta Valley form a complex assemblage of Plio-
Pleistocene andesitic and basaltic lava flows and volcaniclastic materials derived from a
Late Pleistocene debris avalanche from ancestral Mount Shasta (Crandell, 1989; Crandell
8
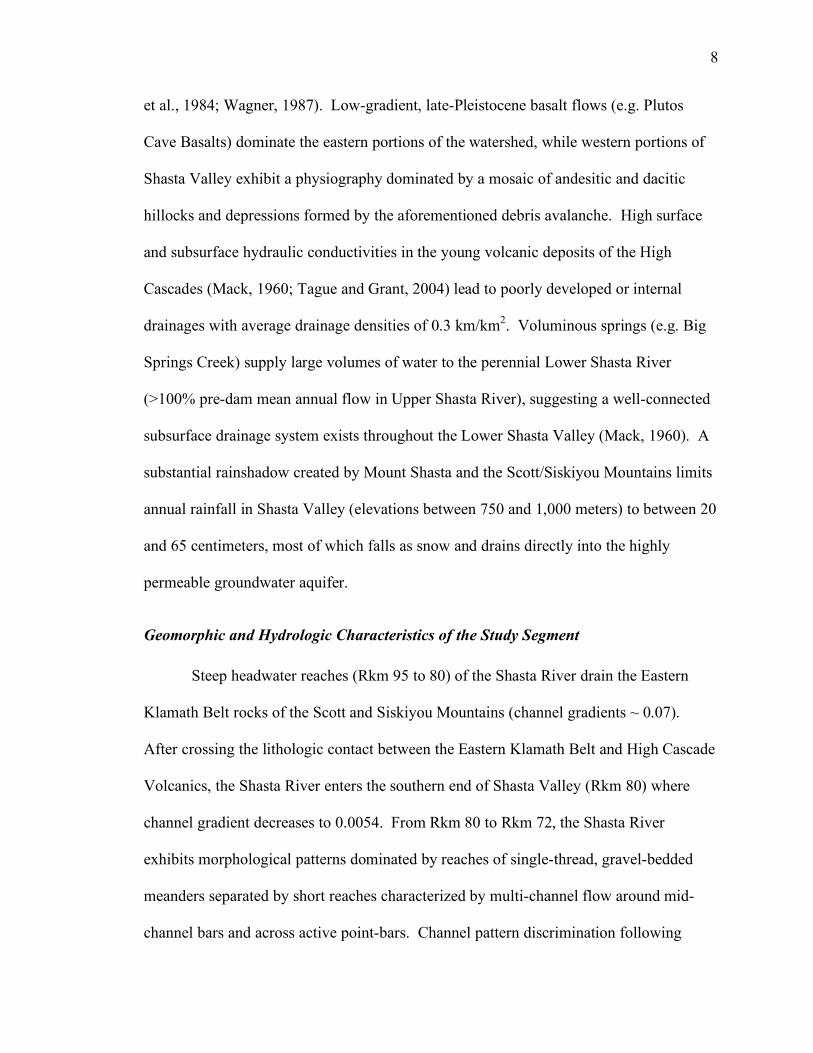
et al., 1984; Wagner, 1987). Low-gradient, late-Pleistocene basalt flows (e.g. Plutos
Cave Basalts) dominate the eastern portions of the watershed, while western portions of
Shasta Valley exhibit a physiography dominated by a mosaic of andesitic and dacitic
hillocks and depressions formed by the aforementioned debris avalanche. High surface
and subsurface hydraulic conductivities in the young volcanic deposits of the High
Cascades (Mack, 1960; Tague and Grant, 2004) lead to poorly developed or internal
drainages with average drainage densities of 0.3 km/km2. Voluminous springs (e.g. Big
Springs Creek) supply large volumes of water to the perennial Lower Shasta River
(>100% pre-dam mean annual flow in Upper Shasta River), suggesting a well-connected
subsurface drainage system exists throughout the Lower Shasta Valley (Mack, 1960). A
substantial rainshadow created by Mount Shasta and the Scott/Siskiyou Mountains limits
annual rainfall in Shasta Valley (elevations between 750 and 1,000 meters) to between 20
and 65 centimeters, most of which falls as snow and drains directly into the highly
permeable groundwater aquifer.
Geomorphic and Hydrologic Characteristics of the Study Segment
Steep headwater reaches (Rkm 95 to 80) of the Shasta River drain the Eastern
Klamath Belt rocks of the Scott and Siskiyou Mountains (channel gradients ~ 0.07).
After crossing the lithologic contact between the Eastern Klamath Belt and High Cascade
Volcanics, the Shasta River enters the southern end of Shasta Valley (Rkm 80) where
channel gradient decreases to 0.0054. From Rkm 80 to Rkm 72, the Shasta River
exhibits morphological patterns dominated by reaches of single-thread, gravel-bedded
meanders separated by short reaches characterized by multi-channel flow around mid-
channel bars and across active point-bars. Channel pattern discrimination following
9
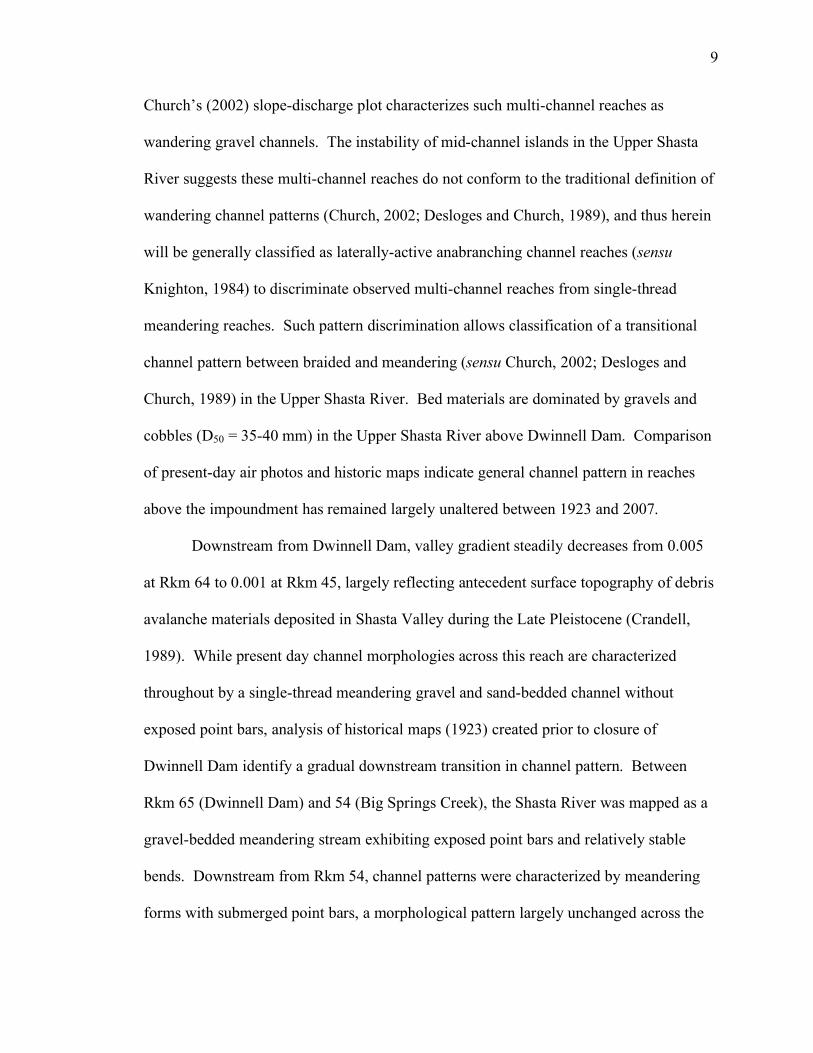
Church’s (2002) slope-discharge plot characterizes such multi-channel reaches as
wandering gravel channels. The instability of mid-channel islands in the Upper Shasta
River suggests these multi-channel reaches do not conform to the traditional definition of
wandering channel patterns (Church, 2002; Desloges and Church, 1989), and thus herein
will be generally classified as laterally-active anabranching channel reaches (sensu
Knighton, 1984) to discriminate observed multi-channel reaches from single-thread
meandering reaches. Such pattern discrimination allows classification of a transitional
channel pattern between braided and meandering (sensu Church, 2002; Desloges and
Church, 1989) in the Upper Shasta River. Bed materials are dominated by gravels and
cobbles (D50 = 35-40 mm) in the Upper Shasta River above Dwinnell Dam. Comparison
of present-day air photos and historic maps indicate general channel pattern in reaches
above the impoundment has remained largely unaltered between 1923 and 2007.
Downstream from Dwinnell Dam, valley gradient steadily decreases from 0.005
at Rkm 64 to 0.001 at Rkm 45, largely reflecting antecedent surface topography of debris
avalanche materials deposited in Shasta Valley during the Late Pleistocene (Crandell,
1989). While present day channel morphologies across this reach are characterized
throughout by a single-thread meandering gravel and sand-bedded channel without
exposed point bars, analysis of historical maps (1923) created prior to closure of
Dwinnell Dam identify a gradual downstream transition in channel pattern. Between
Rkm 65 (Dwinnell Dam) and 54 (Big Springs Creek), the Shasta River was mapped as a
gravel-bedded meandering stream exhibiting exposed point bars and relatively stable
bends. Downstream from Rkm 54, channel patterns were characterized by meandering
forms with submerged point bars, a morphological pattern largely unchanged across the
10
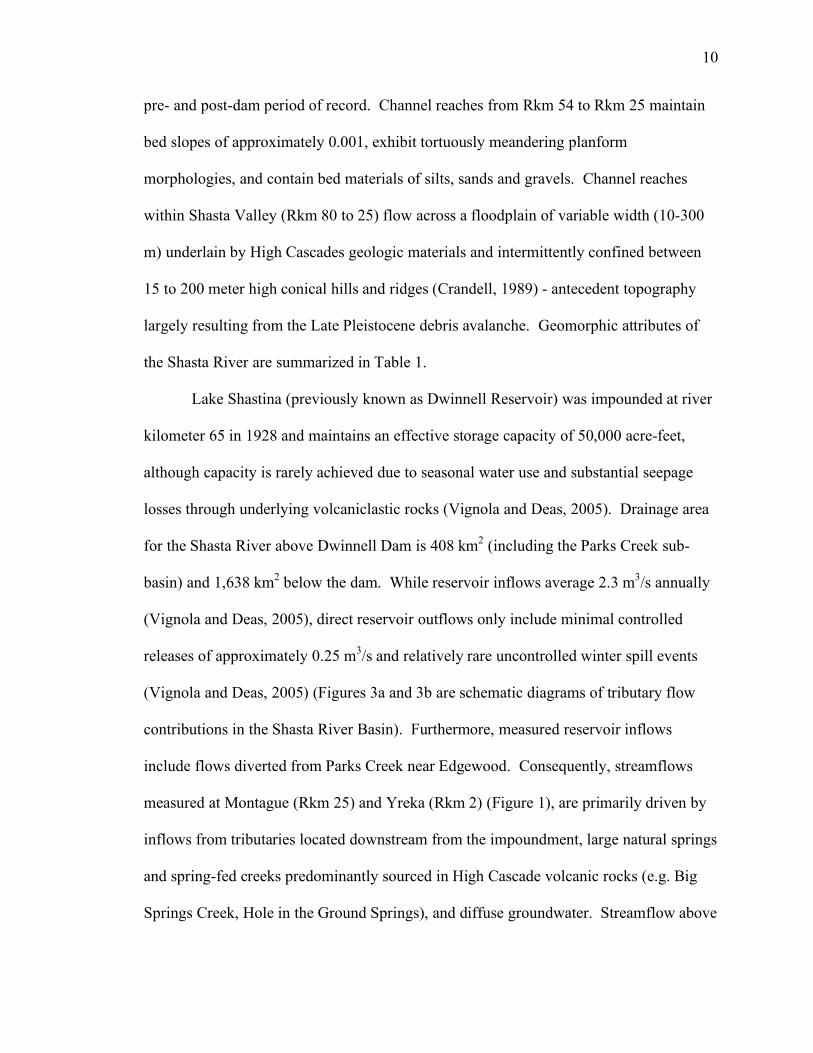
pre- and post-dam period of record. Channel reaches from Rkm 54 to Rkm 25 maintain
bed slopes of approximately 0.001, exhibit tortuously meandering planform
morphologies, and contain bed materials of silts, sands and gravels. Channel reaches
within Shasta Valley (Rkm 80 to 25) flow across a floodplain of variable width (10-300
m) underlain by High Cascades geologic materials and intermittently confined between
15 to 200 meter high conical hills and ridges (Crandell, 1989) - antecedent topography
largely resulting from the Late Pleistocene debris avalanche. Geomorphic attributes of
the Shasta River are summarized in Table 1.
Lake Shastina (previously known as Dwinnell Reservoir) was impounded at river
kilometer 65 in 1928 and maintains an effective storage capacity of 50,000 acre-feet,
although capacity is rarely achieved due to seasonal water use and substantial seepage
losses through underlying volcaniclastic rocks (Vignola and Deas, 2005). Drainage area
for the Shasta River above Dwinnell Dam is 408 km2 (including the Parks Creek sub-
basin) and 1,638 km2 below the dam. While reservoir inflows average 2.3 m3/s annually
(Vignola and Deas, 2005), direct reservoir outflows only include minimal controlled
releases of approximately 0.25 m3/s and relatively rare uncontrolled winter spill events
(Vignola and Deas, 2005) (Figures 3a and 3b are schematic diagrams of tributary flow
contributions in the Shasta River Basin). Furthermore, measured reservoir inflows
include flows diverted from Parks Creek near Edgewood. Consequently, streamflows
measured at Montague (Rkm 25) and Yreka (Rkm 2) (Figure 1), are primarily driven by
inflows from tributaries located downstream from the impoundment, large natural springs
and spring-fed creeks predominantly sourced in High Cascade volcanic rocks (e.g. Big
Springs Creek, Hole in the Ground Springs), and diffuse groundwater. Streamflow above

11
Dwinnell Dam is driven principally by direct precipitation and snowmelt runoff
generated in the Scott and Siskiyou Mountains, but also receives small baseflow
contributions from several small spring-fed tributaries (e.g. Boles and Beaughton Creeks)
(Nathenson et al., 2003).
Shasta River floodplain and gently sloping upland areas throughout Shasta Valley
are intensely irrigated and utilized for agricultural practices including, pastureland and
hay/alfalfa production (Vignola and Deas, 2005). Cattle-grazing dominates riparian land-
use with potential impacts on water quality and bank stability. Water rights in the Shasta
River are fully adjudicated, allowing riparian land owners and local irrigation districts to
divert in-stream flow during the April 1 to October 1 irrigation season. Non-irrigation
season water withdrawls are minimal.
Methods
Hydrology
Records of mean daily discharge for Shasta River stream gauges at Edgewood
(USGS Site Number 11516750; RM 48), Montague (USGS Site Number 11517000; RM
16) and Yreka, California (USGS Site Number 11517500; RM 1) were obtained from the
United States Geological Survey (USGS). Streamflow records for the Edgewood gauge
exist for water years 1963-1967, the Montague gauge for water years 1912-13, 1917-21,
1924-33, and 2002-present, and at the Yreka gauge for water years 1934-1941 and 1945
to the present (Table 2). Peak discharge records at the Edgewood gage were obtained
from the Shasta River Watermaster records for the period 1937 to 1967. Due to the
relatively short period of record (12 years), streamflow records for the Montague gauge

12
were extended by correlation with the downstream Yreka gauge, providing a continuous
record of mean daily discharges from 1912 to 2006 (excluding water years 1914-1916,
1922-1923, and 1942-1944). Following confirmation of linearity between log-
transformed mean daily discharge data over the period from 2002 to 2006 (computed
correlation coefficients of 0.89 and 0.81 for discharges <37 m3/s and >37 m3/s,
respectively) (Nielsen, 1999), the Montague streamflow record was extended through the
use of the MOVE.1 (maintenance-of-variance-extension) linear extension function
(Helsel and Hirsch, 1992) (Eq. 1).
Eq. 1: Yi = Y + (Sy/Sx)(Xi – X)
Y and X are the means and Sy and Sx the standard deviations of the logs of daily
streamflow data. Xi is the known logarithm at the long-term station (Yreka), while Yi is
the logarithm of the daily discharge estimate at the short-term station (Montague).
Synthetic mean daily discharge values for water years 2002-2006 are, on average, within
11% of measured values.
Longitudinal trends in non-dam influenced hydrologic characteristics were
assessed using records of mean daily discharge for the Shasta River at Edgewood for the
period 1963-67, and records at Montague for the periods 1912-13, 1917-21, 1924-28.
Standard long-term flow statistics were compared to statistical trends presented by
Whiting and Moog (2001) and Tague and Grant (2004). Additionally, flood recession
analysis techniques (Brutsaert and Nieber, 1977; Tague and Grant, 2004) were used to
assess longitudinal trends in streamflow generation processes in response to non-

13
irrigation season rainfall and snowmelt. Tague and Grant (2004) show that differences in
the slope of the least-squares regression of the ln(dQ) versus ln(Q) relationship during
periods of streamflow recession correspond to differences in dominant streamflow
generation processes. Slopes approaching 1.5 reflect streamflow generation processes
dominated by surface and shallow subsurface runoff, while slopes approaching or greater
than 3 reflect processes dominated by deep aquifer flow (i.e. baseflow and groundwater)
(Brutsaert and Nieber, 1977; Tague and Grant, 2004). Hydrograph recession periods
were identified from the historical mean, non-irrigation season daily streamflow record as
an arithmetic decrease in the 2-day averaged streamflow. Following Tague and Grant
(2004), dQ/dt was approximated using first order differences. Flood recession
relationships were created for both the Upper Shasta River at Edgewood and the Lower
Shasta River at Montague. Furthermore, flood recession characteristics for the spring-
dominated Fall River (CA) were identified for comparative purposes.
Comparison of flow records at the Montague gauge prior to and following dam
closure was performed through analysis of daily discharge and annual flood series data
(both measured and synthetic) using the statistical software programs Indicators of
Hydrologic Alteration (IHA) Version 7 (Richter et al., 1996) and the U.S Army Corps of
Engineers Statistical Software Package (HEC-SSP). Flood frequencies were calculated
using Bulletin 17B Log Pearson Type III distributions of synthetic and measured annual
peak discharges.
Channel Morphology
Existing channel morphological characteristics were obtained from digital
elevation models (DEM), historic maps and topographic data, and local field topographic

14
surveys performed at localities upstream (Fontius study reach; Rkm 76.8 to 76.1) and
downstream (Nelson study reach Rkm 52 to 44) from Dwinnell Dam (Figure 1). A
longitudinal profile of the entire Shasta River valley was created from a 10-meter
resolution DEM using point spacing of approximately 16 meters along the trace of the
Shasta River digitized from USGS topographic maps (Figure 4). Remotely-sensed
elevation data was augmented by channel bed, water surface elevation and cross-sectional
topographic surveys using a TOPCON HiperLite Plus Real-Time Kinematic (RTK)
survey unit at the Fontius and Nelson study reaches (Appendix A). Channel bed
elevations were surveyed along the channel thalweg from a boat, while water surface
elevations were surveyed at the intersection of the water surface with the channel bank.
Cross-section surveys included the identification of channel bankfull elevations, where
discrete topographic breaks were the primary field indicators. Changes in vegetation
assemblages and sediment size provided further field evidence of bankfull levels,
particularly in localities in the Upper Shasta River above Lake Shastina. Historic channel
cross-section geometries were identified from 1905 railroad profiles at river crossings in
Edgewood and Montague (Appendix A). Bankfull discharge magnitude estimates for
both historic and current channel cross sections were calculated using the slope-area
method based on Manning’s equation (Dalrymple and Benson, 1967). Localized bed
material pebble counts of 100 randomly selected clasts (Wolman, 1954) were conducted
in accessible gravel patches (i.e. habitat units with particle sizes suitable for salmonid
spawning) throughout both study reaches using a gravelometer template (Appendix B).
Cumulative particle size distribution curves were plotted for each pebble count, allowing
for the identification of the median diameter (D50) grain size class (Bunte and Abt, 2001).

15
Existing channel morphological patterns were determined using both field observations
and slope-discharge relationships modified from Church (2002). In localities outside of
the field study reaches, morphological pattern was primarily determined by remotely-
sensed channel gradients, channel planform characteristics observed from aerial
photographs (including bisected point bars), and descriptive notes provided on historic
maps.
Current and historic channel planform geometries downstream from Dwinnell
Dam were characterized using stream adjudication plane-table maps prepared by the
California Department of Public Works Division of Water Resources (1923; 1:3,600) and
aerial photographs taken by the United States Forest Service (1944; 1:24,000) and United
States Geological Survey (1998; 1-meter resolution). Maps and aerial photographs were
either digitally downloaded from publicly available sources or scanned from available
contact prints and transparencies at a resolution of 600 dots per inch (d.p.i). Images were
georectified using the commercially available Geographical Information System (GIS)
ArcMap 9.2. Historical images were co-registered to a common projection and
geographic coordinate system (UTM Zone 10N, WGS 83) using a baselayer comprised of
1998, 1-meter resolution, black and white digital orthophotographs previously
orthorectified by the United States Geological Survey.
Co-registration of digital maps and aerial photographs was accomplished through
polynomial georectification following methods presented by Hughes, et al. (2006). For
this study, ground control points (GCP’s) were selected from within the riparian corridor
along the Shasta River. Limiting GCP’s to areas near the river channel and floodplain
minimized skewing the image transformation towards regions away from the river (i.e.
16
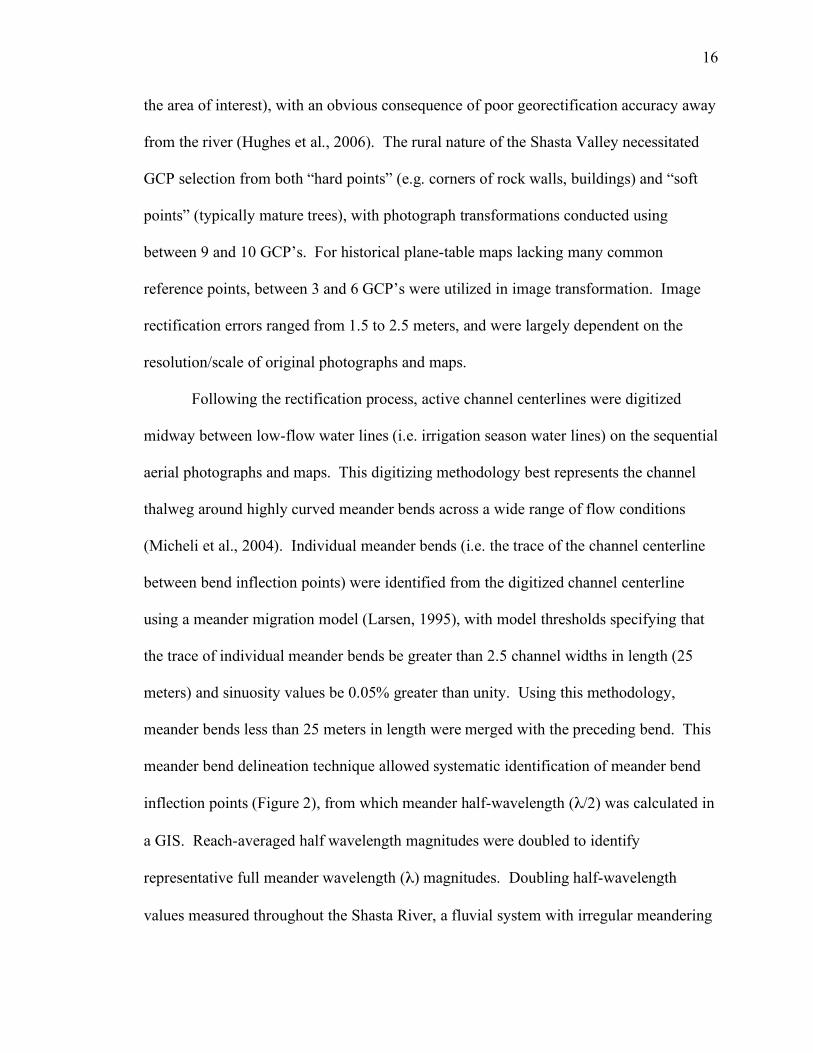
the area of interest), with an obvious consequence of poor georectification accuracy away
from the river (Hughes et al., 2006). The rural nature of the Shasta Valley necessitated
GCP selection from both “hard points” (e.g. corners of rock walls, buildings) and “soft
points” (typically mature trees), with photograph transformations conducted using
between 9 and 10 GCP’s. For historical plane-table maps lacking many common
reference points, between 3 and 6 GCP’s were utilized in image transformation. Image
rectification errors ranged from 1.5 to 2.5 meters, and were largely dependent on the
resolution/scale of original photographs and maps.
Following the rectification process, active channel centerlines were digitized
midway between low-flow water lines (i.e. irrigation season water lines) on the sequential
aerial photographs and maps. This digitizing methodology best represents the channel
thalweg around highly curved meander bends across a wide range of flow conditions
(Micheli et al., 2004). Individual meander bends (i.e. the trace of the channel centerline
between bend inflection points) were identified from the digitized channel centerline
using a meander migration model (Larsen, 1995), with model thresholds specifying that
the trace of individual meander bends be greater than 2.5 channel widths in length (25
meters) and sinuosity values be 0.05% greater than unity. Using this methodology,
meander bends less than 25 meters in length were merged with the preceding bend. This
meander bend delineation technique allowed systematic identification of meander bend
inflection points (Figure 2), from which meander half-wavelength (λ/2) was calculated in
a GIS. Reach-averaged half wavelength magnitudes were doubled to identify
representative full meander wavelength (λ) magnitudes. Doubling half-wavelength
values measured throughout the Shasta River, a fluvial system with irregular meandering

17
planforms (i.e. not perfectly sinusoidal), is likely to slightly overestimate full meander
wavelength magnitudes. However, such arithmetic manipulation is needed for
comparison with existing empirical relationships between meander wavelength and
discharge (Dury, 1965; Knighton, 1984; Schumm, 1967).,
Measurement of Channel Change
Given property access restrictions and lack of suitably detailed pre-dam channel
topography surveys (e.g. cross-sectional), measurable channel morphology change is
limited to assessment of planform geometry observed from historical maps and aerial
photographs. Consequently, metrics of channel change for this study were limited to
sinuosity and meander wavelength, with meander wavelength chosen due to established
empirical relationships between wavelength and discharge (Dury, 1965; Knighton, 1984;
Schumm, 1967) and subsequent suitability for assessing channel form change resulting
from both longitudinal changes in hydrologic regime conditions and dam-induced
hydrologic process alterations.
Results
Longitudinal Trends in Hydrology:
Shasta River stream hydrographs at Edgewood (Upper Shasta River) and
Montague (Lower Shasta River) (Figure 5a) reveal similarities and contrasts with respect
to hydrologic regime for the Upper and Lower Shasta River segments, respectively. Both
hydrographs depict flashy responses to winter and spring rainfall events, observations
quantitatively supported by flood recession analyses (Brutsaert and Nieber, 1977; Tague
and Grant, 2004) of the pre-dam hydrologic record at Montague and the entire period of
18
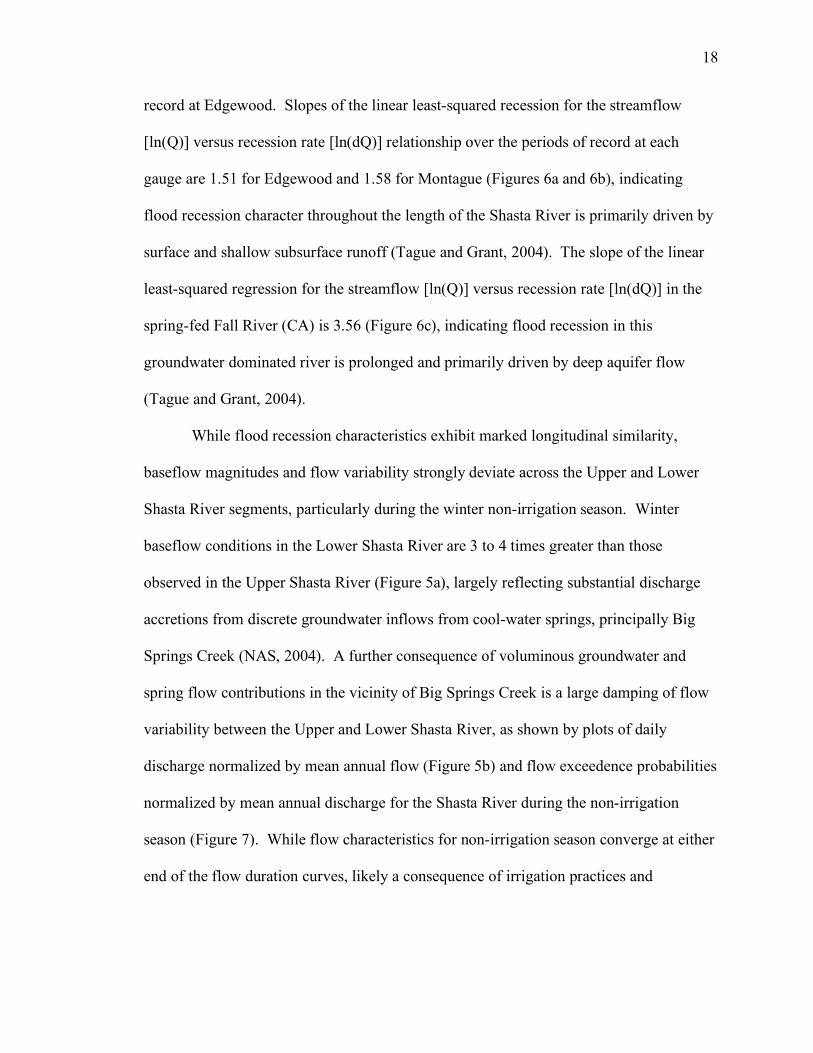
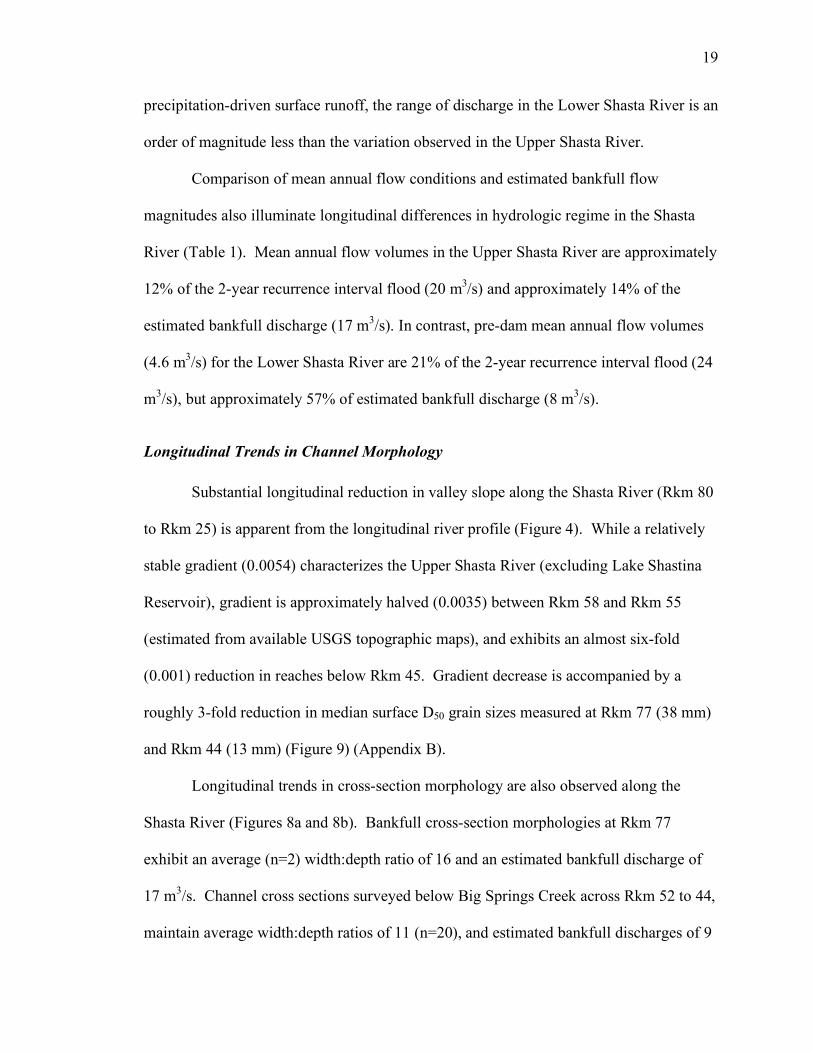
record at Edgewood. Slopes of the linear least-squared recession for the streamflow
[ln(Q)] versus recession rate [ln(dQ)] relationship over the periods of record at each
gauge are 1.51 for Edgewood and 1.58 for Montague (Figures 6a and 6b), indicating
flood recession character throughout the length of the Shasta River is primarily driven by
surface and shallow subsurface runoff (Tague and Grant, 2004). The slope of the linear
least-squared regression for the streamflow [ln(Q)] versus recession rate [ln(dQ)] in the
spring-fed Fall River (CA) is 3.56 (Figure 6c), indicating flood recession in this
groundwater dominated river is prolonged and primarily driven by deep aquifer flow
(Tague and Grant, 2004).
While flood recession characteristics exhibit marked longitudinal similarity,
baseflow magnitudes and flow variability strongly deviate across the Upper and Lower
Shasta River segments, particularly during the winter non-irrigation season. Winter
baseflow conditions in the Lower Shasta River are 3 to 4 times greater than those
observed in the Upper Shasta River (Figure 5a), largely reflecting substantial discharge
accretions from discrete groundwater inflows from cool-water springs, principally Big
Springs Creek (NAS, 2004). A further consequence of voluminous groundwater and
spring flow contributions in the vicinity of Big Springs Creek is a large damping of flow
variability between the Upper and Lower Shasta River, as shown by plots of daily
discharge normalized by mean annual flow (Figure 5b) and flow exceedence probabilities
normalized by mean annual discharge for the Shasta River during the non-irrigation
season (Figure 7). While flow characteristics for non-irrigation season converge at either
end of the flow duration curves, likely a consequence of irrigation practices and
19
precipitation-driven surface runoff, the range of discharge in the Lower Shasta River is an
order of magnitude less than the variation observed in the Upper Shasta River.
Comparison of mean annual flow conditions and estimated bankfull flow
magnitudes also illuminate longitudinal differences in hydrologic regime in the Shasta
River (Table 1). Mean annual flow volumes in the Upper Shasta River are approximately
12% of the 2-year recurrence interval flood (20 m3/s) and approximately 14% of the
estimated bankfull discharge (17 m3/s). In contrast, pre-dam mean annual flow volumes
(4.6 m3/s) for the Lower Shasta River are 21% of the 2-year recurrence interval flood (24
m3/s), but approximately 57% of estimated bankfull discharge (8 m3/s).
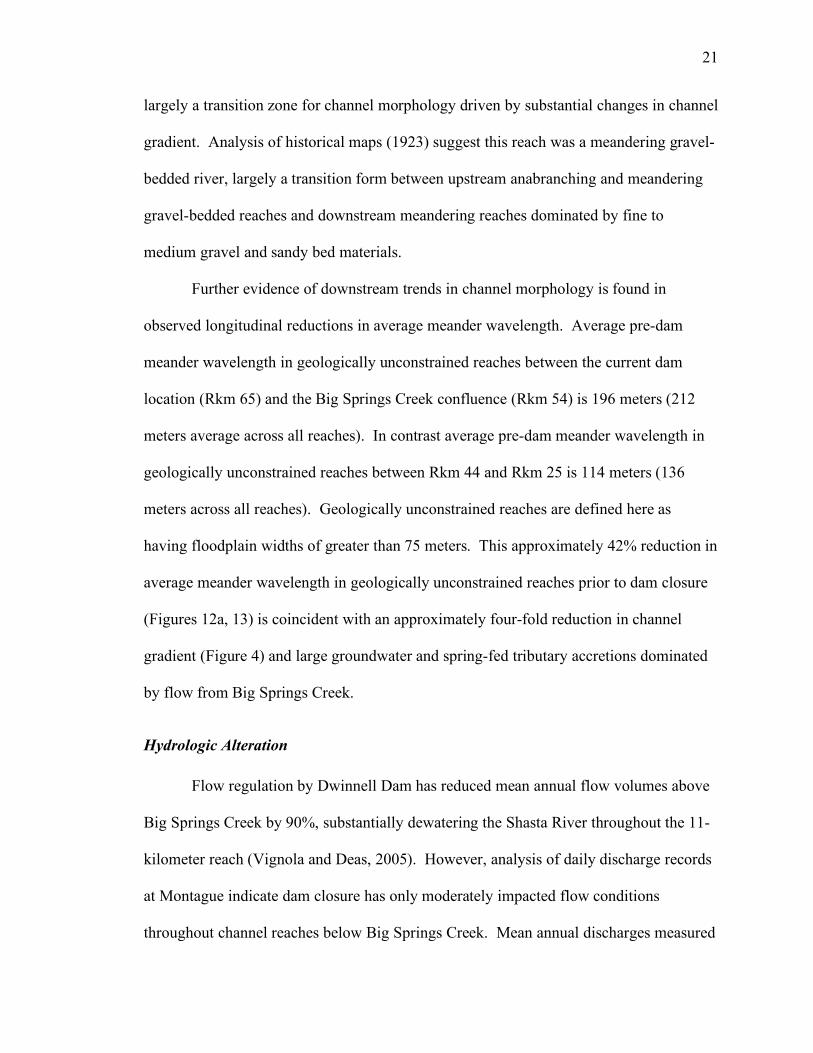
Longitudinal Trends in Channel Morphology
Substantial longitudinal reduction in valley slope along the Shasta River (Rkm 80
to Rkm 25) is apparent from the longitudinal river profile (Figure 4). While a relatively
stable gradient (0.0054) characterizes the Upper Shasta River (excluding Lake Shastina
Reservoir), gradient is approximately halved (0.0035) between Rkm 58 and Rkm 55
(estimated from available USGS topographic maps), and exhibits an almost six-fold
(0.001) reduction in reaches below Rkm 45. Gradient decrease is accompanied by a
roughly 3-fold reduction in median surface D50 grain sizes measured at Rkm 77 (38 mm)
and Rkm 44 (13 mm) (Figure 9) (Appendix B).
Longitudinal trends in cross-section morphology are also observed along the
Shasta River (Figures 8a and 8b). Bankfull cross-section morphologies at Rkm 77
exhibit an average (n=2) width:depth ratio of 16 and an estimated bankfull discharge of
17 m3/s. Channel cross sections surveyed below Big Springs Creek across Rkm 52 to 44,
maintain average width:depth ratios of 11 (n=20), and estimated bankfull discharges of 9

20
m3/s. Differences in channel bed slope largely drive observed differences in estimated
bankfull flow between the Upper and Lower Shasta River segments. Floodplain
materials throughout the Upper Shasta River are characterized by sands, gravels and
cobbles, and are heavily vegetated with willows and other riparian vegetation.
Downstream from Big Springs Creek, floodplain areas exhibit geomorphic surfaces
dominated by fine sands and silts covered with grass and other, primarily non-woody
herbaceous vegetation.
Planform morphological patterns across the study segment reflect measured
longitudinal differences in both sediment caliber (D50) and estimated bankfull discharge.
Using Church’s (2002) adaptation of Leopold and Wolman’s (1957) slope-discharge
relation (Figure 10), the Upper Shasta River above Rkm 54 plots as a wandering gravel-
bedded channel, an intermediate channel pattern which combines form characteristics of
both braided and single-thread meandering rivers (Desloges and Church, 1989), and
typically exhibits high rates of lateral migration and dissection of point bars (Burge,
2005). Because of the unstable nature of mid-channel bars in the Upper Shasta River,
such multi-channel reaches are more generally classified here as laterally-active
anabranching channels. However, Church’s (2002) slope-discharge plot does provide a
useful pattern discrimination based upon readily available hydrologic and geomorphic
data. In contrast to the Upper Shasta River, the Lower Shasta River (Rkm 54 to 24) falls
into Church’s (2002) meandering gravel-to-sand bedded pattern field. Field observations
at Rkm 77 and Rkm 52 to 44 support general morphological pattern discrimination using
Church’s (2002) slope-discharge relation above Lake Shastina and Below Big Springs
Creek. However, the channel reach immediately below Dwinnell Dam (RM 65 to 54) is
21
largely a transition zone for channel morphology driven by substantial changes in channel
gradient. Analysis of historical maps (1923) suggest this reach was a meandering gravel-
bedded river, largely a transition form between upstream anabranching and meandering
gravel-bedded reaches and downstream meandering reaches dominated by fine to
medium gravel and sandy bed materials.
Further evidence of downstream trends in channel morphology is found in
observed longitudinal reductions in average meander wavelength. Average pre-dam
meander wavelength in geologically unconstrained reaches between the current dam
location (Rkm 65) and the Big Springs Creek confluence (Rkm 54) is 196 meters (212
meters average across all reaches). In contrast average pre-dam meander wavelength in
geologically unconstrained reaches between Rkm 44 and Rkm 25 is 114 meters (136
meters across all reaches). Geologically unconstrained reaches are defined here as
having floodplain widths of greater than 75 meters. This approximately 42% reduction in
average meander wavelength in geologically unconstrained reaches prior to dam closure
(Figures 12a, 13) is coincident with an approximately four-fold reduction in channel
gradient (Figure 4) and large groundwater and spring-fed tributary accretions dominated
by flow from Big Springs Creek.
Hydrologic Alteration
Flow regulation by Dwinnell Dam has reduced mean annual flow volumes above
Big Springs Creek by 90%, substantially dewatering the Shasta River throughout the 11-
kilometer reach (Vignola and Deas, 2005). However, analysis of daily discharge records
at Montague indicate dam closure has only moderately impacted flow conditions
throughout channel reaches below Big Springs Creek. Mean annual discharges measured
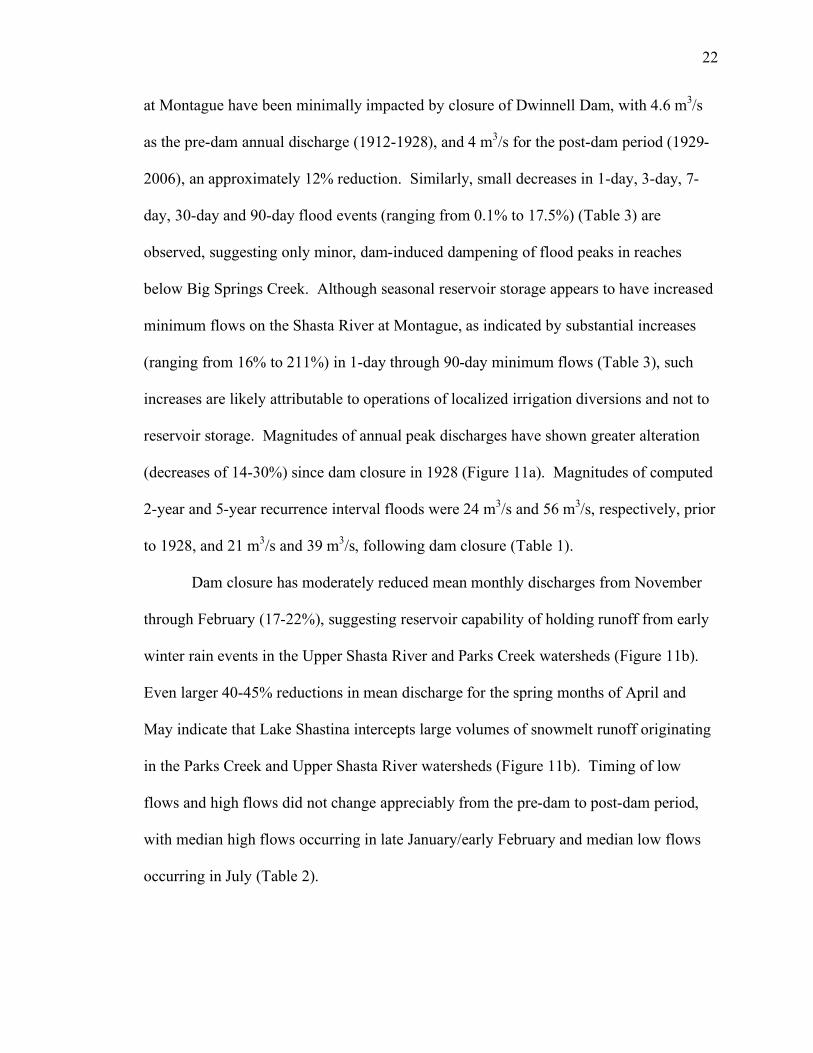
22
at Montague have been minimally impacted by closure of Dwinnell Dam, with 4.6 m3/s
as the pre-dam annual discharge (1912-1928), and 4 m3/s for the post-dam period (1929-
2006), an approximately 12% reduction. Similarly, small decreases in 1-day, 3-day, 7-
day, 30-day and 90-day flood events (ranging from 0.1% to 17.5%) (Table 3) are
observed, suggesting only minor, dam-induced dampening of flood peaks in reaches
below Big Springs Creek. Although seasonal reservoir storage appears to have increased
minimum flows on the Shasta River at Montague, as indicated by substantial increases
(ranging from 16% to 211%) in 1-day through 90-day minimum flows (Table 3), such
increases are likely attributable to operations of localized irrigation diversions and not to
reservoir storage. Magnitudes of annual peak discharges have shown greater alteration
(decreases of 14-30%) since dam closure in 1928 (Figure 11a). Magnitudes of computed
2-year and 5-year recurrence interval floods were 24 m3/s and 56 m3/s, respectively, prior
to 1928, and 21 m3/s and 39 m3/s, following dam closure (Table 1).
Dam closure has moderately reduced mean monthly discharges from November
through February (17-22%), suggesting reservoir capability of holding runoff from early
winter rain events in the Upper Shasta River and Parks Creek watersheds (Figure 11b).
Even larger 40-45% reductions in mean discharge for the spring months of April and
May indicate that Lake Shastina intercepts large volumes of snowmelt runoff originating
in the Parks Creek and Upper Shasta River watersheds (Figure 11b). Timing of low
flows and high flows did not change appreciably from the pre-dam to post-dam period,
with median high flows occurring in late January/early February and median low flows
occurring in July (Table 2).

23
Post-dam change in channel planform
Following dam closure, average meander wavelength was reduced by 35% in
unconstrained reaches above Big Spring Creek (Rkm 54), 28% in unconstrained reaches
between Rkm 54 and Rkm 44, and only 2% in meandering reaches below Rkm 44
(Figure 12). Post-dam trends in meander wavelength suggest a strong mediation of dam-
induced hydrogeomorphic process alteration below Big Springs Creek.
Discussion
Operations of Dwinnell Dam have reduced the magnitude of mean flow
conditions of the Shasta River by up to 90%, with even greater reductions in the
magnitude and frequency of high flows across the 11-kilometer segment immediately
below the impoundment. Maximum flow reductions typically result in decreased rates of
lateral migration (Shields et al., 2000), channel narrowing (Grams and Schmidt, 2002;
Williams and Wolman, 1984) and channel pattern simplification (Wang et al., 2007).
While empirical evidence suggests flow reductions should also induce a substantial
decrease in average meander wavelength (Carlston, 1965; Dury, 1965; Schumm, 1967),
observations of meander wavelength reduction are generally unreported in the literature.
The observed fluvial geomorphic response to construction of Dwinnell Dam on the
Shasta River includes rapid channel narrowing via vegetation encroachment (Pelzman,
1973) and meander wavelength reduction. However, channel planform analyses show
that while average meander bend wavelength across the 11 kilometers below Dwinnell
Dam decreased approximately 35% between 1923 and 1944, meander wavelength
reductions across channel reaches further downstream are negligible. This
longitudinally-limited planform alteration in response to reservoir impoundment can be

24
explained by flow contributions from a spring-fed tributary which are unaltered by
construction of Dwinnell Dam.
Geologic Controls on Hydrologic Regime Condition and Channel Morphology
Hydrologic regime conditions above Dwinnell Dam reflect underlying geology
dominated by Mesozoic and Paleozoic rocks of the Eastern Klamath Belt geologic
province (Figure 1). Steep topographic (and inferred hydraulic) gradients, well-drained
soils and well-developed surface flow networks force a flashy hydrologic response to
winter precipitation and spring snowmelt resulting in rapid rates of flood recession, as
evidenced by slope values of approximately 1.5 for the ln(dQ) versus ln(Q) relationship
(Tague and Grant, 2004). Furthermore, non-irrigation season baseflows are
approximately 27% of mean non-irrigation season flow volumes, and mean annual flow
is approximately 13% of the 2-year recurrence interval flood and 16% of the estimated
bankfull discharge (Table 1), results consistent with observations from runoff-dominated
streams throughout the western United States (Dunne and Leopold, 1978; Whiting and
Moog, 2001). Rapid flood recession characteristics and large deviations between mean
annual and bankfull flow magnitudes suggest there is minimal deep groundwater storage
in the Upper Shasta River watershed, resulting in a hydrologic regime dominated by
shallow subsurface and surface flow paths rapidly drained following precipitation and
snowmelt (Tague and Grant, 2004).
In contrast, deep groundwater flow sourced in the High Cascade volcanics, and
principally the Plutos Cave Basalts (Mack, 1960), strongly influences hydrologic regime
conditions below Big Springs Creek. Baseflow conditions in Big Springs Creek (>2.5
m3/s) were historically 100% of mean flow magnitude in the Upper Shasta River, and

25
currently approach 1000% of regulated mean annual flow immediately below Dwinnell
Dam. This suggests that across the period of record, large volumes of stored groundwater
were and continue to be released throughout the year at Big Springs Creek, providing a
large portion of measured baseflow discharges in the Lower Shasta River. Because
values of the ln(dQ) versus ln(Q) relationship approach 1.6 for discharge data measured
at Montague, observed spring-fed baseflow conditions are clearly augmented by rapid
surface runoff following precipitation and snowmelt in both the Siskiyou Mountains
(drained by Parks Creek) and the Cascades (drained by the Little Shasta River).
Mean annual and bankfull flow characteristics for the Lower Shasta River point to
the strong influence of spring-fed baseflows on hydrologic regime below Big Springs
Creek. Pre-dam mean annual flow magnitudes for the Lower Shasta River were 21% of
the 2-year recurrence interval flood, but approximately 57% of estimated bankfull
discharge derived from both existing cross-section surveys and channel geometries
obtained from historic (1905) railroad surveys. Whiting and Moog (2001) observed
mean annual flows of approximately 72% of the 2-year recurrence interval flood in
spring-dominated streams in volcanic terrains of Idaho and Oregon. Additionally,
discharge exceeds bankfull capacity 15% of the time in the Lower Shasta River,
compared to 2-3% of the time in the Upper Shasta River, findings similar to bankfull
exceedence probabilities found by Whiting and Moog (2001) in spring-dominated (13%)
and runoff-dominated (2%) streams.
The above analyses suggest substantial longitudinal differentiation in hydrologic
regime conditions above and below Big Springs Creek caused by spatial variability in
basin geology. Rapid drainage of Shasta River headwaters in the Siskiyou Mountains

26
leads to a flashy hydrology characterized by high seasonal variability (Figure 7) and low
baseflow conditions above Dwinnell Dam. Although peak flood flows are quickly
propagated downstream via Parks Creek, particularly during the pre-dam period, seasonal
flow variability is strongly reduced by large natural spring accretions in the vicinity of
Big Springs Creek. Consequently, the Shasta River below Big Springs Creek exhibits
hybridized characteristics of both runoff-dominated (Whiting and Moog, 2001) and
spring-dominated (Sear et al., 1999; Whiting and Moog, 2001) hydrologic systems.
These hydrologic regime differences strongly influence observed channel morphologies.
Shasta River reaches above Dwinnell Dam exhibit morphologic characteristics of
runoff-dominated streams (Whiting and Moog, 2001). Laterally active, anabranching and
meandering gravel-bedded channel patterns dominated by dissected point bars, reduced
roughness associated with a lack of aquatic vegetation, and the divergence of mean
annual flow (14%) from bankfull flow conditions match observations made by others in
streams with hydrologic regimes dominated by surface runoff (Whiting and Moog, 2001).
In contrast, channel reaches downstream from Big Springs are characterized by a
complete absence of exposed channel bars, large roughness values driven principally by
seasonal aquatic vegetation growth, and a strong convergence of mean annual flow (55%)
with bankfull flow conditions. Such morphological conditions are largely associated with
stream channels receiving a large percentage of flow from discrete and diffuse
groundwater sources (Sear et al., 1999; Whiting and Moog, 2001).
The large reduction of estimated bankfull discharge downstream from Big Springs
is strongly at odds with substantial empirical evidence showing positive correlations
between longitudinal distance downstream and bankfull flow magnitude in most

27
hydrologic systems. However, longitudinal differences in Shasta River flow variability
and resultant influence on effective discharge magnitudes upstream and downstream from
Big Springs Creek largely explain this discrepancy. While no bedload measurements
were collected for this study, relative bedload yield calculations using the sediment rating
curve Gb = jQβ (β=2.5; j=1)(Whiting and Moog, 2001) show large and infrequent floods
(>17 m3/s) perform the bulk of sediment transport in the Upper Shasta River. In contrast,
moderate flows (5.5 to 8.5 m3/s) approaching estimated bankfull discharge transport the
bulk of sediment in the Lower Shasta River at Montague. This observed longitudinal
difference in relative effective discharge is supported by geomorphic theory which
suggests flashy and highly variable discharge regimes result in channel geometries scaled
to high magnitude flows (Emmett and Wolman, 2001; Wolman and Miller, 1960), while
channel geometries in minimally variable flow regimes are largely determined by low to
moderate magnitude flows (Pickup and Warner, 1976). This result does not conform to
observations made by Whiting and Moog (2001), who found effective discharge in both
spring and runoff-dominated streams in Oregon and Idaho to approximate 2-year
recurrence interval floods. Regardless, bankfull channel capacity in the Lower Shasta
River appears principally scaled to relatively moderate flows sourced in Big Springs
Creek, discharges which continually transport sand and fine gravel bedload materials and
thus determine cross-sectional channel form.
Longitudinal differences in bankfull discharge are correlated with longitudinal
differences in average pre-dam meander wavelength below the present location of
Dwinnell Dam. Average pre-dam meander wavelength between Dwinnell Dam and Big
Springs Creek was 212 meters, an observation largely represented by Dury’s (1964)
28
empirical relationship between meander wavelength and bankfull discharge (λ =
54QBF0.5). This correspondence assumes pre-dam bankfull channel capacity above Big
Springs Creek matched channel geometries currently measured above Dwinnell Dam, an
assumption which is based on similarities in channel pattern observations from historic
maps (1923) and DEM-derived channel slopes (0.005). Downstream from Big Springs
Creek, Dury’s (1964) empirical relationship predicts meander wavelengths of 150 meters,
a prediction deviating from historically observed average wavelength values in the Lower
Shasta River (136 m) by only 10%. Differences in average pre-dam meander
wavelengths on the Shasta River above and below Big Springs Creek appear strongly
correlated with differences in bankfull discharge, a geometric attribute driven by
longitudinal differences in hydrologic regime characteristics.
Mediation of Post-Dam Channel Planform Change
Flow regulation on the Shasta River led to a rapid reduction (35%) in average
meander wavelength immediately downstream from Dwinnell Dam (Figure 13). Pre-dam
meander wavelengths between Dwinnell Dam and Big Springs Creek reflect channel
planform geometries scaled to flashy bankfull flow conditions presently observed in the
Upper Shasta River above Dwinnell Dam. Impoundment-driven reductions in both mean
annual flow and flood magnitudes (Vignola and Deas, 2005) largely explain observed
reductions in meander wavelength between 1928 and 1944. However, existing empirical
relationships between discharge and meander wavelength (Dury, 1964; Dury, 1965;
Knighton, 1984; Schumm, 1967) predict substantially larger geometric change given the
near 90% reduction in mean annual flow volumes (Vignola and Deas, 2005) and almost
complete cessation of downstream flood propagation as a result of reservoir operations.

29
Observed moderation of wavelength reduction is possibly resultant from a combination
of apparent channel accommodation within the bankfull capacity of the pre-dam
meandering gravel bed (sensu Petts, 1979; Petts, 1980; Petts and Gurnell, 2005),
unaccounted flow accretions in the form of small springs and diffuse groundwater along
downstream reaches, and occasional reservoir spill events. Accommodation within the
pre-dam channel planform could conceivably limit the magnitude of wavelength
adjustment following flow regulation. Additionally, groundwater-derived flow accretions
and occasional reservoir spill events may contribute to larger bankfull discharges (yet
unidentified due to property access restrictions) than those predicted using known dam
releases, thus resulting in the larger observed post-dam meander wavelength magnitudes.
Further work is required to determine why meander wavelength magnitudes between
Dwinnell Dam and Big Springs Creek do not scale with known releases from Lake
Shastina.
Planform wavelength downstream from river kilometer 48 remains largely
unchanged over the entire period of record (Figure 13). This lack of wavelength change
is almost certainly the result of minimal impoundment-driven alterations to spring-fed
baseflow conditions downstream from Big Springs Creek, observations substantiated by
only minor reductions in mean annual flow conditions measured at Montague. Minimal
post-dam wavelength alteration for the three kilometers downstream from Big Springs
Creeks is directly resultant from channel constriction between andesitic hillocks,
preventing lateral channel migration and subsequent wavelength change. The large
deviation between pre-dam and post-dam meander wavelength between Rkm 48 and
Rkm 51 appears to be a morphologic artifact of several in-channel impoundments built to

30
divert water prior to dam construction. Channel planform adjustments characterized by
wavelength reduction, in response to the diversion works are largely stabilized by 1944.
Such wavelength reductions are not thought to reflect channel form change in response to
dam-driven hydrogeomorphic process alterations.
Physical mechanisms linking meander wavelength reduction to bankfull discharge
are not examined as part of this study. However, such mechanisms likely reflect
hydrogeomorphic regime conditions adjusted to transport available sediment using the
least amount of energy (sensu Leopold and Maddock, 1953; Carlston, 1965). As
suggested by Wolman and Miller (1960) and Carlston (1965), moderate flows confined
within channel banks do the majority of sediment transport and thus drive channel form.
In contrast, overbank flows function mainly as downslope conduits of floodwaters and
sediment, and do not determine geometric forms of free meanders (Carlston, 1965).
Empirical evidence suggests that the reduction in the magnitude of bankfull flows implies
a concomitant reduction in channel dimensions, including meander wavelength (Carlston,
1965; Schumm, 1967). Furthermore, gradient reductions, similar to those observed just
above Big Springs Creek on the Shasta River, also result in sediment fining (Ferguson
and Ashworth, 1991; Ferguson et al., 1996) and channel pattern changes (Church, 2002),
geomorphic conditions often accompanied by channel wavelength reductions in rivers
with meandering planforms (Wang et al., 2007). Post-dam wavelength reductions on the
Shasta River are principally observed in channel reaches exhibiting pre-dam
characteristics dominated by large sediment sizes, laterally-active anabranching to
meandering gravel-bedded patterns, and bankfull channel capacities historically scaled to
accommodate flashy floods sourced in the headwaters of the Shasta River. As channel

31
gradient and boundary materials do not appreciably change across channel reaches
between Dwinnell Dam and the confluence with Big Springs Creek, dam-induced
changes to hydrogeomorphic regime conditions appear to be the principle driver of
observed channel wavelength reductions. Below Big Springs Creek, reductions in
channel slope and bed-material sizes accompanied by a change to a predominantly
spring-fed hydrologic regime appears to result in substantial reductions in meander
wavelength, as predicted by Carlston (1965) and Schumm (1967). However, minimal
variation in hydrologic regime conditions across the pre and post-dam period has resulted
in almost no alteration to channel geometries downstream from Big Springs Creek.
Conclusions
Longitudinally variable geologic conditions along the Shasta River result in
discrete differences in hydrologic regime conditions and resultant channel morphologies.
Upper Shasta River reaches are predominantly fed by flashy easterly-flowing tributaries
draining watersheds in the Eastern Klamath Belt geologic province, while flow
conditions in the Lower Shasta River below Big Springs Creek are substantially
augmented by groundwater and spring-fed baseflows sourced in the High Cascade
Volcanic Province located on the southern flanks of Mount Shasta. Flashy flow
conditions throughout the Upper Shasta River result in channel cross-sectional and
planform geometries scaled to bankfull flow conditions approaching 2-year recurrence
interval floods, a finding consistent with decades of empirical observations from runoff-
dominated streams throughout the western United States. In contrast, channel cross-
sectional and planform geometries in the Lower Shasta River are largely scaled to
consistent, lower magnitude spring-fed baseflow conditions. Following closure of

32
Dwinnell Dam, Upper Shasta River reaches across 11 kilometers below the impoundment
experienced channel narrowing via riparian vegetation encroachment (Pelzman, 1973)
and a 35% reduction in meander wavelength, morphologic alterations largely linked to
dam-induced flow regulation. Below Big Springs Creek, average meander wavelength
remains largely unchanged across both the pre- and post-dam periods, suggesting channel
geometries are scaled to spring-fed baseflow conditions with recurrence intervals of 1.1
to 1.2 years. Such baseflows remained relatively unchanged in the Lower Shasta River
across the period of record. Clearly, intra-basin differences in bedrock geology drive
fundamental differences in streamflow generation (i.e. streamflow generated from surface
runoff versus deep groundwater) (Tague and Grant, 2004), hydrologic regime conditions
(i.e. streamflow characteristics), and resultant channel morphological characteristics.
Furthermore, downstream changes in hydrologic regime conditions can regulate channel
form response to dam-induced flow regulation. As such, an understanding of spatial
differences in basin geology and dependent hydrologic regime conditions can strongly
inform predictions of the nature and longitudinal extent of both hydrologic alteration and
channel form changes following reservoir impoundment.

33
Figure 1: Simplified geologic map of the Shasta River Basin. The study segment is
located in Shasta Valley proper between river kilometer (Rkm) 80 and Rkm 25. Field surveys were conducted at the Fontius and Nelson Ranch study areas.

34
Figure 2: Schematic defining individual meander bends. The distance between
successive bend inflection points is identified as a half wavelength (λ/2).

35
Figure 3a: Conceptual diagram illustrating mean annual flow magnitudes on the Shasta
River and Big Springs Creek.

36
Figure 3b: Conceptual diagram illustrating longitudinal changes in estimated bankfull
discharge magnitude on the Shasta River prior to and following closure of Dwinnell Dam in 1928.

37
Figure 4: Longitudinal profile of Shasta Valley between Rkm 77 and Rkm 25, as derived from a 10-meter resolution digital elevation
model (DEM).
38
Figure 5a: Hydrographs of mean daily discharge in the Shasta River at Edgewood (above Dwinnell Dam) and Montague (below
Dwinnell Dam). Non-irrigation season (October 1 to March 31) baseflow magnitudes at both stream gauges are identified.
39
Figure 5b: Normalized by mean annual flow, the largely spring-fed hydrograph for the Lower Shasta River at Montague exhibits
significantly less flow variability than the runoff-dominated hydrograph for the Upper Shasta River at Edgewood.

40
Figure 6a: ln(dQ) versus ln(Q) relationships for all streamflow recession periods measured in the Upper Shasta River at Edgewood.
Fit to a least squares regression model, the resulting slope of 1.51 indicates streamflow generation processes are dominated by surface runoff and shallow aquifer flow (see Tague and Grant, 2004).

41
Figure 6b: ln(dQ) versus ln(Q) relationships for all streamflow recession periods measured in the Lower Shasta River at Montague.
Fit to a least squares regression model the resulting slope of 1.58 indicates streamflow generation processes following recession periods are dominated by surface runoff and shallow aquifer flow (see Tague and Grant, 2004).
42
Figure 6c: ln(dQ) versus ln(Q) relationships for all streamflow recession periods measured in the Fall River, a spring-fed stream in
Northern California. Fit to a least squares regression model, the resulting slope of 3.56 indicates streamflow generation processes following recession periods are dominated by deep aquifer flow paths (see Tague and Grant, 2004). This plot is presented for comparison to the largely runoff-dominated recession characteristics of both the Upper and Lower Shasta River segments.
43
Figure 7: Flow duration curves scaled by mean annual discharge. Duration curves for the Shasta River at Edgewood and Montague
include only non-irrigation season (October 1 to April 1) streamflows. Non-irrigation season variation in baseflow conditions in the Lower Shasta River at Montague is an order of magnitude less than that observed in the Upper Shasta River at Edgewood.

44
Figure 8a: Representative channel cross-section located in the Upper Shasta River at the
Fontius study area. Mean annual flow is approximately 16% of estimated bankfull discharge in this runoff-dominated reach.
Figure 8b: Representative channel cross-section located in the Lower Shasta River at the
Nelson Ranch study area. Mean annual flow is approximately 57% of estimated bankfull discharge in this spring-dominated reach.

45
Figure 9: Cumulative particle size distributions in accessible gravel patches located at the Fontius (FON) and Nelson Ranch (NEL)
study areas. Gravel patches are defined as habitat units containing gravel suitable for spawning salmonids.

46
Figure 10: Shasta River channel pattern discrimination based on slope-discharge relationships [modified from Church (2002)]. Field
observations indicate channel patterns in Upper Shasta River reaches do not strictly conform to established criteria for “wandering” channels, and are thus here characterized as either laterally-active anabranching or single-thread meandering gravel bed reaches. Lower Shasta River reaches exhibit single-thread meandering patterns dominated by fine gravel and sand bed materials, a channel pattern consistent with Church’s (2002) slope-discharge criteria.

47
0
10
20
30
40
50
60
70
80
90
1912
1920
1927
1932
1937
1942
1949
1954
1959
1964
1969
1974
1979
1984
1989
1994
1999
2004
1-d
ay m
axim
um
str
eam
flow
(cm
s)
Dw
inn
ell
Da
m c
on
str
ucte
d
Figure 11a: Maximum annual mean-daily discharge measurements recorded in the Shasta River at Montague.
48
0
1
2
3
4
5
6
7
8O
cto
ber
Novem
ber
Decem
ber
January
Febru
ary
Marc
h
April
May
June
July
August
Septe
mber
Mean m
onth
ly s
tream
flow
(cm
s)
1912-1928
1929-2006
Figure 11b: Mean monthly flow in the Shasta River at Montague. Monthly streamflow is plotted for both the pre-dam (1912-1928)
and post-dam (1929-2006) periods of record.
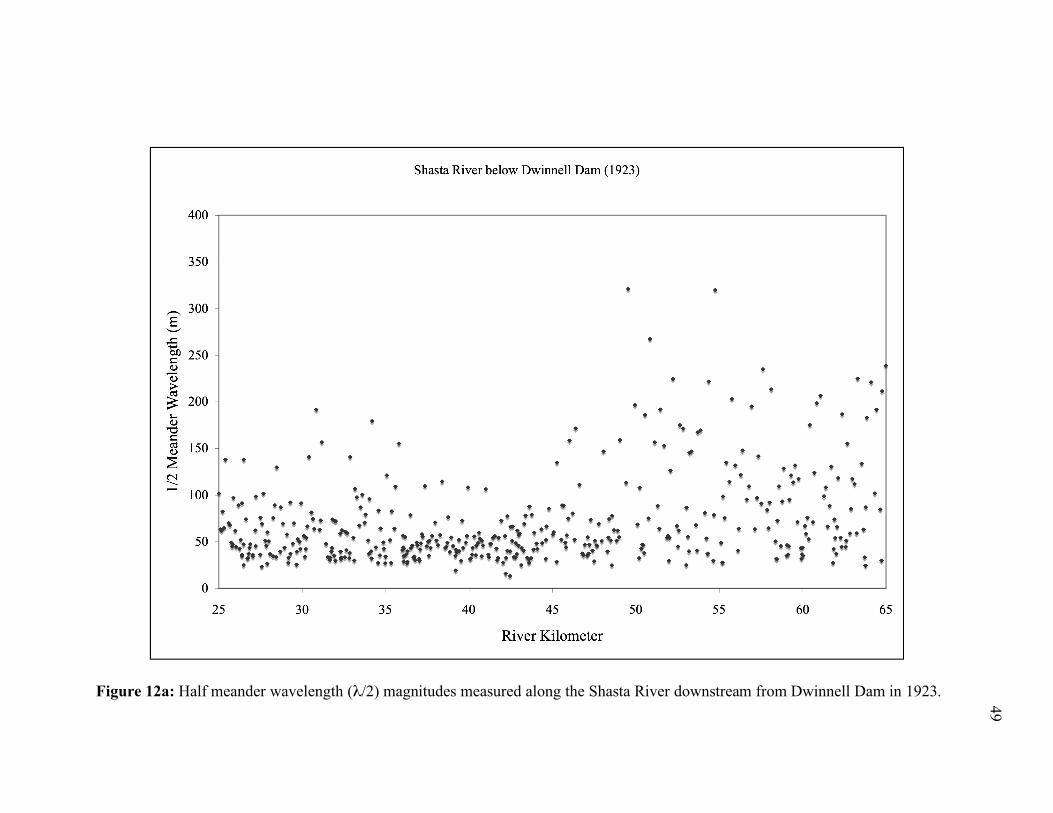
49
Figure 12a: Half meander wavelength (λ/2) magnitudes measured along the Shasta River downstream from Dwinnell Dam in 1923.

50
Figure 12b: Half meander wavelength (λ/2) magnitudes measured along the Shasta River downstream from Dwinnell Dam in 1944.

51
Figure 12c: Half meander wavelength (λ/2) magnitudes measured along the Shasta River downstream from Dwinnell Dam in 1998.

52
Figure 13: Ten-point moving averages of half meander wavelength (λ/2) magnitudes measured along the Shasta River below
Dwinnell Dam in 1923 (pre-dam), 1944 (post-dam) and 1998 (post-dam).

53
Figure 14: Illustration of channel planform changes on the Shasta River following construction of Dwinnell Dam in 1928: a) Upper Shasta River at Rkm 56; b) Lower Shasta River at Rkm 41. Average meander wavelength has decreased approximately 35% between Rkm 65 and Rkm 54 following dam construction, resulting in an increase in the number of individual meander bends. Average meander wavelength has decreased by only 2% below Rkm 44.

54
Longitudinal differences in hydrologic and geomorphic characteristics Upper Shasta River Upper Shasta River Lower Shasta River (above Lake
Shastina) (below Lake
Shastina) (below Big Springs
Cr.) Location (river kilometer) 77 to 72 64 to 55 55 to 24 Gradient (m/m-1)(1) 0.0054 0.005 0.001 D50 grain size (mm) 38 unknown 13
Morphological pattern Laterally-active anabranching, gravel-bedded
Single-thread meandering, gravel-
bedded
Single-thread meandering, gravel and
sand-bedded Width:Depth Ratio 16 unknown 11 Bankfull discharge (m3/s) (pre-1928/post-1928) 20(2) / 17 17(3) / unknown(4) 8(2) / 9
Mean Annual Flow (m3/s) (pre-1928/post-1928) unknown / 2.3 2.3(3) / 0.25(5) 4.6 / 4
2-year recurrence interval flood (m3/s) (pre-1928/post-1928)
unknown / 20 unknown / unknown 24 / 21
Average meander wavelength (m) (pre-1928/post-1928) unknown 212 / 137 136 / 133
1 Channel gradient derived from 10-meter resolution digital elevation model (DEM) 2 Estimated from channel cross-sections obtained from Shasta River railroad crossing profiles surveyed in 1905 3 Pre-dam bankfull and mean annual flow magnitudes assumed to be approximated by estimates for the Upper Shasta River above Lake Shastina 4 Current bankfull discharge between RM 40 and 34 likely reflects both continuous releases from Dwinnell Dam and natural spring/groundwater accretion 5 Approximately 0.25 m3/s is released from Lake Shastina to the Lower Shasta River to accommodate downstream water rights
Table 1: Comparison of hydrologic and geomorphic characteristics of the Shasta River in
channel reaches above Lake Shastina, between Dwinnell Dam and Big Springs Creek, and below Big Springs Creek.
USGS Site Number Location (Rkm) Dates of Operation (Water Years) 11516750 (Edgewood) 77 1963-67 11517000 (Montague) 26 1912-13, 1917-1921, 1924-33, 2002-present 11517500 (Yreka) 1 1934-41, 1945-present
Table 2: Gauge identification numbers and periods of record for USGS stream gauges on
the Shasta River.

55
Median of Annual Maxima (m3/s) Deviation Factor (%)1 1912-1928 1929-2006 1-day minimum2 0.13 0.40 211 3-day minimum3 0.20 0.46 131 7-day minimum3 0.30 0.54 81 30-day minimum3 0.56 0.70 24 90-day minimum3 0.90 1.04 17 1-day maximum2 21.89 19.03 13 3-day maximum3 15.14 15.16 0 7-day maximum3 13.70 11.38 17 30-day maximum3 9.47 7.88 17 90-day maximum3 7.73 6.38 17 Date of minimum4 200 216 -- Date of maximum4 46 21 --
1 Deviation factor represents the magnitude of change from the pre-dam to post-dam period. 2 1-day maximum (minimum) value represents the highest (lowest) mean daily value occurring during the period of record. 3 3, 7, 30, 90-day maximum (minimum) values represent the highest (lowest) multi-day (3, 7, 30 or 90 days) average during the period of record. 4 Julien date Table 3: Comparison of Shasta River mean daily discharge flow characteristics, as
measured at Montague, for periods prior to (1912 to 1928) and following (1929 to 2006) construction of Dwinnell Dam.
56
References Andrews, E.D., 1980. Effective and bankfull discharges of streams in the Yampa River
basin, Colorado and Wyoming. Journal of Hydrology, 46(3-4): 311-330. Brutsaert, W. and Nieber, J.L., 1977. Regionalized Drought Flow Hydrographs from a
Mature Glaciated Plateau. Water Resources Research, 13(3): 637-644. Bunte, K. and Abt, S.R., 2001. Sampling surface and subsurface particle-size
distributions in wadable gravel- and cobble-bed streams for analyses in sediment transport, hydraulics, and streambed monitoring: RMRS-GTR-74. U.S. Department of Agriculture, Forest Service, Rocky Mountain Research Station.
Burge, L.M., 2005. Wandering Miramichi Rivers, New Brunswick, Canada.
Geomorphology, 69(1-4): 253-274. Carlston, C.W., 1965. The relation of free meander geometry to stream discharge and its
geomorphic implications. American Journal of Science, 263(10): 864-885. Chesterman, C.W. and Saucedo, G.J., 1984. Cenozoic volcanic stratigraphy of Shasta
Valley. California Geology, 37(4): 67-74. Church, M., 1995. Geomorphic response to river flow regulation - case-studies and time-
scales. Regulated Rivers-Research & Management, 11(1): 3-22. Church, M., 2002. Geomorphic thresholds in riverine landscapes. Freshwater Biology,
47(4): 541-557. Crandell, D.R., 1989. Gigantic debris avalanche of Pleistocene age from ancestral Mount
Shasta Volcano, California, and debris-avalanche hazard zonation: U.S. Geological Survey Bulletin, 1861.
Crandell, D.R., Miller, C.D., Glicken, H.X., Christiansen, R.L. and Newhall, C.G., 1984.
Catastrophic debris avalanche from ancestral Mount Shasta volcano, California. Geology, 12(3): 143-146.
Dalrymple, T. and Benson, M.A., 1967. Measurement of peak discharge by the slope-
area method. TWI, 03-A2. U.S. Geological Survey, Alexandria, Virginia. Desloges, J.R. and Church, M.A., 1989. Canadian landform examples; 13, Wandering
gravel-bed rivers. The Canadian Geographer 33(4): 360-364. Dury, G.H., 1964. Principles of underfit streams. U.S. Geological Survey Professional
Paper, 452-A.

57
Dury, G.H., 1965. Theoretical implications of underfit streams. U.S. Geological Survey Professional Paper, 452-C.
Emmett, W.W. and Wolman, M.G., 2001. Effective discharge and gravel-bed rivers. In:
M. Church and M.A. Hassan (Editors), Earth Surface Processes and Landforms: 1369-1380.
Ferguson, R. and Ashworth, P., 1991. Slope-induced changes in channel character along
a gravel-bed stream - the Allt Dubhaig, Scotland. Earth Surface Processes and Landforms, 16(1): 65-82.
Ferguson, R., Hoey, T., Wathen, S. and Werritty, A., 1996. Field evidence for rapid
downstream fining of river gravels through selective transport. Geology, 24(2): 179-182.
Grams, P.E. and Schmidt, J.C., 2002. Streamflow regulation and multi-level flood plain
formation: channel narrowing on the aggrading Green River in the eastern Uinta Mountains, Colorado and Utah. Geomorphology, 44(3-4): 337-360.
Grant, G.E., Schmidt, J.C. and Lewis, S.L., 2003. A geological framework for
interpreting downstream effects of dams on rivers. Water Science and Application, 7: 203-219.
Helsel, D.R. and Hirsch, R.M., 1992. Statistical methods in water resources. Studies in
Environmental Science (Amsterdam), 49: 522. Hotz, P.E., 1977. Geology of the Yreka Quadrangle, Siskiyou County, California. U.S.
Geological Survey Bulletin, 1436. Hughes, M.L., McDowell, P.F. and Marcus, W.A., 2006. Accuracy assessment of
georectified aerial photographs; implications for measuring lateral channel movement in a GIS. Geomorphology, 74(1-4): 1-16.
Knighton, D., 1984. Fluvial forms and processes. Oxford University Press, Oxford. Larsen, E.W., 1995. Mechanics and modeling of river meander migration. Ph.D. Thesis,
University of California at Berkeley, Berkeley. Mack, S., 1960. Geology and ground-water features of Shasta Valley, Siskiyou County,
California. U.S. Geological Survey Water Supply Paper, 1484. McNab, W.H. and Avers, P.E., 1994. Ecological subregions of the United States: WO-
WSA-5. United States Department of Agriculture Forest Service.

58
Micheli, E.R., Kirchner, J.W. and Larsen, E.W., 2004. Quantifying the effect of riparian forest versus agricultural vegetation on river meander migration rates, central Sacramento River, California, USA. River Research and Applications, 20(5): 537-548.
NAS, 2004. Endangered and Threatened Fishes in the Klamath River Basin: Causes of
Decline and Strategies of Recovery. National Academy of Sciences. Nathenson, M., Thompson, J.M. and White, L.D., 2003. Slightly thermal springs and
non-thermal springs at Mount Shasta, California: Chemistry and recharge elevations. Journal of Volcanology and Geothermal Research, 121(1-2): 137-153.
Nielsen, J.P., 1999. Record extension and streamflow statistics for the Pleasant River,
Maine. U.S. Geological Survey Water-Resources Investigation Report, 99-4078. Pelzman, R.J., 1973. Causes and possible prevention of riparian plant encroachment on
anadromous fish habitat. California Department of Fish and Game Environmental Services Branch Administrative Report, 73-1.
Petts, G.E., 1979. Complex response of river channel morphology subsequent to reservoir
construction. Progress in Physical Geography, 3(3): 329-362. Petts, G.E., 1980. Morphological changes of river channels consequent upon headwater
impoundment. Journal of the Institution of Water Engineers and Scientists, 34(4): 374-382.
Petts, G.E. and Gurnell, A.M., 2005. Dams and geomorphology: Research progress and future directions. Geomorphology, 71(1-2): 27-47.
Pickup, G. and Warner, R.F., 1976. Effects of hydrologic regime on magnitude and
frequency of dominant discharge. Journal of Hydrology, 29(1-2): 51-75. Richter, B.D., Baumgartner, J.V., Powell, J. and Braun, D.P., 1996. A method for
assessing hydrologic alteration within ecosystems. Conservation Biology, 10(4): 1163-1174.
Schumm, S.A., 1967. Meander wavelength of alluvial rivers. Science, 157(3796): 1549-
1550. Sear, D.A., Armitage, P.D. and Dawson, F.H., 1999. Groundwater dominated rivers. In:
D.A. Sear and P.D. Armitage (Editors), Hydrological Processes, pp. 255-276. Shields, F.D., Simon, A. and Steffen, L.J., 2000. Reservoir effects on downstream river
channel migration. Environmental Conservation, 27(1): 54-66. Southern Pacific Railroad, 1905. RT 1506 profile book no. 5, Edgewood to Ager.
Unpublished log book, California State Railroad Museum, Sacramento.

59
Tague, C. and Grant, G.E., 2004. A geological framework for interpreting the low-flow
regimes of Cascade streams, Willamette River Basin, Oregon. Water Resources Research, 40(4): 1-9.
Vignola, E. and Deas, M., 2005. Lake Shastina Limnology. Watercourse Engineering,
Inc., pp. 73. Wagner, D.L. and Saucedo, G.J., 1987. Geologic map of the Weed Quadrangle.
California Division of Mines and Geology, Regional Geologic Map Series, Map No. 4A, 1:250,000.
Wang, Z.-Y., Wu, B. and Wang, G., 2007. Fluvial processes and morphological response
in the Yellow and Weihe Rivers to closure and operation of Sanmenxia Dam. Geomorphology, 91: 65-79.
Whiting, P.J. and Moog, D.B., 2001. The geometric, sedimentologic and hydrologic
attributes of spring-dominated channels in volcanic areas. Geomorphology, 39(3-4): 131-149.
Williams, G.P. and Wolman, M.G., 1984. Downstream effects of dams on alluvial rivers.
U.S. Geological Survey Professional Paper, 1286. Wolman, M.G., 1954. A method of sampling coarse river-bed material. Transactions -
American Geophysical Union, 35(6): 951-956. Wolman, M.G. and Miller, J.P., 1960. Magnitude and frequency of forces in geomorphic
processes. Journal of Geology, 68(1): 54-74.