geological and induced polarization geophysical
TRANSCRIPT

Journal of Environment and Earth Science www.iiste.org
ISSN 2224-3216 (Paper) ISSN 2225-0948 (Online)
Vol.8, No.12, 2018
31
Geological and Induced Polarization Geophysical Investigations of
the Quartz-Vein Gold Mineralization in Some Parts of Ayegunle
Sheet 226nw, North Central, Nigeria
Fadele, S.I* Jatau, B.S Abaa, S.I
Department of Geology and Mining, Nasarawa State university, Keffi
Abstract The study area is predominated by granite-gneiss, mica schist, leucocratic micro granite and quartzites. The Pan
African orogeny left an imprint of structural similarity upon the rock units. The granite-gneisses are found as
small belts within the study area, and hosting the quartz-veins. The metasediments are fractured and folded in
places. The dominant fold axes and quartz vein intrusions trend NNE-SSW parallel to the regional foliation of
the rocks. The emplacement of the quartz vein is associated with the generalized strike direction of quartz vein
and host rocks. The structural settings suggest that the emplacement of gold mineralization occurred during Late
Pan African orogeny. Geophysical method using the Electrical Resistivity Tomography (ERT) has been applied
in some parts of Ayegunle sheet 226NW, North Central, Nigeria aimed at investigating the electrical properties
and probable exploration targets for quartz-vein gold mineralization. Electrical Resistivity Tomography (ERT),
using the measuring unit ‘MER124’ and generator unit ‘ASTRA’ Imaging System was adopted to map the
electrical properties as an aid to characterizing the subsurface conditions of the study area. Nine (9) profile lines
were marked out for ERT investigations. For each profile, the layout for the electrical imaging was such that two
reels of cables were used with 5m intervals between the takeout electrodes. However, the two innermost
electrodes adjoining the two reels of cables were connected together thus yielding a total of 41 electrodes and a
spread length of 200m. The data obtained using MER124 measuring unit were processed using Zond2dinv and
Oasis Montaj 8.2 software. Chargeability and resistivity values varies due to the inhomogeneity of the
subsurface rock hence, chargeability values in percentage (%) ranges from 0.17% around the alteration zones
and relatively low sulphide mineralization to 6.22% with high sulphide mineralization and resistivities in
ohms-meter ranges from as low as 5ohm-m along the alteration zones to >10,000 ohms-meter around the
competent bedrock and probable zones of quartz-veins gold mineralization.
Keywords: Granite-gneiss, Mica schist, Leucocratic micro granite and Quartzite, Electrical Resistivity
Tomography, Quartz-vein gold
1. Introduction
Mineral exploration is a sequential process of information gathering that assesses the mineral potential of a
given areas. The presence of polarizable material in the ground is an excellent proxy for the distribution of
metallic minerals and hence IP surveys are routinely used for mineral exploration (Fink et al.1990). Recent
studies have also applied the observation of IP effects to hydrocarbon exploration (Davydycheva et al. 2006;
Veeken et al. 2012), hydrogeological mapping (Slater & Glaser 2003; Hördt et al. 2007), and numerous other
environmental and engineering applications. The causes of electric polarization, or equivalently chargeability,
are varied but regardless of the cause, a chargeable material will have a complex, frequency-dependent
conductivity. Traditionally, measurements of chargeability are carried out using the IP technique (Seigel 1959).
This purely galvanic technique injects current into the ground through a pair of transmitter electrodes and then
measures the voltage decay across another set of electrodes after the current has been interrupted. An excellent
summary of the historical development of the IP method was given by Seigel et al. (2007). The method has a
proven track record in mineral exploration and is widely considered the geophysical method of choice when
looking for porphyry copper deposits (Fink et al.1990). These data are now commonly inverted to recover 2-D or
3-D models of the chargeability distribution in the ground (Li & Oldenburg 2000). Electrical resistivity
tomography is particularly useful in clayey ground where methods such as the ground penetrating radar GPR are
less effective and helps define translational boundaries that are difficult to detect using other geophysical
methods (Loke and Barker, 1996). One of the new developments in recent years is the use of 2D electrical
imaging/tomography survey to map areas with moderately complex geology (Griffiths and Barker, 1993). Such
surveys are usually carried out using a large number of electrodes, 25 or more, connected to a multi-core cable.
In this survey, the Wenner array with 5m interval between 41 electrodes was employed with each spread having
a length of 200m to characterize the subsurface conditions in some parts of Ayegunle sheet 226NW, North
Central, Nigeria aimed at delineating areas with disseminated sulphide mineralization and possibly occurrence of
quartz-vein gold mineralization in the area.

Journal of Environment and Earth Science www.iiste.org
ISSN 2224-3216 (Paper) ISSN 2225-0948 (Online)
Vol.8, No.12, 2018
32
2. The Survey Area
The study area is situated within the North-Central Nigerian Basement Complex (figure 1). It lies between
Latitudes 08° 22' 41.98" N - 08° 19' 44.96" N and Longitudes 06° 11' 26.95" E - 06° 14' 30.84" E. The site is
accessible by Kabba - Ijumu road down to Ayetoro gbede junction to other localities with a minor road and a lot
of footpaths. The study area is moderately hilly, interrupted by ridges (like Guguriji and Ihale ridge) of up to
350m above sea level. These ridges often serve as a divide for the numerous streams and rivers that are in the
area (Figure 2). There are two major rivers in the study area namely the Ipala River which is seen to flow in NE-
SW direction and Oyi River which flows in NW-SE direction. These rivers with their small tributaries form a
more or less dendritic pattern. A humid tropical climate predominates with a mean average annual rainfall in
excess of 1434 mm which is concentrated in the rainy season from March to November with a break during
August. The mean maximum and minimum temperatures across the project region are over 34°C (in the month of
February) and 18°C (in the month of December) respectively (Goh and Adeleke, 1979). The highest relative
humidity range within the project area is between 81% and 87% corresponding to the wettest months April
through October (Hore, 1970).
Figure 1: Schist Belt localities within the context of the geology of Nigeria (after Woakes et al.1987)
3. Methods and Materials
The present research work includes literature review of relevant published and unpublished work on Nigeria
basement Geology and gold mineralization, fieldwork involving geological mapping on a scale of 1:50,000 was
carried out using Compass clinometer, Global Positioning System (GPS) and Geologic hammer for rock
sampling. The compass clinometer was used to measure trend and dips of lithologies and other structural
features on outcrops. Topographic map of the study area were scanned and uploaded into MapInfo software
(MapInfo Professional 11.0). It was digitized at scale 1:50,000. Thin section production and petrographic studies
were produced for major rocks in the area and analyzed with polarized light microscope. Photomicrographs are
uploaded into JMicro Vision 1.2.7 software for modal analysis. Electrical Resistivity Tomography (ERT), using
the measuring unit ‘MER124’ and generator unit ‘ASTRA’ Imaging System was used to map the electrical
properties of the study area. Nine (9) profile lines were marked out for ERT investigations. For each profile, the
layout for the electrical imaging was such that two reels of cables were used with 5m intervals between the
takeout electrodes. However, the two innermost electrodes adjoining the two reels of cables were connected
together thus yielding a total of 41 electrodes and a spread length of 200m. ERT data was processed and
interpreted using the Zond2Dinv software.
4. Results and Discussion
4.1 Fieldwork and Petrographic analysis
4.1.1 Field relationships
The study area is part the Nigerian Basement Complex underlain by crystalline rocks, so the geology of the area
is the same as that of the Nigerian Basement complex (Oyawoye 1964). Exposures are scanty and highly
weathered. The study area is predominated by granite-gneiss, mica schist, leucocratic micro granite and

Journal of Environment and Earth Science www.iiste.org
ISSN 2224-3216 (Paper) ISSN 2225-0948 (Online)
Vol.8, No.12, 2018
33
quartzites. Granite-gneiss covers about 70% of the entire area with a sharp contact with mica schist in the north-
eastern part of the area. The mica schist covers about 15% of the entire area. The north-western part of the area is
covered by the leucrocratic micro granite (about 3%) and granodiorite of about 5% where mapped at the south-
western part of the area all in contact with the granite-gneiss. Quartzites (about 2%) appear as intrusions across
the granite gneiss along the NE-SW direction. The remaining areas (5%) is occupied by amphibolites and
syenites which intruded the granite-gneiss in the southern part of the area and quartz veins widely distributed in
the entire area mostly mapped at contact and fault zones in the area. The Pan African orogeny left an imprint of
structural similarity upon the rock units (Wright and McCurry 1970). The granite-gneisses are found as small
belts within the study area, and hosting the quartz-veins (figure 2).
4.1.2 Petrographic analysis
4.1.2.1 Leucocratic micro granite
The sample is light coloured and generally fine grained with occasional medium grained microcline. Medium
grained microcline occurs with characteristic cross hatch twinning pattern. It lies within fine grained groundmass.
The biotite is brown coloured with moderate relief. The biotite grains are cut parallel to the crystallographic (c-
axis) which did not exhibit cleavage. The orthoclase is colourless with low relief but cloudy. It display grey false
colour in XPL with oblique extinction (Plate 1). Table 4.1: Modal Composition of Minerals in Major rocks of the Study Area
Percentage (%) Composition
Rock types Coordinates Quartz
(Q)
Orthoclase
(Orth)
Plagioclase
(Plag)
Microcline
(Mcl)
Biotite
(B)
Muscovite
(MSc)
Leucocratic
Micro Granite
8020’45’’N
6012’35’’E 65 15 - 15 5 - = 100
Mica Schist 80 21’44’’N
6013’50’’E 35 15 - 15 25
10 =
100
Granite Gneiss 80 22’40’’N
6013’22’’E 45 15 - 20 10
<10 =
100
Quartzite 80 22’30’’N
6012’55’’E 99 - - - - - = 99
Figure 2: Geological map of the Study Area
Journal of Environment and Earth Science www.iiste.org
ISSN 2224-3216 (Paper) ISSN 2225-0948 (Online)
Vol.8, No.12, 2018
34
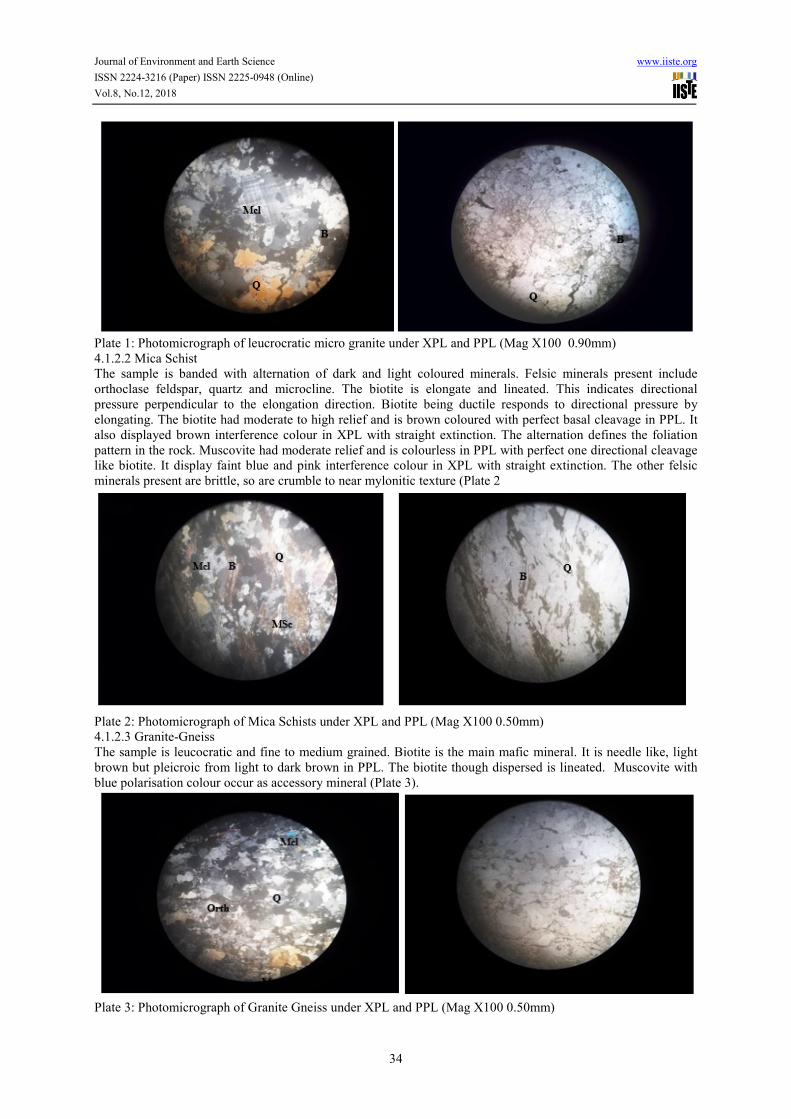
Plate 1: Photomicrograph of leucrocratic micro granite under XPL and PPL (Mag X100 0.90mm)
4.1.2.2 Mica Schist
The sample is banded with alternation of dark and light coloured minerals. Felsic minerals present include
orthoclase feldspar, quartz and microcline. The biotite is elongate and lineated. This indicates directional
pressure perpendicular to the elongation direction. Biotite being ductile responds to directional pressure by
elongating. The biotite had moderate to high relief and is brown coloured with perfect basal cleavage in PPL. It
also displayed brown interference colour in XPL with straight extinction. The alternation defines the foliation
pattern in the rock. Muscovite had moderate relief and is colourless in PPL with perfect one directional cleavage
like biotite. It display faint blue and pink interference colour in XPL with straight extinction. The other felsic
minerals present are brittle, so are crumble to near mylonitic texture (Plate 2
Plate 2: Photomicrograph of Mica Schists under XPL and PPL (Mag X100 0.50mm)
4.1.2.3 Granite-Gneiss
The sample is leucocratic and fine to medium grained. Biotite is the main mafic mineral. It is needle like, light
brown but pleicroic from light to dark brown in PPL. The biotite though dispersed is lineated. Muscovite with
blue polarisation colour occur as accessory mineral (Plate 3).
Plate 3: Photomicrograph of Granite Gneiss under XPL and PPL (Mag X100 0.50mm)

Journal of Environment and Earth Science www.iiste.org
ISSN 2224-3216 (Paper) ISSN 2225-0948 (Online)
Vol.8, No.12, 2018
35
4.1.2.4 Quartzites
The sample is generally medium to coarse grained with interlocking grain boundaries. The major mineral is
quartz (99%). The quartz is colourless with very low relief (as shown in the PPL photo) in PPL. It is whitish
(colourless) XPL with wavy extinction on some crystals. Wavy extinction is indicative of deformation. This
means the quartz undergo some degree of deformation after emplacement. So, the sample is quartzite or even
likely to be quartz vein that explored existing fractures and intruded the host rock (Plate 4).
Plate 4: Photomicrograph of Quartzites under XPL and PPL (Mag X100 0.90mm)
4.1.3 Structures
The metasediments are fractured and folded in places. The dominant fold axes and quartz vein intrusions trend
NNE-SSW parallel to the regional foliation of the rocks. The emplacement of the quartz vein is associated with
the generalized strike direction of quartz vein and host rocks. The structural settings suggest that the
emplacement of gold mineralization occurred during Late Pan African orogeny (Oyawoye 1964)
Figure 3: Rose diagram showing trend of foliation in metasediments (mica schist and gniess)
(Trending: NNE–SSW) (80 21’44’’N 6013’50’’E and 80 22’40’’N 6013’22’’E)
Figure 4: Rose diagram showing joints on metasediments within the study area (80 21’44’’N
6013’50’’E and 80 22’40’’N 6013’22’’E)

Journal of Environment and Earth Science www.iiste.org
ISSN 2224-3216 (Paper) ISSN 2225-0948 (Online)
Vol.8, No.12, 2018
36
4.2 Geophysical investigations
4.2.1 Electrical resistivity tomography
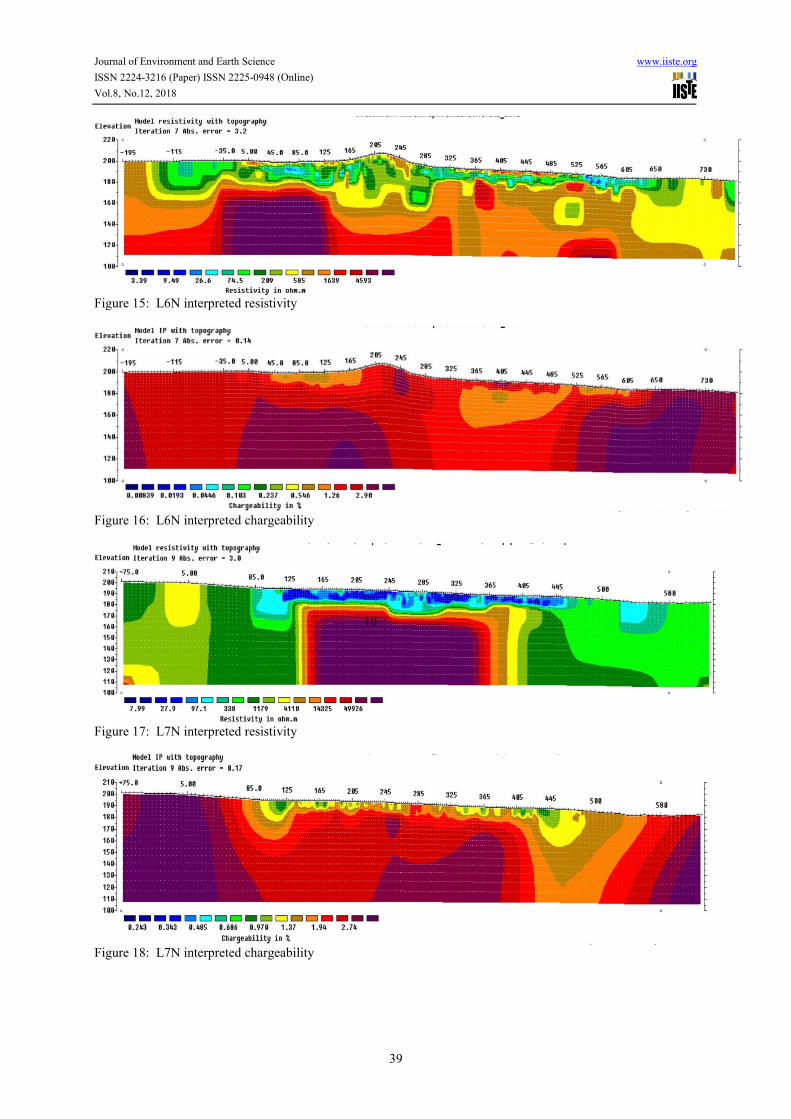
The IP responses across lines LIN to L9N suggest presence of a buried silica cap and high chargeability zone
(figures 5 – 22) beneath that cap. The silica cap appears to plunge to the SE. It likely outcrops near line L1N and
plunges to about100m depth by line L5N. There is a pronounced increase in the chargeability below the cap,
along its' northwestern flank. These responses are most clearly apparent on Line L1N to L9N, as shown in
figures 5 to 22. The IP survey corroborates the geology of the area which shows large silica cap and possible
porphyry system covering an area north of the base camp between the NW-SE or Ike and the N-S or Taki
anomaly Trend. It shows scattered resistivity highs in the near surface across the geologically defined unit and a
more pronounced resistive zone buried (about 200m deep) at the northwest edge of the geologically defined unit.
This could be an indication that the silica cap is plunging at a shallow angle to the northwest. It also suggests
there may be a second subparallel and smaller resistivity unit buried to the NW. The chargeability component
maps a high chargeability unit, below the silica cap at 150 metres depth. In some areas this chargeability unit
appears to extend upwards into the high resistivity zone. While increased chargeabilities are mapped over a
large area, there appears to be three discrete zones of very high chargeabilities within the broader zone: two are
located along the northwestern and northeastern edges of the geologically outlined silica cap and the third is
associated with the geophysically delineated buried silica unit to the northwest. This type of zonation of the
chargeability response is uncommon and could be reflecting changes in the amount (or type) of sulphides.
These geophysical responses are observed over a 1 kilometre strike length, from line L1N to L4N. Two IP lines
(L5N and L6N) were extended about 2 km SW of the NW-SE or Ike Trend. Geological mapping suggests this
area as being covered by quartz schist. There is weak evidence, most notably on line L7N, of a near surface high
resistivity layer at the NW ends of these lines. There is also a weak chargeability anomaly that appears to be
associated with the SE edge of this resistive unit. These responses are only partially defined but should be
considered as potential exploration targets. A number of the IP lines were extended to the southeast and cross
both the E-W and N-S or Taki trends. Both these trends are described as steep, northwesterly dipping
oreshoots. Neither of these trends is clearly delineated by the IP survey. This is likely due, at least in part, by the
wide electrode spacings and resulting to lack of resolution of the shallow responses. All 2 survey lines (L8 and
9N) that cross the N-S/Taki Trend suggest it is coincident with a moderate (60°NW) dipping zone of low
resistivity and low chargeability. The survey lines crossing the E-W Trend show a similar response however
suggest this unit dips more steeply (on the order of 75° to the NW).
Figure 5: L1N interpreted resistivity
Figure 6: L1N interpreted chargeability
7

Journal of Environment and Earth Science www.iiste.org
ISSN 2224-3216 (Paper) ISSN 2225-0948 (Online)
Vol.8, No.12, 2018
37
Figure 7: L2N interpreted resistivity
Figure 8: L2N interpreted chargeability
Figure 9: L3N interpreted resistivity
Figure 10: L3N interpreted chargeability

Journal of Environment and Earth Science www.iiste.org
ISSN 2224-3216 (Paper) ISSN 2225-0948 (Online)
Vol.8, No.12, 2018
38
Figure 11: L4N interpreted resistivity
Figure 12: L4N interpreted chargeability
Figure 13: L5N interpreted resistivity
Figure 14: L5N interpreted chargeability
Journal of Environment and Earth Science www.iiste.org
ISSN 2224-3216 (Paper) ISSN 2225-0948 (Online)
Vol.8, No.12, 2018
39
Figure 15: L6N interpreted resistivity
Figure 16: L6N interpreted chargeability
Figure 17: L7N interpreted resistivity
Figure 18: L7N interpreted chargeability
10

Journal of Environment and Earth Science www.iiste.org
ISSN 2224-3216 (Paper) ISSN 2225-0948 (Online)
Vol.8, No.12, 2018
40
Figure 19: L8N interpreted resistivity
Figure 20: L8N interpreted chargeability
Figure 21: L9N interpreted resistivity
Figure 22: L9N interpreted chargeability
5. Conclusion
The lithologies of the study area are predominately granite-gneiss, mica schist, leucocratic micro granite and
quartzites. The Pan African orogeny left an imprint of structural similarity upon the rock units. The granite-
gneisses are found as small belts within the study area, and hosting the gold quartz-veins. The metasediments are
fractured and folded in places. The dominant fold axes and quartz vein intrusions trend NNE-SSW parallel to

Journal of Environment and Earth Science www.iiste.org
ISSN 2224-3216 (Paper) ISSN 2225-0948 (Online)
Vol.8, No.12, 2018
41
the regional foliation of the rocks. The emplacement of the quartz vein is associated with the generalized strike
direction of quartz vein and host rocks. The structural settings suggest that the emplacement of gold
mineralization occurred during Late Pan African orogeny. There are two areas where the IP responses give
strong indications of a buried sulphides system with increased chargeabilities and resistivities. The larger of
these is associated with the geologically mapped silica cap/veins, north of the base camp (Ike). This anomaly
is referred to as the NW-SE or Ike anomaly. The other is located north of the silica cap at the N-S prospect or
Taki anomaly. There are indications, in ERT that these two targets are separated by an E-W trending structure
(fault). This research work has demonstrated that the study area represents a highly prospective gold field within
Nigeria, with the potential for a number of other prospective targets to add to this mineral. Taki-Ike minor gold
field has the potential to be developed into a viable open-pit mining operation. Borehole drilling within the
potential fields shall further improve the field attractiveness of the research area and hence quantify the gold
resource of the area.
6. Acknowledgement
The study is part of the first author’s Ph.D theses supervised by Professor B.S. Jatau and Professor S.I. Abaa of
the Department of Geology and Mining, Nasarawa State University, Keffi. Their efforts and contributions to
make the research a huge success are highly acknowledged. The supports rendered by Geologist Yuri of
Geological Service of Public Enterprise ‘Pivdenukrgeologiya’ kiev, Ukraine in the course of the research and
laboratory works is greatly acknowledged. The efforts of the following Geoscientists Igger, Cyriggae and Noya
of the Energy and Metal Industries (EMI) Kiev, Ukraine are appreciated for their numerous supports during the
geophysical data acquisition, processing and interpretation. My wife and children have been very supportive
throughout the research and am grateful to God for having them around me as a gift
References
1. Davydycheva S., Rykhlinski N., Legeido P. (2006): Electrical-prospecting method for hydrocarbon search
using the induced-polarization effect,Geophysics , 2006, vol. 71 (pg. G179-G189)
2. Fink, J.B., McAlister E.O., Sternberg B.K., Wieduwilt W.G. and Ward S.H. (1990): Induced Polarization,
Applications and Case Histories, vol. 4 Investigations in Geophysics, Society of Exploration Geophysicists,
Tulsa, Oklahoma
3. Griffiths, D. H. and Barker, R. D. (1993). Two-dimensional resistivity imaging and modeling in areas of
complex geology. Journal of Applied Geophysics, Vol. 29, Pp 211-226.
4. Goh, C.L., and Adeleke, B.O., (1978). Certificate Physical and Human Geography’ Oxford University Press,
Ibadan,pp78-150.
5. Hördt, A., Blasschek, R., Kemna, A. (2007): Hydraulic conductivity estimation from induced polarisation data
at the field scale—the Krauthausen case history, J. appl. Geophys., vol. 62 (pg. 33-46)
6. Hore, P.N (1970): Weather and Climate of Zaria and its Region.(Ed.) By M.J. Mortimore, Department of
Geography, Occasional Paper No4. A.B.U. Zaria. pp. 41-54
7. Li, Y. and Oldenburg, D.W. (2000): 3-D inversion of induced polarization data, Geophysics, vol. 65
(pg. 1931- 1945)
8. Loke, M. H. and Barker R. D. (1996). Rapid least-squares inversion of apparent resistivity pseudo-sections
using a quasi-Newton method. Geophysical Prospecting, 44, 131 – 152.
9. McCurry, P. (1970). The geology of Degree Sheet 21, Zaria. Unpublished M.Sc. Thesis, Thesis, Department
of Geography, Ahmadu Bello University, Zaria.
10. Oyawoye, M. O. (1964). Geology of the Nigerian Basement Complex, Journal of Nigeria Mining,
Geological and Metallurgical Society, Vol. 8, pp. 87-102.
11. Seigel. H.O. (1959): Mathematical formulation and type curves for induced polarization,Geophysics ,1959,
vol.24 3 (pg. 547-565)
12. Seigel H.O., Nabighian M., Parasnis D.S., Vozoff K. (2007): The early history of the induced polarization
method, Leading Edge, vol. 26 (pg. 312-321)
13. Slater L.D. and Glaser D.R: Controls on induced polarization in sandy unconsolidated sediments and
application to aquifer characterization, Geophysics, 2003, vol. 68 (pg. 1547-1558)
14. Veeken P.C.H., Kudryavceva E.O., Putikov O.F., Legeydo P.Y., Ivanov S.A. (2012): Modelling induced
polarization effects due to pyrite in geochemical alteration zones above hydrocarbon accumulations, Petrol.
Geosci, vol. 18 (pg. 59-72)
15. Wright, J. B. and McCurry, P. (1970). The geology of Nigeria Sheet 102 SW, Zaria and its regions. Edited by
M.J. Mortimore. Department of Geography, Occasional paper,No. 4, Ahmadu Bello University, Zaria
16. Woakes, M., Rahaman, M, A. and Ajibade, A. C. (1987): Some metallogenetic features of the Nigerian
basement.Journal of African Earth Sciences 6, 54-64