geologic investigations near an underhand cut-and-fill...
TRANSCRIPT
! IRI19470 I REPORT OF INVESTIGATIONS/1993
-(It. Geologic Investigations Near an Underhand Cut-and-Fill Stope, Lucky Frida'y Mine, Mullan, 10
By Douglas F. Scott
N Murray
~ Kellogg • .. ~u.';.n~lt • Burke
.......... Osburn -... -... .. -... Lucky Friday
• Wallace ... -... -e2. _ !::!i!!! _ Mullan
Idaho
United States Department of the Interior
Bureau of Mines

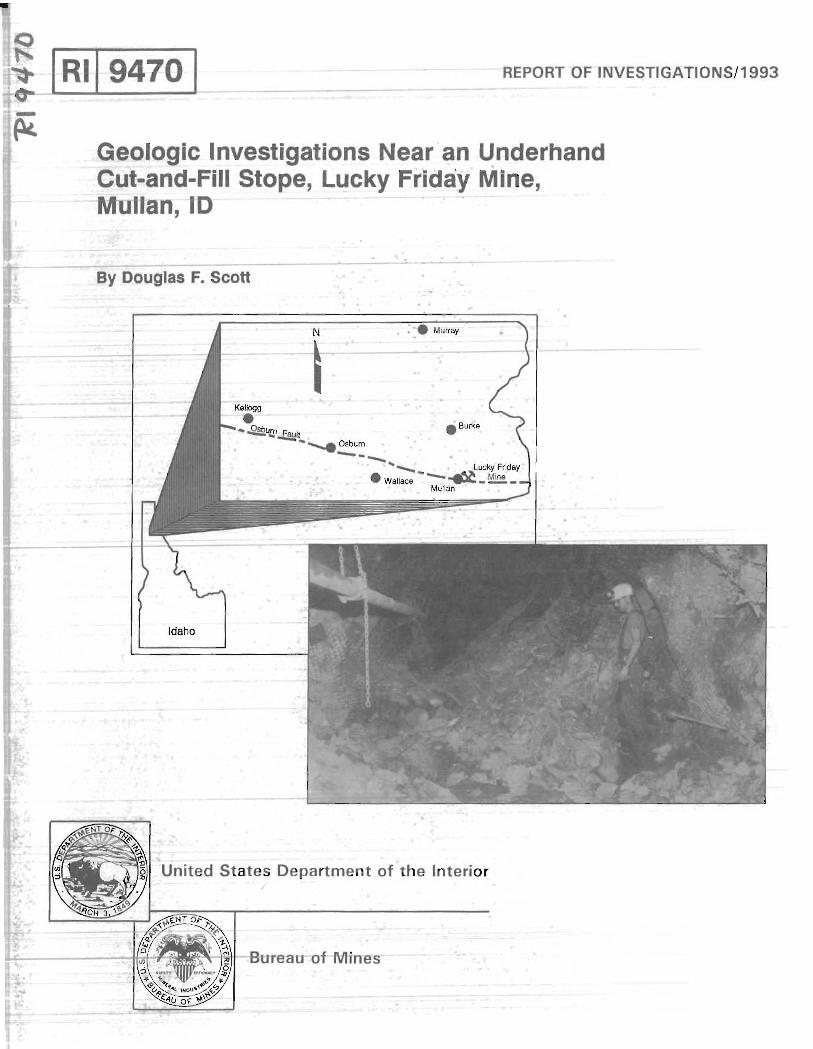
Cover Photographs: Location of Lucky Friday Mine (top),' damage to 5100-100 crosscut following a 1.0 magnitude rock burst on January 21, 1988 (bottom).
Report of Investigations 9470
Geologic Investigations Near an Underhand Cut-and-Fill Stope, Lucky Friday Mine, Mullan, 10
By Douglas F. Scott
UNITED STATES DEPARTMENT OF THE INTERIOR Bruce Babbitt, Secretary
BUREAU OF MINES
Library of Congress Cataloging in Publication Data:
Scott, Douglas F. Geologic investigations near an underhand cut-and-fill stope, Lucky Friday Mine,
Mullan, 10 / by Douglas F. Scott.
p. cm. - (Report of investigations; 9470)
Includes bibliographical references (p. 16).
1. Rock bursts-Idaho-Mullan Region. 2. Stoping (Mining). 3. Mining geology -Idaho-Mullan Region. I. Title. II. Title: Lucky Friday Mine, Mullan, 10. III. Series: Report of investigations (V.S. Bureau of Mines); 9470.
TN23.U43 [TN317] 622 s-dc20 [622' .28] 93-17122 CIP
,-t I ,
l I I ,
f ~.
I I I ,
CONTENTS Page
Abstract. . . . . . . . . . . . . . . . . . . . . . . . . . . . . . . . . . . . . . . . . . . . . . . . . . . . . . . . . . . . . . . . . . . . . . . . . . . 1 Introduction ....................................................................... . Background ....................................................................... . Acknowledgments ................................................................... . Previous Bureau studies .............................................................. .
Microseismic studies . . . . . . . . . . . . . . . . . . . . . . . . . . . . . . . . . . . . . . . . . . . . . . . . . . . . . . . . . . . . . . . . Studies of new mining methods ....................................................... .
Geologic research ................................................................... . South Africa .................................................................... . United States .................................................................... .
Seismic events and monitoring ......................................................... . Geologic setting ........ . . . . . . . . . . . . . . . . . . . . . . . . . . . . . . . . . . . . . . . . . . . . . . . . . . . . . . . . . . . . .
Region ......................................................................... . Mine .......................................................................... . Demonstration stope .............................................................. .
Geologic investigations ............................................................... . Structural analysis ................................................................ . Seismic analysis .................................................................. . Relationship of geologic features to seismic activity ........................................ .
Conclusions ....................................................................... . References ........................................................................ . Appendix ......................................................................... .
ILLUSTRATIONS
1. Location of Lucky Friday Mine ................................................... . 2. Cross section of an underhand longwall stope ......................................... . 3. Three-dimensional view of area studied ....... ' ...................................... . 4. Plan view of stope mine coordinates, footwall, and hanging wall ........................... . 5. Rock burst damage ............................................................ . 6. Generalized stratigraphy of Lucky Friday Mine ....................................... . 7. Structural blocks in Lucky Friday Mine .......................................•...... 8. Positions of North and South Control faults and veins .................................. . 9. Divergence of fracture planes and argillite beds ....................................... .
10. Seismic .activity relative to underhand longwall stope .................................... . 11. Seismic events per cut . . . . . . . . . . . . . . . . . . . . . . . . . . . . . . . . . . . . . . . . . . . . . . . . . . . . . . . . . . . 12. Seismic events showing depth of occurrence and cut ........................ , .......... . 13. Direction of movement initiated by rock burst ........................................ .
A-1. Stereo plots of fractures ........................................................ . A-2. Stereo plots of argillite beds ..................................................... . A-3. Stereo plots of fractures and argillite beds ........................................... .
TABLE
2 4 5 5 5 6 7 7 7 8 9 9
11 11 12 12 13 14 15 16 18
2 3 4 4 9
10 11 12 13 13 13 14 15 19 20 21
1. Geologic mapping . . . . . . . . . . . . . . . . . . . . . . . . . . . . . . . . . . . . . . . . . . . . . . . . . . . . . . . . . . . . . . 12
I !
i i , I
: I
,
, I
cm
Hz
Ian
m
--_. __ ... _-_ .. _--
UNIT OF MEASURE ABBREVIATIONS USED IN THIS REPORT
centimeter m3 cubic meter
hertz mm millimeter
kilometer mt metric ton
meter pct percent
T I
GEOLOGIC INVESTIGATIONS NEAR AN UNDERHAND CUT-AND-FILL STOPE, LUCKY
FRIDAY MINE, MULLAN, 10
By Douglas F. Scott1
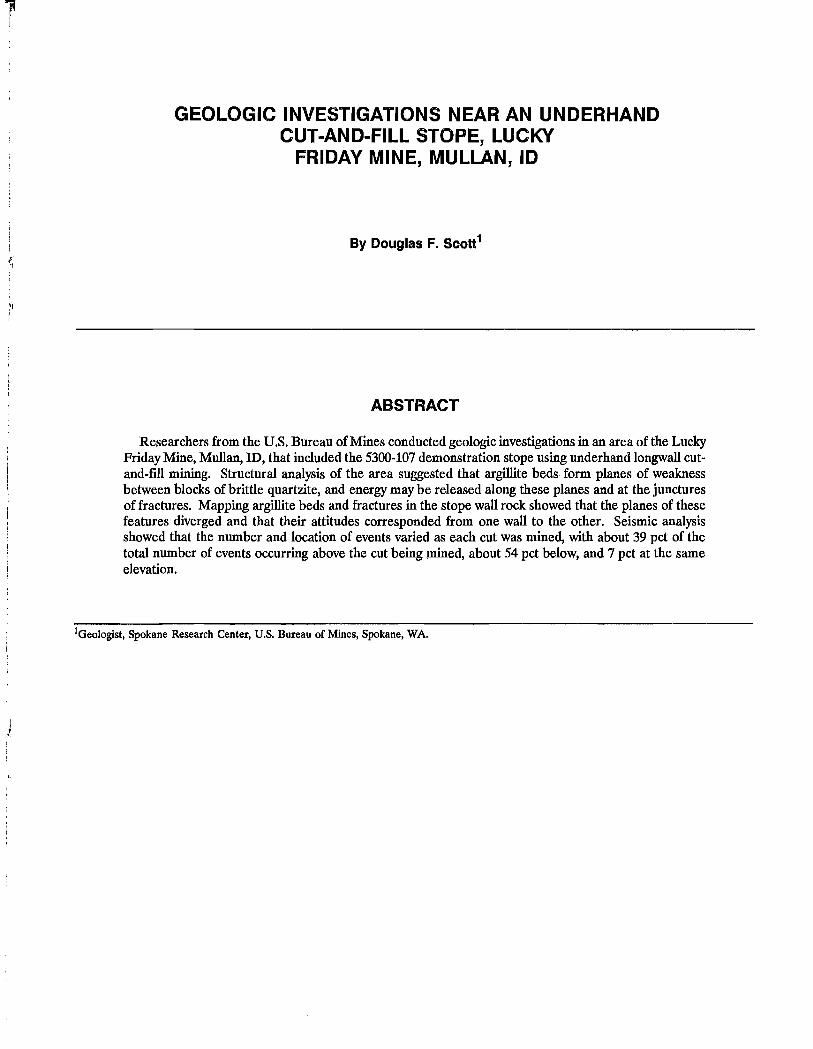
ABSTRACT
Researchers from the U.S. Bureau of Mines conducted geologic investigations in an area of the Lucky Friday Mine, Mullan, ID, that included the 5300-107 demonstration stope using underhand longwall cutand-fill mining. Structural analysis of the area suggested that argillite beds form planes of weakness between blocks of brittle quartzite, and energy may be released along these planes and at the junctures of fractures. Mapping argillite beds and fractures in the stope wall rock showed that the planes of these features diverged and that their attitudes corresponded from one wall to the other. Seismic analysis showed that the number and location of events varied as each cut was mined, with about 39 pct of the total number of events occurring above the cut being !Dined, about 54 pct below, and 7 pct at the same elevation.
IGeo\ogist, Spokane Research Center, U.S. Bureau of Mines, Spokane, WA.
-I ,
I " "
,
I .1' I "
i ~,
, i, !
I, I' I' !
"
i
------~--.-------------------------------------~-------
2
INTRODUCTION
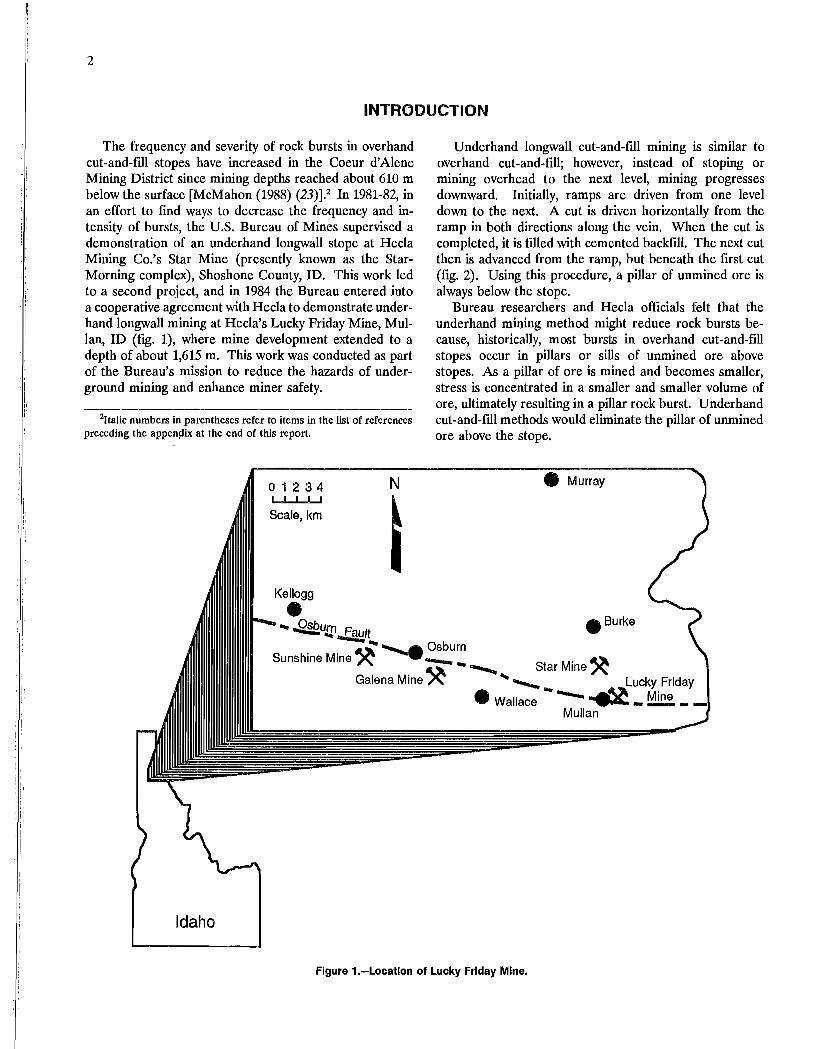
The frequency and severity of rock bursts in overhand cut-and-fill stopes have increased in the Coeur d'Alene Mining District since mining depths reached about 610 m below the surface [McMahon (1988) (23)].2 In 1981-82, in an effort to find ways to decrease the frequency and intensity of bursts, the U.S. Bureau of Mines supervised a demonstration of an underhand longwall stope at Hecla Mining Co.'s Star Mine (presently known as the StarMorning complex), Shoshone County, ID. This work led to a second project, and in 1984 the Bureau entered into a cooperative agreement with Hecla to demonstrate underhand longwall mining at Hecla's Lucky Friday Mine, Mullan, ID (fig. 1), where mine development extended to a depth of about 1,615 m. This work was conducted as part of the Bureau's mission to reduce the hazards of underground mining and enhance miner safety.
2Italic numbers in parentheses refer to items in the list of references preceding the appenpix at the end of this report,
o 1 234 N I I I I I
I Scale, km
Kellogg
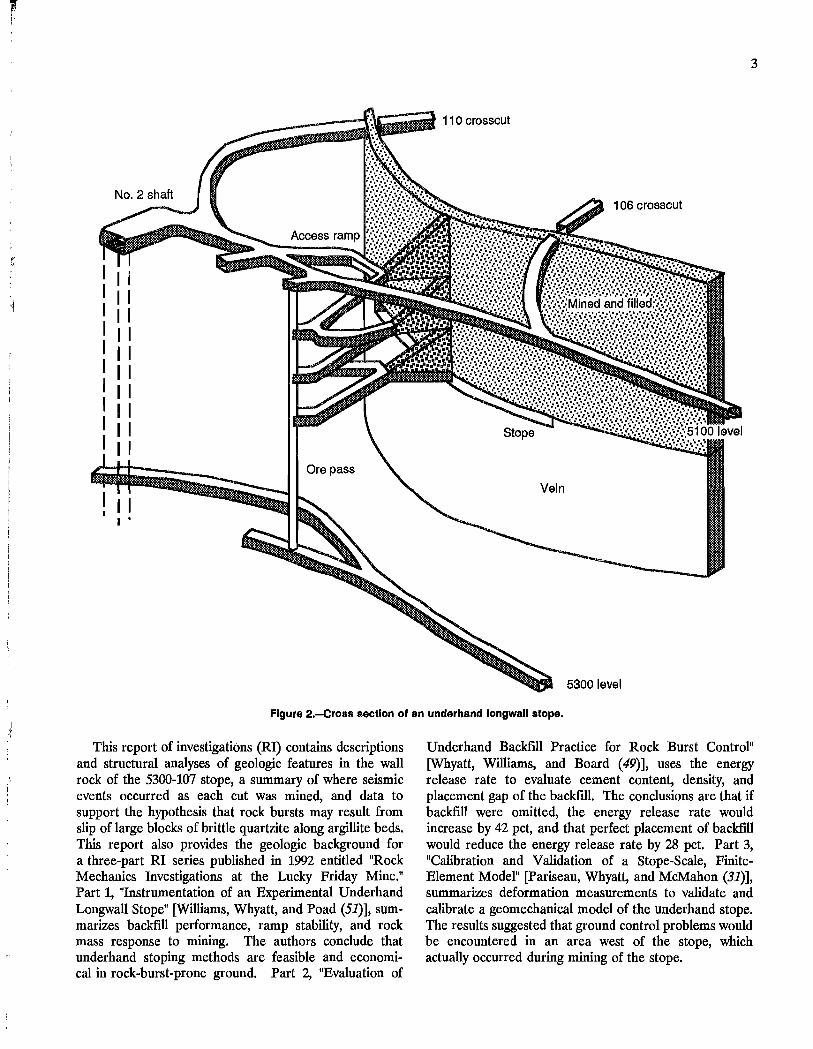
Underhand longwall cut-and-fill mining is similar to overhand cut-and-fill; however, instead of stoping or mining overhead to the next level, mining progresses downward. Initially, ramps are driven from one level down to the next. A cut is driven horizontally from the ramp in both directions along the vein. When the cut is completed, it is filled with cemented backfill. The next cut then is advanced from the ramp, but beneath the first cut (fig. 2). Using this procedure, a pillar of unmined ore is always below the stope.
Bureau researchers and Hecla officials felt that the underhand mining method might reduce rock bursts because, historically, most bursts in overhand cut-and-fill stopes occur in pillars or sills of unmined ore above stopes. As a pillar of ore is mined and becomes smaller, stress is concentrated in a smaller and smaller volume of ore, ultimately resulting in a pillar rock burst. Underhand cut-and-fill methods would eliminate the pillar of unmined ore above the stope.
• Murray
• ... ..Q§2UJ;.n~1t • Burke
It,,:~ ......,... Osburn Sunshine Mine "'- --- _ St M' It,,~ U -....... ar me,,-
Galena Mine "'-.............. Lucky Friday
• Wallace --.....~_~_ Mullan
Idaho
Figure 1.-Locatlon of Lucky Friday Mine.
.' :1
ii
I t
- - -- - ----------------
3
:::;;;;_-;d-~t~.B 110 crosscut
1 06 crosscut
I I I I I I I I I I I I I I I I" I I I I I I I I I I I I
Vein
I I I I
I •
5300 level
Figure 2.-Cross section of an underhand longwall stope.
This report of investigations (RI) contains descriptions and structural analyses of geologic features in the wall rock of the 5300-107 stope, a summary of where seismic events occurred as each cut was mined, and data to support the hypothesis that rock bursts may result from slip of large blocks of brittle quartzite along argillite beds. This report also provides the geologic background for a three-part RI series published in 1992 entitled "Rock Mechanics Investigations at the Lucky Friday Mine." Part 1, "Instrumentation of an Experimental Underhand Longwall Stope" [Williams, Whyatt, and Poad (51)], summarizes backfill performance, ramp stability, and rock mass response to mining. The authors conclude that underhand stoping methods are feasible and economical in rock-burst-prone ground. Part 2, "Evaluation of
Underhand Backfill Practice for Rock Burst Control" [Whyatt, Williams, and Board (49)], uses the energy release rate to evaluate cement content, density, and placement gap of the backfill. The conclusions are that if backfill were omitted, the energy release rate would increase by 42 pet, and that perfect placement of backfill would reduce the energy release rate by 28 pct. Part 3, "Calibration and Validation of a Stope-Scale, FiniteElement Model" [Pariseau, Whyatt, and McMahon (31)], summarizes deformation measurements to validate and calibrate a geomechanical model of the underhand stope. The results suggested that ground control problems would be encountered in an area west of the stope, which actually occurred during mining of the stope.
;1
;.
! 'I,
Ii
4
BACKGROUND
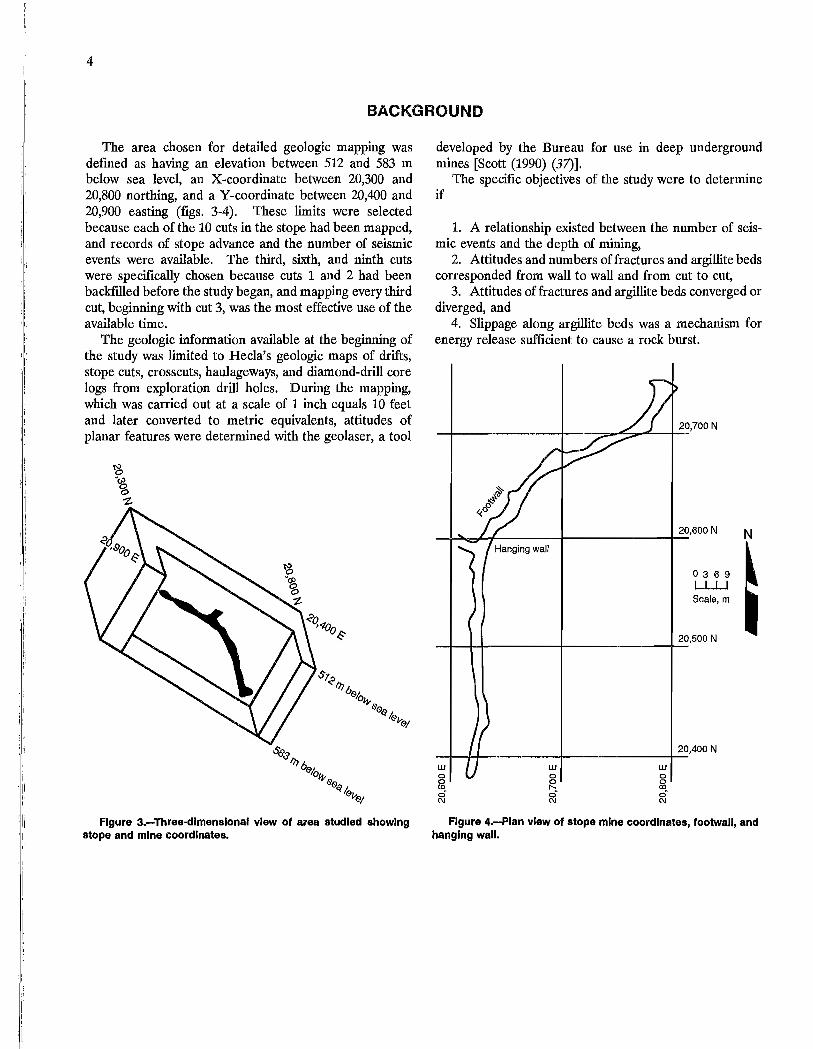
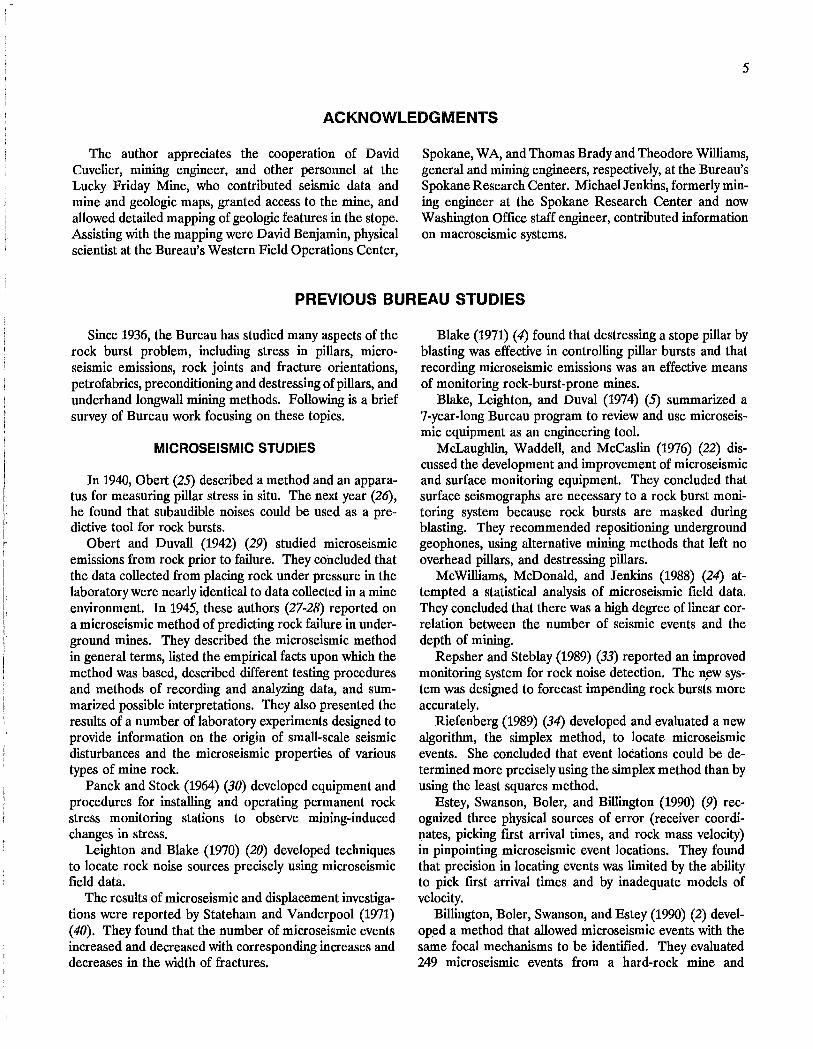
The area chosen for detailed geologic mapping was defined as having an elevation between 512 and 583 m below sea level, an X -coordinate between 20,300 and 20,800 northing, and a Y-coordinate between 20,400 and 20,900 easting (figs. 3-4). These limits were selected because each of the 10 cuts in the stope had been mapped, and records of stope advance and the number of seismic events were available. The third, sixth, and ninth cuts were specifically chosen because cuts 1 and 2 had been backftlled before the study began, and mapping every third cut, beginning with cut 3, was the most effective use of the available time.
The geologic information available at the beginning of the study was limited to Hecla's geologic maps of drifts, stope cuts, crosscuts, haulageways, and diamond-drill core logs from exploration drill holes. During the mapping, which was carried out at a scale of 1 inch equals 10 feet and later converted to metric equivalents, attitudes of planar features were determined with the geolaser, a tool
$198 II} 0616
0lf,. S6lq /,
6lv6lj
Figure 3.-Three-dimensional view of area studied showing stope and mine coordinates.
developed by the Bureau for use in deep underground mines [Scott (1990) (37)].
The specific objectives of the study were to determine if
1. A relationship existed between the number of seismic events and the depth of mining,
2. Attitudes and numbers of fractures and argillite beds conesponded from wall to wall and from cut to cut,
3. Attitudes of fractures and argillite beds converged or diverged, and
4. Slippage along argillite beds was a mechanism for energy release sufficient to cause a rock burst.
20,700 N ~~------------+---~~~~~;--
~f-lIIoo,~'-I-____ +-______ ;-2_0,600 N N
03 6 9 LLLI Scale, m
-If-+-II-____ +-______ -t-2_O,500 N
20,400 N
w w w 0 0 0 0 0 0 (0 d 00 0 0 C\I C\I C\I
Figure 4.-Plan view of stope mine coordinates, footwall, and hanging wall.
~---'
5
ACKNOWLEDGMENTS
The author appreciates the cooperation of David Cuvelier, mining engineer, and other personnel at the Lucky Friday Mine, who contributed seismic data and mine and geologic maps, granted access to the mine, and allowed detailed mapping of geologic features in the stope. Assisting with the mapping were David Benjamin, physical scientist at the Bureau's Western Field Operations Center,
Spokane, WA, and Thomas Brady and Theodore Williams, general and mining engineers, respectively, at the Bureau's Spokane Research Center. Michael Jenkins, formerly mining engineer at the Spokane Research Center and now Washington Office staff engineer, contributed information on macroseismic systems.
PREVIOUS BUREAU STUDIES
Since 1936, the Bureau has studied many aspects of the rock burst problem, including stress in pillars, microseismic emissions, rock joints and fracture orientations, petrofabrics, preconditioning and destressing of pillars, and underhand longwall mining methods. Following is a brief survey of Bureau work focusing on these topics.
MICROSEISMIC STUDIES
In 1940, Obert (25) described a method and an apparatus for measuring pillar stress in situ. The next year (26), he found that subaudible noises could be used as a predictive tool for rock bursts.
Obert and Duvall (1942) (29) studied microseismic emissions from rock prior to failure. They concluded that the data collected from placing rock under pressure in the laboratory were nearly identical to data collected in a mine environment. In 1945, these authors (27-28) reported on a microseismic method of predicting rock failure in underground mines. They described the microseismic method in general terms, listed the empirical facts upon which the method was based, described different testing procedures and methods of recording and analyzing data, and summarized possible interpretations. They also presented the results of a number of laboratory experiments designed to provide information on the origin of small-scale seismic disturbances and the microseismic properties of various types of mine rock.
Panek and Stock (1964) (30) developed equipment and procedures for installing and operating permanent rock stress monitoring stations to observe mining-induced changes in stress.
Leighton and Blake (1970) (20) developed techniques to locate rock noise sources precisely using microseismic field data.
The results of microseismic and displacement investigations were reported by Stateham and Vanderpool (1971) (40). They found that the number of microseismic events increased and decreased with corresponding increases and decreases in the width of fractures.
Blake (1971) (4) found that destressing a stope pillar by blasting was effective in controlling pillar bursts and that recording microseismic emissions was an effective means of monitoring rock-burst-prone mines.
Blake, Leighton, and Duval (1974) (5) summarized a 7-year-Iong Bureau program to review and use microseismic equipment as an engineering tool.
McLaughlin, Waddell, and McCaslin (1976) (22) discussed the development and improvement of microseismic and surface monitoring equipment. They concluded that surface seismographs are necessary to a rock burst monitoring system because rock bursts are masked during blasting. They recommended repositioning underground geophones, using alternative mining methods that left no overhead pillars, and destressing pillars.
McWilliams, McDonald, and Jenkins (1988) (24) attempted a statistical analysis of microseismic field data. They concluded that there was a high degree of linear correlation between the number of seismic events and the depth of mining.
Repsher and Steblay (1989) (33) reported an improved monitoring system for rock noise detection. The n~w system was designed to forecast impending rock bursts more accurately.
Riefenberg (1989) (34) developed and evaluated a new algorithm, the simplex method, to locate microseismic events. She concluded that event locations could be determined more precisely using the simplex method than by using the least squares method.
Estey, Swanson, Boler, and Billington (1990) (9) recognized three physical sources of error (receiver coordinates, picking first arrival times, and rock mass velocity) in pinpointing microseismic event locations. They found that precision in locating events was limited by the ability to pick first arrival times and by inadequate models of velocity.
Billington, Boler, Swanson, and Estey (1990) (2) developed a method that allowed microseismic events with the same focal mechanisms to be identified. They evaluated 249 microseismic events from a hard-rock mine and
1 ,
i I
I
6
established six groups of events that probably had the same focal mechanism. The authors also proved that changes in the focal mechanisms of events could be used to infer changes in stress.
Steblay. Brady, and Hollop (1990) (41) and Steblay, Swendseid, and Brady (1990) (42) reported on a minewide microseismic rock-burst monitoring system. The system links several minico~J?uters, each of which establishes microseismic locations from one or two stopes. Advantages of this system are ease of use by industry and the system's ability to save data generally lost as a result of power failures, instrument failures, or cut cables.
Boler and Swanson (1990) (6) designed a data acquisition system to collect, process, and analyze acoustic microseismic emissions. The system is interactive and allows not only data acquisition, but also interactive analysis of the data using a graphics display of the event locations.
Riefenberg (1991) (35) concluded that only 3 pct of all rock bursts occurred independently of blasting. She also concluded that measurements of the average daily level of microseismic activity might provide a long-term indicator of rock:burst activity by delineating areas of high stress.
Swanson, Estey, Boler, and Billington (1992) (45) found that to improve accuracy in locating seismic events, the constant isotropic velocity model and straight ray paths must be abandoned for a spatially variable velocity structure with curved ray paths.
Coughlin and Sines (1985) (8) tested a portable microseismic processor recorder at a deep-level mine in Idaho. The device was shown to be effective in collecting data in a controlled environment and in a working area of the mine.
Swanson and Boler (1988) (44) used full waveform analytical techniques and microseismic acoustic emission data in an attempt to understand the mechanics of deformation in a fractured rock mass. These data proved to be an effective tool for evaluating hazardous ground conditions.
Billington, Boler, Swanson, and Estey (1992) (3) used tomographic imaging to characterize spatial and temporal variations in P-wave (compression-wave) velocities. They found that stress concentrations near mine openings were lower than those near the center of a pillar, conftrming that tomography can be a useful tool for determining stress in a rock mass.
Swanson (1992) (43) studied the relationships between large seismic events, mining geometry, and local faults in a deep-level mine. He found that 70 pct of the events occurred along one fault plane.
Jenkins, Williams, and Wideman (1990) (17) reported on rock-burst mechanism studies at the Lucky Friday'
Mine. Using waveforms collected with a macro seismic system, they analyzed a 3.1 to 3.4 Richter-magnitude rock bur'st. Using waveform analysis, they hypothesized that the rock burst was either slip along a geologic structure or compressive failure of the pillar and concluded that the waveform analysis supported a slip mechanism for failure.
STUDIES OF NEW MINING METHODS
In an effort to reduce stress in pillars, several types of mining methods have been attempted by the Bureau in the Coeur d'Alene Mining District, beginning in 1979.
The Bureau supervised a demonstration of an underhand longwall stope at the Star Mine. The objective was to decrease rock bursts by eliminating pillars above stopes. The results of the demonstration proved that underhand longwall mining methods were practical for controlling common ground problems in the mine, and that the method should be applicable in other District mines [Bush, Blake, and Board (1982) (7)].
Leighton (1982) (19) monitored a rock-burst-prone pillar in a metallic ore vein in the Galena Mine to measure reactions to increasing loads during mining. He monitored changes in stress at chosen sites in the pillar, displacement characteristics of the drift above the pillar, and micro seismic activity in and near the pillar. He found that microseismic measurements, vibrating wire stress measurements, and displacement measurements reflected pillar reactions.
From 1984 to the present, the Bureau has been monitoring a demonstration underhand longwall stope at the Lucky Friday Mine. The overall objective of the demonstration has been to determine if this method could decrease the severity and frequency of pillar (sill) bursts. Based on this work, Williams and Cuvelier (1990) (50) concluded that there were no major problems associated with the underhand longwall stope design and that hazardous pillars associated with multilevel overhand mining were eliminated. They also felt that it was possible to mine a steeply dipping vein in a rock-burst-prone mine safely and economically.
At the same time, Whyatt and Board (1990) (48) examined a strain-softening model for a numerical analysis of potential rock bursting by shear fracture propagation. They concluded that underhand mining methods would not eliminate rock bursts at the face, but that the bursts probably would be smaller in magnitude than would be the case using overhand methods.
%
7
GEOLOGIC RESEARCH
SOUTH AFRICA
Several researchers in other parts of the world have investigated the influence of geology on seismicity in general and rock bursting in particular. Mines in the Klerksdorp Goldfields in the Republic of South Africa have reached greater depths than those at the Lucky Friday; these mines have also experienced extensive rock bursting. The following is a summary of some of the more significant geologic research in South Africa.
The influence of geologic structure on seismicity and rock bursts was investigated by van der Heever (1982) (41). He concluded that the principal stresses prevalent during formation of the Vaal reef basin had little influence on the orientation of the compressional and tensional axes of the fault plane solutions. He further concluded that the majority of large events that occurred near faults pointed to mechanisms consistent with the type of shear movements that occur during normal and reverse oblique slip faulting.
Gay and van der Heever (1982) (12) attempted to correlate geological structures and seismicity. They found that faults in the Klerksdorp Gold Mining District were at right angles to the direction of principal stress, and that where mining intersected a fault, stress was relieved, resulting in seismic events of significant magnitude.
Potgieter and Roering (1984) (32) felt that seismic. events were the result of shear failure along faults, dikes, and possibly mining-induced fractures.
Rorke and Roering (1984) (36) studied source mechanisms for seismic events and concluded that, based on detailed geologic mapping of rock-burst damage and deformation, failure was parallel to the stope face and was not caused by slippage along faults.
Gay, Spencer, Van Wyk, and van der Heever (1984) (11) found that seismic events were of two types: those associated with mining and those associated with geologic features. They also found that large events occurred near faults, dikes, and pillars. Their conclusions were that the rate of production had no influence on the frequency of large events and that residual horizontal regional stresses added to strain energy along faults.
A study by Lenhardt (1988) (21) indicated that most large rock bursts at Western Deep Levels, Ltd., in the Witwatersrand Gold District, over a 2-year period were in the vicinity of fauits and dikes.
UNITED STATES
In the United States, other researchers also have examined the relationship between seismic activity and geologic features.
Two studies at the Lucky Friday Mine were directed toward relating joints to stress. Allen (1979) (1) used both the Council for Scientific and Industrial Research (CSIR) biaxial strain gauge cell and maps of in situ joint and fracture patterns to determine stress on the 4250 level of the mine. He found that correlating the direction and extent of joints with axial plane orientations of nearby folds was a way to infer the orientation of principal stresses. Pariseau3 examined the influence of joints on underhand longwall stability. Using the Bureau-developed UTAH2 finite-element program along with a method for entering data about joints, he concluded that joints did make a difference in the elastic response of the rock.
Johnston and Einstein (1990) (18) completed a survey of mining-associated rock bursts and categorized them as Type I (associated with mining rates) and Type II (associated with slip along faults). Results of this study showed that the number of Type I bursts was directly affected by mining rate, that the locations of Type I bursts were determined by location of the face or geological structures, and that Type II bursts often occurred along inactive faults activated by extensive mining.
Only two geologic studies have been conducted by Bureau personnel in the Coeur d'Alene Mining District, both at the Star-Morning complex. Gresseth (1964) (14) studied different types of joints. He determined that release joint systems (those that form parallel to the axial plane of a fold) were less pronounced than shear (those that form parallel to bedding or structure) or extension systems (those that form perpendicular to the axial plane of a fold), and that the joint systems were oriented perpendicular to the axis of compressive force. Petrofabric studies of tectonic and mining-induced deformations by Gresseth and Reid (1968) (15) proved that regional, macroscopic, mesoscopic, and microscopic fabrics were similar in orientation and were associated with tectonic folding and faulting.
3Information on interpretation of rock mechanics from Pariseau, W. G., mining engineer, Spokane Research Center, McKinnon Professor of Mining Engineering, University of Utah, Salt Lake City, UT.
8
SEISMIC EVENTS AND MONITORING
Energy is released in three modes. First, stored strain energy is released, causing popping and spitting of rock near the face; this form is often associated with joints. Second, potential energy is released along faults or as
-bumps or small localized rock bursts. Third, slip along faults results in the release of large amounts of stored energy, sometimes causing collapse of pillars in stopes. Blasting often triggers the release of energy, which may manifest itself in any of these three modes.
For the purposes of this report, a seismic event is defmed as the initial appearance of seismic energy on a seismic record. Seismic events include microseismic events, rock bursts, and earthquakes. Microseismic events are detected using an underground geophone and normally are not measured on a surface seismograph because of the small amount of energy released. They occur near drifts, haulageways, or stopes and cause popping, spitting, and spalling of the surrounding rock mass. Microseismic events, which include bumps and knocks, usually displace less than 1 to 2 m3 of material into a mine opening.
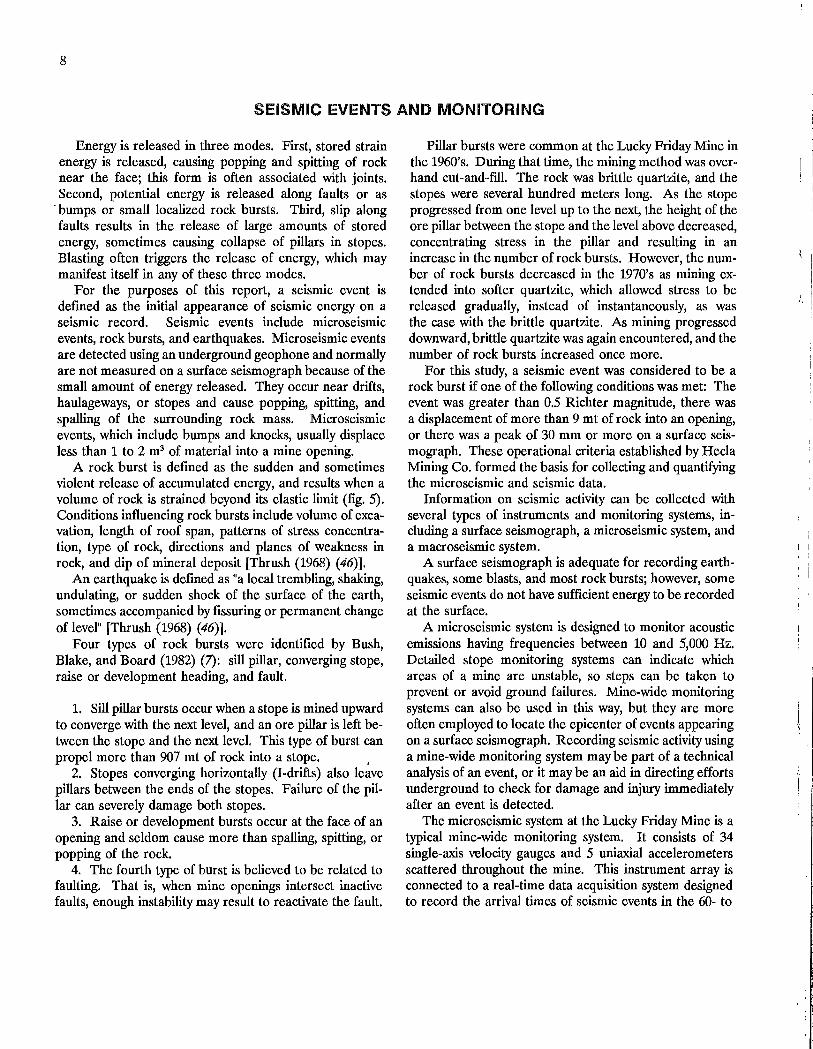
A rock burst is defined as the sudden and sometimes violent release of accumulated energy, and results when a volume of rock is strained beyond its elastic limit (fig. 5). Conditions influencing rock bursts include volume of excavation, length of roof span, patterns of stress concentration, type of rock, directions and planes of weakness in rock, and dip of mineral deposit [Thrush (1968) (46)].
An earthquake is defined as "a local trembling, shaking, undulating, or sudden shock of the surface of the earth, sometimes accompanied by fissuring or permanent change of level" [Thrush (1968) (46)].
Four types of rock bursts were identified by Bush, Blake, and Board (1982) (7): sill pillar, converging stope, raise or development heading, and fault.
1. Sill pillar bursts occur when a stope is mined upward to converge with the next level, and an ore pillar is left between the stope and the next level. This type of burst can propel more than 907 mt of rock into a stope. ,
2. Stopes converging horizontally (I-drifts) also leave pillars between the ends of the stopes. Failure of the pillar can severely damage both stopes.
3. Raise or development bursts occur at the face of an opening and seldom cause more than spalling, spitting, or popping of the rock.
4. The fourth type of burst is believed to be related to faulting. That is, when mine openings intersect inactive faults, enough instability may result to reactivate the fault.
Pillar bursts were common at the Lucky Friday Mine in the 1960's. During that time, the mining method was overhand cut-and-fill. The rock was brittle quartzite, and the stopes were several hundred meters long. As the stope progressed from one level up to the next, the height of the ore pillar between the stope and the level above decreased, concentrating stress in the pillar and resulting in an increase in the number of rock bursts. However, the number of rock bursts decreased in the 1970's as mining extended into softer quartzite, which allowed stress to be released gradually, instead of instantaneously, as was the case with the brittle quartzite. As mining progressed downward, brittle quartzite was again encountered, and the number of rock bursts increased once more.
For this study, a seismic event was considered to be a rock burst if one of the following conditions was met: The event was greater than 0.5 Richter magnitude, there was a displacement of more than 9 mt of rock into an opening, or there was a peak of 30 mm or more on a surface seismograph. These operational criteria established by Hecla Mining Co. formed the basis for collecting and quantifying the microseismic and seismic data.
Information on seismic activity can be collected with several types of instruments and monitoring systems, including a surface seismograph, a microseismic system, and a macro seismic system.
A surface seismograph is adequate for recording earthquakes, some blasts, and most rock bursts; however, some seismic events do not have sufficient energy to be recorded at the surface.
A microseismic system is designed to monitor acoustic emissions having frequencies between 10 and 5,000 Hz. Detailed stope monitoring systems can indicate which areas of a mine are unstable, so steps can be taken to prevent or avoid ground failures. Mine-wide monitoring systems can also be used in this way, but they are more often employed to locate the epicenter of events appearing on a surface seismograph. Recording seismic activity using a mine-wide monitoring system may be part of a technical analysis of an event, or it may be an aid in directing efforts underground to check for damage and injury immediately after an event is detected.
The microseismic system at the Lucky Friday Mine is a typical mine-wide monitoring system. It consists of 34 single-axis velocity gauges and 5 uniaxial accelerometers scattered throughout the mine. This instrument array is connected to a real-time data acquisition system designed to record the arrival times of seismic events in the 60- to
, "
I i
9
Figure 5.-Rock burst damage.
500-Hz range. These events must be detected on at least 5 of the 39 sensors. The signals are processed by an online, interactive minicomputer that uses the Bureau's seven-channel, least squares program to calculate source locations with an accuracy of about 15 m.
A macroseismic system is designed to record digitized waveforms sensed by triaxial geophones and to target mining-induced events large enough to cause damage to the mine, i.e., events having Richter magnitudes between 0.5 and 2.5 and frequency ranges between 1 and 500 Hz. Geophones having three orthogonally oriented velocity gauges are placed where they can surround an area of active mining, but are still far enough away to discriminate
between P (compression) and S (shear) waves in the seismic signal. A data acquisition and processing station continuously monitors the signals transmitted from the geophones and stores incoming data when a sufficient number of gauges have detected a signal.
Unlike data from a microseismic system, macroseismic data can be analyzed to determine several parameters, including location, time of occurrence, magnitude, firstmotion directions, and stress drop. These parameters can be obtained from the waveform and spectra of ground displacement by using conventional seismic analysis methods.
GEOLOGIC SETTING
REGION
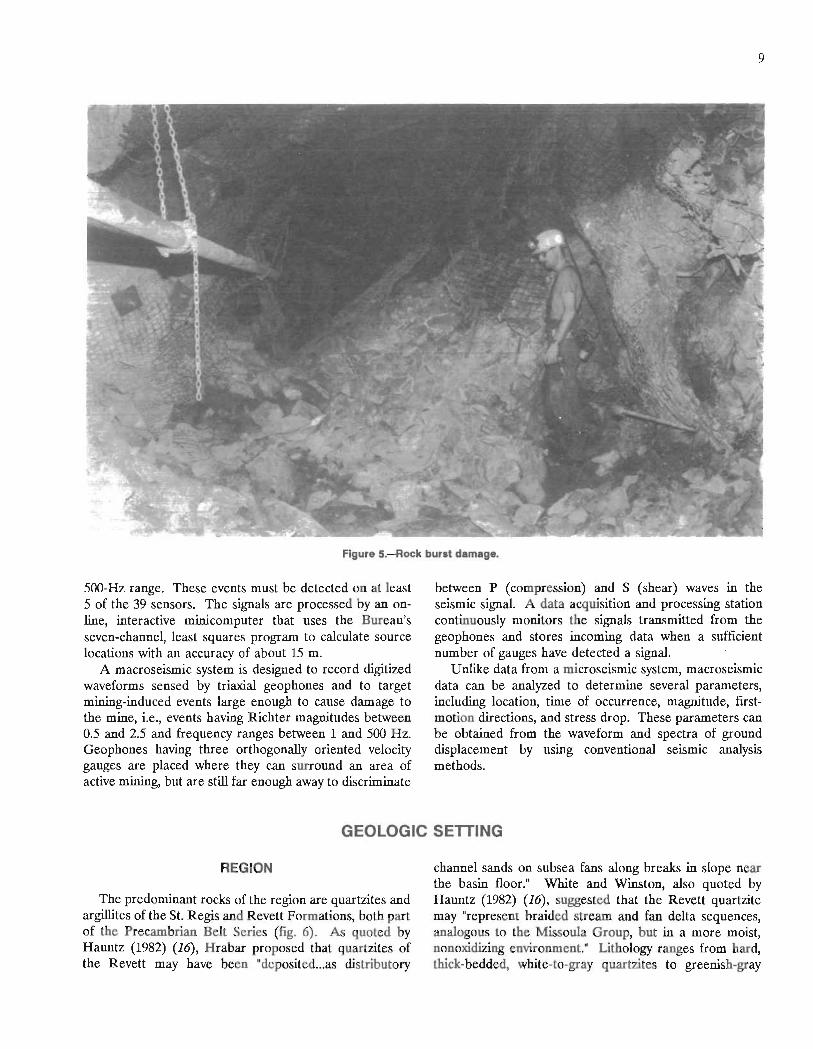
The predominant rocks of the region are quartzites and argillites of the St. Regis and Revett Formations, both part of the Precambrian Belt Series (fig. 6). As quoted by Hauntz (1982) (16), Hrabar proposed that quartzites of the Revett may have been "deposited ... as distributory
channel sands on subsea fans along breaks in slope near the basin floor." White and Winston, also quoted by Hauntz (1982) (16), suggested that the Revett quartzite may "represent braided stream and fan delta· sequences, analogous to the Missoula Group, but in a more moist, nonoxidizing environment." Lithology ranges from hard, thick-bedded, white-to-gray quartzites to greenish-gray
10
:" I
St. Regis Formation
Upper
Middle
Lower (Upper submember)
137 m
107 m
229 m
Lower 229 m (Lower submember)
Burke Formation
LEGEND
Argillite
Sericitic quartzite
Vitreous quartzite
Figure 6.-Generalized stratigraphy of Lucky Friday Mine.
11
argillaceous quartzites [Full (1955) (10)]. In some areas, 0 100 200 300
the Revett may be as much as 396 m thick. I----... ::::~~~;!:~-~L~-:I :~I ~_I __ _ Hrabar interpreted the St. Regis Formation "to be a Scale, m turbidite sequence that was deposited during a flysch phase N of sedimentation" in water ranging from a few hundred to ~ 1,524 m deep [Hauntz (1982) (16)]. The St. Regis is from 200 to 335 m thick. It consists of massive, dark-green argillaceous quartzite and laminae of light-green argillite and beds of gray-to-purple argillaceous quartzite. Beds in
North block
~ the lower portion are more quartzitic and thicker [Full (1955) (10)].
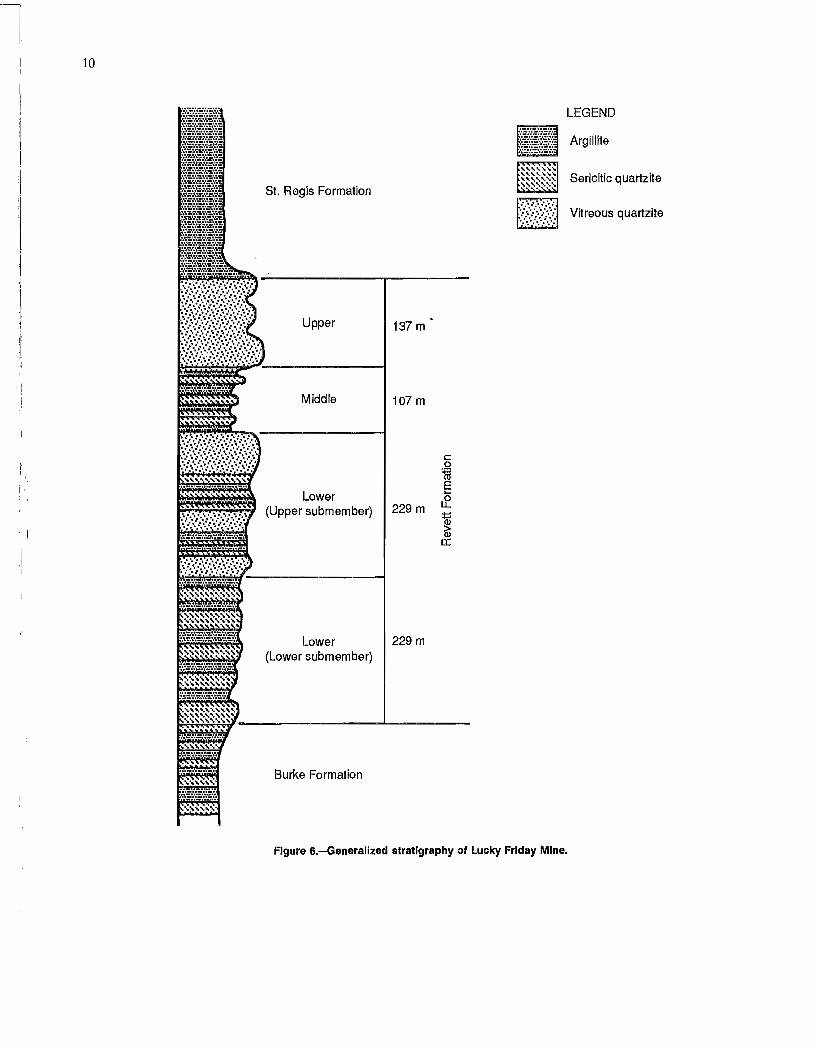
Both the St. Regis and Revett Formations have been folded and faulted numerous times. The Osburn Fault, a tectonic, right-lateral, strike-slip fault, lies south of the mine and trends east-west for approximately 160 km. It has a lateral displacement of about 26 km (fig. 1). Most other regional and local faults, including the North Control, South Control, and Whiteledge faults (fig. 7), trend northwest.
MINE
The Lucky Friday Mine is developed primarily along a single, tabular; nearly vertical vein (the Lucky Friday), the origin of which is not clearly understood. Whether the vein was a result of rising magmatic solutions along a zone of weakness or a result of mobilization of the metals from the country rock is currently being debated. Gitlin (1986) (13) ascribed the genesis of the vein to the mixing of two fluids, a hypogene solution and fluids from wall rock at the ore horizon. Lead in the vein has been dated as Precambrian; however, later fluids may have remobilized the metals.
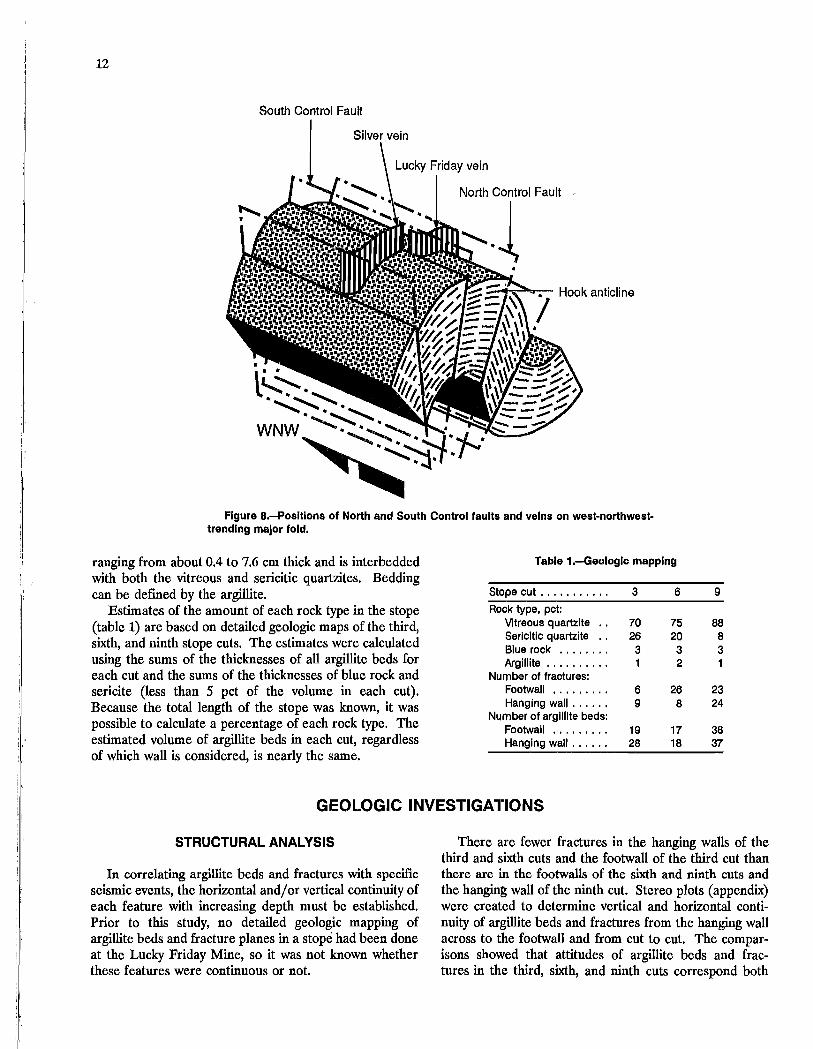
The Lucky Friday vein ranges from several centimeters to about 4.3 m thick and contains massive galena, sphalerite, and tetrahedrite, which are the ore minerals for lead, zinc, and silver, respectively. Gangue materials are quartz and siderite. The vein is sigmoidal in shape (fig. 8) imd is bounded on the north by the North Control Fault and on the south by the South Control Fault. Th~ vein generally coincides with the Hook anticline (fig. 8) and dips 700 to 900 to the south, with a southeast rake. Because the vein dips more steeply than the anticline, it contacts increasingly older rocks with depth and intersects the Upper Revett about 549 m below the surface.
The Silver vein, offset on the west end of the Lucky Friday vein, may be a separate vein. Strike lengths of the Lucky Friday and Silver veins are about 488 and 73 m, respectively.
Wall rock is vitreous quartzite, sericitic quartzite, "blue rock" (vitreous quartzite that contains finely disseminated sulfides), and argillite.
East block
South block
OSburn Fault
Figure 7.-Structural blocks In Lucky Friday Mine. (Map by Brian White, geologist, Spokane Research Center, U.S. Bureau of Mines, Spokane, WA.)
DEMONSTRATION STOPE
The site for the demonstration was the 5300-107 stope, which lies between the 5100 and 5300 levels. The top of the 5300-107 stope is at an elevation of about 532 m below sea level in the upper submember of the lower member of the Revett Formation. Fine-grained vitreous quartzite predominates in this area. The quartzite occurs in flat, laminated to crossbedded, 46- to 91-cm-thick beds and contains abundant quartz veins. Fractures in the quartzite lie parallel to bedding planes and at various angles to the bedding. The color is white, light brown, or pale green. Hardness is greater than 6 on the Moh's scale of hardness.
Sericitic quartzite, next in abundance, is softer than vitreous quartzite (about 4 to 4.5 on the Moh's scale) and also occurs in flat, laminated, 30- to 91-cm-thick beds. It appears randomly along bedding planes in the vitreous quartzite and is commonly associated with thin beds of argillite. The color is pale green or light brown.
Quartzite containing about 1.6 pct fmely disseminated galena (lead sulfide) is known by local geologists and miners as blue rock. It generally is found in proximity to the vein [Hauntz (1982) (16)].
The argillite is pale green to light brown and ranges from about 1 to 4 on the Moh's scale. When in contact with water, the argillite becomes as soft as clay or wet fault gouge. The argillite occurs in flat, laminated beds
---,,-~-------.~-------------------------
I I ,
I,
,I'
ii
12
South Control Fault
Silver vein
Lucky Friday vein
;;-of-;;-=.r-::-- Hook anticli n e
Figure B.-Positions of North and South Control faults and veins on west-northwesttrending major fold.
ranging from about 0.4 to 7.6 cm thick and is interbedded with both the vitreous and sericitic quartzites. Bedding can be defined by the argillite.
Estimates of the amount of each rock type in the stope (table 1) are based on detailed geologic maps of the third, sixth, and ninth stope cuts. The estimates were calculated using the sums of the thicknesses of all argillite beds for each cut and the sums of the thicknesses of blue rock and sericite (less than 5 pct of the volume in each cut). Because the total length of the stope was known, it was possible to calculate a percentage of each rock type. The estimated volume of argillite beds in each cut, regardless of which wall is considered, is nearly the same.
Table 1.-Geologlc mapping
Stope cut .......•... 3 6 Rock type, pct:
Vitreous quartzite .. 70 75 Serlcltlc quartzite .. 26 20 Blue rock '" I"" 3 3 Argillite .......... 1 2
Number of fractures: Footwall ......... 6 26 Hanging wall ...... 9 8
Number of argillite beds: Footwall ......... 19 17 Hanging wall ...... 28 18
9
88 8 3 1
23 24
38 37
GEOLOGIC INVESTIGATIONS
STRUCTURAL ANALYSIS
In correlating argillite beds and fractures with specific seismic events, the horizontal and/or vertical continuity of each feature with increasing depth must be established. Prior to this study, no detailed geologic mapping of argillite beds and fracture planes in a stope had been done at the Lucky Friday Mine, so it was not known whether these features were continuous or not.
There are fewer fractures in the hanging walls of the third and sixth cuts and the footwall of the third cut than there are in the footwalls of the sixth and ninth cuts and the hanging wall of the ninth cut. Stereo plots (appendix) were created to determine vertical and horizontal continuity of argillite beds and fractures from the hanging wall across to the footwall and from cut to cut. The comparisons showed that attitudes of argillite beds and fractures in the third, sixth, and ninth cuts correspond both
r
horizontally across the stope and vertically from cut to cut. However, most fractures strike northeast and dip northwest, whereas most argillite beds strike northwest and dip northeast. This structural' pattern can be visualized as planes that dip steeply away from each other (fig. 9) or as a network of interconnecting planes. Through this network, energy could be released along the weaker argillite beds or in directions other than along the plane where the energy originated.
SEISMIC ANALYSIS
Hecla engineers have been using a rock burst monitoring system to collect microseismic data since 1972 [McMahon (1988) (23)]. Mining of cuts 1 through 10 of the 5300-107 stope occurred from 1985 to 1988, and microseismic information for the stope was recorded by Hecla personnel. From these data, 137 seismic events were selected because they had a measurable amplitude on the surface seismograph and were located in the previously defined area of the 5300-107 stope. Information (including event number, location of event, time and date of event, event's seismic amplitude, and amount of rock displaced) about each of the 137 events was entered into a dBASE III PLUS4 me.
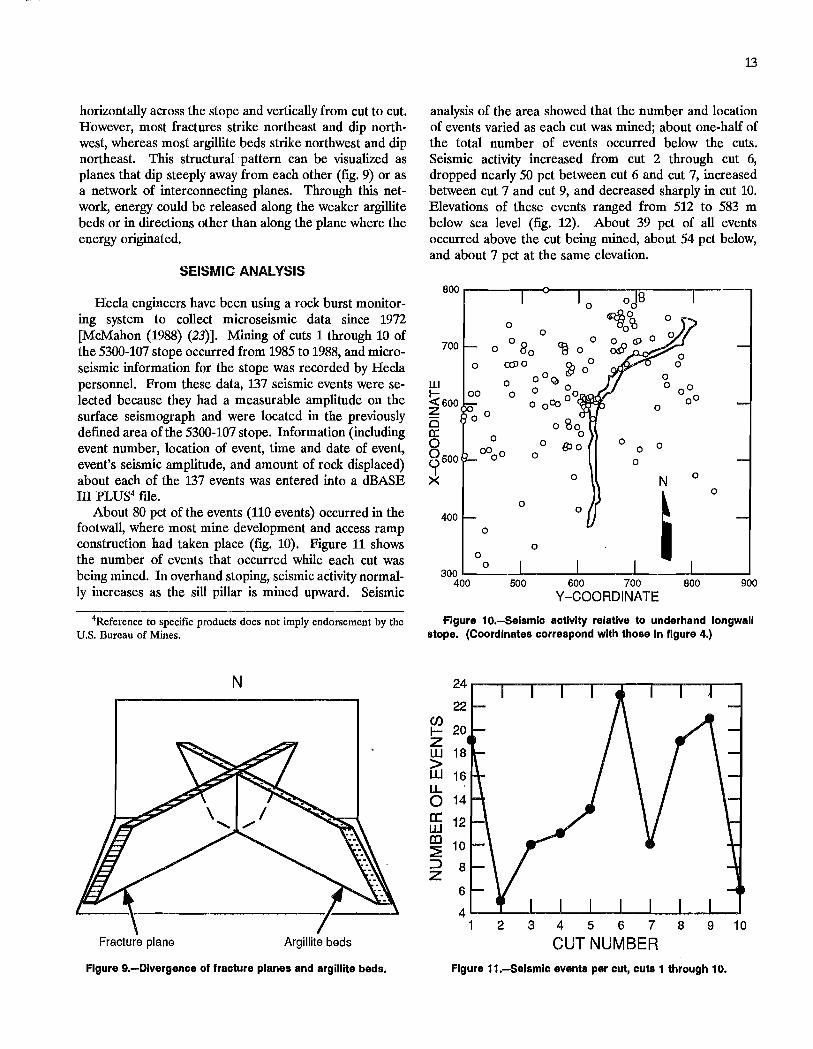
About 80 pet of the events (110 events) occurred in the footwall, where most mine development and access ramp construction had taken place (fig. 10). Figure 11 shows the number of events that occurred while each cut was being mined. In overhand stoping, seismic activity normally increases as the sill pillar is mined upward. Seismic
4Reference to specific products does not imply endorsement by the U.S. Bureau of Mines.
N
Fracture plane Argillite beds
Figure g.-Divergence of fracture planes and argillite beds.
13
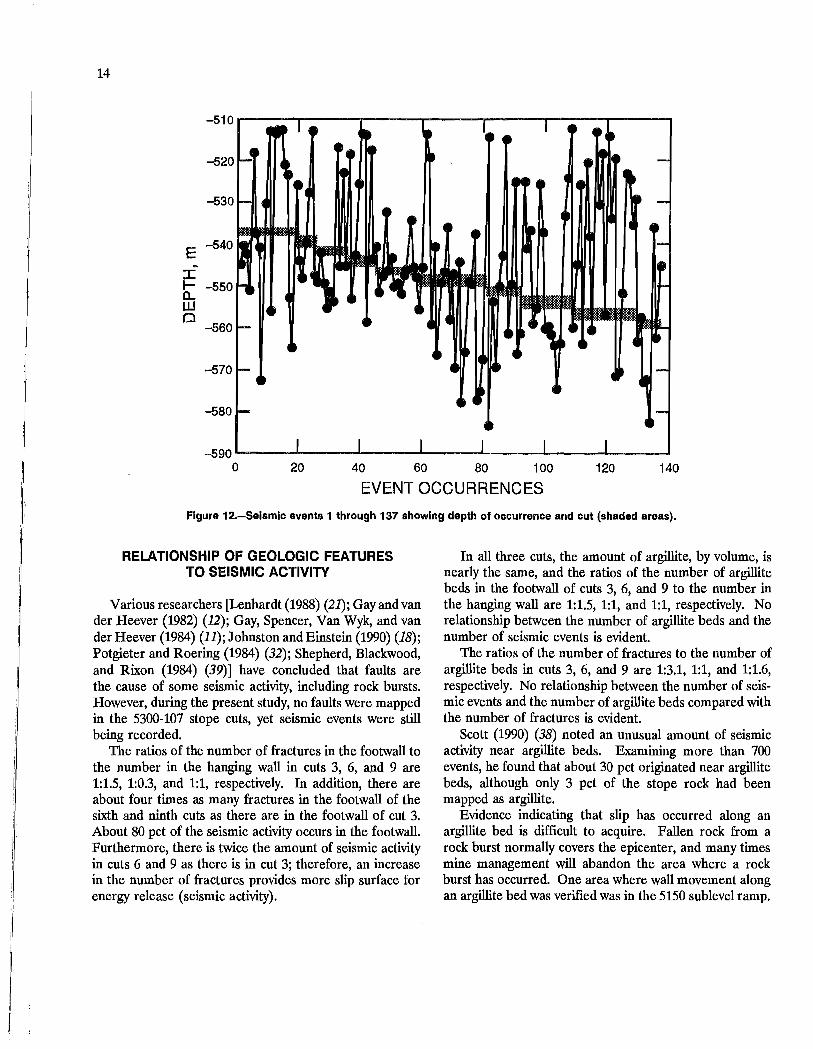
analysis of the area showed that the number and location of events varied as each cut was mined; about one-half of the total number of events occurred below the cuts. Seismic activity increased from cut 2 through cut 6, dropped nearly 50 pct between cut 6 and cut 7, increased between cut 7 and cut 9, and decreased sharply in cut 10. Elevations of these events ranged from 512 to 583 m below sea level (fig. 12). About 39 pct of all events occurred above the cut being mined, about 54 pct below, and about 7 pct at the same elevation.
800
0 0
700 0 00
~ 0 00 00)0 0 0
o ~ 0 0 ill 0 o QJ
0 00 I- 00 0 o 0
«600 00 00
z o 0 ooco 0
(5 0
0: 0 0 0 0 0 0 500
0000 0 0
~ 0
0 0
0
0
400 0
0 0
0 300
400 500 600 700 800 900 V-COORDINATE
-Figure 10.-Selsmic activity relative to underhand longwall stope. (Coordinates correspond with those In figure 4.)
~ 20 Z ill 18
iri 16 LL o 14
a: 12 ill III 10 ~ :::::> 8 Z
6
2 3 4 5 6 7 8 9 10
CUT NUMBER Figure 11.-Selsmlc events per cut, cuts 1 through 10.
i ~
14
-510~----~------~----~------~----~~-----r----~
E ::c I- -550 a. W o
-560
-570
-580
-590~----~----~~----~----~------~----~----~
o 20 40 60 80 100 120 140
EVENT OCCURRENCES
Figure 12.-Selsmic events 1 through 137 showing depth of occurrence and cut (shaded areas).
RELATIONSHIP OF GEOLOGIC FEATURES TO SEISMIC ACTIVITY
Various researchers [Lenhardt (1988) (21); Gay and van der Heever (1982) (12); Gay, Spencer, Van Wyk, and van der Reever (1984) (11); Johnston and Einstein (1990) (18); Potgieter and Roering (1984) (32); Shepherd, Blackwood, and Rixon (1984) (39)] have concluded that faults are the cause of some seismic activity, including rock bursts. However, during the present study, no faults were mapped in the 5300-107 stope cuts, yet seismic events were still being recorded.
The ratios of the number of fractures in the footwall to the number in the hanging wall in cuts 3, 6, and 9 are 1:1.5, 1:0.3, and 1:1, respectively. In addition, there are about four times as many fractures in the footwall of the sixth and ninth cuts as there are in the footwall of cut 3. About 80 pct of the seismic activity occurs in the footwall. Furthermore, there is twice the amount of seismic activity in cuts 6 and 9 as there is in cut 3; therefore, an increase in the number of fractures provides more slip surface for energy release (seismic activity).
In all three cuts, the amount of argillite, by volume, is nearly the same, and the ratios of the number of argillite beds in the footwall of cuts 3, 6, and 9 to the number in the hanging wall are 1:1.5, 1:1, and 1:1, respectively. No relationship between the number of argillite beds and the number of seismic events is evident.
The ratios of the number of fractures to the number of argillite beds in cuts 3, 6, and 9 are 1:3.1, 1:1, and 1:1.6, respectively. No relationship between the number of seismic events and the number of argillite beds compared with the number of fractures is evident.
Scott (1990) (38) noted an unusual amount of seismic activity near argillite beds. Examining more than 700 events, he found that about 30 pct originated near argillite beds, although only 3 pct of the stope rock had been mapped as argillite.
Evidence indicating that slip has occurred along an argillite bed is difficult to acquire. Fallen rock from a rock burst normally covers the epicenter, and many times mine management will abandon the area where a rock burst has occurred. One area where wall movement along an argillite bed was verified was in the 5150 sublevel ramp.

r No evidence of wall movement along argillite beds was apparent in this area before a rock burst. However, evidence of movement along beds was found at the site when the area was mapped following a burst. In this instance, strike-slip movement along a 0.3-m-thick argillite bed had forced the wall into the 5150 sublevel ramp (fig. 13). Dip slip during the same event was as much as 1 m.
Slip along argillite beds and fractures is a mechanism for energy release resulting in some seismic activity, including rock bursts. Slip may originate along an argillite bed or a fracture, but because the attitudes of fractures and argillite beds diverge, the direction of movement can change when a bed or fracture is intersected by another bed or fracture, or at the juncture of two features (i.e., a fracture and an argillite bed) with a mine opening. Such intersections are zones of weakness that serve to redirect the energy released during a rock burst.
o 1 2 3 I I I I Scale, m
LEGEND = ~3:::: Strike and dip of argillite bed
90 • Strike and dip of fractures
---..,,,,~ Direction of movement
15
Figure 13.-Direction of movement initiated by rock burst on 5150 sublevel.
CONCLUSIONS
Geologic investigations were conducted in an area that included the 5300-107 demonstration underhand longwall cut-and-fill stope at the Lucky Friday Mine. At the beginning of this study, four objectives were listed with regard to investigating the relationship between the geology at the Lucky Friday Mine and rorK bursting. These objectives were to determine if
1. A relationship existed between the number of seismic events and the depth of mining,
2. Attitudes and number of fractures and argillite beds corresponded from wall to wall and from cut to cut,
3. Attitudes of fractures and argillite beds converged or diverged, and
4. Slip along argillite beds was a mechanism of energy release sufficient to cause a rock burst.
On the basis of the data collected and after an analysis of the structural and seismic data, several observations can be made.
1. No relationship between depth of mining in the underhand stope and seismic activity was apparent during this study. About one-half of the total number of events occurred below the cuts. Excluding cut 1, seismic activity increased from cut 2 through cut 6; this increase was followed by a nearly 50-pct drop in the number of events between cuts 6 and 7. An increase in the number of events from cut 7 to cut 9 again was followed by a sharp drop during excavation of cut 10.
2. There are more argillite beds in the hanging wall of cut 3 than in the footwall. In cuts 6 and 9, there are the same number of argillite beds from the hanging wall to the footwall, i.e., there are neither more nor fewer argillite beds from one wall to the other.
On the other hand, there are progressively more fractures with depth. Also, there are four times as many fractures in the footwall of the sixth and ninth cuts as there are in the footwall of cut 3. An increase in the number of footwall fractures seems to correspond with an increase in seismic activity. Increased seismic activity in cut 6 might be attributed to the differences in fracture distribution between the footwall and hanging wall.
3. Argillite beds and fractures in the stope wall rock showed that the planes of these features diverged and that their attitudes corresponded from one wall to the other, forming a network of interconnecting planes. This rmding may explain why energy originating along one plane may be transferred along another plane, causing rock burst damage far from the original point of energy release.
4. Argillite beds provide planes of weakness between blocks of brittle quartzite, and energy may be released along these planes and at the junctures with fractures. Evidence that slippage of quartzite blocks along argillite beds is a mechanism for energy release was found on the 5150 sublevel ramp, where it was documented that the wall moved into the ramp along a 3-m-thick argillite bed.
Other conclusions based on the data suggest that:
1. A relationship may exist between the amount of vitreous quartzite and the frequency of seismic activity; data suggest that the greater the percentage of vitreous quartzite, the more frequent the seismic activity, and
2. Cuts with greater numbers of argillite beds may provide more surfaces for gradual slip (resembling elastic behavior rather than abrupt failure), resulting in fewer seismic events.
I: .1 ...
-r
I
III
I ii, I' i I
Ii I: I..
I ,I· :,11
16
In summary, the main conclusions of this study were that both argillite beds and fractures are mechanisms for slip, which can result in seismic activity; that no discernible increase or decrease in seismic activity could be
seen· with increased stope depth; and that fractures and argillite beds are interconnected to form a network of planes capable of transmitting damaging energy away from the source of slip.
REFERENCES
1. Allen, M. D. Determining the In-Situ Stress Field on the 4250 Level in the Lucky Friday Mine Using the CSIR Biaxial Strain Gage and Structural Geologic Mapping. M.S. Thesis, Univ. ID, Moscow, ID, 1979, 78 pp.
2. Billington, S. F., F. M. Boler, P. L. Swanson, and L. H. Estey. P-Wave Polarity Patterns From Mining-Induced Microseismicity in a Hard-Rock Mine. Paper in Rock Mechanics Contributions and Challenges: Proceedings of the 31st U.S. Symposium, ed. by W. A Hustrulid and G. A Johnson (CO Sch. Mines, Golden, CO, June 18-20, 1990). A A Balkema, 1990, pp. 931-938.
3. __ . A 2-D P-Wave Tomographic Experiment in a Deep Mine. Paper in Rock Mechanics: Proceedings of the 33rd U.S. Symposium, ed. by J. R. Tillerson and W. R. Wawersik (Santa Fe, NM, June 3-5, 1992). A A Balkema, pp. 1-10.
4. Blake, W. Rock Burst Research at the Galena Mine, Wallace, Idaho. BuMines TPR 39, 1971, 22 pp.
5. Blake, W., F. Leighton, and W. Duvall. Microseismic Techniques for Monitoring the Behavior of Rock Structures. BuMines B 665, 1974, 65 pp.
6. Boler, F. M., and P. L. Swanson. Computer-Automated Measurement- and Control-Based Workstation for Microseismic and Acoustic Emission Research. BuMines IC 9262, 1990, 9 pp.
7. Bush, D. D., W. Blake, and M. P. Board. Evaluation and Demonstration of Underhand Stoping to Control Rock Bursts (contract H0292013, Terra Tek, Inc.). BuMines OFR 62-85, 1982, 191 pp.; NTIS PB 85-216489/XAB.
8. Coughlin, J. P., and C. D. Sines. Field Trials of a Portable Microseismic Processor Recorder. BuMines IC 9022, 1985, 8 pp.
9. Estey, L. H., P. L. Swanson, F. M. Boler, and S. F. Billington. Microseismic Source Locations: A Test of Faith. Paper in Rock Mechanics Contributions and Challenges: Proceedings of the 31st U.S. Symposium, ed. by W. A Hustrulid and G. A Johnson (CO Sch. Mines, Golden, CO, June 18-20, 1990). A A Balkema, 1990, pp. 939-946.
10. Full, R. P. Structural Relations North of the Osburn Fault, Coeur d'Alene District, Shoshone County, Idaho. M.S. Thesis, Univ. ID, Moscow, ID, 1955, 35 pp.
11. Gay, N. C., D. Spencer, J. J. Van Wyk, and P. K. van der Heever. The Control of Geological and Mining Parameters in the Klerksdorp Gold Mining District. Paper in Rockbursts and Seismicity in Mines. S. Afr. Inst. Min. and Metall., Symp. Series No.6, Johannesburg, S. Afr., 1984, pp. 107-120.
12. Gay, N. C., and P. K. van der Heever. In Situ Stresses in the Klerksdorp Gold Mining District, South Africa-A Correlation Between Geological Structure and Seismicity. Paper in Issues in Rock Mechanics, Proceedings, Twenty-Third Symposium on Rock Mechanics, ed. by R. R. Goodman and F. E. Heuze (Univ. CA, Berkeley, CA, Aug. 25-27, 1982). Soc. Min. Eng., 1982, pp. 176-182.
13. Gitlin, E. C. Wall Rock Chemistry of the Lucky Friday Mine, Shoshone County, Idaho. M.S. Thesis, Univ. WA, Seattle, WA, 1986, 176 pp.
14. Gresseth, E. W. Determination of Principal Stress Directions Through and Analysis of Rock Joint and Fracture Onentalions, Star Mine, Burke, Idaho. BuMines RI 6413, 1964, 43 pp.
15. Gresseth, E. W., and R. R. Reid. A Petrofabric Study of Tectonic and Mining-Induced Deformations in a Deep Mine. BuMines RI 7173, 1968,64 pp.
16. Hauntz, C. E. Disseminated Sulfide Minerals (Blue Rock) in the Revett Formation, Lucky Fliday Mine, Mullan, Idaho. M.S. Thesis, Univ. ID, Moscow, ID, 1982,82 pp.
17. Jenkins, F. M., T. J. Williams, and C. J. Wideman. Rock Burst Mechanism Studies at the Lucky Friday Mine. Paper in Rock Mechanics Contributions and Challenges: Proceedings of the 31st U.S. Symposium, ed. by W. A Hustrulid and G. A Johnson (CO Sch. Mines, Golden, CO, June 18-20, 1990). A A Balkema, 1990, pp. 955-962.
18. Johnston, J. C., and H. H. Einstein. A Survey of Mining Associated Seismicity. Paper in Proceedings of the 2nd International Symposium on Rockbursts and Seismicity in Mines: Rockbursts and Seismicity in Mines, ed. by C. Fairhurst (Univ. MN, Minneapolis, MN, 1988). A A Balkema, 1990, pp. 121-127.
19. Leighton, F. A Case History of a Major Rock Burst. BuMines RI 8701, 1982, 14 pp.
20. Leighton, F., and W. Blake. Rock Noise Source Location Techniques. BuMines RI 7432, 1970, 18 pp.
21. Lenhardt, W. A Some Observations Regarding the Influence of Geology on Mining-Induced Seismicity at Western Deep Levels, Ltd. Ch. in Rock Mechanics in Africa. Int. Soc. for Rock Mech., S. Afr. Natl. Group, 1988, pp. 45-48.
22. McLaughlin, W. c., G. G. Waddell, and J. G. McCaslin. Seismic Equipment Used in Rock-Burst Control in the Coeur d'Alene Mining District, Idaho. BuMines RI 8138, 1976, 29 pp.
23. McMahon, T. Rock Burst Research and the Coeur d'Alene District. BuMines IC 9186, 1988, 45 pp.
24. McWilliams, P. c., M. M. McDonald, and F. M. Jenkins. Statistical Analysis of a Microseismic Field Data Set. Preprints, Second International Symposium on Rockbursts and Seismicity in Mines, 1988. A A Balkema, pp. 235-245.
25. Obert, L. Measurement of Pressures on Rock PilIal'S in Underground Mines, Part II. BuMines RI 3521, 1940, 11 pp.
26. __ . Use of Sub audible Noises for Prediction of Rock Bursts. BuMines RI 3555, 1941, 4 pp.
27. Obert, L., and W. Duval. The Microseismic Method of Predicting Rock Failure in Underground Mining, Part I: General Method. BuMines RI 3797, 1945, 7 pp.
28. __ . The Microseismic Method of Predicting Rock Failure in Underground Mining, Part II: LaboratOlY Experiments. BuMines RI 3803, 1945, 14 pp.
29. __ . Use of Sub audible Noises for the Prediction of Rock Bursts, Part II: BuMines RI 3654, 1942, 22 pp.
30. Panek, L. A, and J. A Stock. Development of a Rock Stress Monitoring Station Based on the Flat Slot Method of Measuring Existing Rock Stres& BuMines RI 6537, 1964, 61 pp.
31. Pariseau, W. G., J. K. Whyatt, and T. J. McMahon. Rock Mechanics Investigations at the Lucky Friday Mine (In Three Parts): 3. Calibration and Validation of a Stope-Scale, Finite-Element Model. BuMines RI 9434, 1992, 16 pp.

r-, I I
32. Potgieter, G. J., and C. Roering. The Influence of Geology on the Mechanisms of Mining-Associated Seismicity in the Klerksdorp Goldfield. Paper in Rockbursts and Seismicity in Mines. S. Afr. Inst. Min. and Metall., Symp. Series No.6, Johannesburg, S. Afr., 1984, pp. 45-50.
33. Repsher, R C., and B. J. Steblay. Improved Monitoring Systems for Rock Noise Detection. BuMines Tech. News, No. 348, Aug. 1989, 2pp.
34. Riefenberg, J. S. A Simplex-Method-Based Algorithm for Determining the Source Location of Microseismic Events. BuMines RI 9287, 1989,12 pp.
35. __ . Statistical Evaluation and Time Series Analysis of Microseismicity, Mining, and Rock Bursts in a Hard-Rock Mine. BuMines RI 9379, 1991, 15 pp.
36. Rorke, A. J., and C. Roering. Source Mechanism Studies of MineInduced Seismic Events in a Deep-Level Gold Mine. Paper in Rockbursts and Seismicity in Mines. S. Afr. lnst. Min. and Metall., Symp. Series No.6, Johannesburg, S. Afr., 1984, pp. 51-55.
37. Scott, D. F. A Geolaser for Mapping Planar Geologic Features in Deep Underground Mines. BuMines Tech. News, No. 358, Apr. 1990, 2pp.
38. __ Relationship of Geologic Features to Seismic Events, Lucky Friday Mine, Mullan, Idaho. Paper in Proceedings of the 2nd International Symposium on Rockbursts and Seismicity in Mines: Rockbursts and Seismicity in Mines, ed. by C. Fairhurst (Univ. MN, Minneapolis, MN, June 8-10, 1988). A. A. Balkema, 1990, pp. 401-405.
39. Shepherd, J., R L. Blackwood, and L. K. Rlxon. Instantaneous Outbursts of Coal and Gas With Reference to Geological Structures and Lateral Stresses in Collieries. Paper in Rockbursts and Seismicity in Mines. S. Afr. Inst. Min. and Metall., Symp. Series No.6, Johannesburg, S. Afr., 1984, pp. 97-106.
40. Stateham, R M., and J. S. Vanderpool. Microseismic and Displacement Investigations in an Unstable Slope. BuMines RI 7470, 1971, 22 pp.
41. Steblay, B. J., B. T. Brady, and E. E. Hollop. A Networked Minewide Microseismic Rock Burst Monitoring System. Paper in Future Trends and Expectations. 14th World Min. Congr. (Beijing, China, May 14-18, 1990). Pergamon, pp. 861-867.
42. Steblay, B. J., T. J. Swendseid, and B. T. Brady. Innovative Microseismic Rock Burst Monitoring System. Paper in Proceedings of the 2nd International Symposium on Rockbursts and Seismicity in Mines:
17
Rockbursts and Seismicity in Mines, ed. by C. Fairhurst (Univ. MN, Minneapolis, MN, June 8-10, 1988). A. A. Balkema, 1990, pp. 259-262.
43. Swanson, P. L. Mining-Induced Seismicity (M 2-3) and Rock Bursting in the Faulted Geologic Structure of the Coeur D'Alene District, Idaho. Paper in Rock Mechanics: Proceedings of the 33rd U.S. Symposium, ed. by J. R Tillerson and W. R Wawel'sik (Santa Fe, NM, June 3-5, 1992). A. A. Balkema, p. 124.
44. Swanson, P. L., and F. M. Boler. Application of AE/MS Waveform Analysis to Hazard Detection, Evaluation, and Control in Underground Mining. Paper in Progress in Acoustic Emission IV: Proceedings of the 9th International Acoustic Emission Symposium (Kobe, Japan, 1988). Jpn. Soc. Nondestr. Insp., 1988, pp. 303-310.
45. Swanson, P. L., L. H. Estey, F. M. Boler, and S. F. Billington. Accuracy and Precision of Microseismic Event Locations in Rock Burst Research Studies. BuMines RI 9395, 1992, 40 pp.
46. Thrush, P. W. (ed.). A Dictionary of Mining, Mineral, and Related Terms. U.S. Bureau of Mines, Washington, DC, 1968, 1269 pp.
47. Van der Heever, P. The Influence of Geological Structure on Seismicity and Rockbursts in the Klerksdorp Goldfield. M.S. Thesis, Rand Afrikaans Univ., 1982, 169 pp.
48. Whyatt, J. K., and M. P. Board. A Strain-Softening Model for Representing Shear Fracture in Continuous Rock Masses. Paper in Proceedings of the 2nd International Symposium on Rockbursts and Seismicity in Mines: Rockbursts and Seismicity in Mines, ed. by C. Fairhurst (Univ. MN, Minneapolis, MN, June 8-10, 1988). A. A. Balkema, 1990, pp.61-64.
49. Whyatt, J. K., T. J. Williams, and M. P. Board. Rock Mechanics Investigations at the Lucky Friday Mine (In Three Parts): 2. Evaluation of Underhand Backfill Practice for Rock Burst Control. BuMines RI 9433, 1992, 10 pp.
50. Williams, T. J., and D. J. Cuvelier. Report on a Field Trial of an Underhand Longwall Mining Method to Alleviate Rockburst Hazards. Paper in Proceedings of the 2nd International Symposium on Rockbursts and Seismicity in Mines: Rockbursts and Seismicity in Mines, ed. by C. Fairhurst (Univ. MN, Minneapolis, MN, June 8-10, 1988). A. A. Balkema, 1990, pp. 349-353.
51. Williams, T. J., J. K. Whyatt, and M. E. Poad. Rock Mechanics Investigations at the Lucky Friday Mine (In Three Parts): 1. Instrumentation of an Experimental Underhand Longwall Stope. BuMines RI 9432, 1992, 26 pp.
~:'
L ,
i.
18
APPENDIX
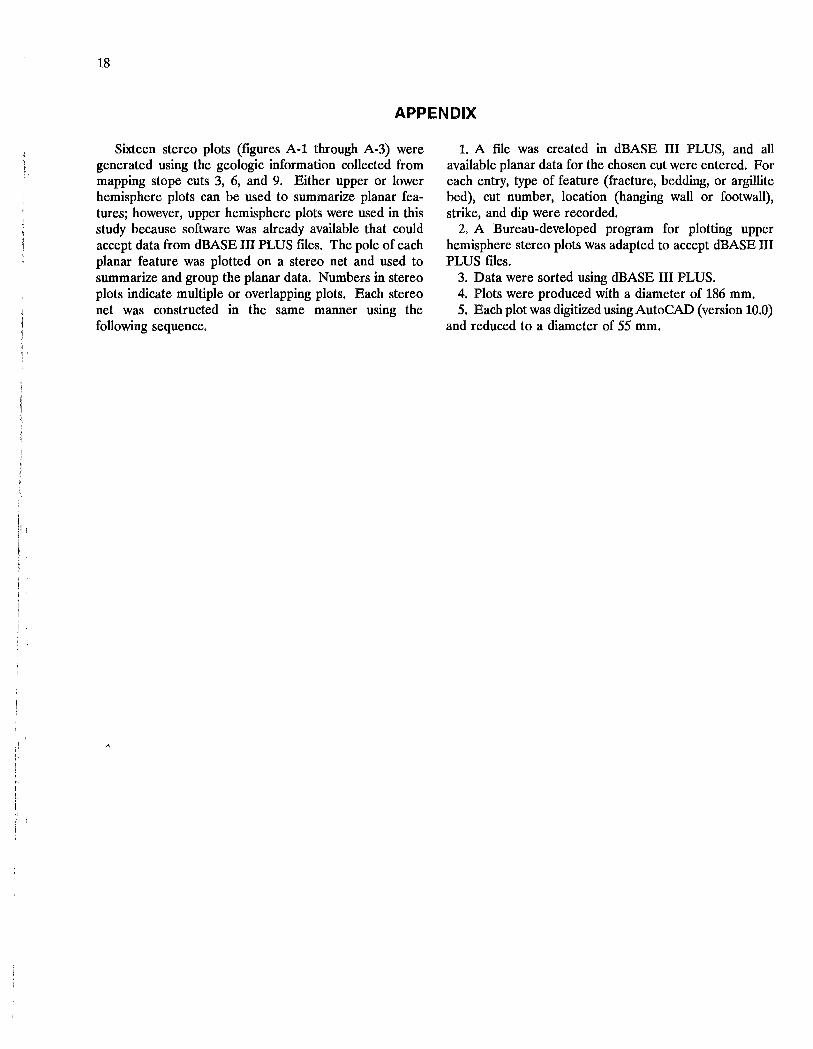
Sixteen stereo plots (figures A-1 through A-3) were generated using the geologic information collected from mapping stope cuts 3, 6, and 9. Either upper or lower hemisphere plots can be used to summarize planar features; however, upper hemisphere plots were used in this study because software was already available that could accept data from dBASE III PLUS files. The pole of each planar feature was plotted on a stereo net and used to summarize and group the planar data. Numbers in stereo plots indicate multiple or overlapping plots. Each stereo net was constructed in the same manner using the following sequence.
1. A file was created in dBASE III PLUS, and all available planar data for the chosen cut were entered. For each entry, type of feature (fracture, bedding, or argillite bed), cut number, location (hanging wall or footwall), strike, and dip were recorded.
2. A Bureau-developed program for plotting upper hemisphere stereo plots was adapted to accept dBASE III PLUS files.
3. Data were sorted using dBASE III PLUS. 4. Plots were produced with a diameter of 186 mm. 5. Each plot was digitized using AutoCAD (version 10.0)
and reduced to a diameter of 55 mm.

r I
NE strike NWdip
A
C
NE strike NWdip
E
•
N
N
•
,
N
•
•
NW strike NEdip
NE strike SEdip
NW strike NEdip
NE strike SEdip
NW strike NEdip
NE strike SEdip
NE strike NWdip
B
D
NE strike NWdip
NW strike SWdip
F
NE strike NWdip
•
•
•
N
N
N
•
NW strike NEdip
NE strike SEdip
NW strike NEdip
NE strike SEdip
NW strike NEdip
NE strike SEdip
Figure A-1.-Stereo plots of fractures., A,' Fractures In hanging wall, third cut; B, fractures In footwall, third cut; C, fractures In hanging wall, sixth cut; D, fra,ctures In footwall, sixth cut; E, fractures In hanging wall, ninth cut; F, fractures In footwall, ninth cut.
19
!
:1 : , ,
:11
20
A
NE strike NWdip
NW strike SWdip
C
NE strike NWdip
NW strike SWdip
NE strike NWdip
E
NWstrlke SWdip
N
N
•
N
•
• •
NW strike NEdip
NE strike SEdip
NW strike NEdip
NE strike SEdip
NW strike NEdip
NE strike SEdip
NE strike NWdip
B
NW strike SWdip
D
NE strike NWdip
NW strike SWdip
F
NE strike NWdip
NW strike SWdip
N
•
N
N
• •
•
• •
• • •
•
NWstrike NEdip
NE strike SEdip
NW strike NEdip
NE strike SEdip
NW strike NEdip
NE strike SEdip
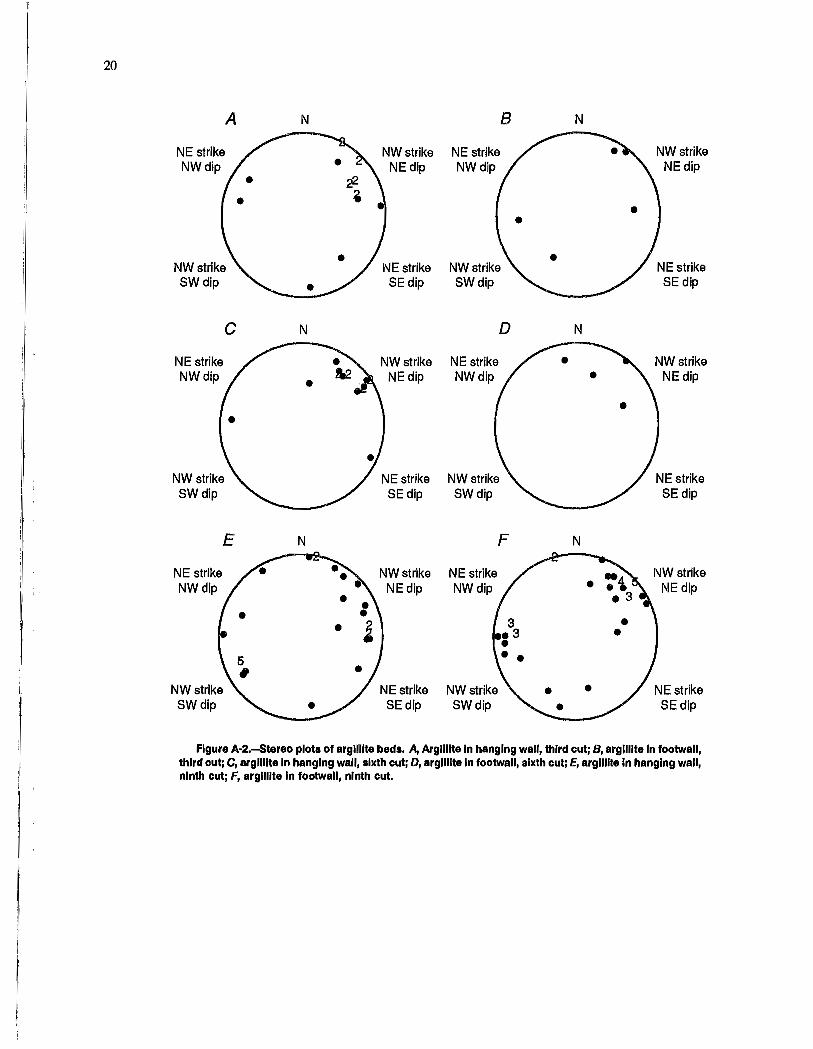
Figure A-2.-Stereo plots of argillite beds. A, Argillite In hanging wall, third cut; e, argillite In footwall, third cut; C, argillite In hanging wall, sixth cut; D, argillite In footwall, sixth cut; E, argillite In hanging wall, ninth cut; F, argillite In footwall, ninth cut.

T i
21
A N B N
NW strike NE strike NW strike NEdip NWdip NEdip
• •
• • NE strike • NE strike SE dip SEdip
C N D N
NE strike NW strike NE strike NW strike NWdip NEdip NWdip NEdip ,
• • • • NE strike • • NE strike
SEdip SEdip
Figure A-3.-Stereo plots of fractures and argillite beds In third, sixth, and ninth cuts. A, Fractures in hanging wall; B, fractures In footwall; C, argillite In hanging wall; D, argillite In footwall.
INr.nu.OF MINES,PGH.,PA 29776
'U.S.G.P.O.: 1993--709-008/80018