geohydrology of the aquifer supplying ames, iowa
TRANSCRIPT
Retrospective Theses and Dissertations Iowa State University Capstones, Theses andDissertations
1963
Geohydrology of the aquifer supplying Ames, IowaLee Bower BacksenIowa State University
Follow this and additional works at: https://lib.dr.iastate.edu/rtd
Part of the Geology Commons, and the Hydrology Commons
This Thesis is brought to you for free and open access by the Iowa State University Capstones, Theses and Dissertations at Iowa State University DigitalRepository. It has been accepted for inclusion in Retrospective Theses and Dissertations by an authorized administrator of Iowa State University DigitalRepository. For more information, please contact [email protected].
Recommended CitationBacksen, Lee Bower, "Geohydrology of the aquifer supplying Ames, Iowa" (1963). Retrospective Theses and Dissertations. 16681.https://lib.dr.iastate.edu/rtd/16681
GEOH!DROLOOY OF THE AQUIFER. SUPPLYING AMES, I(lfA
by
Lee BOl'1er Backsen
A Thesis Submitted to the
Graduate Faculty in Partial Fuli'illment of'
The Requirements tor the Degree ot
MASTEROF' SCIENCE
Major Subject: Geology
Signatures have been redacted for privacy
IO\'/4 sta.te University or Science and Technology
Ames, Iowa
1963
ii
TABLE OF CWTEtlTS
Page
INTRODUCTIat 1
GEOLOGY 10
GRaJND WATER mDRAULICS 19
WATER LEVEL FLUCTUATIGlS 45
1-1OVEMENT OF WATER 51
DISCHARGE 52
RECHARGE 54
SUl·!MARY AND CWCLUSIQiS 55
SUGGESTICHS FOR FUTURE STUDY 57
SELECTED BIBLI<.XlR!PHY 59
ACKNCl'ILEDGEMEtfrS 62
APPENDIX 63
1
INTRODUCTICN
This paper presents the results of a. geohydrologic investi
gation conducted for the Cit,. ot Ames, Iowa, by the Geology
Department of Iowa. state University. A geohydrologic investigation
attempts to determine 8lld document the occurrence, distribution,
and movement of the ground. water within a particular area or
subsurface zone, based on observed geologic and hydrologic data.
Statement of the Problem and Purpose of the study
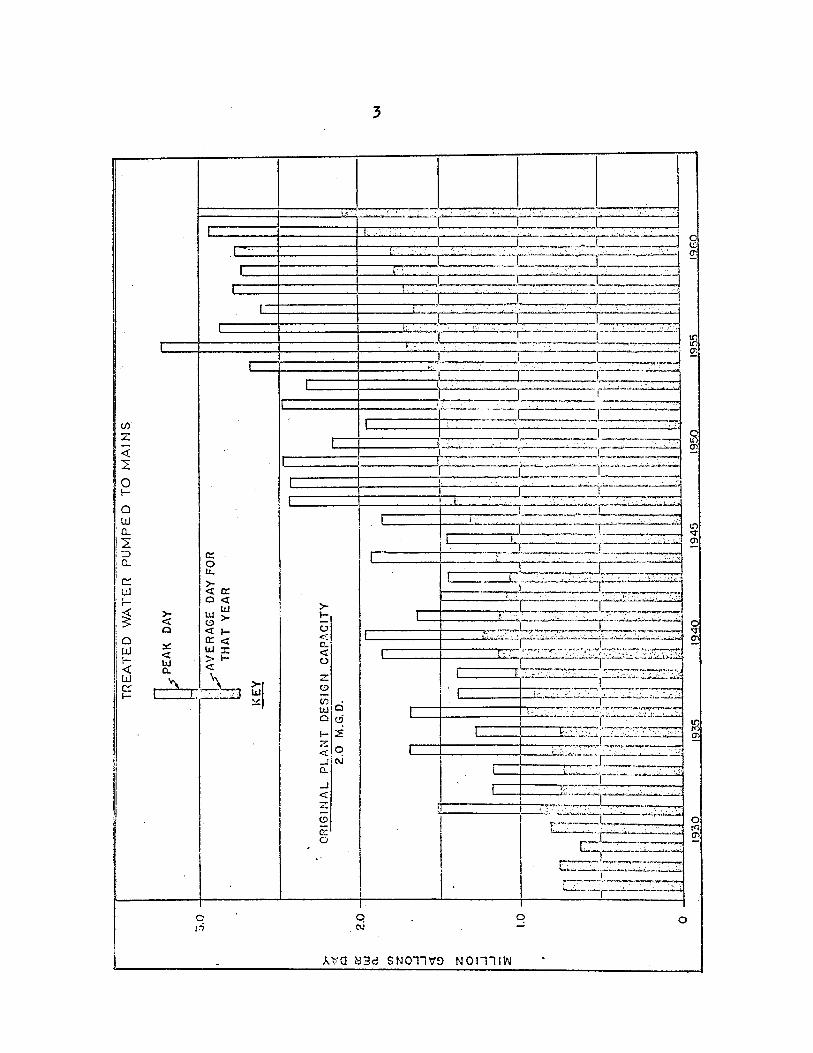
This study was initiated because the Municipal Water Treatment
Plant ot Ames, Iowa, did not have sufficient geologie and hydrolOgic
data available to determine the water producing capabilities of
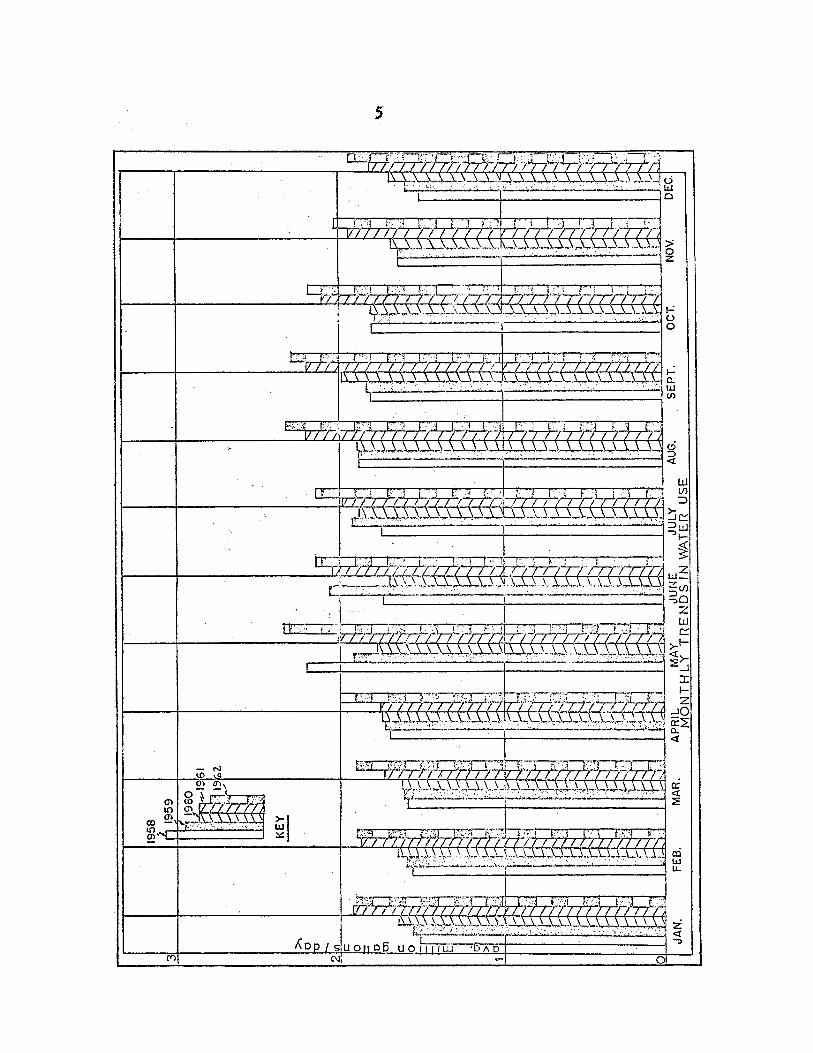
the aquifer. It i8 evident from the increase in demand on the
Treatment Plant (Figures 1 and 2), that increasing withdrawls are
being imposed on the sand and gravel aquifer supplying the City.
Basic data a.bout the aqui!er are needed to provide a. foundation for
future water supp~ planning in Ames.
The specific purpose of the study is to provide basic geologic ~ .
and hydrologic data abput the aquifer suppl:ying the City. Geologic
data provided. are areal extent and lateral variation ot the aquifer
and its relationship to bedrock (first consolidated rock beneath
Pleistocene drift) configuration and to other Pleistocene deposits.

2
f-""'-
r T
RE
AT
ED
W
AT
ER
P
UM
PE
D
TO
M
Alt
-IS
> '~L o 0:: w
a.
(/) z :3 -I <t
(!)
Z o -I
-I :!
:;.0
, I
~ PEA
K
DA
Y
I.".l~ A
VERAGE~D~A~Y~F~O~R--------------------
~I~I------------~i~I----_1
u T
HA
T Y
EAR
.
I<E
Y
OR
IGIN
I\L
P
Lfl
.NT
D
ES
IGN
C
AP
/\C
ITY
2
.0
M.G
.D.
r-
.-1
11
11
11
11
11
11
11
1+
1--
2.0
.. +
.. _
"----+
t+-H
-H
-I
u II
111
-t+H+
tt-11
111 ,I
j:;j f'
-I 1'"1
rj fl n~
111
il
n
----1
''1
-
-'-m.l-l-
-·rnm .. -'l
:--:i-
. '~.tr ... !
-·T'.~
1.JLtJ
JJI.
Un! .!
l_
n I
-
'iii [I
i "
II ,III
I I
~ _1
II
III ~ j
II I li
lt iii
I I
La -
l tT
rrl!
II"
innrt!
inn ~
'1 q il rl
',l ,jl~t
/1n 11 r
r lt nn III
t ,
I '
I !
:.',.
~ [I
r! '
. f'
j ,.
[ r I
, ,
r!
r ! II
11
1
\ 'r
I 1
I ' t 1
I I
II i 1 !
W 111
11 i :II /! IJ
t II i i-I f 1
1! III I '1
UUi ! r 11
1111
1111
1111
11 I 1111
1 I,
ll III
'J1
fl I.i
!! (
1.1 rdl
Jl H
P ~.l ~
l fl!
i [: I f
I
"U,! I
I,
, '
lui U
' fU lu
i ilJ! \ll!
o ,~~
Uil
, .. ~lllU-,,·,·
I 1.
_ _
'-_"
l
.. ,--
19
30
19
35
19
40
1
94
5
1950
19
5.'5
19
(-;0
VI

4
3
1956
1959
Vt.-.l
19
6°1
9 161
·.··~1
1*2
\ ..
. L
.
;~I
KE
Y
JAN
. F
EB
. M
AR
. A
PR
IL
MA
Y
JUN
E
JUL
Y
AU
G.
SE
PT
. M
ON
TH
LY
T
RE
ND
S I
N W
AT
ER
U
SE
'VI:
6
~logic data determined are the coefficients of p~bUitYJ
tranndssibilit;r .. and8tor~, flOW' direcbicm. within the aquifer.
and di8char~eeharge 1l0000cea.
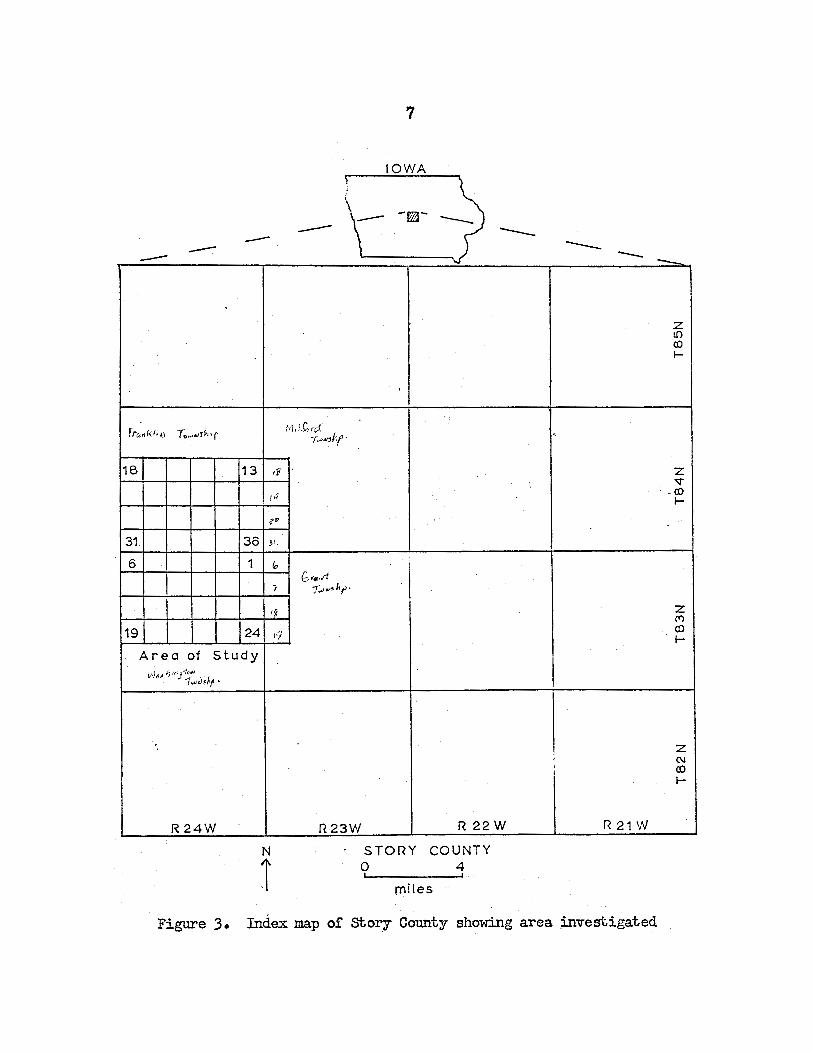
The area of' .-tudT 18 J.ocat,ed. m 1ife$t-ccntral. Story County,
lOlA (Figure 3), and ~~ft an ar.ot app:rmdmate~ SS Sq)lare
J.C.il.e1I. Incl.udecl in this are&J, are: $ecti.ons 13 throUgh. 36.
FranluitLtOWDlhip (Tequ R24W)J'seationa 1 thro~ 24~ Was~on
tOW'J'lSldp (i'83R Il24W}J seationslS,19,30, and 31, lW.tord
to'itJ1S1dp (TSlaN R2.3W) J am aect1ons6, 7" lS, and 19, Grantt t~
IJhip WI R23W).
The, area of' studr 18 Uilderltdn ,by' g1acialdr1fe of the
Des Moines Lobe, and, except along major drainage. the topo
graphy is the gentq rollmgsweU and ~ pattem. Reliet. on
tbistopographi~ youthf'ulsurlace. ~ 'doeS: not exCeed 50
feet' (wailic8 i961)~ ]1cNem'; ',aJ.ongtbe'lIlajor streams, '(S1tllnk'
'iavei-' in 'Ml.l.torct' and '~kl in' t~pftarid.' Sqlttut creek' 3n 'wash
~~ t~~) th~":i1etapPr.oa.chellOO teat.
, ' Principle ,at~ or'th. area" are '\he'.Sktmk 'River and its tribtltl17tSqUaw' creek., flle i38sternl!3 01 the area 11 'dr&1ned
7
IOWA
\- -r.:1j- ---- ------ ---- -- -.~
,
Z to CO I-
fra,,!{li,) 1..,.,1i-.· f f,.l,- J_~ I",i T",~Jt· <
1B 13 ,v z '¢
It! CO I-
te-
31 36 ~I.
6 1 (, I (::, ...... 1
1 '1"""$1."
I~ Z ('")
19 24 VI CO I-
Area of Study ~f;J A? ?; 1('/;Jt1!1#
... -r~ltj!~1 •
Z , (\J
CO I-
R24W R23W R 22W R 21 W
N S TORY COUNTY
1 o 4 I I
miles
Figure 3. Index map of story County showing area ~vestigated
s
1>7 the Skunk River and the westem 2/3 by' Squaw Creek and ita tri-
btdia;riesl anon Oreek, Clear Oreek, College Creek, and Werle Creek.
1'h8 Skunk River flows southwest. to section 23, Frankl,in town-o
ship, then makes apprax:Jmate:q- a. 90 bend to the southeast'. It is
joined. hi' Squaw Creek, lIhieh flows southeast, in sectiQn 12,
Wa~on townohip. 1'he tributaries ot Squaw Creek generallT
now frca the southwest to the northeast.
Method ot Investigation
l:be investigation was divided into· two phases, geologic and
llJdrologic. Each lDain ph ..... subdivided mto various methods and
technique. :in the actual study • .As the ground~er hydrology is
directlT dependent on the geology of the area.. the geolOgic phase
was underttaken firsh.
The geologic phase conaistfJ 6ft (1) literi.tUl"e reY'iew Oll
tJIe geology I.IJ.4 water rctlOUl"CetJ··o.r"st6q County. (2) collection
of driller'.. logS ct· e::18tiDg welle aM' teat holes in the area,
(3) eurvey' of' farm wells in th~ &rea to obta1n additional 1nf'or-
.mation abotdi the st;ratigraphy; (4) placing the logs, well con
struction data, and pumping records on per.manenh tile; (5) field
investigations ot Pleist.ocene outcrops, and (6) a drjlling pro
gram of teat· holea in areas of poor control using a rotar,y drill.
The h1drologic phase conaishs ct: (1) collecting and
recording statio water level elevations tor the aquiterJ (2) study
of' piezometric surface tlucliuatiOll8 indicated by the United states
9
Geological· SUrtte7 aut;omatic· stage recorder located. :in an aban
doned Cit7 well completed in t,be aquifer J (3) conduction of a
pumping test on Cit,. well 7, and. (4) reJ.a.tingprccipitatian,
floods, . and pumpage. ;records to the changes in atat1c ',i3terlevel.
The data. and concl.tt$ions trom. the two· phases are used. to
determine the discharge am recharge sources: ot tbe aquiter.
10
Introduction
To correct~ ~e the geohydrol.ogic character ot an
aquifer, the stratigraphy relating to the aquifer must be iden
tified and describe4.
The geologic problem in the area is to describe the relation
ship of the Pleistocene stratigraphy' and the bedrock surface to
the aquif'er.
During the course ot the present. investigation, the author
utilized apprax:ima.te:q lS; driller's logs of water wells and test
holes. These logs came fram. the fUes of the Iowa Geological
Survq, Layne-Western DrHling Company of Ames, Thorpe Dr:i l1ing
Company of Des Moines, Cryder Well Dri.ll.ing Company ot Boone,
larson Drilling Company of' Roland, and the Iowa. Highw~ Commis
sion, Ames. Test holes were drilled, in areas of' poor control,
during the course of the investigation. The locations of the
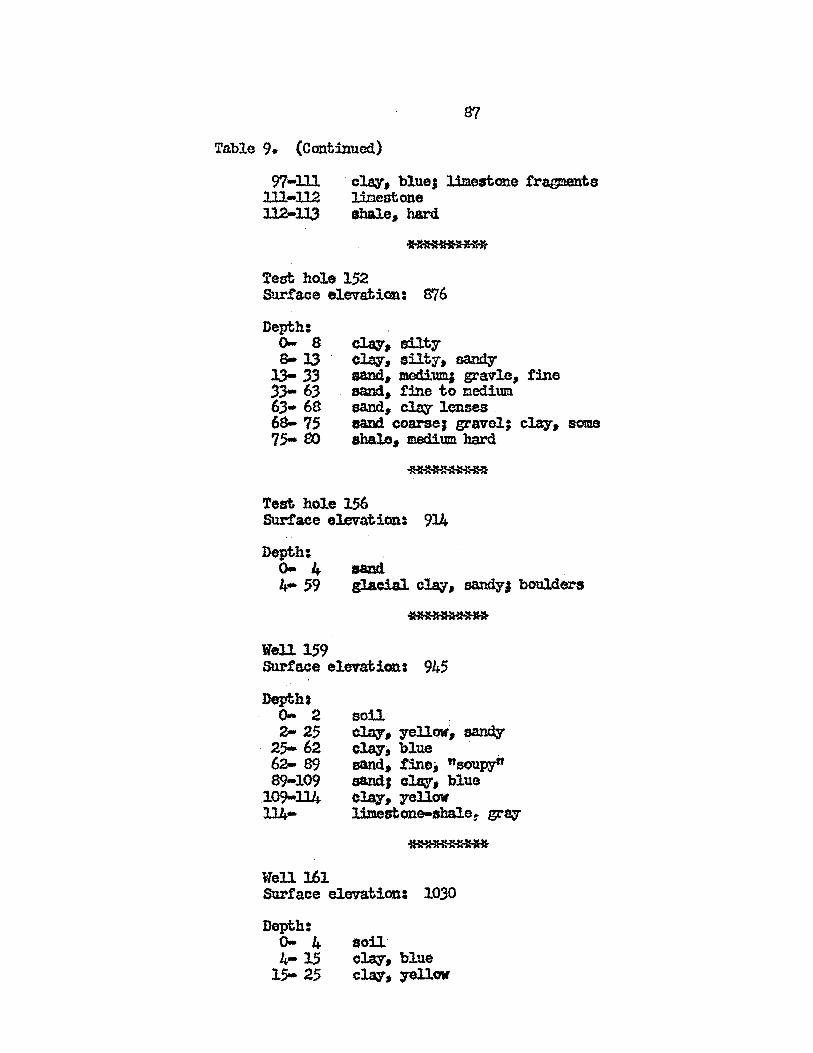
wells and test holes are shown on the map, Figure 12.
The well number refers to the well log fUe ot this report.
This log rUe will be ava.U.able at the Geology Department;, 10.18
state University. and the Municipal liater Treatmerdi Plant, Ames,
IOlrTa. The logs used in preparation of the Panel Diagram, Figure
14, are J.:1.sted in Table 9.
11
Bedrock Geology
The area of this investigation is included in Zimmerman t s
Bedrock. Geology of storz Countz (1952). Zimmerman investigated
the western bal.t' of st.ory County-, with special emphasis on
stratigraphy', structure, and. drainage.
The indurated rocks underlJing the Pleistocene in this area
are part ot the Pennsylvanian and Mississippian systems. The
Penn.a:rlvan1an rocks are present under the drif't . except along the
crest. of the northeast-soutbwest trending anticline which e1Wt'
tems trom the Boone Count,. line, in the northwest comer of T.
83 I., R. 24 \,1., trending approxima.te~ R 590 E to the southeast
corner of T. 84 U., R. 24 W., then appro:xima.te~ N' 31° E out of
the preseJ1t area (Zimmerman 1952). The portion of the anticline
which falls 'Within the present investigation was called by Zimmerman
the nAmes highn.
Dedrogk configuration
Zimmerman discusses the pre-P1eistocene (?) drainage and
presents a bedrock contour map of story County and a detailed map
of the Ames area (Zimmerman 1952, plates 4. and 5). He indicates
that the pre-Pleistocene (1) valleys, under~ Squaw Creek and.
the Skunk River valle:ys, have a relief of about 200 feet, and . .
near Ames, the bedrock valleys under both streams have about the
same configuration.
12
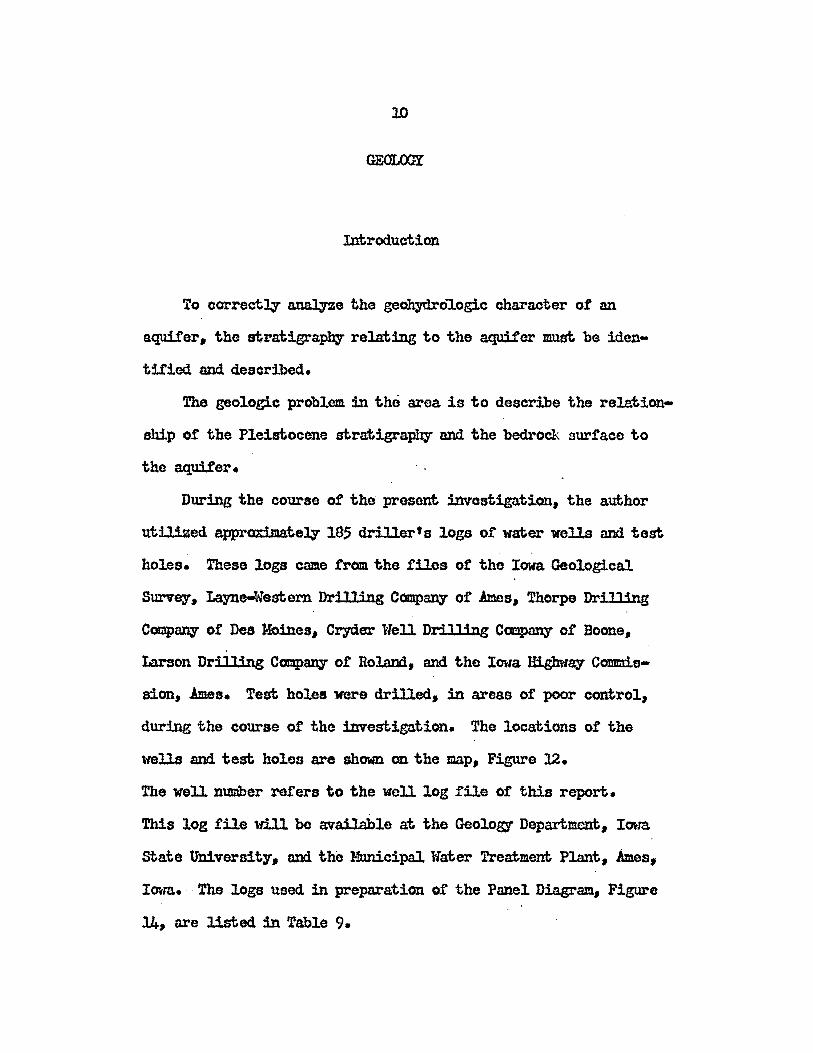
The author, in relating the a.quifer to the bedrock surtace,
has prepared a contour map of the bedrock configuration (Figure 13)
within the area. Figure 13 indicates that the bottom of the bedrock
valle,. under Squaw Creek has a lower elevation than the bottom. ot the
bedrock valle,. under the Skunk River. Ha:x:i:m.um relief in the pre
Pleistocene (?) valley UDder Squaw Creek is a.pproximately 180 feet,
whereas, maximum. relief in the pre-Pleistocene (7) valley under the
Skunk River is about 100 feet.; This would: indicate, it the two valleys
are the same age, then the bedrock va1.1.ey under the Skunk River had
a very steep gradient immediateq upstream from the confluence with
the valle,. under Squaw Creek. However, it seems unlikely that this
steep gradient would have existed and that, more probably, the valley
under the Skunk River is younger than the bedrock valley under Squa.w
Creek.
Zimmerman points out that much of the modern drainage
close4r follOW'S the pre-Pleistocene (7) valleys. The author has
noted that this is true in the northernha.l.! of the present areas,
but that, south of Ames, the deepe.st part of the pre-Pleistocene (?)
valley is vest of the present Skunk River flood. plain.
Another exception to close correspondence ot present drain
age to pre-Pleistocene (7) villeys, is in the NE ~, section 23, _ •.
T. 84 N., R. 24 w. Here the Skunk River flows southeast of the
bedrock channel and appears to have isolated the small area
enclosed by the 900 toot contour, in the SE *, section 14 and.
the NE i, section 23, T. 84 H., R. 24 W. (Figure 13).
Pleistocene Geology
j!revious ;j..nvgstigation§
In the Geol0pjl or Storr County, Beyer (l89Sa) describes the
Pleistocene series recognized at that time. Be describes a. younger
till, tuider1a.in by loess, and an older till under the loess. Beyer
interprets the sequence as lf1sconsin till, underlain by IOtlan (1)
loess, in tum underlain by Kansan till. This interpretation is
based on outcrops ot the sequence along the Skunk River in the north
east portion of the area and from outcrops along Clear Creek in
section 5, T. 8.3 !i., R. 24 W. Three well logs are presented which
also support the evidence or two tills separated by loess.
Beyer interprets the sands and gravels supplying Ames as being
gravel bars located at the conrluence ot the' Skunk River-Squaw. Creek
drainage system. Beyer presents evidence tor a buried bedrock valley
under Squaw Creek and links the buried alluvium in this villey ldth
the sands and gravels at the base ot the drift. These sands and
gravels were designated A.ft9Dian gravels •.
Simmons and Norton (1911) use data presented by Beyer (189&)
in their report on the underground. water of Story County. They also
interpret the source ot water at Ames to be gravel bars near the con
fluence or the Skunk River-Squaw Creek drainage system.. The sands
and gravels at the base of the Pleistocene in the northern portion
ot the area are related to the sources of the artesian
(tlcnd.ng) basins north of the arca. Mention was made of a
14
possible pre-glacial channel represented. in a well log in the
BE ;, section 5, T. 84 N., R. 24 W. The sands and gravels at the base
at the Pleistocene were 50 teet thick in this well log. This well
is located about 2 miles north ot the northwest corner ot the
area ot present investigation.
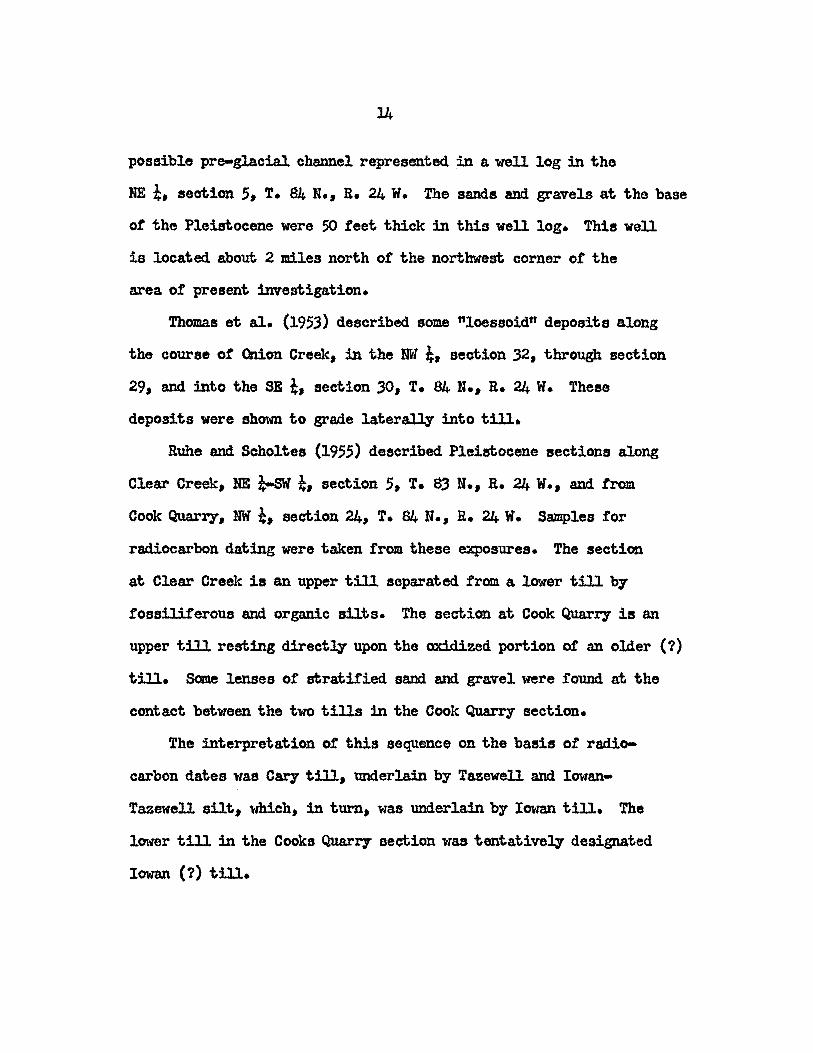
Thomas et ale (1953) described sou tlloessoid" deposits along
the course of Onion Creek, in the Nil ~, section 32, through section
29, and. into the SE !, section 30, T. 84 N., R. 24 W. These
deposits were shown to grade latera1l.y into till.
Rulla and Scholtes (1955) described Pleistocene sections along
Clear Creek, HE ~ k, section 5, T. 83 N., R. 24 W., and trom.
Cook Quarr;y, NW ;, section 24, T. B4 N., R. 24 W. Samples tor
radiocarbon dating were taken from these exposures. The section
at Clear Creek is an upper till separated. from. a. lower till by
fossiliferous and organic sUts. The section at Cook Quarr.r is an
upper till resting direct11' upon the oxidized portion or an older (?)
till. Some lenses ot stra.tified. sand and gravel were tound at the
contact between the two tills in the Cook Quarry section.
The interpretation of this sequence on the basis of radio
carbon dates was Cary till, underlain by Tazewell and Iowan
Tazewell sUt, which, in turn, was underlain by Iowan till. The
lower till in the Cooks Quarrr section was tentativelJr designated
Iowan (?) till.
15
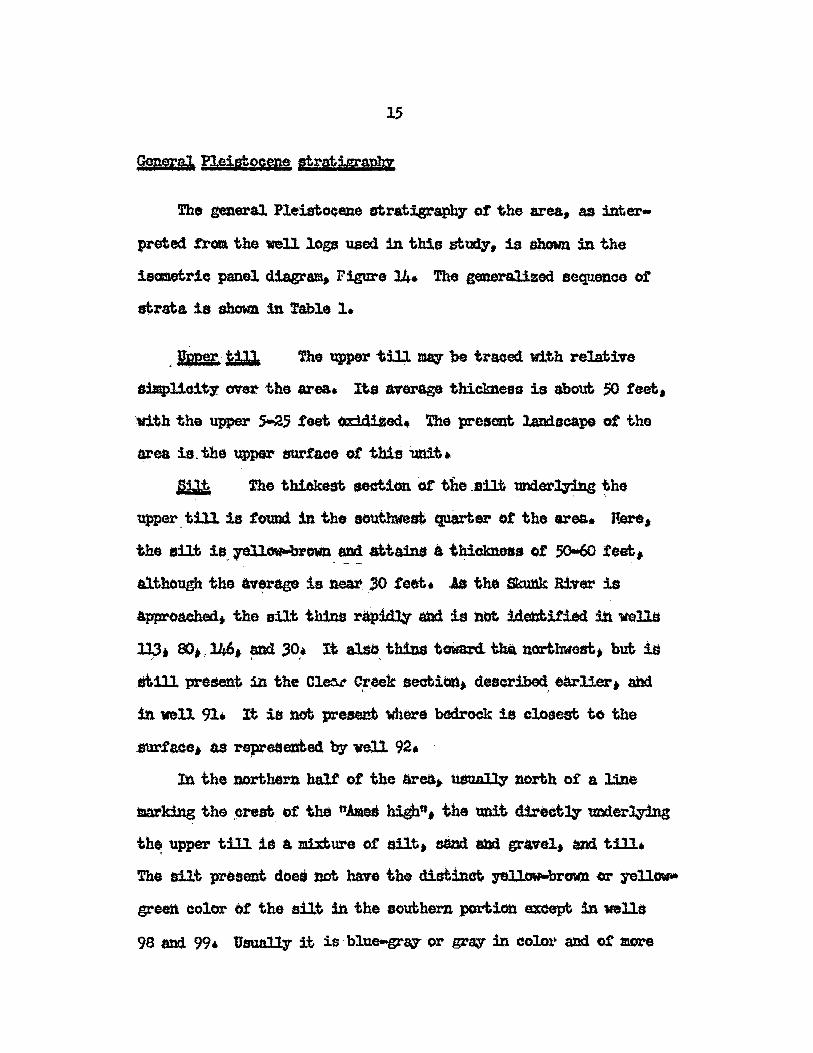
i'he general Pleistocene Gtrat1gr8.PhT of the area, as inter
preted tram the weUlogs used in this st~, is 8bGwn :in the
iscrnetrio panel diagram, Figure 14. The generalized sequence of
strata is ahcnm 1ft Table 1.
The upper till ma.y be traced with relative
.11Ilp11oit,- over the area.. Ita average thickness is about 50 teet t
with the upper 5-25 teet ox:1d' ~. The present J..a:odacape ot the
area is. the upper surface or this·1lt1it ..
~ The thickest section or the .aUt under~ ~he
upper, till is found in the S()utbwe. ~er of the area. Here,
the ailt ie, renow-brown and attaint\t A thickness or 50-60 teet; i
although the &vf:'l"age 18 ttea:I';SO feet. J# the Skunk B.1:ter 18
apprOllChedi the silt thina rap~ tmd. is hot 1d.entitiled in wellti
ll,3. 80., 146. ~ 30,' It al.Sb, tbitJa towarcl tbA nortb:w'eat. but; :1.$
tit.1ll pre$ettt ill the ~ Cr6ek seahi_. described ~liert and .<. "
1rl well 91. It is nob present tmm-e bedrock is cloaest to the
surface. as rGFeeteuted by well 92.
In the north~ half of the aret1. ~. north of a line
llSarking the ,crest, of the !lAaea high", the tlDit d1rectl¥ tmder~
th~ upper till 1$ a mi:x.ture ot aUt, sSlJd at\d gt'ave1. and till.
!he silt prebent doei not. have the distinct; 18l.low-brown or rellf.'J'tlflllo
gr'een color of the ailt 111 the southern portion e:x:cept, in _118
98 and. 99. tJsual.l.y it is blue-grqor grq in col.ol" and 01: more
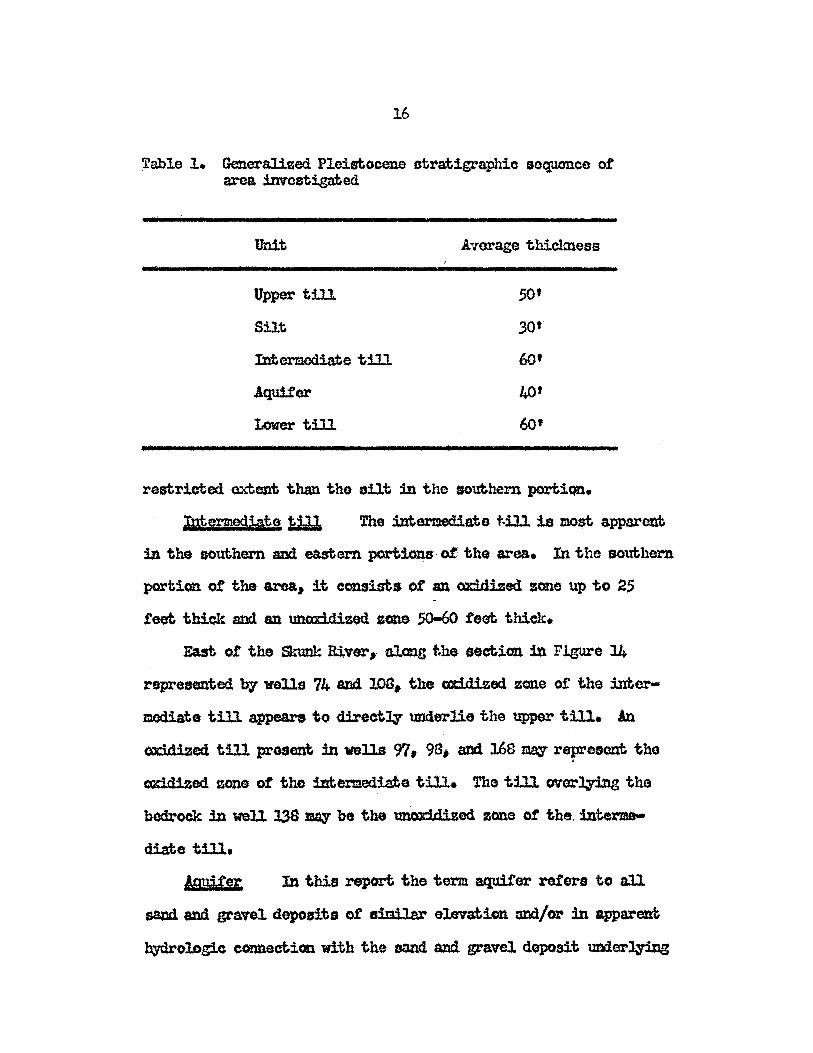
16
Table 1. Generalised Pleistocene stratigraphic soq.lOD.ce of' area invostigated
Unit Average thiokness • u'
Upper till 50'
SUt ,30'
Interaedia.te till 60·
Aquifer 40'
Lower till 60' -restricted extent than tho aUt :in tho 8o~hem port1~.
The :Intermediate t·ill is most apparent
in the southern and. eastern portioruJ· o! the area. In the southern
portion of the area .. it consists of' an ox:idjzed sane up to 25
teet thick and an unaxidized. lone 50-60 feel; thick.
East of the St."Utlk ru,ver.· along the section in Flgure 14
represented b7 wells 74 and lOS. the ox::tdized zone oi' the inter
mediate till appears to direct:q tm<ierlie the upper till. An
oxldized till present in nUs 97. 98. and 168 ll1a\Y represent the
oxidized zone of tho intermediate tw.. The till 0'1G1"J;ving the
bedrock :in well 138 ~ be t.he unmdiH sed zane or the, intel."2!e
diate till.
In this report the term aquti'e:r ratera to all
sam am. gravel deposita of simlar elevation and/or m apparent
hydrologic connection with the sand and gravel deposit 1lDier~
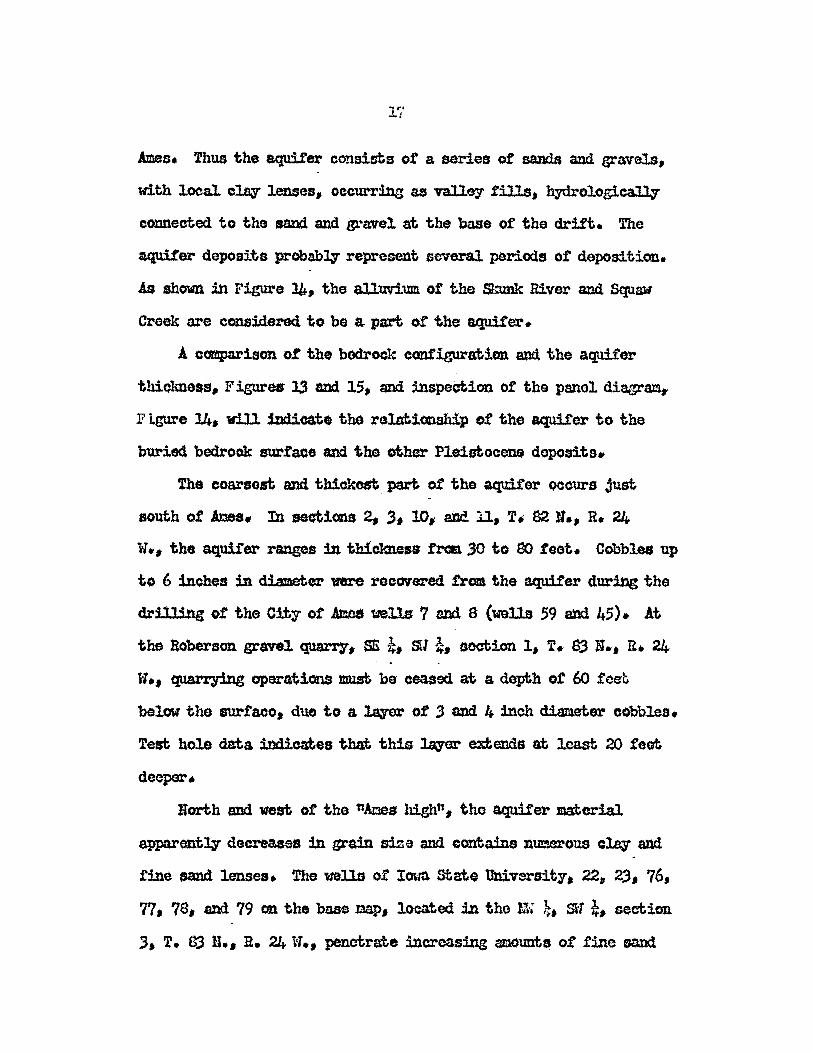
l'j'
!meG. Thus the aquifer consists or a series of sands and gz:-llvels,
nth local cJ.a.v lenses. occurrins as valley tills, hydrologicall.y'
connected to the sa.nd. and gravel at the base of the drift. The
aquifer deposits probabl,7 represent .several periods of deposition.
As shown in Figure lb.. the alluvium. of the Skunk River and Squaw
Creek are considered to be a part of the aquit'er.
! comparison of the bedrock configuration and. the a.quifer
thickness .. F!guru 13 and 15, and inspeCtion of the panel diagram,
F i.gure 14, will indicate thera~ionsIlip of the aquifer to the
buried bedrock surface and the other Ple1stocel].G deposits ..
The coarsest and thiokest part of the aquiter occurs just ,
south ot.l1aea. In sections 2, ,. 10$ ana. il, 1'. S2 I., R. 24
W .. " the aquifer ranges in th:1cknes" trcrA 30 to 00 feet. Cobbles up
to 6 !nebes in diameter were reCO'1ered from the aquit'er during the
dr:jl1ins of the City or ~uelJ.s: 7 and a (W9lls 59 atId 45). At.
the Roberson gravel quarry. SE ~, SI *. aeehion 1, 1'. 8.3 N., Il.. 24
V., quarry:ing operations must be ceaaed. at a depth of 60 fOEr~
below the surfaco, due to a :ta.ver ot 3 and 4 inch diameter cobbles.
Teat hole data indicates that this :l.Iqar extend.a 4t least 20 feet
deeper.
Uort;h and west or the ft!Des hightr, tho aquifer material
appa.rent~ decreases in grain s1ze and contains num.erous clq and
tine eand lenses. The lml.1e of Iowa state University. 226 2,3, 76,
77. 7S, and. 79 on the ba.ss map, located in tho E¥: k, Sf *. secrl;ion
3, T. B.3 !I., R. 24 W., penetrate increasing amoUlIlis ot fmc sand
1$
and cla\v throughout t.he £FAYe!.. . .
In sections 14, lS" 22 .. and. 23. T. S.3 B., !1. 24 W., the aquifer
is composed almosfi entirel;y of fine sand and fine gravel. It reta1:ns
a thi ckness of nearl;r 50 fe€rl#, but nar1:odl,y decreases in grain size.
The aquiter is overlain by relativel;y impermeable gl.acial till
or silt, except in wells <lrill.ed. m the Squaw Creek flood. plain
south ot wells 22 and 23, and in wells drilled in the Sh-unk River
flood. plain (Figure 14).
The aquifer rests on the buriC(i bedrock surface except within
the pre-Pleistoc~e (?) valley under Squaw Creek ¢figure 14) •. Here
the aquif'er rests on tho lower till.
D:l.recbl;y under the aquif'er is &. unit desig-
Dated as the.1mler till. !Io oxidized zone is identified, and the
till is apparentl;r confinod. to the bottom. of the bedrock valJ.c7
under Squaw Creek. It appears in the botitaa of the valley at the
southern edge of the area, :in wells l46 and SO. The average
thickness or this unit a.jJpears to be 60 feet, although wells along
tile eastern edge of the pre-Pleistocene (?) valle,. tmder Squaw
Creek penetrate up to 100 teet; of, ltb.a.t appears to be, the lower
till. rus unit was the oldest till found in the logs of' the area.
19
Introduction
'l.'b.e economic value of an a.qu:i.fer depends on its ability- to
transmit am to store water (Ferris 1962). Quant.itative imtes
tigations of aquifer. are ba.tJed. upon these two fundamental pro
porties, known respective:Q' as the coefficients of transmissi
bilityand Gtorage. In geohydrologio studies, principals of
ground-water ~cs are applied to field data to determine
these characteristics'.
Ground-wa.ter ~auliC8 is descr:ihed 1>7 Ferris (1962)
as the canbinationof' observed. data on water level fluctuations,
water 1evels. and natural or artif'icial discharges and recharges,
with equations or methcds of computation to tind the h3draulic
characteristics of the aquifer. As the physical nature of the . .
a.qu.ifer governs its hydrologic character, the fmaJ.. results must
be in accord With the observed geologic data. Thus, the results of
the ground-water hydraulics must not be accept.ed and used bl :iml)",
but taken ~ as additional. tools :in compiling the geob~(,lo6ic
picturo of the aquifer.
20
Coefficients of Permeability and Transmi ss1hUit:r
'the ~e ot the capacity of a formation to tr.QJl.Sm.i.t water
it; the COflf'ticie1'1t of permeability. P f/I The coefficient in general
use is def:1ned by the United states Geological Survey as the rate
Of now of water at 60° , in gall.ons/dq, through a crosa-aectiontll.
area of 1 square toot. UDder a 100% ~aulic gradient (1 tooti
per foot). Ja the temperature ratlge and water Viocosity in an
aquifer ia not large, it is usua:I.q Dotnecesaaq to adjuSt the
coefficient or permeabilit)" 'f'alue at field conditien8 to an
eqUiValent value at 600 P (Ferris 1962).
The cootticieni; of traJul'n:i.ssib:Uity, T, waS introduced. by
'l'heiS (193;)'. It ie takei1 as the rate 'of floW or water,. at, the .
ft· J - t
prevaiUng water temperature,. ;in g~/dq. through a vertical
strip of the aquifer 1 toot ~.exl;el'l<U'ng the full. ¢urated .
heiBht of the aquifer under i hydrauliC' g;-a.dient of l(l(1fo.
Esstm.tia.1.4r the coefficient of pertlC&.bilitY, P~' is the coefficient
of tranSm.i~sib:Uit)" .. T divided br the .atirated thickness, 111 or the
aquirer~
(l)
The coetficient of ~bilit,.. P t detol"mined in thi$ mmme:r is the
o.verage permeability of an ideal aqu,if'er which behave. lQ'drauU.caJ.li
l:Uce the aquiter under :Investigation (Ferrie 19(2).
21
Coefficient of storage
The coefficient of storage is defined as the volume of' water
the aquif'er releases from or takes Wo storage per unit surface
area of the aquifer per unit change in the component of head
normal to that surface (Ferris 1962).
The water released from or taken into storage, in an artesian
aquifer, in response to a change in head, is due solely to the com
pressibility of the aquifer material and. the water. Ferris (1962)
states that the volume of water (measured outside the aquifer) re
leased or stored, divided. by the product of the head change and the
area of the aquifer over 'Which it is effective, determines the
storage coefficient, S. Values ot this coefticient may range from
0.0001 to 0.001, although no set limits are proposed.
Determination of T and S
The Eloditied nonequilibrium fomu1.a. ot Theis was selected as
the quickest and most. straight-forward method of determination of
the coefficients oj transmissibility, T, and storage, S.
Most comprehensive works on Ground Water H;vdro10ltV.t such as
Todd (19.59), Jacob (19.50), and Ferris (1959 am. 1962), present
the matbematical derivation or the pumping test formulas. Since
these works are rea.di1y available, the derivations of' the fo:r.mulas
used in this paper will be presented only :in limited detail.
BasicaJ.:q pumping test .f'ormu.lD.s may be divided :into two types:
22
equilibrium and nonequilibrium.. The equillbrium form.ula. needs a
min:tmum of two cbs.nation points 8Dd must have the hydraulic eystem
in equilibrium. (no increase in drawdown with increase in time).
The nonequUibrium formula introduces time into the computation and
determines ! fram tho rate of change of drawdown with t:bne. ~
one obserration well, is needed (although more are very desirable),
and observations taken at the pumped well 'mq be used' for oem
putation of T.
Theis (19.35) first developed the nonequilibrium. formula. from
an analogy between gr:otmd-water flwand heat conduction. Jacob,
in 1940, directq derived the formula from. hydraulic concepts
(Jacob 1950).
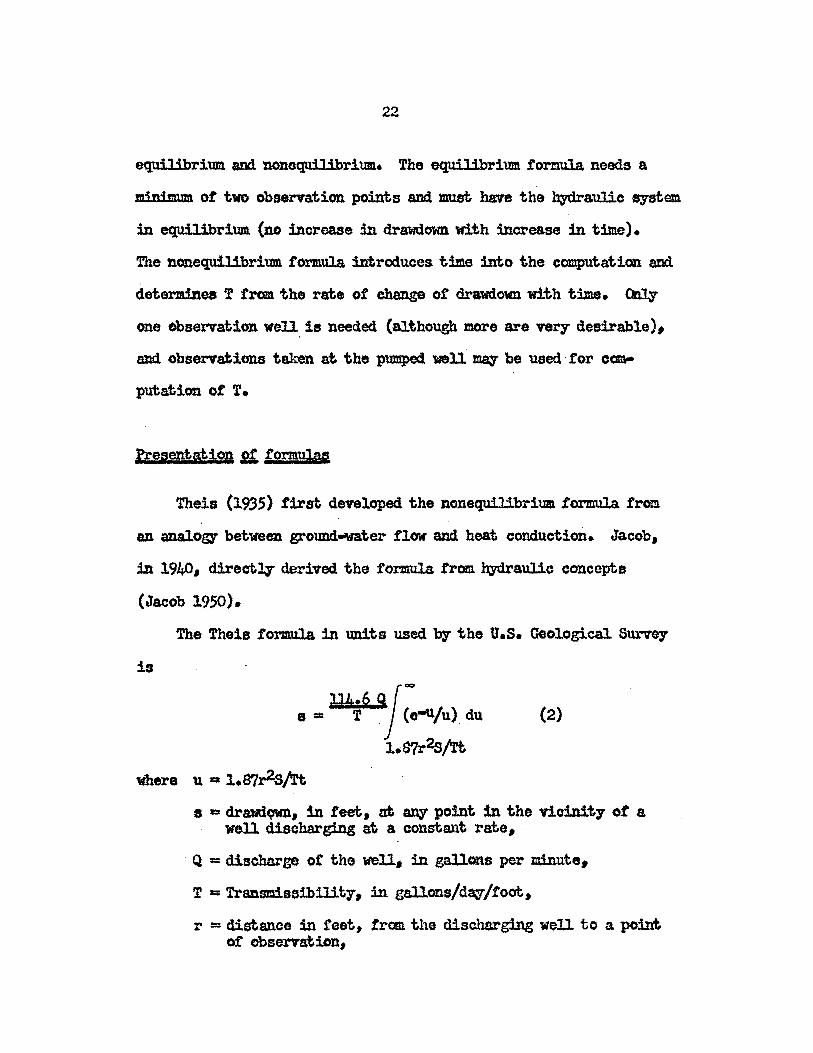
The Theia formula. in units used by the U.S. Geological Surv67
is
(2)
where u za 1.S7r2s/rt 8 = dravtlqwn, in feet. at any point in the viciDitl' of a
well discharging at a constant rate,
Q == discharge or the' well. in gallons per minute,
T = Transmissibility, in gsllons/d.a:s'/toot.
r = distance :in teet,. from the discharging well to a point of obsen-ation,
23
S :: storage Coefficient as a decimal fraction,
t 1: time, in days, since pumping started.
The nonequilibrium. formula. is ba.sed on the following assump
tions: (1) the aquifer is homogeneous and isotropic J (2) the a.qui£er
has infinite areal extent J (3) the discharge or recharge well
receives water from the entire saturated thickness of the aquiler;
(4) the coetticient or transmissibility is constant at all times
and places. (5) the water removed from st.orage is discharged
inst.a.ntaneously with decline in head, and, (6) the pumped well has
a reasonably small diameter campared with the ment of the
aquifer. For practioal purposes, the va.1ues obtained by app~
the formu.la.a to observed data are a close approximation to i
hydrologic characteristics of the aquifer.
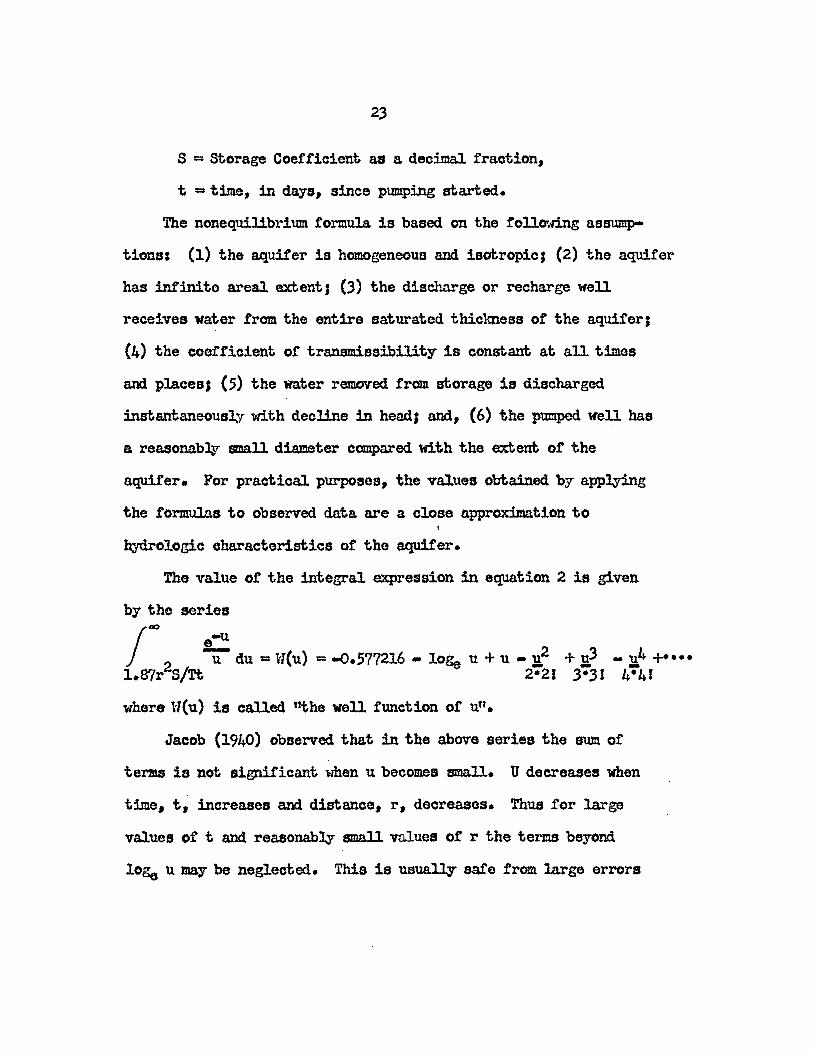
The va.1ue of the integral expression in equation 2 1s given
by the series
/- e-u
u du :: "l(u) :: -0.577216 - lo~ u + u - '};};.2 + JJ? _ '};};.4 + •••• 1.B7r2S}Tt 2·21 3-3J 4·41
where \-l(u) is called "the well funotion of un.
Jacob (1940) observed that in the above series the sum of
terms 1s not significant when u becomes sma.ll_ U decreases 'When
time, t, increases and distance, r, decreases. Thus for large
values of t and reasonably small values of r the terms beyond.
lo8e, u may be neglected. This is usua~ safe from. large errors
when values of u are less than 0.01 (Todd 1959).
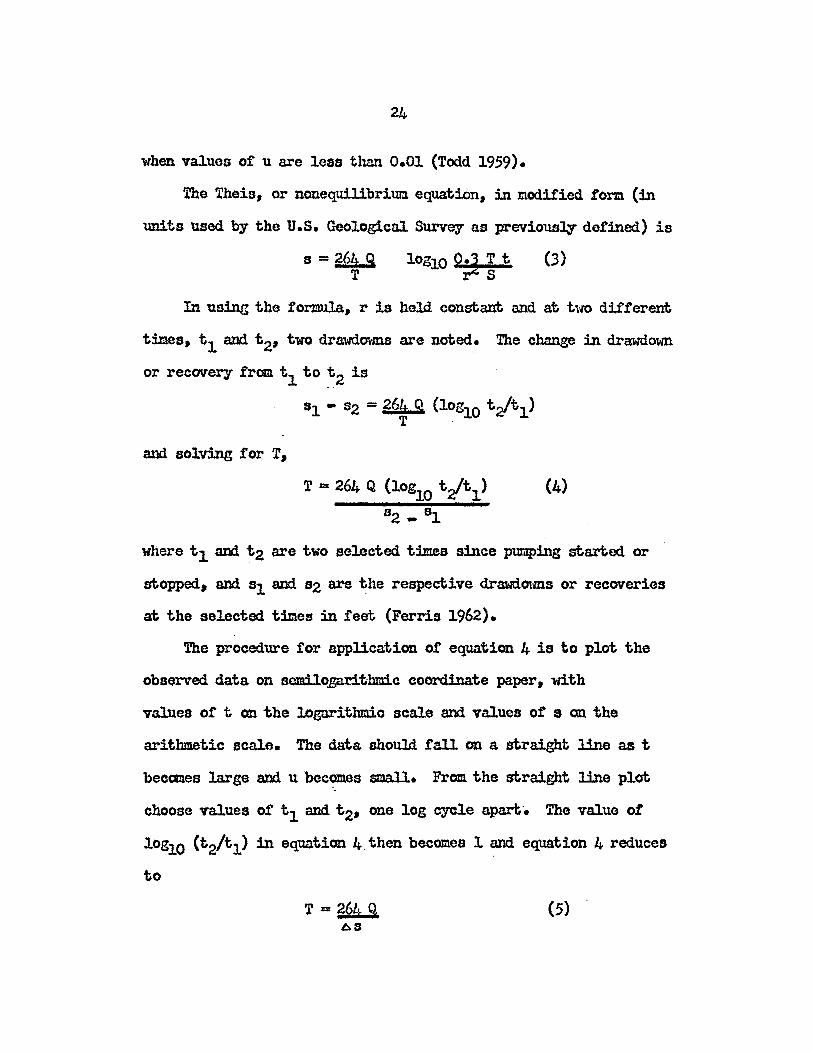
The Theis, or nonequilibrium equatiOn" in mod.i.fied form. (in
units used by the U.S. Geological. Survey as previousq defined) is
8=2649 T
In using the for.m.ula" r is held constant and at two different
tmes, tl and t 2, two drawdO\'ms are noted. The change in drawown
or recavery from t1 to ~2 is
sl - s2 = 264 Q (loglO t~tl) T .
and solving for T,
T == 264 Q (lO~o t/tl ) (4) 82 _ 81
where t]. ami t2 are two selected times since pumping started or
stopped, and 81 and 82 are the respecliive drawdOtm8 or recoveries
at tho selected times in feet (Ferris 1962).
The procedure for applica.tion of equation 4 is to plot the
observed data on sem:Uogarit.hmic coordinate paper, with
values of t on the logarithmio Bcale and values of 8 an the
arithmetic scale. The data should tall on a straight line as t
beccmes large and u bocC?DlCs small. From the straight line plot
choose values of tl and t 2, one log cycle apart. The value of
!og10 (t2ft].) in equatian 4. then becomes 1 and equation 4 reduces
to
T=264Q AS
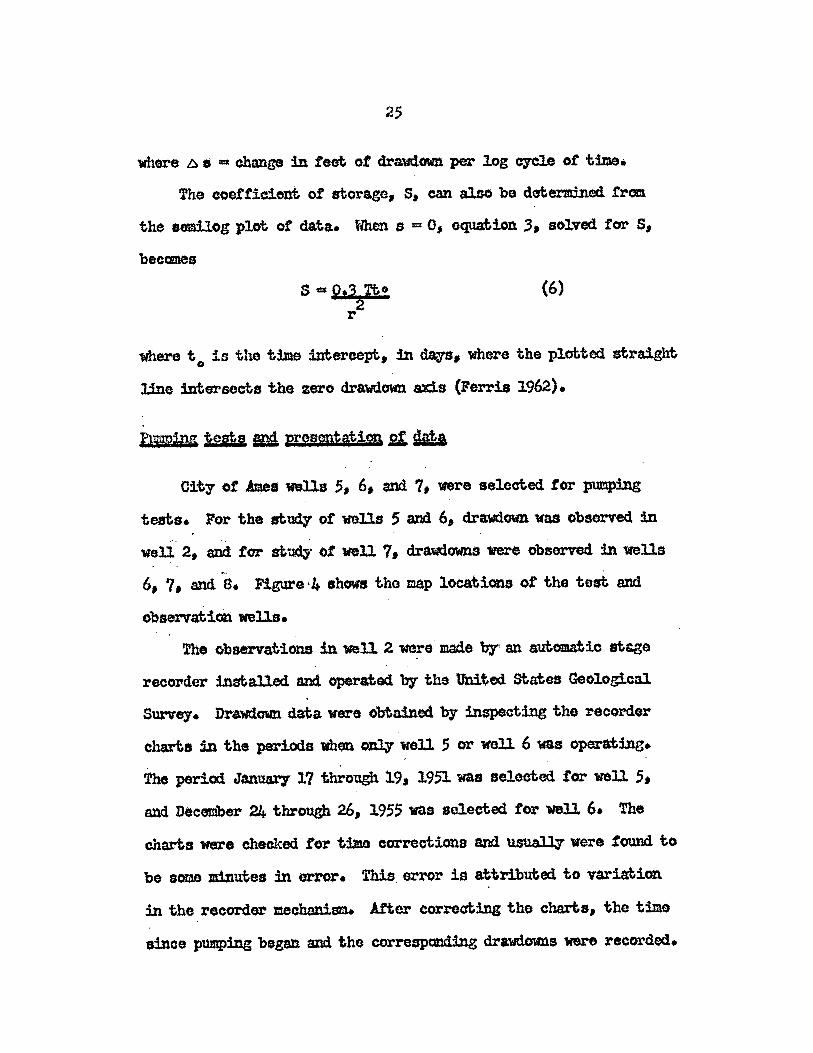
25
whGre 6 IS =: change in feet ot drawdown per log cycle of time.
The coefficient. of storage, S, cah also be determined tram.
the semilog plot of data. When s =:: 0, equation 3, solved for S,
becomes
(6)
where t. is the time inte~cept, in claUs, where the plotted straight
line intersects the zero drawdown axis (Ferris 1962).
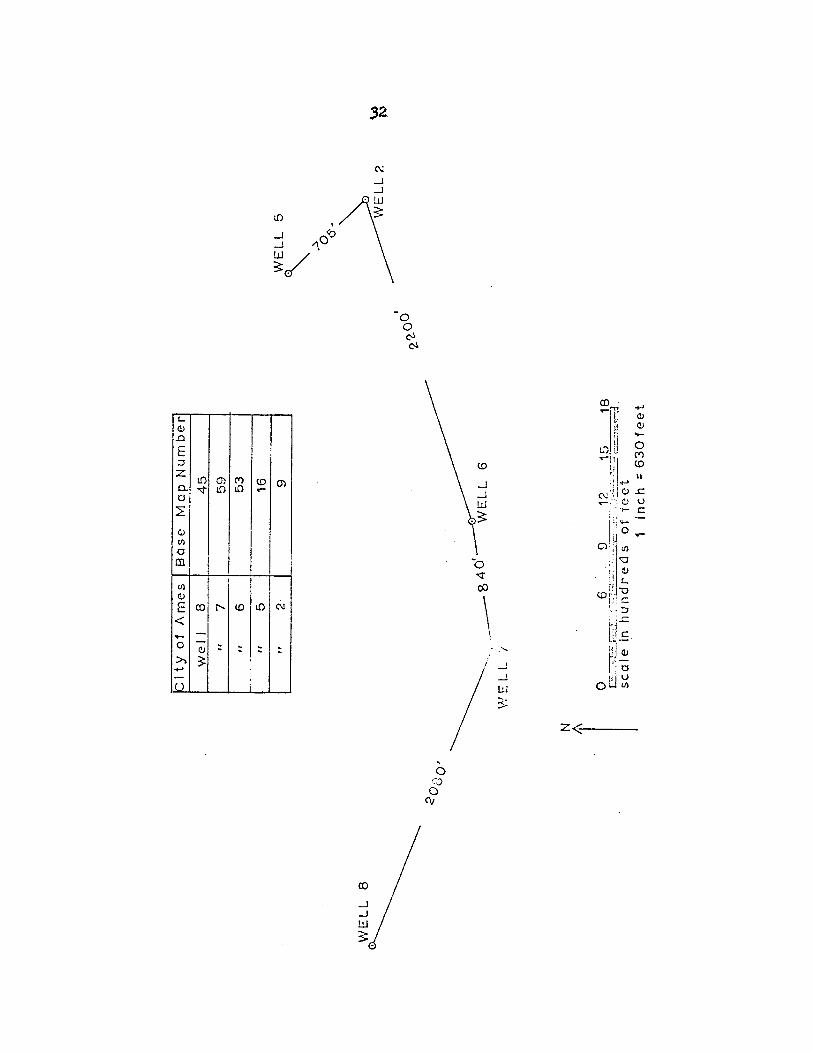
Cit.y of Amea wells 5, 6, and 7, were selected tor pumping
tests. Por the stud7 of wells 5 and 6, drawdown was observed in ,'.
well 2. and tor study Of well 7, drlli«1owns were ob~ in wells
6, 7, and S. Figure·4 shOllS the map locations of the test and
observation wlla.
The e>bservations in well 2 ~e' made by an automatic at&ge
recoxder :l.nst,aUed and operated b.1 the United strates Geo1ogical
S111"1te7. Drawown data were obtained by inspecting the recorder
charta in the periods when onl;r well S or well 6 was operat:ing.
The period Janua.I7 17 through 19. 1951 was selected tor well 5.
81\d December 24 through 26, 1955 was selected tor well 6. The
charts were checked for time corrections and u~ were found to
be some m:1.nutes in error. This, error is attributed to variation ..
in the recorder mechen:! sm.. After correcting the charts, the time
sUlee pumping began and the correupanding drawdO\ms were recorded.
26
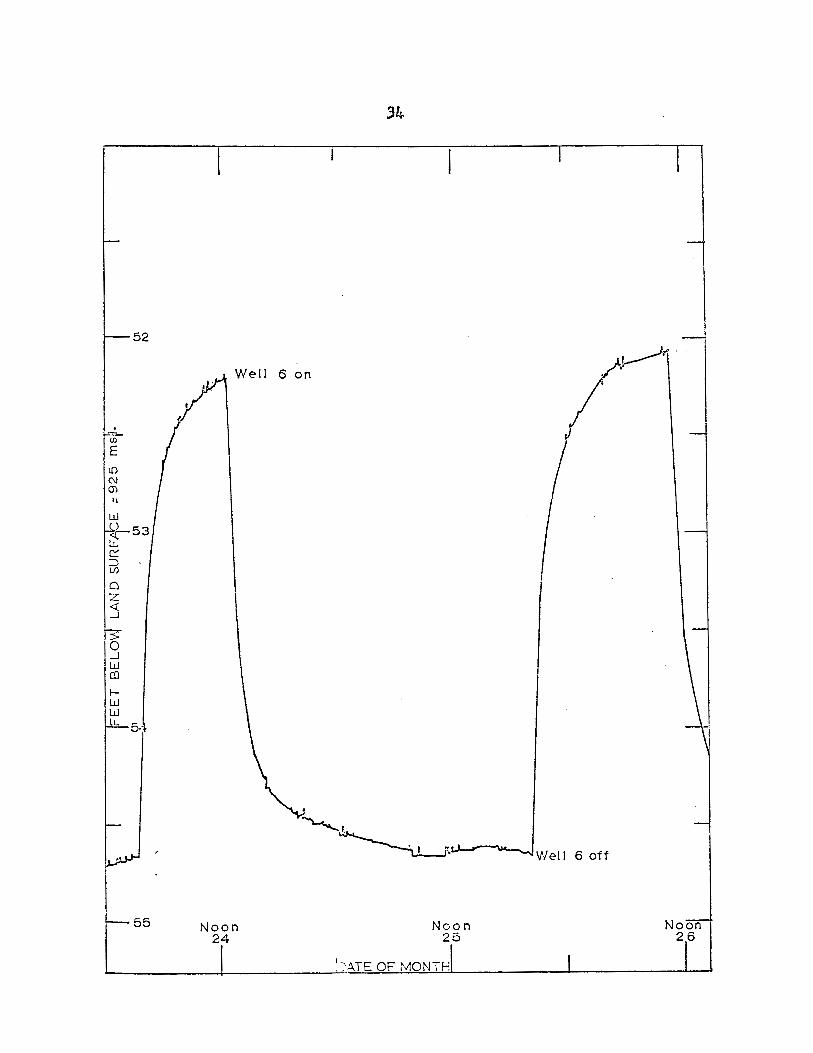
The corrected dramown curve tor the 1955 test on well 6 is shown in
Figure 5.
The author and tlembers of the staff of the Municipal tla.ter
Treatment Plant of Amon conducted the pumpillg test on well 7 d:U.I'ing
the days ot l<!a.y 6 and 8, 1963. Cbservation walls ltere tho
pumped well and well.s 6 and 8.
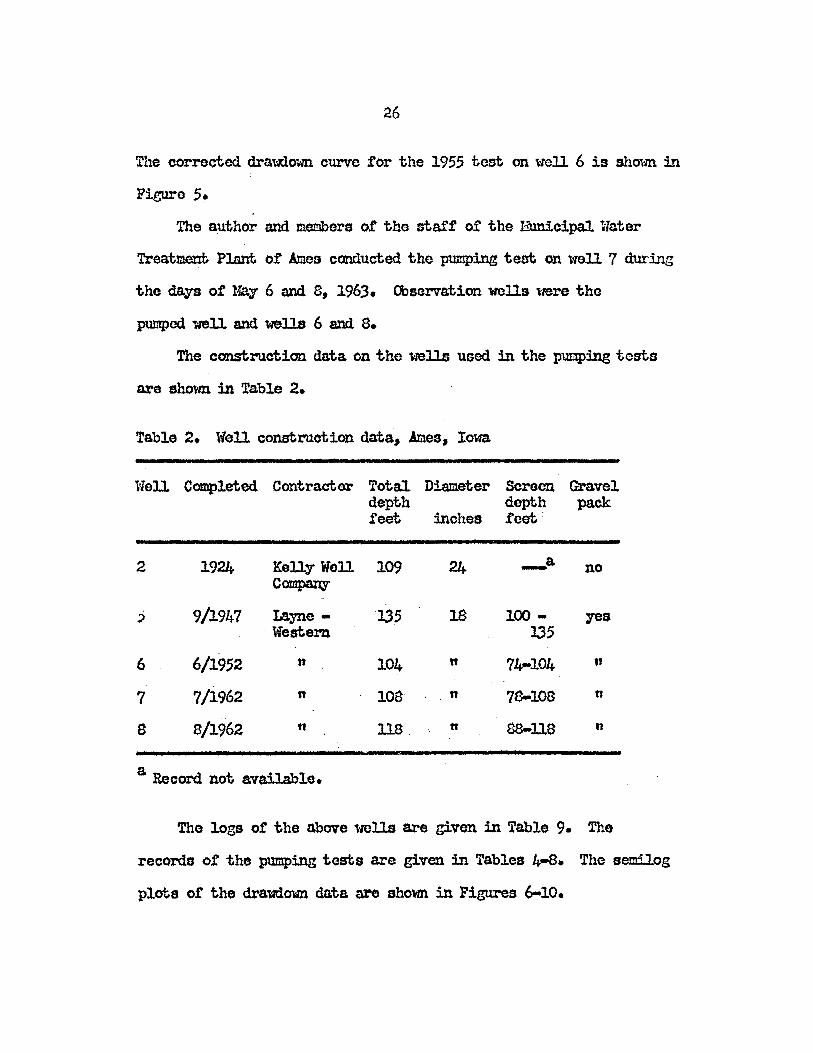
The constro.ction data. on tho wells used :in the Pl.WIPing tosts
are shown in Table 2.
Table 2. Well constro.ction data, Ames, Iowa
Well Completed Contracter Total Diameter Screen Gravel depth depth pack feet :inches .feet. ·
2 1924- Kelly Well 109 _a no C~
~ 9/1947 Layne - 335 100 - yes Western 135
6 6/1952 n 104- n 74-104 " 7 7/1962 n 100 n 78-108 n
8 8/1962 n 118, n S8-11S n
a Record not available.
The logs ot the above wells are given in Table 9. The
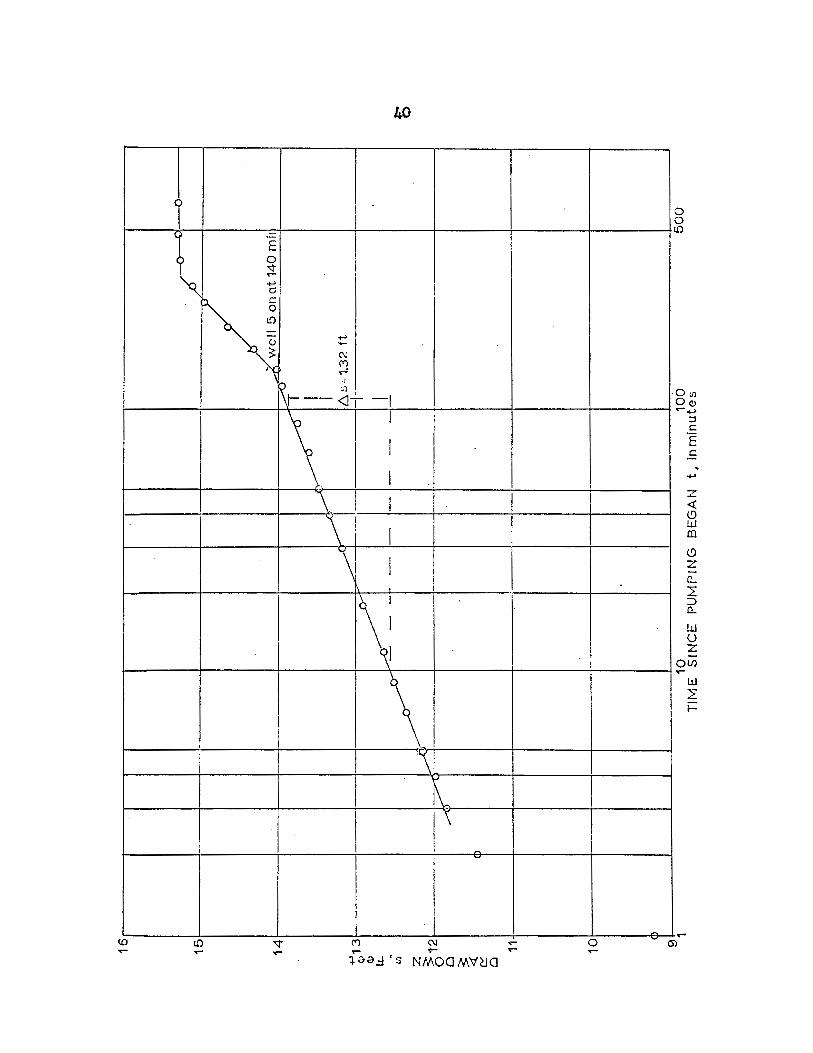
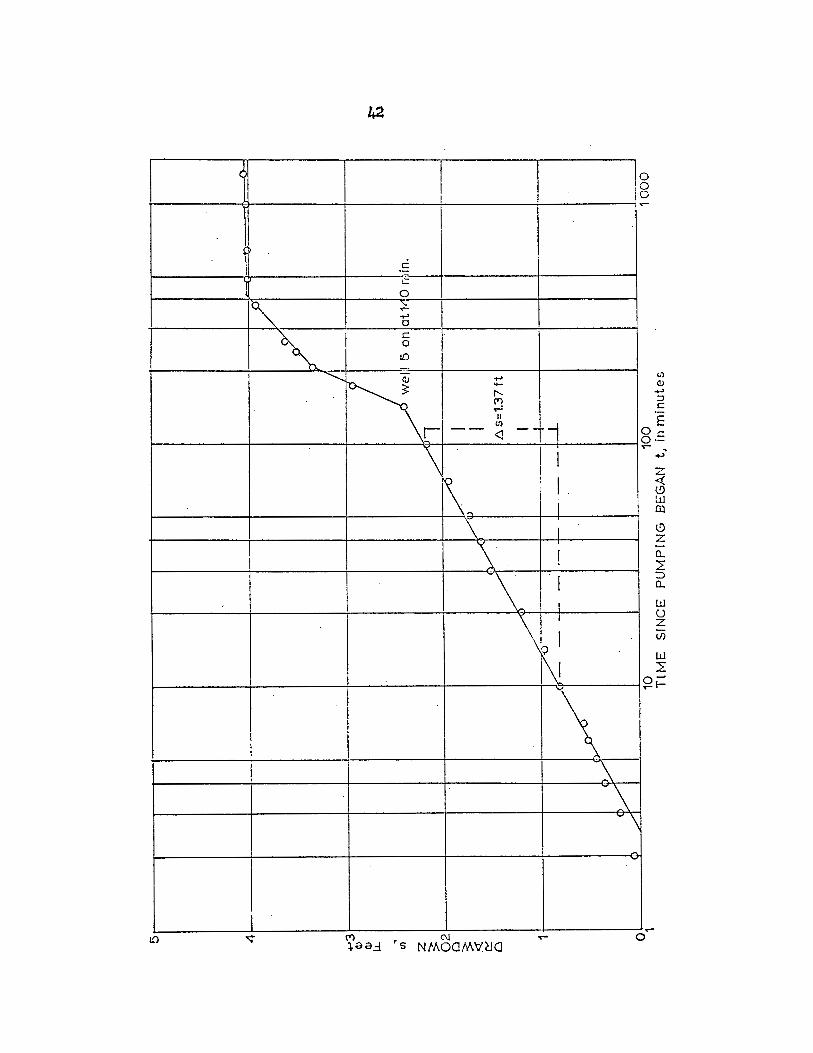
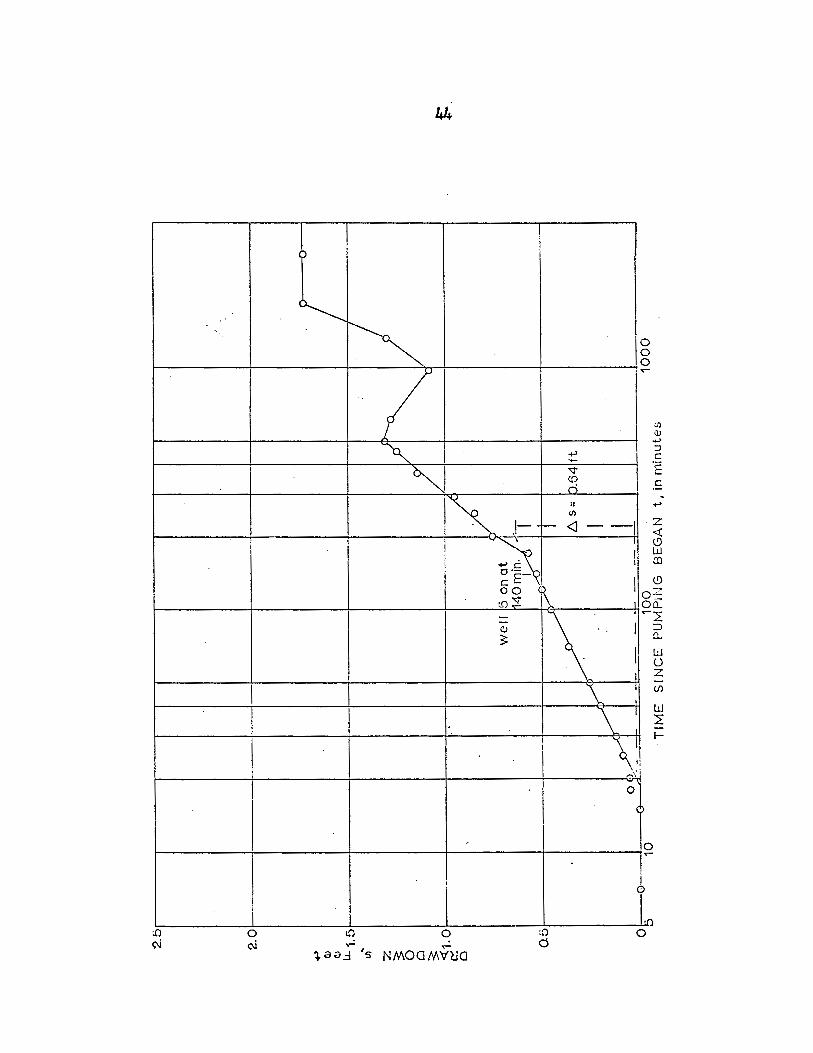
records o.f the pumping tests are given in Tables 4-8. The semilog
plots of the drawown data are shown in Figures 6-10.
Tab
le 3
. R
esu
lts
of
pum
ping
test
s, A
mes
, IO
l-la
Te
st
and
Q
IS
t.o
. m
r
T
K
S ob
serv
atio
n 'f
ells
gp
m.
feet
da
ys
feet
fe
et
gal.
/day
/ft.
g
a.l.
/day
/ft.
2 l\
) --
.l
5-2
16
'15
2.0.
7 5.
55 x
10.
-4
40. .'
70
.5
214,
000
5,35
0.
7.15
x 1
0.-5
6 -
2 11
49
1.2
6
3.4
7 x
10.
-4
44
2200
24
0.,5
00
5,56
0.
~
5.17
x 1
0.
.
7 -
7 10
.57
1~32
-45
-
2ll,O
OO
4/
100
-7
-6
10.5~1
1.3
7
1.'1
3 x
10.-3
45
)."
840.
20
.3,5
00
4,50
0 1.
50.
x 10
.-4
1.25
x 1
0.-2
"'"
_ .. )
3
.78
x 1
0.-4
'1
-8
10.5
7 0.
.64
45
20.8
0 43
7,00
0.
9,70
0
28
Results and Interpretations
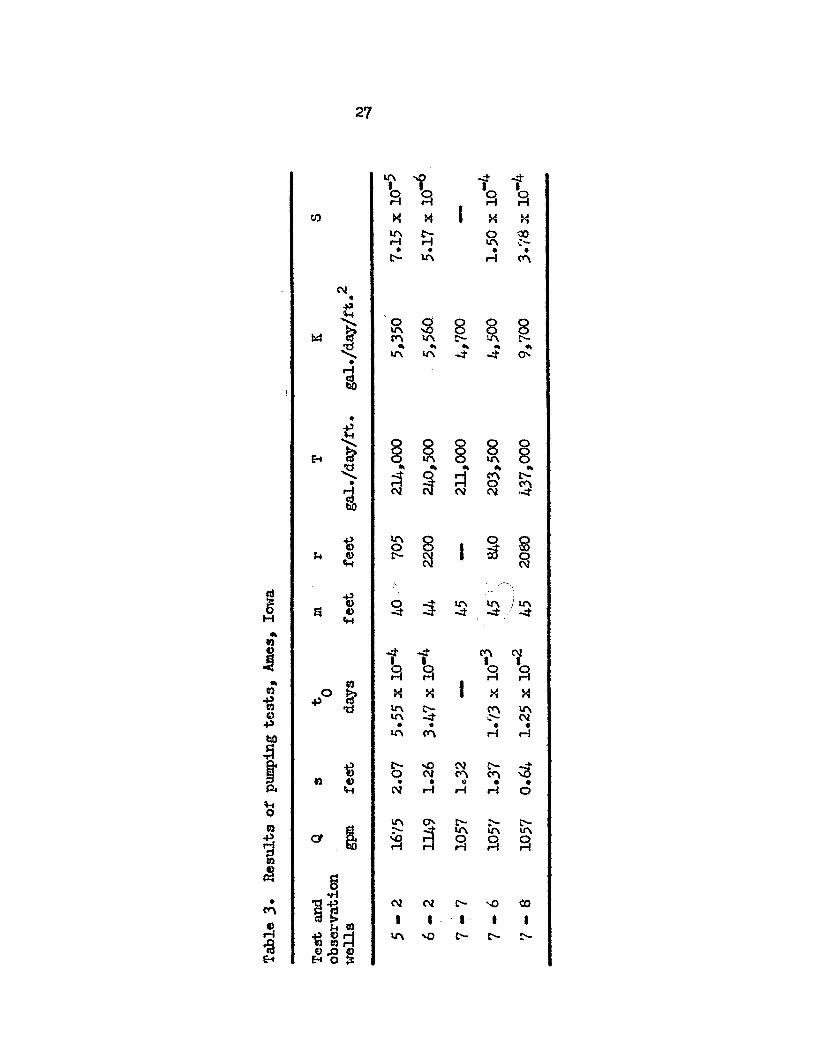
Tho unknowns needed to ca.leulate the values of 'l' and S bT
equations (,;) and (6) and the vaJ.ueBof T and S calculated are
shcnm :in Table J.
From the data. presented,. the author feels that the values of'
T in the 2 It loS range represent the transmissibility of the
aquifer in the area. incl'Qded in the pump1ng tests. Although the
wella have gravel placed arOUlXl the screens to :improve the per
formance, it is felt tha;t this practice lSerTe8 to decrease the
loss in head caused by the well characteristics and thus makes the . .
observed drawdown or headless more close~ related to the aquiter
tranE ssibility.
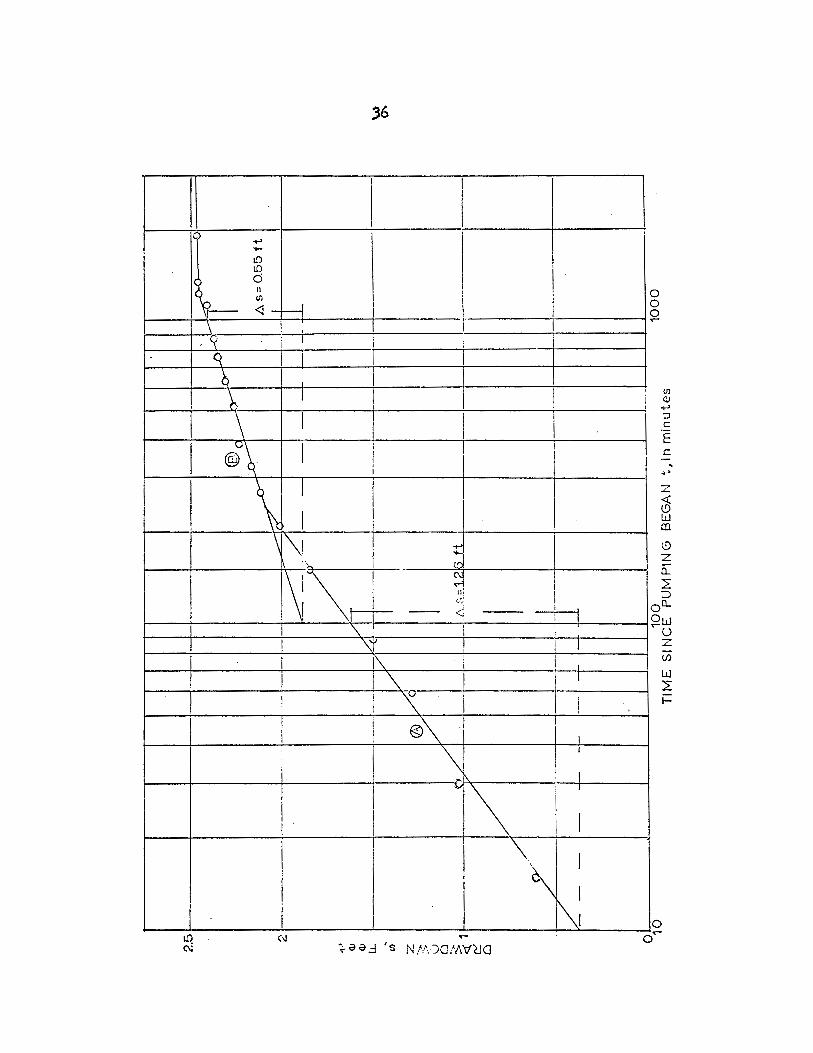
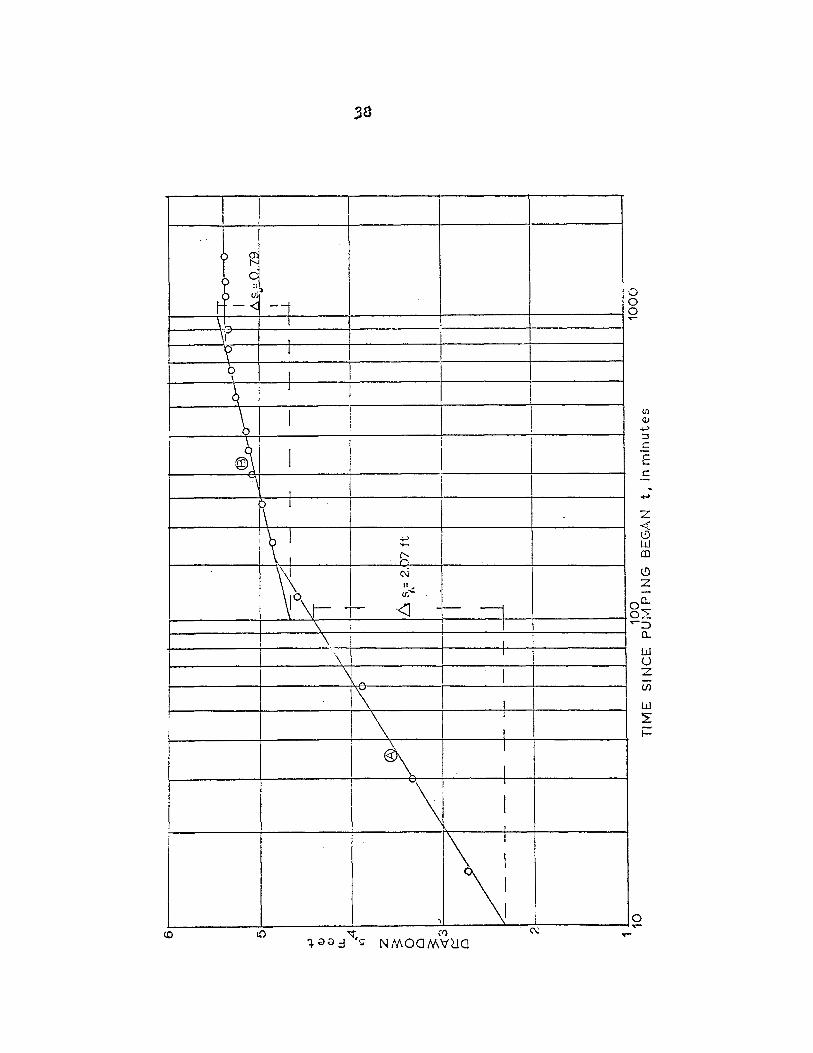
The remaining segments of the curves in Figures 6 through
10 show a decl:1ne in rate or drawown with increase :in t:tme.
Values of T for the B 8egm.ents of the curves in Ftgures 6 and
7 are appraximatel1' two and one-half' t:hn.ea those T values cas.
puted from the first 8e~ent8 of the curves. In all five curves,
the final segments, ranging .tr~ 500"to 1000+ ~ut~s atter . .
pumping started, reach an apparent state 0:£ equilibrium. (no
increase :in dravdom with increased t:ime).
Jefforde (1952) has shown that this marked decrease :in the
rate of decline of dra1down results fran the :inflow of wat~ .trom.
some recharge aourco. The result, on the semilOg plot of data,
is that the curve deviates towards a horiaontalline, as :in the
29
final portions or the cUrves in figurea 6 through 10.
The author teela that t.he decrease in decline in drawdCiiWn
probab17 occurs when the cone of depression receives water :trGa
the saturated aJ.luvium. which fill the Squaw' Creek and Slamk River
valleys.
The Talue or If oomputed tram the observations mad. at well S
is approximateq twioe that or the other values. This could
indicate that the transm1ssibil1t7 or the aquifer has increased t'tfOjlOo
fold in' the area. arotmd well'S, . Qr'tlUtt 'the aquif'er vas· in a sm.
equilibrium 1dth a recharge 8burce. Itt this :instance. tho _cureD
is probab~ the alluvitml. of the· Squaw. Creek Tal.J.q. The author
favors. the latter irJ:t;erpr~at1cm.
The 'Variation in the valuea ot the tJi;orage coetticient. S,
seen in Table 3 is thought to represent the natural variability of
the aquifer material.
It 1l1lS'h. be rfllD8J.Dbered that the tormula.$ used in. computing T
and S wre based 011 some rather ideal. assumptions. In this test
the formation is knotm to be heterogeneous. But, as Ferris '. '.
(1962) states, hcnogeneity is a x-elative term With respect to time
and apace. The author £eeJ.e that the area covered. b7 the testa is
large el'lOugb t~ treat the aquiter as a hOlnOgeneous unit hydrauli
ca.ll7-, The close correspondence ot the results would 8eem to
indicate that. this treatment is val:1d.
The assumption that the aquifer is infinite in areal extent
does not hold in this case. For practical purposes, however,
,30
boundary conditj"ons which occur can be seen in the data. (the
change in slope of the curves :in Figures 6-10) and. interpreted
by- the method of images described :in Ferris (1962).
Not all wells :in the tests penetrate the f'ull saturated
thickness of the aquif'er, but u.sually if the observation wells
are located greater than twice the saturated thickness from the pumped
well, this departure from the ideal assumption is not critical.
Even lr1ith departures trom ideal. conditions, for practical
purposes, the results obtaic.f..\(j by- the pumping tests are usuable it
applied l'lith judgment.

.31
~ <O
Go
,
K;l
tyo
fAm
es
Ba
se
M
ap
Nu
mb
er
we
i I
8 4
5
" 7
59
" 6
53
f-
-..
-
" 5
16
-
----
II
2 9
-
~,
N r V
.'E
LL
/
o 6
..
£)
12
15
1
8
E
.. -.
J'::'::::::~:.~~<
-::;
_~::
.::.
-:: ;"~~:~.~.!~~:::.;~...:.1::~~; .. ::'
"3.
sca
le
in h
un
dre
ds
of
1'e
et
1 in
ch
:: 6
30
fee
t
I
'2.'2.
00
WE
LL
5
" ~o 6'.
~LL2
)e

33
Figure 5. Corrected drawdmm curve, ,-roll 6 observed at well 2, December. 1955
. '""'-Ul
E If) (\J
m '1
Ul )
lJ... ~ :::> Vl
0 z « -l
> 0 -l Ul oJ
I-W W LL
52
53
5·
55
Well 6 on
Noon 24
Noon 25
'-::ATE OF MONTH
Well 6 off
Noon 26

35

I
..... .... L'J LO
II., d
I\- n ~,
<l -f=I \ i I , I
- '< i I
q I I b I ~ j
I \ ! I I I
I @~ I
I I I
_\ I
I I I I I
\[\1 d,
I~ . ~
I ~ ...-'1 III t.."'}
I I - < --\. I
! '\i !\ '\
I "\ I E?!~
\ 1". ....
\ \.
I ..-
faa.::! 's N/I\)Of/\V(JO
I
I
i
I
I I J I
I
.1
I I
I i !
I I
I I
I I
~ I 1\1
,
, i I
o o o ....
z ~ W tIl
(!) Z CL ::E ;:)
OCL Ow """0
Z (/)
w ::E I-
° 0 ....

37
~ J ) ~ ~ J,' r - <J -1 I
\ I
\t I
? 1
~ I
~ I
I
I b I I
@)\l I "I I L
\ I
: \; ~ I \ 10\r- \
\ \ I
\ \!
'"" '\
!
I I
i I
i
.
i
\
+> .... ~ N ll~ u; ,
'<1 - I I I I
I I
\ I
I
~ I
I
-\j I
I I
I
I I I ,
I
I
I
I I
\
l
I o o o .....
z -< {9 w CO
o z -
o a.. 02: ..... :J
a.. w u z (/)
w :E i=
o ..... .....

39

.. co
16
'1 --------;-----r---.--r--------;---------r----.---.--~--------r_------------------_.--------_.
,-.J
.....
151
1--
l-----I----.J--.---l---i-
---t-
-----o
L=
---+
-----'
14~----j---t--l---t----~r-----+---r-~~------+/O~~~~~~~L-----J
-,- I I -<
-'13
,6,s
:c1
.32
ft
<1'
-1
--------1
---------1
Q
) ~
I U
) z ~t2
o ~ ~ o (
11~
-!----j---j----+
-----------+
----!
1n~------_4·----4-~--+_------~-------~--~---_r-r--------r_----------------T_-------~
91
10
1
00
5
00
T
IME
S
INC
E
PU
MP
ING
B
EG
AN
t,
in
min
ute
s
s

41
~
II
I~ , ..............
!
I
19 0 ....
c c 0 ~ +' 0 c 0
ID
Kr +' -" f') ....... II
l (f) -- 0 -- <l
0 .-
\ I I
r\~ 1 I
I I
'\ I
\ !
\~ I f
1: I I 1\ \ ~\
"'\
-
.-(\j .- o
E c
..... z ~ w CQ
<.9 z

43

+'
Q)
Q)
2.5
2.0
I
1.J..
1.5
1Ji~
'Z ~ o ~
«1
.0
~
Cl O
.b I I o
-:-.
~
0 ;)
1
0
'V
,
~ !
-v-
1;1 ~ 1/
1/
-..
V
f;
we
ll ~E
14
0m
in.
~ T
I
. I
V
I ... -
--
b. s
" J
.64
it
/ /'
I ,A
1
t~
--
. ~
~ --
-. T
IME
S
INC
E PUMPlt~G
BE
GA
N
t, in
min
ute
s
45
lfA.TER LEVEL FLUCTUATICNS
Introduction
The piezcm.atrie surf'ace of' a confined aquifer indicates the
elevation of atmospheric pressure ct the aquifer. !n:y phenomenon
producing' a change in pressure of' the wa.t.er in the aquifer will
cause the piezometrio surface to change. Changes in storage
cause levels to vary' with time. Sf:,orage changes mq be produced
bY pumping, variations in stream stages, evapotranspiration
variatiOn, SlId applied. loads on the aquifer such as trains, tides,
atmospheric pressure, and earthquakes.
Data Collection
The main sourOe of' data for the study of wa.ter level fluc
tuations in the Ames area is the records of' the automatio stage
recorder located in City well 2 (U.S.G.S. c)'servation well, 8,3-
2.4-2Q1, City of' Ames). Since being inst,alled in November, 1947,
the recorder has been in:f.'lueneed by nearby pumping wells. There
fore, the artif'ioial1'luctuaticna imposed by the pumping wells
conceal some natural piezometric fluctuations. However, if' the
d.aiJ.;r high and low levels are plotted for ea.ch)"ear ot record,
the generaJ. trend in the piezcmetric surfa.ce for that year can
be aeen. The d.ai:q' high levels in ma.n;v instances represents
times when the pmnping wells were not operating. Thus the water
level will be very nearly at static level before the wells are
operated again. For this reason it is felt that the trend in high
levels would very nearly approximate the true trend in the piezometric
surface or the aquifer.
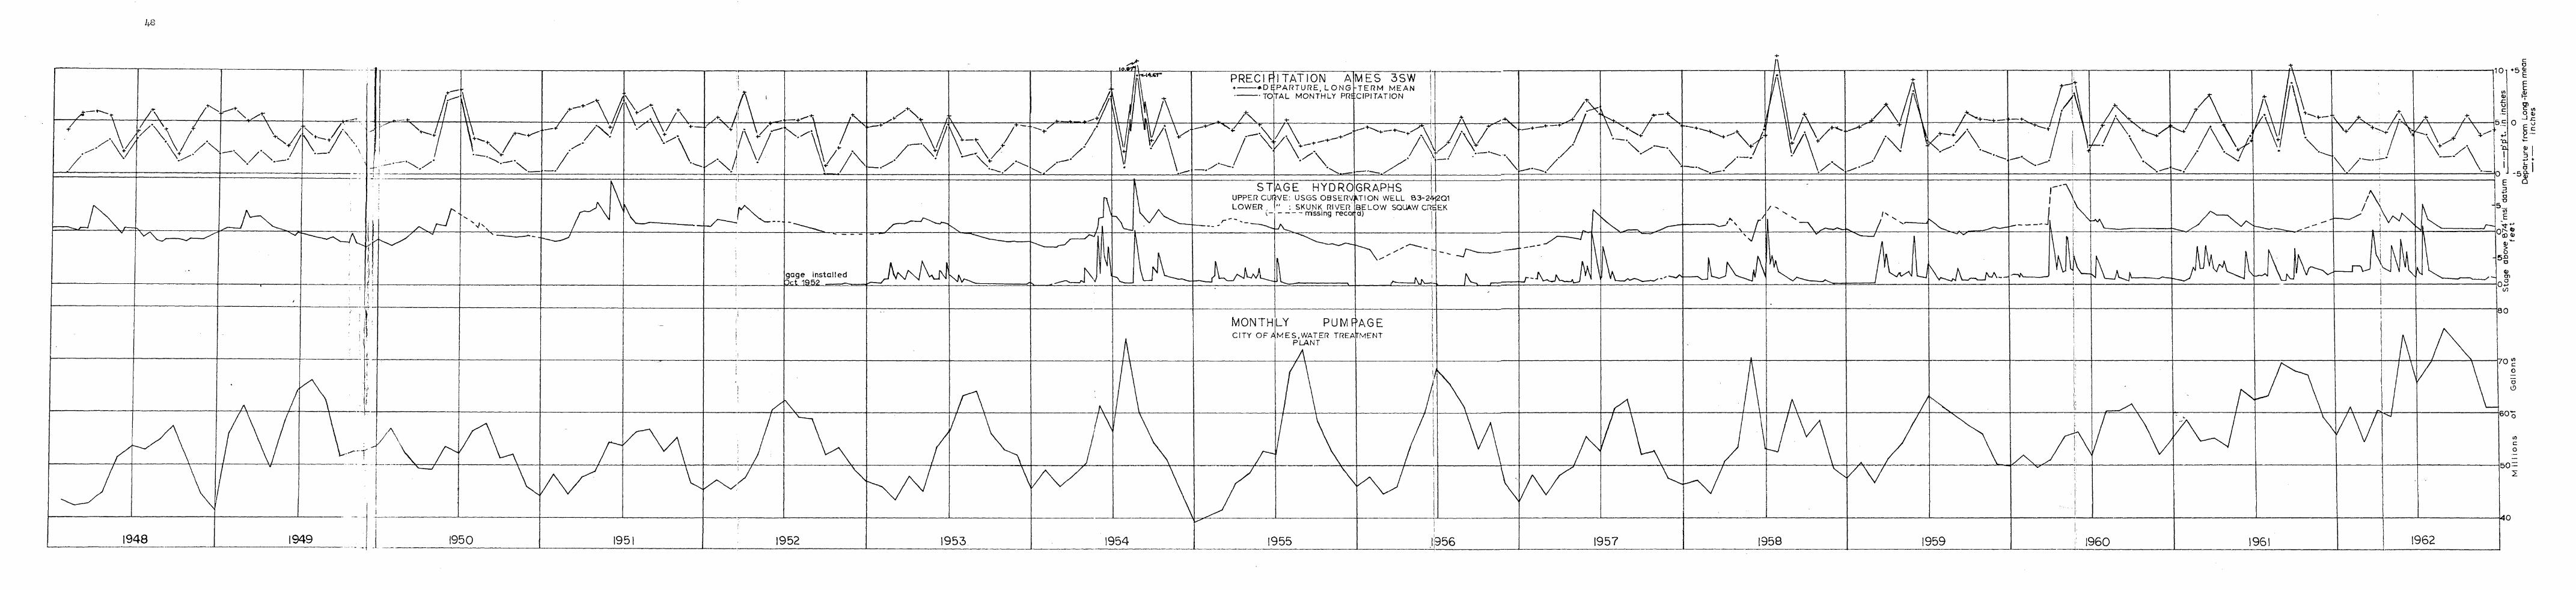
The graph ot the fluctuations in water level in the observation
well is presented in' Figure ll. Figure 11 compares the factors
afrecting the storage" and subsequently the piezometric surface,
with the stage hydrograph or the aquifer. The precipitation
record, represented by the total monthly precipitation and the
deviation of the total monthly precipitation from the long-term.
(1931-1955) mean, river stage hydro graph from the Skunk River below
Ames projected upstream to the same datum elevation as the hydrograph
ot the well, and the total monthly pumpage at the CitY' of Ames
Municipal Water Treatment Plant, are compared to the well hydro
graph.
Observations and Interpretations
The well hydrograph in Figure II does not show any general
downward trend in piezometric level which would imply overdraft
conditions in the aquifer system. It must be noted that the period
of record is only 14 years and m.q possibly be too short for proper
identification or long-term. trends.
Several periods of annual trends are noted. The common

47
Figure ll. Graphs showing precipitation (U.S. Department of Commerce 1948-1962), hydrographs (U.S. Geological Survey-1948-1962); and, pumpage (Municipal vTater Treatment Plant, Ames, Iowa)
49
annual trend is a rise in water level during the first 3 or 4
months ot the year and then a gradual decline until October or
November. This trend is especiaJ.ly well demonstrated in the well
hydrograph curve tor the period 1948-1953.
This same annual trend is noted in the stage hydrograph of the
Skunk River, although peaks representing floods make the river
bydrograph harder to generalize. In Figure 11, the two stage
hydrographs have been plotted on the same datum-874 teet above
mean sea level. Comparison of the two hydrographs shows that peaks
on the river hydrograph dUe to excessive rainfall or snowmelt
correspond. very closely tc peaks on the well hydrograph. Although
most river hydrograph peaks have a greater stage height than the
corresponding well hydrograph peaks, the August 1954 storm. pro
duced a river stage ot 10 teet above datum. and the corresponding
rise in static water level was 10 feet.
During periods of drought, as in June 1953 to June 1954,
when the monthly precipitation was be1m'f the long-term. mean tor
6 consecutive months, or in June 1955 to June 1957 when the monthly
precipitation was belm'i the long-term mean for 19 out of 24 months,
when the Skunk River shows prolonged periods of 0 stage (no flot:),
the level in the observation wrell showed a steady decline, but lost .
only 4 or 5 teet of stage. <hce the precipitation had again approached
normal, the water level rose rapidl1' and was again above datum
elevation by the end of June 1957.
The important point to be gained from inspection of Figure 11
50
is thc.t the hydrograph 01' the piezomet.ric aur1'ace of the aquifer
shows the closest correlation to the ~ograph ot the Skunk River
and. a.pparent~ no response to the pumpage of the C1t7 or Ames.
Fluctuations Due to External toads
Response or the compressible artesian aquifer to applied
external. loads has been well documented by Jacob (1939). As a.
train approachs a well, ca:Ipre8sion of the aquifer results,
ca.using a rapid r18e in the water level. Adjust;ment or the aquifer
to the load causes a decline from. maxim'llm rise as the train passes
the well. Aft.er the train has passed the well, the aquiter ex
pands and the level declines rapidly to' a minimum be.tore recc:wer-
1ng to initial P9sition.
1'I1e above c1010 takes ~ a 1'aw minutes am. the :rluctWltions
u.sua.l.q appear as vertical lines on water-stage recorder charts,
because the time scale is too small to catch the detaU of the
cycle.
The short period. oscillations imposed upon the dra:t .. down curve
in Figure 5 are thought to be due to passing railroad trains. The·
ma:in line ot the Chicago and North Western passes less than 100
feet south of the observation well conta.inSng the automatic recorder.
Comparison or train arrival times with the times ot Bhol"t-pericx1
fluctuations during April 2 through 4, 1963. ahowod a high degree
of correlation.
51
Figure 16 is a ,contour map or the piezCD9tric surface, con
structed tram. measurements of static water levels in wells knoun
to penetrate and receive water onJar hem the aquifer. As grOund
water moves free areas of higher static head to areas of' lower
static head, the general flow direat.ion i.e to the south, and
loea.lll'. trcm the welrt and east toward the center of aquifer. As
the contour lines on Figure 16 represent J.ines of equal gro1.ll1d
water potential (equi-potential. lines), l:ines drawn perpendicular
~o the contours (flow lines) vUl ehow directicm of l!1OVement of
ground water at that position.
Areas or favorabl.e permeability :m.!3 be ascerta:lned frcm
Figure 16. because the coefficient of' permeabilit;y is. inversely
propOrti<ma.l to the hydraulic gradient. l'll areas of uniform
gound-water flow'. the parts hav1ng me contOlll' spacing (flat
gradients) will have higher permeabU1ties than those nth narrow
spacings (steep gradients).
52
DISCHARGE
Discharge from the aquifer is accomplished in several ways:
(1) bY' down-gradient underflow through the material; (2) bY' discharge
from wells; (,3) bY' natural discharge at the surface through
processes of surface runoff, evaporation, and transpiration; and (4)
bY' loss of water to the bedrock fOt;mations which are in contact with
the aquifer. . .
. Although it is difficult to determine what portion of dis-
charge of the aquifer is accounted tor by undertlow, it is prob-
ably a significant amount because of the relatively high permeability '.
of the sand and gravel.
Most of the discharge by pumping has been due to the City of
.Ames and Iowa. State University wells. Numerous domestic and air
conditioning wells obtain water from the aquifer, but operation is
very intermittent and pumpage tor air-conditioning wells is
usua!l1 less than 100 gpm and for domestic wells is usually less
than 20 gpm.
Evapotranspiration maY' be a significant discharge factor in the
portion of the aquifer in the Skunk River and lower Squaw Creek
floodplains. Data. are not sufficient to determine the extent to
which the aquifer contributes to surface runoff, but it is probably
not a. significant amount.
A portion 01' the discharge may be to the bedrock aquifers which
are in direct contact with the aquifer. Several wells in the
53
southern i of section 16. '1:. S3 H., R. 24 W •• l1bleh obt.ain. water
frClll consolidated rock a.quifers tLt depths of 200 to 600 teet.
have static water levels which correspond close~ to the elevations
of levels :In wells compJ.eted in the aquifer. It is conceivable
that i where the aqUiters or Mississippian age are exposed to the
surface or are :Ln contact with the sands and gravels of the aquifer, . .
a 108S or water, b;y the aquifer. to the bedrock occurs.
54
Recharge to the aquifer occurs direct~ or indirectly from. pre
cipitation in the :torm of rain or SUet.,. Direct recharge can occur
from percolation of rain or meltwater det·t.n1'lard through the over~
glncial till. Throughout most of the area 'Where the over~ glacial
deposits are 50 to 100 feet thick, direct recharge is probab~ 81eni' • ./
Once the sand and gravel at the base of the Pleistocene is reached
by this water, hOti'ever, the path to the main body of the aquifer
would be considerably more direct than a simi] ar path through the
glacial till.
Fran the da.ta presented on the water level fluctuations and
piezometric surface, it appears that the a.quifer is being recharged
by l'rater from the Skunk River and Squa'trl Creek. hem data available
at this time, the major portion of the recharge from. these surface
water sources appears to be from the Skunk River. An inspection of
the discharge records for the Skunk River above Ames and for the
Skunk River below Squau Creek reveals that, during periods of lou
flow, the discharge in the Skunk River upstream from Squaw Creek is
grea.ter than or equal to the discharge in the Skunk River bclo\"l Scp1a.w
Creek. This would )eem to indicate that '-later is being lost from the
Skunk River system surface r'lUloff, to the alluvium of the a.quifer.
Although data is not presently sufficient for conclusive proof,
a possible area of recharge is underflO\"t within the aquifer from.
the area known as the Story City flat (Zimmerman 1952).
55
SUMMARY AND C(llCLUSI<lJS
The results o! the investigation show the aquifer under-
lPng the City of Ames, to be part or an alluvial deposit occupying
a portion of the pre-Pleistocene (1) and/or Pleistocene valleys of
the area..
The alluvial deposit tmderlies an irregula.r area of approx
imately' .30 square miles and. averages about 40 teet in thickness,
rang'....ng frOE 0 at the edges, to over 100 feet in the center. It is
c~~osed la.rgelT o! coarse sand and gravel, with local clay lenses,
and, therefore, has a high permeability-. Values of the field
coefficient of permeability, P, computed from pumping test data. in
the Ames area, range 5,560 to 4,500 gallons/da:r/ft.2, an average
of 5,027 gallons/day/ft.2 or the aquifer. Values of the coefficient
of storage, S, from the same pumping test data, range trom. 7.15 x 10⁻⁵
to 1.50 x 10⁻⁴, with an average of 1.;11 x 10-4•
The aquifer behaves as a confined aquifer in areas where it
is overlain by glacial till. In these areas the static water level
rises about .30 teet above the upper surface of the aqui!er. In the
Skunk River. and Squaw Creek tlood plains, the upper surface of' the
aquirer is unconfined and the static water level corresponds to the
elevation of the surtace water.
From the da.ta gathered in this report, it is concluded that the
aqui!er receives recharge from percolation through the overlying
till and silt, in1'low from the Skunk River and Squaw Creek, and.

56
underflow from the north through the valley fille and the sands and
gravels at the base or the drill.
57
SUGGESTIQIS Fen FU'l'URE STUDY
1. The work or the present study should be extended both
north and south of the area to determine the extent and ground
water hydraulics of tho buriod valley fills.
2. Due to tilnt) J.:imitations, investigations of the chemical
quality of the water in the aquif'er wore noli undertaken. A cam.
plete sampling progrDJ!1 of wter in the aquifer and in the surface
bodies of water, ldth corresp~jx..g ~sisl would give infor
mation vital to the placement of future walls. A study of this
nature would also identify more precise4r the recharge and dis
charge sources.
3. A ~ologic study of the Skunk River and Squaw Creek
basins above Atlas should be undertaken to collect and. ~e the
data concerning precipitation and runoff, for further correlation
with the artesian basins north of the present area.
4. More precise lnvestigations on flow directions and vel
ocities within the a.quii'er, us:tng tracers injected into the under-
flow I should be undertaken. The author recommehds the use of tritium as
the tracer. The use of a tra.cer could pemit closer ident:i:tication
or areas of high permeability and possible quantitative measurement
of the recharge to the aquifer by underflow.
5. A more canplete investigation, using radiocarbon dating
techniques, on the Pleistocene stratigraphy of the area, should be
undertaken. An attempt should. be made to determine the various ages
of the units identified in this report, and their relation to the
exposures seen in Boone Cotm.ty.
6. An investiga.tion into the possible sources of pollution
of the aquifer should be attempted. &npha.eis should be placed on
possibl.e pollution sources near the Skunk River and. Squ.alf Creek
flood plains.
59
SELECTED BIBLIOGRAPBI
Beyer, S.W. (lS9Sa) Buried loess in Story County. Iowa Aeadel:l\Y" of Science Proceedings 6: 117-121.
(189Gb) Geology of Story County. Iowa Geological Survey Annual Report 9: 175-2.38.
Erickson, Albert J. (1956) A proposed water treatment plant for Ames, Iowa. Unpublished typed report. Municipal Water Treatment Plant. Ames, Iowa.
Ferris, John G. (1959) Ground water. In Wistler, c.o. and. Brater, E.F. l:qdrology. 2nd ed. pp. 127-191. John WUey and Sons, New York.
(1962) Theory ot aquifer tests. U.S. Geological Survey WaterSuPP£.1 Paper 15.36-E.
IO"Aa Natural Resources CouncU (1957) An inventory of water resources and water problems, Skunk River Basin. Iowa Natural Resources Council. Bulletin 5.
Iowa State Pla.nn:ing Board Committee on Water Resources Water use and conservation in Iowa, Des Moines, and southeastern Iowa river basins. Volume 2. Author, Iowa City, Iowa.
Jacob, C.E. (19.39)
(19.36) Skunk
Fluctuations m artesian pressure pro:lucOO by passing railroad trains as shown by a well on Long Island, Hew York. American Geophysical Union Transactions 14: 66-674.
(1940) Ckl the flcn1 of water in an elastic artesian aquifer. American Geophysical Union Transactions 21: 574-586.
(1950) Flow of ground water. In Rouse, H., 00. Engineering hydraulics. pp • .321-.386. John Wiley and Sons, New York.
60
Jeffords, Russel M. (1952) Pumping tests on ltells in IO't'la. IOl.{8. Academ;r of Science Proceedings 59: 266-287.
~, George F. (1943) The Pleistocene geology of lOil'a. Special report. Iowa Geological SUrvey It Iowa City, Iowa.
Meinzer, Oscar E., ed. (1942) ftvd,ro1ogy •. McGraw - Hill, New York.
Ruhe, R.V. and Scholtes, W.H. (1955) Radiocarbon dates in central Iowa. Journal of Geology 63: 82-92.
Schoeller, H. (1959) Arid zone hydrology recent developments. United Nations Educational, Scientific, and Cultural Organization. Place de Fontency, Paris, France.
Simmons, Howard F. and Horton, W.H. (1911) story County. Iowa Geological SUrvey Annual Report 21: 900-913.
Theis, Charles V. .(1935) The significance ani nature of the cone of depression in ground water bodies. Economic Geology 331 889-902.
Thomas, L.A., Riggs, X.A., Jr., and Tench, R.N. (1953) Some loessoid deposits of central Iowa. Iowa AcadellliY of Science Proceedings 60: 4l4-42l.
Todd, David Keith. (1959) Ground water hydrology. John Wlley and. Sons, New York.
U.S. Department of Commerce. Weather Bureau. (194$-1962) Climatological Data, I<7..,a. Volumes 59-73.
U.S. Geological Survey. Surface l'later Branch. (1952-1962) Da.iJ.y gage height, in feet, and. discharge, in secondfeet, of Skunk River be1cnt Squaw Creek, near Ames, Iowa. (Printed form 9-192b) Engineer-in-Gharge, Subdistrict arfice, U.S. Geological Survey, P.O. Box 123, Fort Dodge, Iowa.
U.S. Geological Survey. Ground Water Branch. (1948-1962) Water levels and artesian pressures in observation wells, 8.3-24-2U, City of .Ames, Story County, IOt1a. (Printed form 9-147) u.S. Geological Survey, Ground "later Branch, Iowa City, Iowa..
61
Uallace, Richa.'rd U'arren. (1961) Initial erosional e:f.'tects on C&'t7 drill plain, central Iowa. . Unpublished. M.S. thesis. Library, Iowa state Univeraityof Scienco end Technology, ba, Iowa.
l'1enzel, L.K. (1942) Methods for determ:bdng permeabilit,.. of water-bearing materials. U.S. Geological. Survq Wa.ter-supp~ Paper Sffl.
Z1nIn.e:rman, Harold lee. (1952) Bedrock geology of' western st01'7 County, Iowa. Unpublished M.S. thesis. . Idhrar:y I Iowa state Univeraitl' of Science and· X.chnology~ Amea. Iowa.
and Thoaa.a, L.A_ (1953) . Ber:1rock geology or western Sf:.0l7 County, Iowa~ Iowa. A.cademy- ot Sc;ience Proceedings 60t 465-476. .
ACBNO:1LEDGEH~fl'S
The author is indebted to the City of Ames, IO'da, John M.
Carpenter, City- Ma.nager, and to the l.funicipal l'1a.ter Trea.tment Plant
of !mes, Harris F. Seidel, Director, and Robert Johnson, Assistant
Director, for the material aid to conduct this investigation.
Appreciation is also extended to z,h-. Walter Steinhilber and
the staff of the Grounci-l'later Branch of the United States Geological
Survey, Iowa. City-. Iowa., for advice during the course of the
investigation.
Acknowledgement is made to the start of the Geology' Departl:1ent,
Iowa st:.ate University, for instructive discussions conce...-ning the
problem.
Special thanks are due Donald Davidson, Frank Knoll, and Dale
. Norem, who made up the drilling crew during the test hole program.
The rotary drill used in the test hole program, June 1963, is on
loan to the Geolog.v Department and Engineering Experiment station
bw the Office of Naval Research.

6,3
64
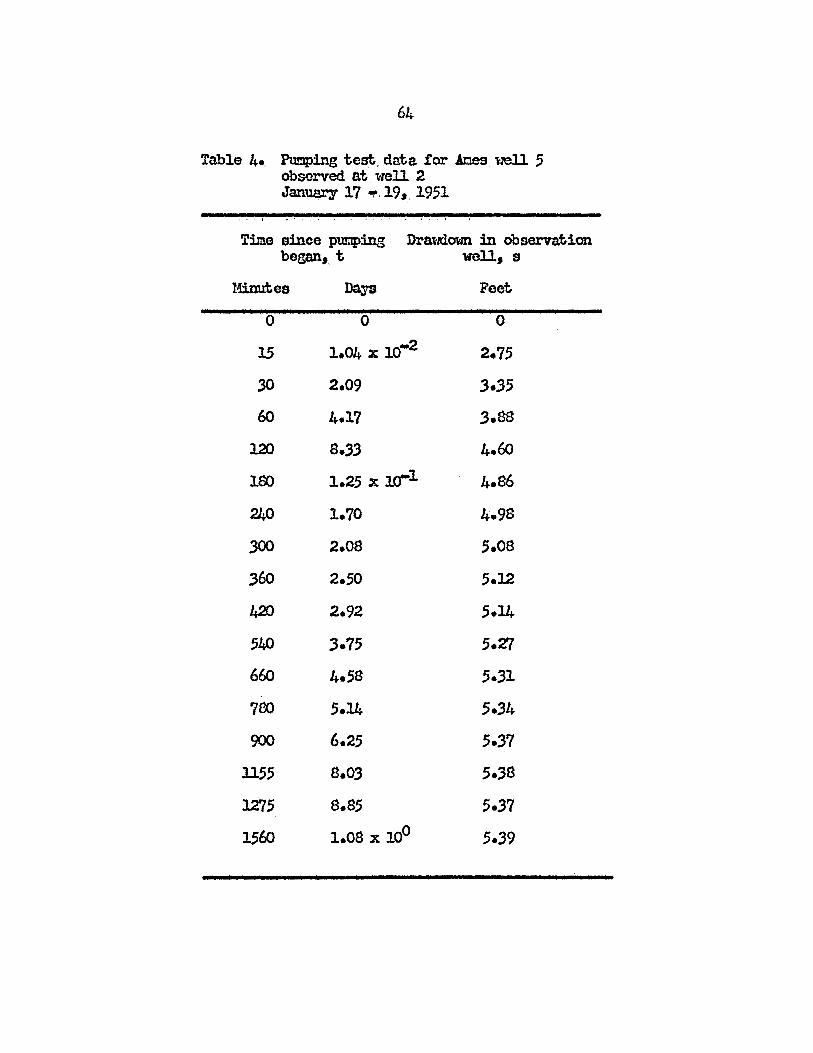
Ta.ble 4., PuI!1:ping test, data for .Al::les, uell 5 observed at well 2 Janu.a.t'1" 17 ,"",19., 1951
Time since pumping Drmldown in observation began" t well, s
ltinutes Days Peet
0 0 0
15 1.04 x 10⁻² 2.75
30 2.09 :3.35
60 4.17 3.88
120 8.33 4.(JJ
100 1.25 x 10⁻¹ 4.86
240 1.70 4.98
300 2.08 5.08
360 2.50 5.12
42D 2.92 5.14
540 3.75 5.Z7
660 4.58 5.31
700 5.14 5.34
900 6.25 5.37
ll55 8.03 5.38
lZl5 8.85 5.37
1560 1.0S x lIP 5.39
65
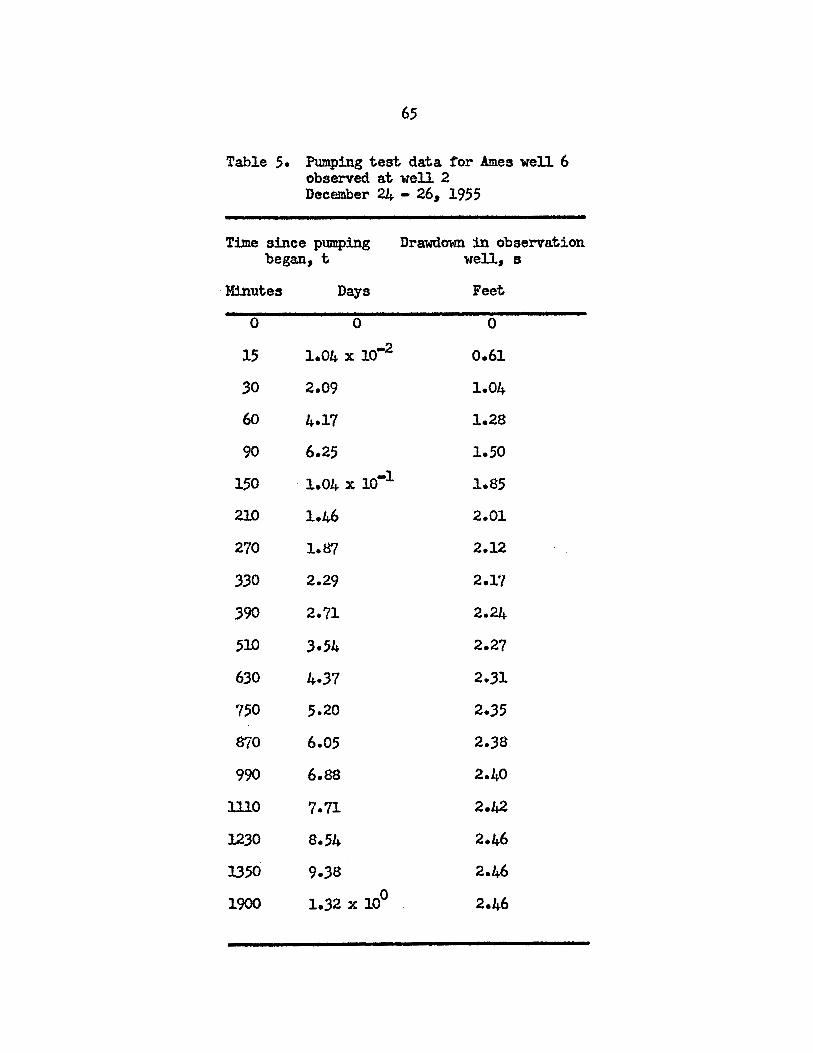
Table 5. Pumping test data tor Ames well 6 observed at well 2 December 24 - 261 1955
Time since pumping Drawdown in observation began, t well, B
. Minutes Days Feet
0 0 0
15 1.04 x 10.2 0.61
:30 2.09 1.04
60 4.17 1.28
90 6.25 1.50
150 ·1.04 x 10.1 1.85
210 1.46 2.01
270 1.87 2.12
330 2.29 2.1'7
390 2.71 2.24
510 3.54 2.27
630 4.37 2.31
750 5.20 2.35
870 6.05 2.38
990 6.88 2.40
1110 7.71 2.42
1230 8.54 2.46
1350 9.38 2.46
1900 0 1.:32 x 10 2.46
66
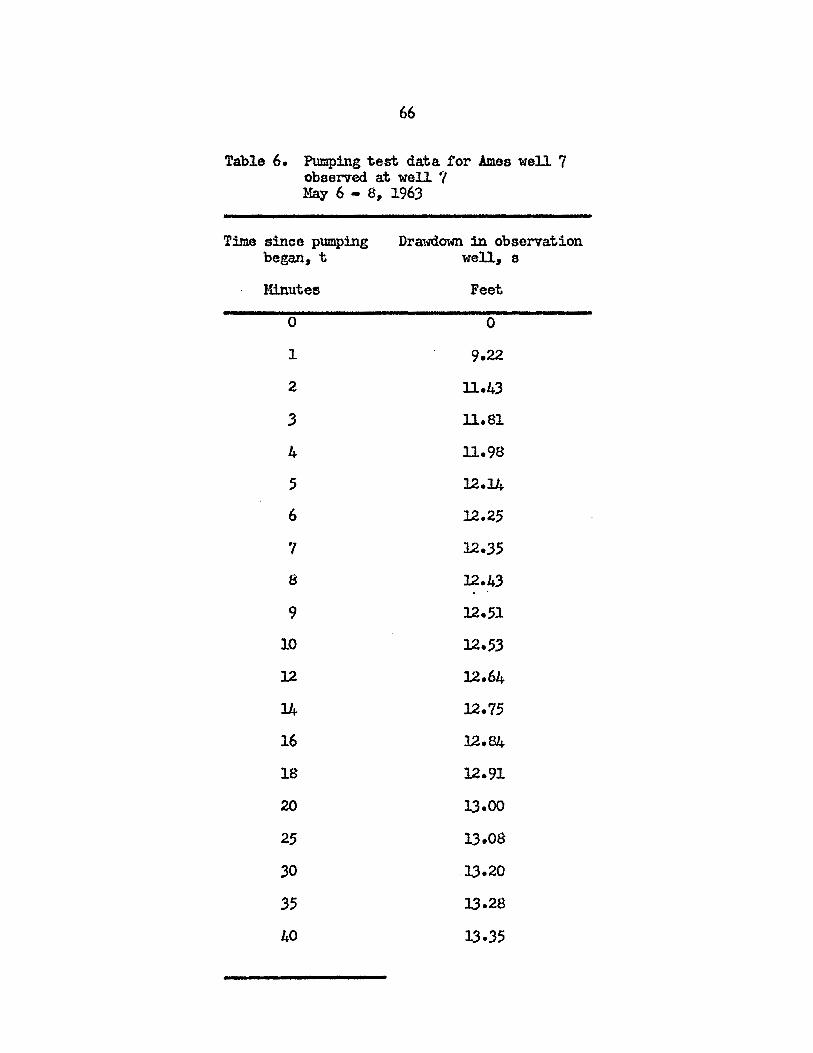
Table 6. Pumping test data for Ames well 7 observed at well '" May 6 - 8, 1963
Time since pumping Drawdown in observation began, t "Iell, 8
Minutes Feet
0 0
1 9.22
2 ll.43
3 U.81
4 1l.98
5 12.14
6 12.25
? 12.35
8 12.43
9 12.5~
10 12.53
12 12.64
14 12.75
16 12.84
18 12.91
20 13.00
25 13.08
30 13.20
35 13.28
40 13.35
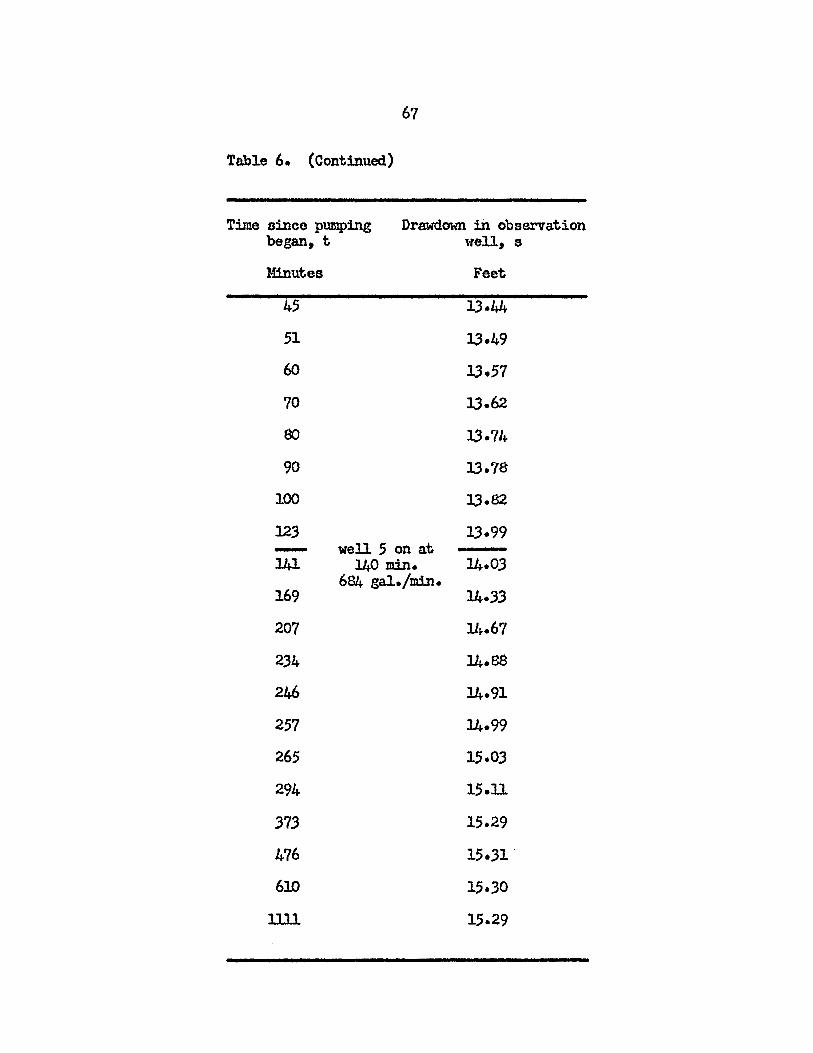
67
Table 6. (Continued)
Time since pumping Drawdown iil observation began" t well, s
Minutes Feet
45 13.44-
51 13.49
60 13.57
70 13.62
00 13.74
90 13.78
100 13.82
123 13.99 - well 5 on at -141 140 min. 14.03
169 684 gal./min.
14.33
207 lA.67
234- 14.88
246 14.91
257 14.99
265 15.03
294 15.11
373 15.29
476 15.31 .
610 15.30
1111 15.29
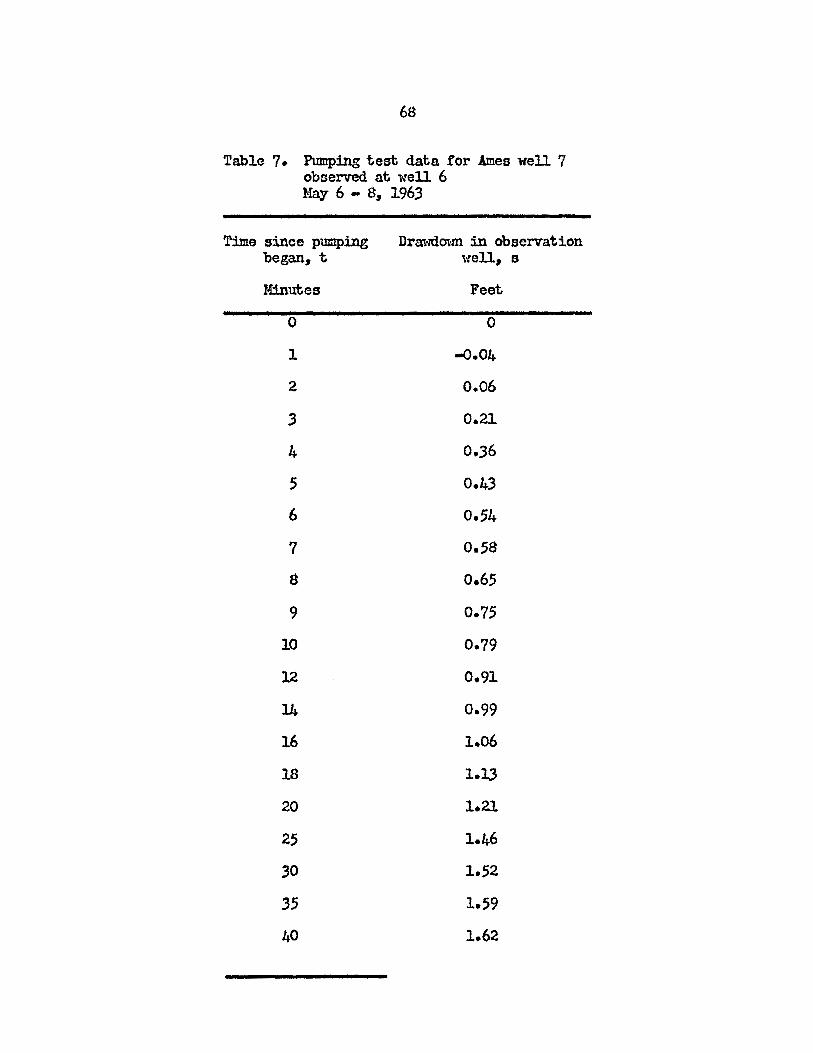
68
Table 7. Pumping test data tor Ames well 7 observed at well 6 l.{ay 6 - 8" 1963
Time since pumping Drawdovm in observation began, t ''lell, s
Minutes Feet
0 0
1 -0.04
2 0.06
3 0.21
4 0.36
5 0.43
6 0.54
7 0.58
8 0.65
9 0.75
10 0.79
12 0.91
14 0.99
16 1.06
18 1.13
20 1.21
25 1.46
30 1.52
35 1.59
40 1.62
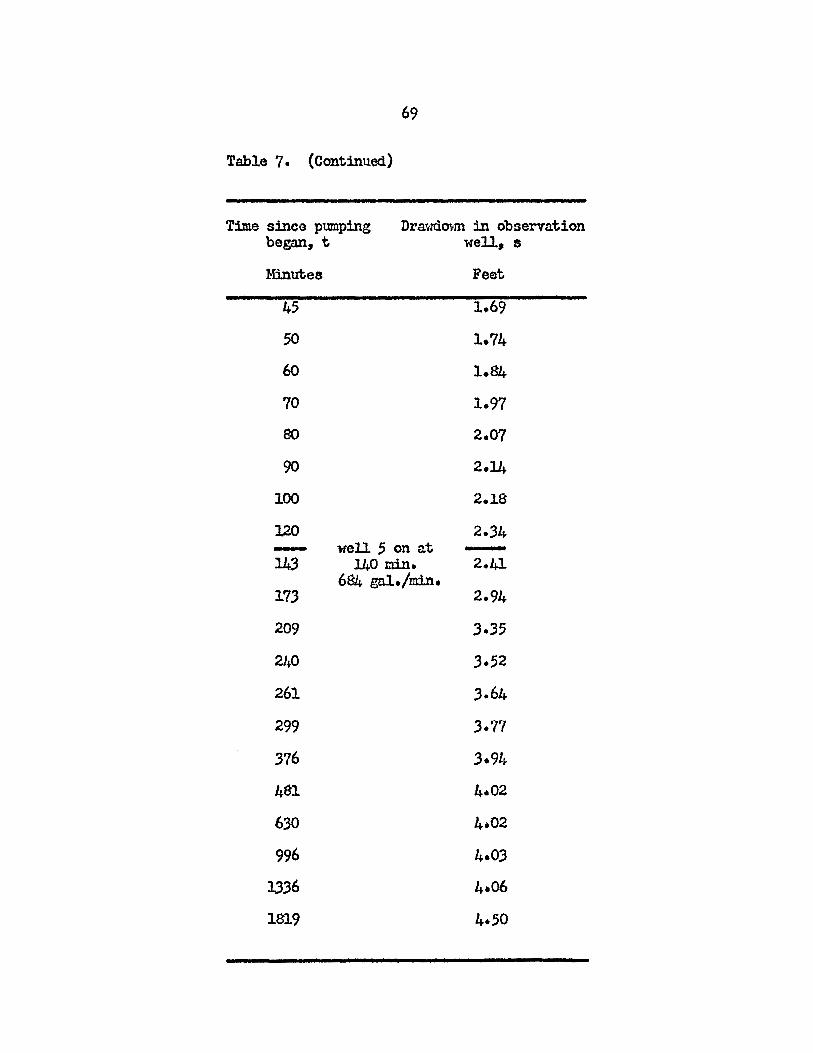
69
Table 7. (Continued)
Time since pumping Drawdmm :in observation began" t well, s
Minutes Feet
45 1.69
50 1.74
ro 1.~
70 1.97
80 2.07
~ 2.~
100 2.18
120 -~3 173
209
240
261
299
376
481
630
996
1336
1819
well 5 on at 140 min.
684 gal./min.
2.34 -2 • .41
2.94
3.35
3.52
3.64
3.'77
3.94
4.02
4.02
4.03
4.06
4.50
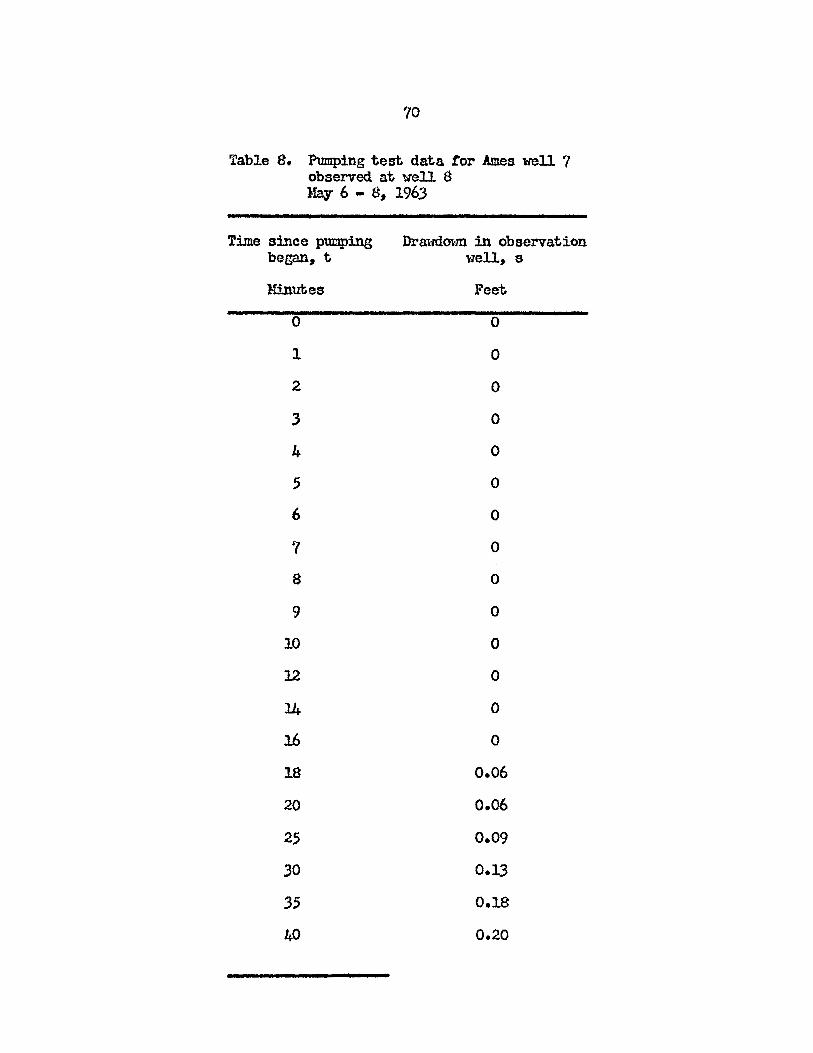
'/0
Table 8. Pumping test data tor Ames well 7 observed at l.zell 8 M'a.y 6 - 8" 196,3
Time since pumping Drawdo\'m in observation began" t well, s
~fi.nutes Feet
0 0
1 0
2 0
.3 0
4 0
5 0
6 0
7 0
8 0
9 0
10 0
12 0
14 0
16 0
18 0.06
20 0.06
25 0.09
30 O.l:;
35 0.18
40 0.20
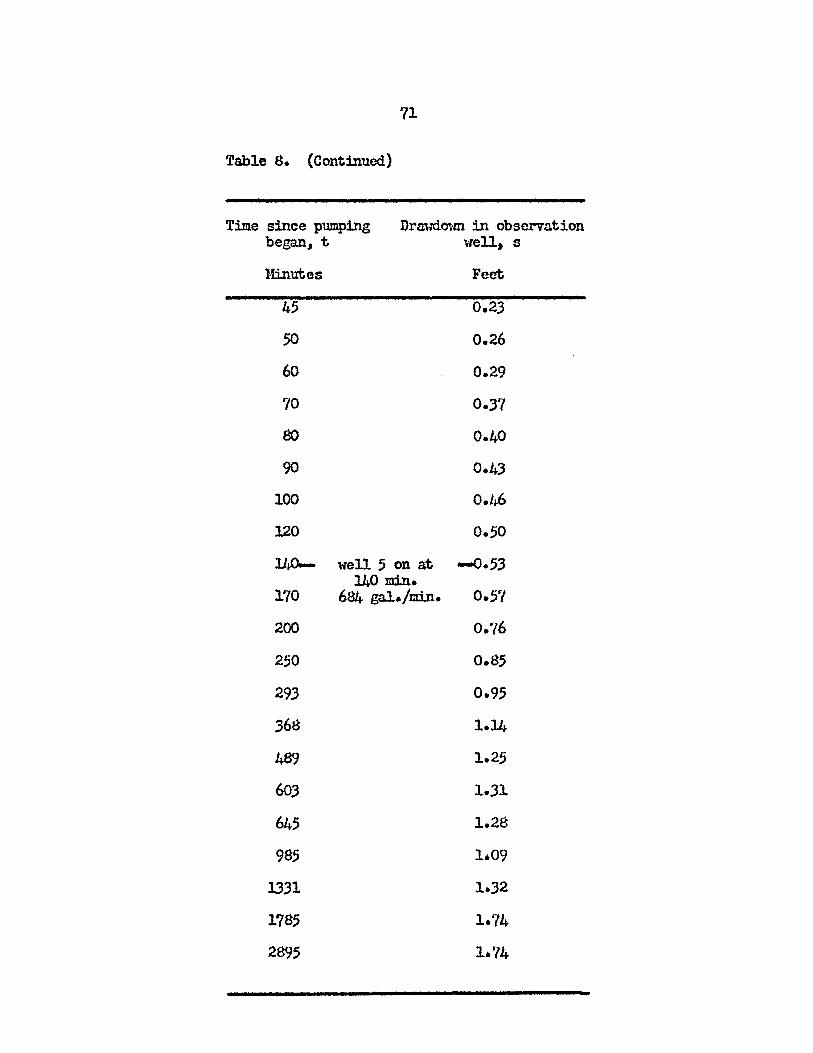
71
Table 8. (Continued)
Time since pumping DrmroO";m in observation began~ t well, s
Minutes Feet
45 0.23
50 0.26
60 0.29
70 0.37
80 0.40
90 0.43
100 O.l~
120 0.50
140- well 5 on at -0.5.3 140 min.
170 684 gal./min. 0.57
200 0.'/6
250 0.85
293 0.95
368 1.14
489 1.25
603 1.31
645 1.28
98; 1.09
1331 1.32
1785 1.74
2895 1.74
...
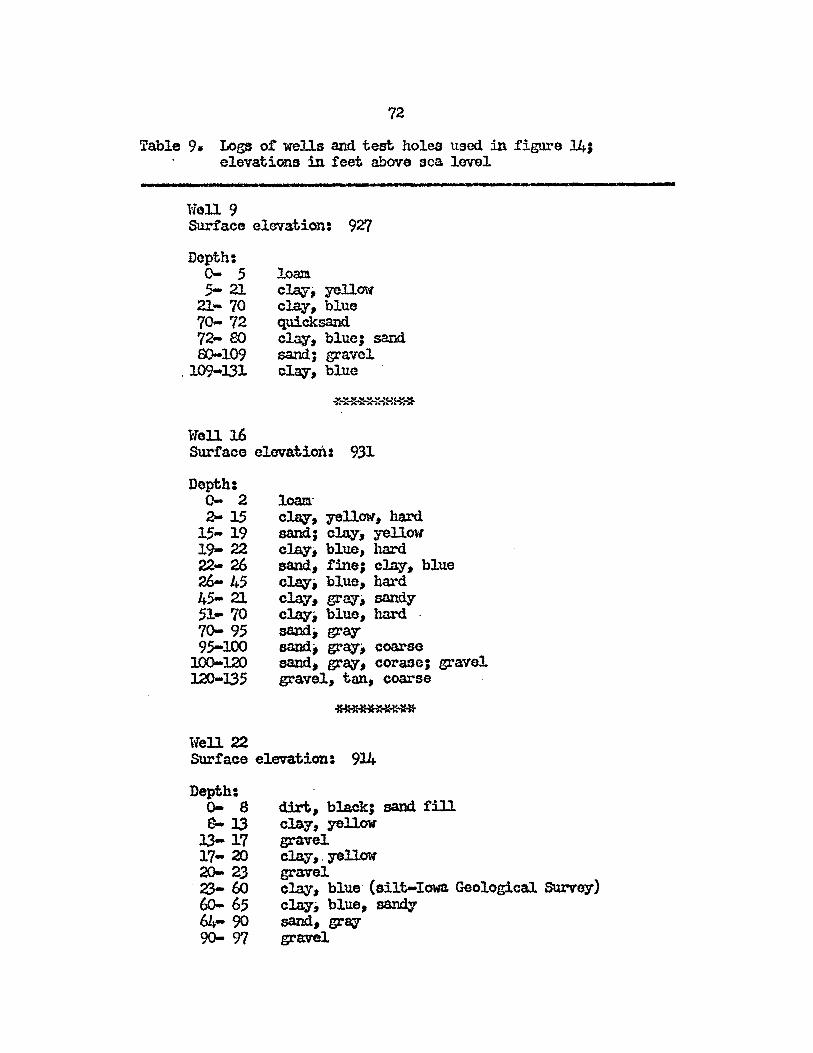
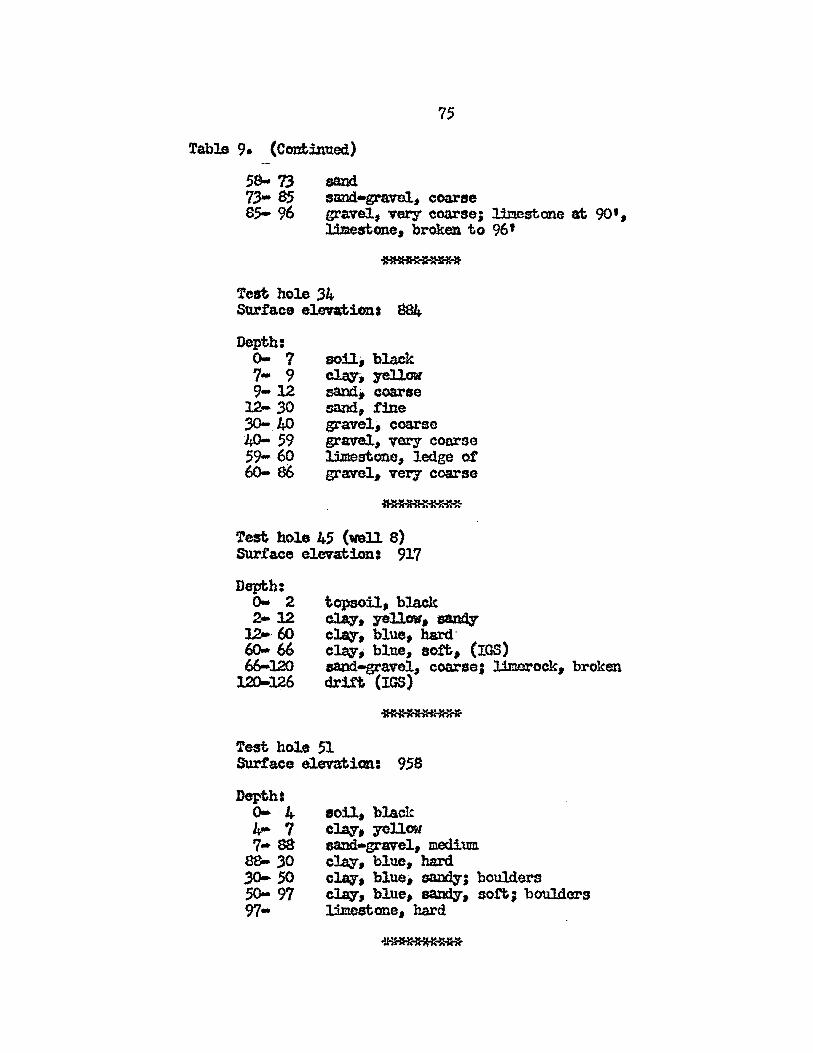
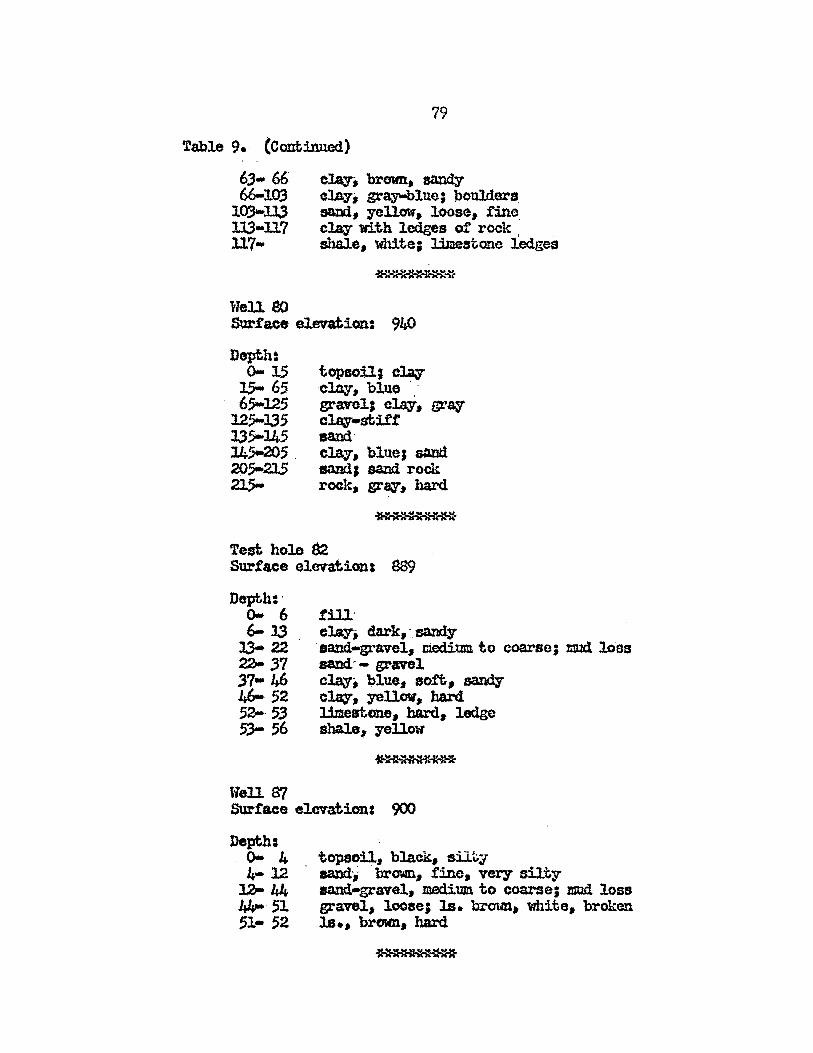
72
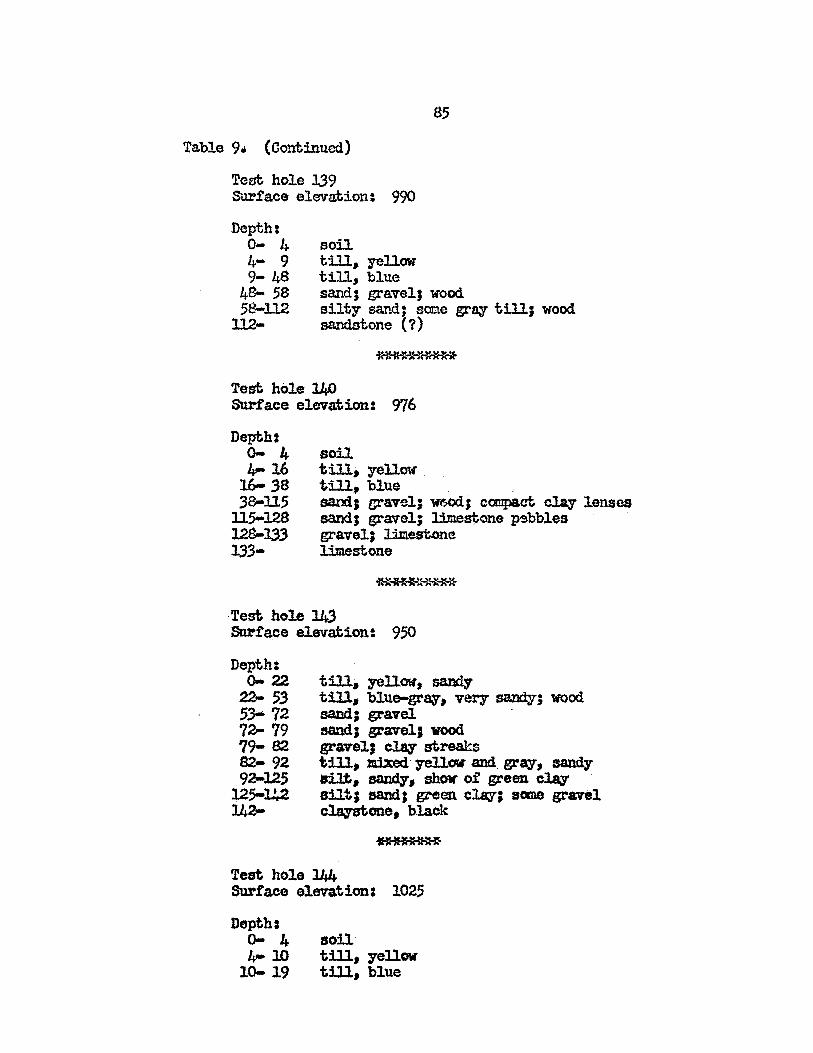
Table 9. Logs of wells and test holes used in figure 14J elevations in feet above sea. lovel
.. tr • • •••
11ell 9 Surfa.ce eleva.tion: 9Zl
Depth: 0- 5 5-21
21- 70 70.- 72 72- 80 00-109
.109-l31
1'TeU 16
loam clay, yellow clay, blue quicksand clay, blue; sand sa.nd; gravel clzo", blue
SUrfaoe elevation: 9.31
Depth: 0- 2 2-lS
15- 19 19- 22 22- 26 26- 45 45- 21 51- 70 70- 95 95-100
l.OO-12O l.2O-135
liell 22
loam: cUq, yellow.. hard sand J clay, yellow clay; blue, hard sand, fme; clay, blue c~, blue, hard clay, gray, sandy' clay; blue, hard sand; gray sand; gray-, coarse sand, gray, corase; gravel. gravel, tan, coarse
~
SUrface elevation: 914
Depth: 0- 8 S-13
13-17 17- 20 20- 2.3
dirt, black; sand fill claY', yellow gt"avel
-- -
23- 60 60- 65 64- 90 90-97
clay" yellow gt"avel clay, blue (silt-Iowa Geologioal SUrvey) c1o.y .. blue, sandy sand,gr8:J' gt"avel
••
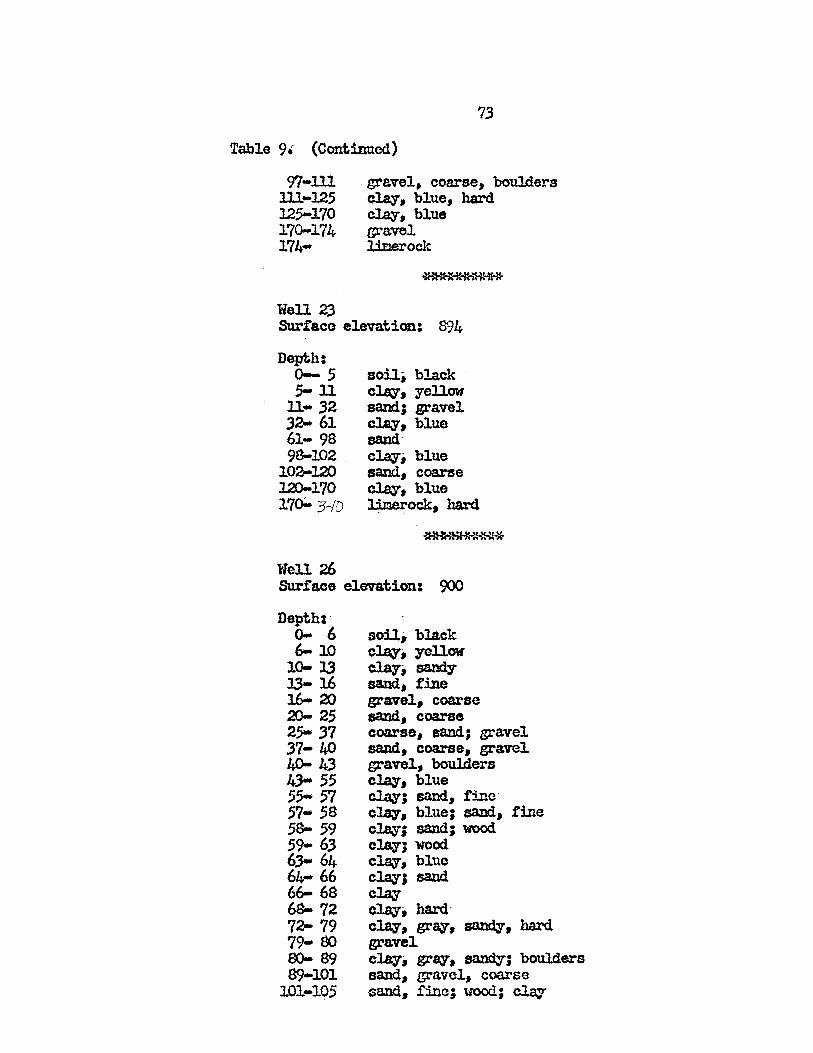
97-lll 111-125 125-170 170-174 174-
Well 2.3
73
gra.vel. coarse, boulders elay, blue, hard clq, blue gt'avel llmeroek
SUrface elevation: 894
Depth: 0-- 5 5-n
ll- 32 32- 61 61- 98 9S-l02 .
102-120 J.a)-170 170.;.. 3-10
Well 26
soU; black cla;y, yellow sand; gra.vel clay, blue sand clqi blue sand, coarse cla;:r, blue J.il:1erock, hard
Surface elevation: 900
Deptht· 0- 6 6-10
10-13 l3-16 l.6- 20 20- 25 25- 37 37- II) 40- 43 43- 55 55- 57 57- 58 58- 59 59- 63 6.3- 64 64- 66 66- 68 68- 72 72- 79 79- 00 so- 89 89-101
101-10.5
soU, black clay, yellow clay; sandy sand, fine gravel, coarse sand, coarse coarse, aand.; gravel sand, coarse, gravel gravel, boulders clay-, blue clay; sand, tine clay, blue; sand, fine c~J sand; wood clay; wood clq, blue cl.a\rJ sand elay clay, hard c~ , gray-, sandy, hard gt'avel clay. gray-, sandy; boulders sand, gravel, coarse sand, fine; wood; cUw
74
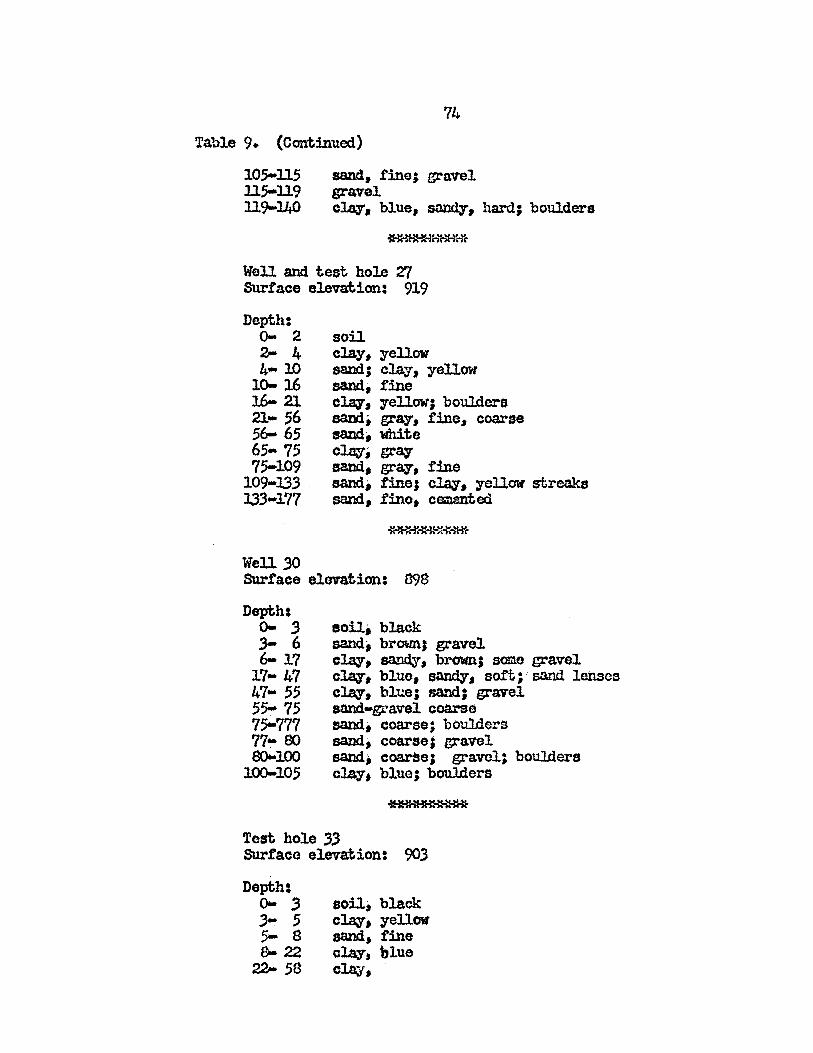
Table 9. (continued)
105-11.5 11.5-119 119-140
sand, fine J gravel gravel c~,blue, ~hh~;bo~d~8
Well and test hole Z7 SUrface elevation: 919
Depth: 0- 2 2- 4 4-10
10-16 16- 21 21- .56 56- 65 65- 7.5 75-109
109-133 133-177
Well 30
soU clay, yellow sand.; clay J yellow sand, fine clq, yellow; boulders sand; gray, fine, coarse sand, lfhite cln\r; gray sand, gray', f:lne sand, fine; ~, yellow streaks sand, fme. caumted
SUrface elevation: 898
Depth: 0- .3 3- 6 6- 17
17- 47 47- 55 55- 75 75-777 77 .. 80 00-100
100-105
eoU. black sand, brown; gravel clay t sa.tl.dy, brown; some gravel clay', bluo, sandy, soft; sand lenses clq, blue; sand; gravel sand-uavel coarse $alld.i coarse; boulders sand .. coarsej gravel sand, coax1Se; gravel; boulders clay. blue; boulders
~
Test hole .33 Surface elevation: 90.3
Depth: 0- .3 .3- 5 5- a 8-22
22- 58
soU, black c1a;r, yellow sand, tine cl..a3r, blue clay,
75
Table 9. (Conf;:inued.)
sand sand-gravel, coarse gravel, Tery' coarse; l.lnestone at 90', l..imestone, broken to 96'
Test; hole 34 Surface elevations S84
Depth: 0- 7 7- 9 9-12
12- 30 30-.40 40- 59 59- 60 60-·86
soU. black ~.t yellow sand, coarse sand, flne gravel, coarse gravel, very coarse l.lm.eatone ~ ledge of' gravel, very coarse
Test. hole 45 (wll 8) SUrface elevation, 917
Depth: 0- 2 2-12
12-. ro 60-66 66-120
120-126
Test hole 51 Surface elevation: 958
Derth: 0- 4 4- 7 7- as
ss- ,30 30- 50 50- 97 97-
eoU, black clay', yellow sand-gravel, medium clay, blue, hard c]q, blue, sa.Ildy; boulders c1q, blue, aand¥, soft; boulders l.1mestone, hard
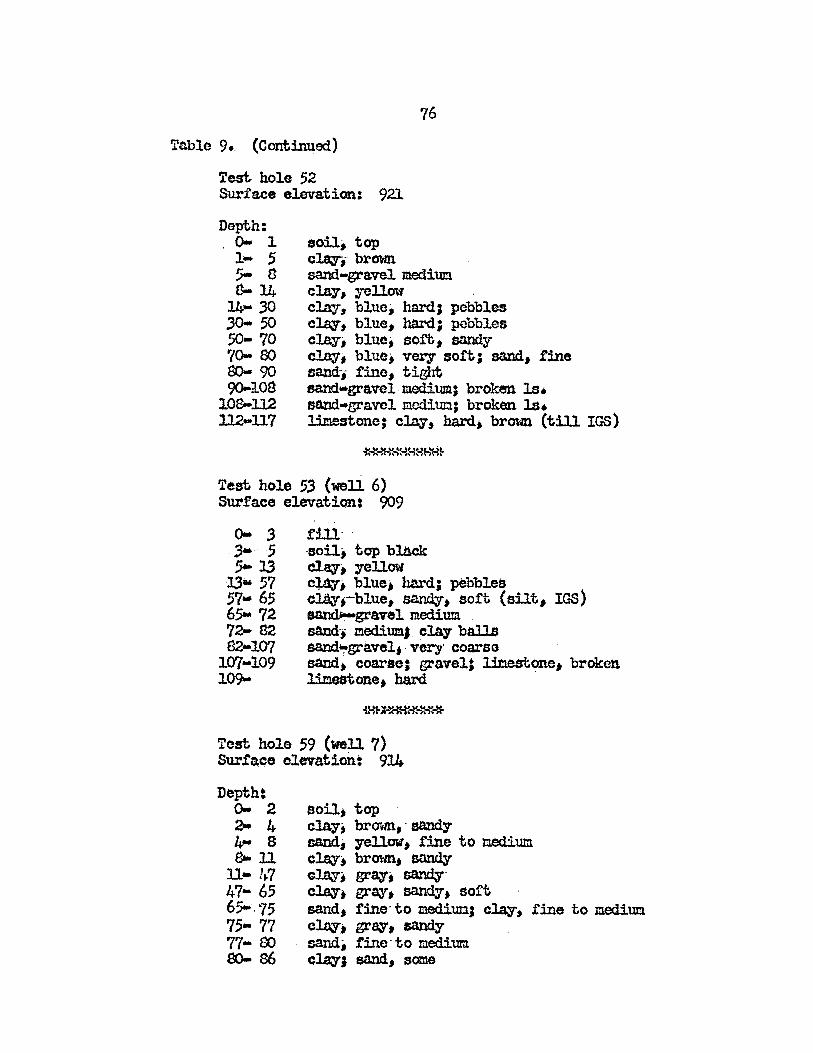
76
Table 9. (Continued)
Test hole 52 Surface elevation: 921
Da~h: ().. 1 1- 5 5- S 8-14
14- 30 ;;0- 50 50-70 70- 00 so- 90 90-108
108-112 112 ... U7
soU; top claTi brown sand-gravel medium clay" yellow clay" bluc; hard; pebbles C~, blue, hard; pebbles clay, blue, sOrli" sandy clay, blue, very soft; sand, fine sandi fmc" tight sand"gavel medium; broken la. sand-gravel mcdittJ:l; broken ls. limestone; clay, hard. brown (till IGS)
Test hole 53 (well 6) Surface elevation, 909
0- :; ;;-5 ·5-13 13" 57 57"'" 65 65- 72 72- S2 82-107
107 .. 109 109-
fill' . -soU, top black ~, yellow ~. blue. hard; pebbles cJ.a.;r .-blue, &a.n.dy, soft (sUt. lGS) sa.nd..i-gravel medium sand', mediumJ clay bal.ls sand~graveljver)' coarsa sand, coarse; gravel; lltteatonc, broken l:im.e8tone, hard
Test hole 59 (well 7) Surface elevation: 914
Depth # 0- 2 2- 4. 4- 8 B-ll
11- !1-7 47... 65 65-. '75 75- 77 77- 00 so- 86
soil, top cl,q, brown,' sa.ndy sand, yellow, fine to medium clay. brown, sandy ~ .. grq,~' ~; gray, sa.ndy' .. sort sand, fine'to mediun; clay'" fine to medium. C~i grq, sandy aandj fino'to medium clq, sand, some
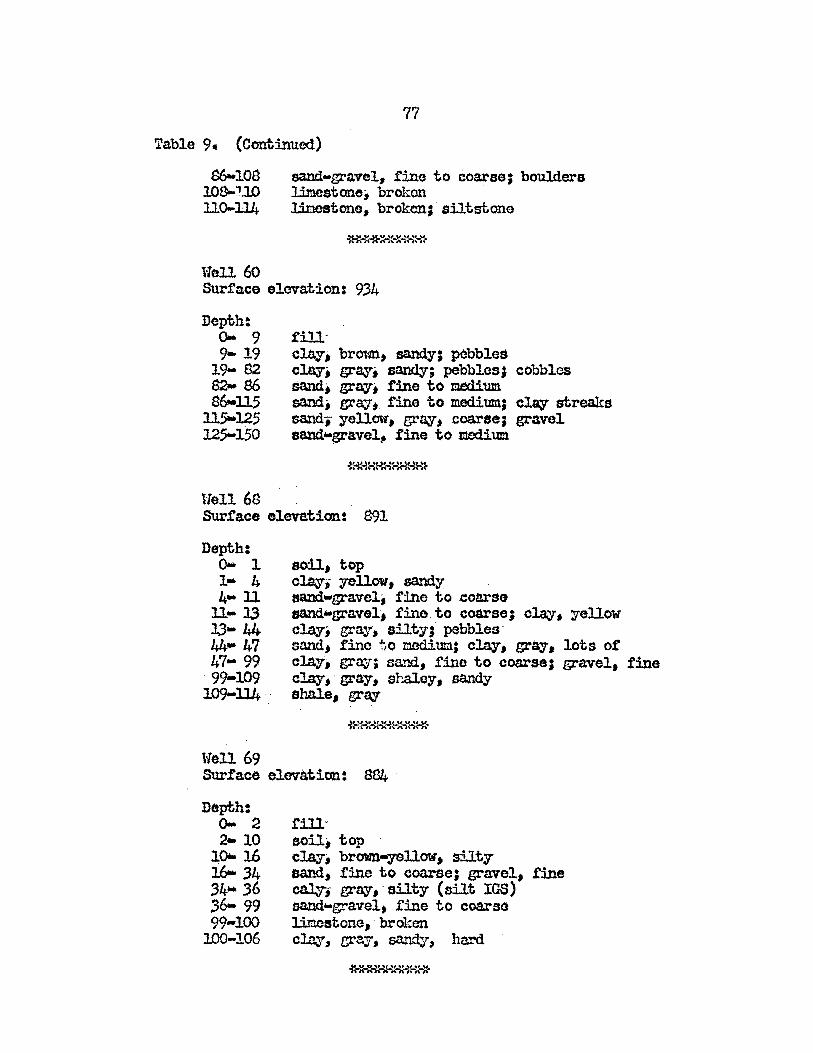
77
Table 9. (Continued)
$6..108 108-1.10 110-114
"lell 60
sand-gravel, fine to coarse; boulders limestone, broken . limestone, broken,· siltstone
SUrface elavation: 934
Deptht 0- 9 9- 19
19- 82 S2- S6 S6-ll5
115-125 125-150
tlell68
fill-clay, broun~ sandy; pobble,; clq. gray. sa.ndy; pebbles; cobbles sand. gray. f:1ne to medium sand. gt!a;y~ fine to medium, cJJq streaks sand. yellcnf, gra:'J', coarse, gravel sand-gravel, line to medium
Surface elevation: S9l
Depth: 0- 1 1- 4 4-11
11-13 13- 44 44- 47 47- 99 99-109
109-114
l1e11 69
8oil~ top clay, yellow, sandy sandwgt"avel; tine to .coarse SSlld-gr4vel. fino. to coarse; clay, yellow cla;r, gro:y, siltYJ pebb1es-sand, fine to medium; clay, gra::r, lots of claY, gray; sa.?J.d, fine to coarseJ gra.ve1, fine clay t . gray, sl'..aJ.ey, sandy shale, gra;y
Surface elevation: 884·
Depth: 0- 2 2- 10
10- 16 J.6... 34 34 .... 36 36- 99 99-100
100-106
fillsoil; top clay, brown-yellow, silty sand, fine to coarse; gravel, fine ca.J.y-;- gray,' silty (silt lGS) sand-gravel, fine to coarse limcstone,brOken clay" zray , sandy, hard
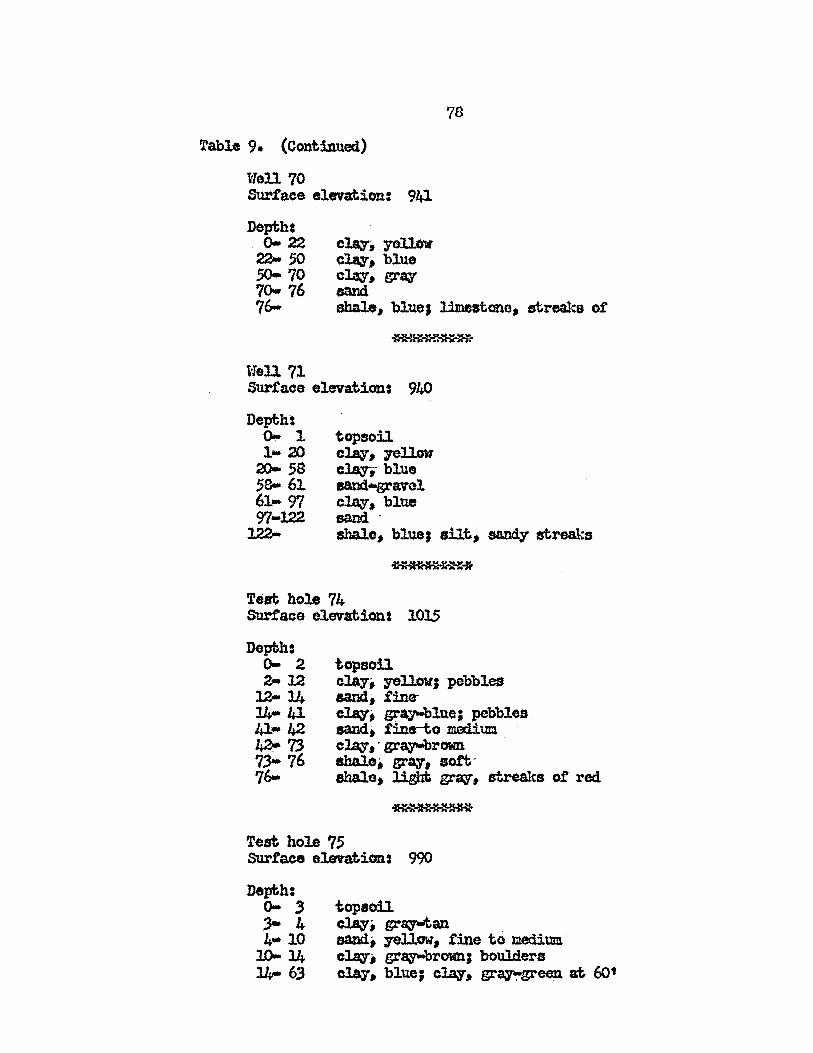
~able 9. (Continued)
lIeU 70 Surface elevation: 941
Deptht claJ', yel.l.ov clq. blue cl..t\v, gra:! sand
7S
.0-22 22- 50 50-70 70- 76 76- abale, blue, l:lmeatone, streaks of
vlell 71 Surface elevation: 940
Depth: 0- 1 1- 20
20- 58 5a- 61. 61- 97 97-122
122-
Teat hole 74 Surface elevationt 1015
Depth: 0- 2 2-12
12-14 14- 41 41- 42-42-73 73-76 76-
Test hole 75 Surface elevation. 990
topao:U clq .. gr'q-tan. ~;~.t:1neto~~ cl..rq. grau-brmm, boulders clay .. blue; clair, gr~green at 60t
79
Table 9., (Continued)
6J. 66 clIq. brown, aa.ncty 66-103 clay; gray-blue; boulders,
l0:3-113 sand, yellow. loose, finc, l..13-117 clay with ledges oi' rock, ' ll7- shale, white, lime:stone ledges
lIeU SO Sur~aoe elevation: 940
Depth: <>-15
15- 6.5 65--125
125-135 135-145 145-205 ' 205w2l.5, 215-
, topaoUI c~ cln.y', bllla " gravel, c~, f!}:q clq-sbif'! sand clay, blue, $And .and, eami rock rock, grtq, hard
Test hole a2 Surface elevation* SS9
Depth: ' 0- 6 6-33
J3- 22 22J- 37 37- 46 46- 52 52- 53 53- 56
Well. frl
fill' c~ dark,' sandy 'sand-gravel, medium to coarse; mud loss saud: - gravel clay; blue, 80ft., sandy clay, yellow, hard limeatone, hard, ledge shale, yellow
SUrface elevation: 900
Depth: ,0- 4
4-12 12- 44 44-' .51 51- 52
topsoU, black, BiJ:'.;.:r ~, wQm,fme.~sUty aand-gravel, mediUJjl to coarse; mad loss gravel, loose, ls. braun .. white, broken lB ... brown, hard
~
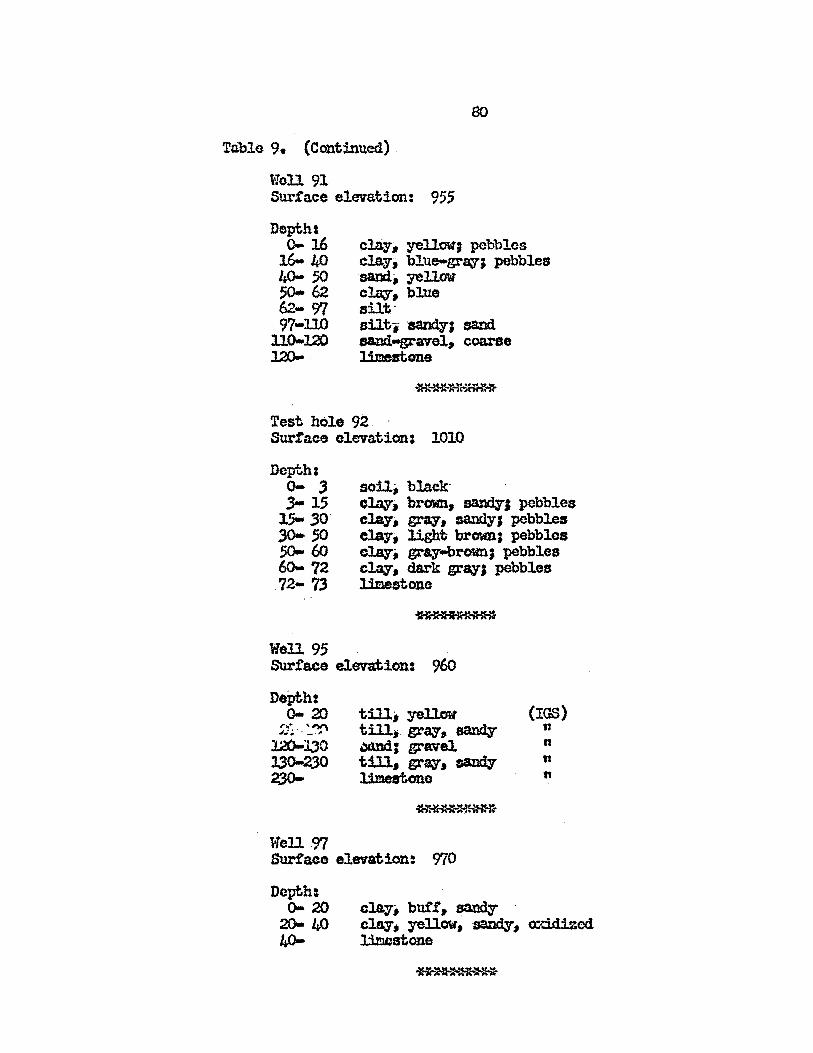
Tablo 9. (Cont:!nuoo.)
Woll 91 Surface elevation: 955
Depth I 0-1.6
16-40 40- 50 SO- 62 62- 97 97-llO
clay. yel.low; pebbles clay', blue-gr~;. pebbles sand, yellow
110-120 120- .
cl.a\r f blue sUt, sut, 'sandy; aa.nd aand-gt"avel, coarse limestone
Test hole 92 Surface eleva.tion: 1010
Well 95 SUrf'ace eltmd;ion:960
Depth: 0-20
Well 97 Surface elevation: 970
Depth: 0-20
2().. 40 /.IJ-
(lGS) n n It
n
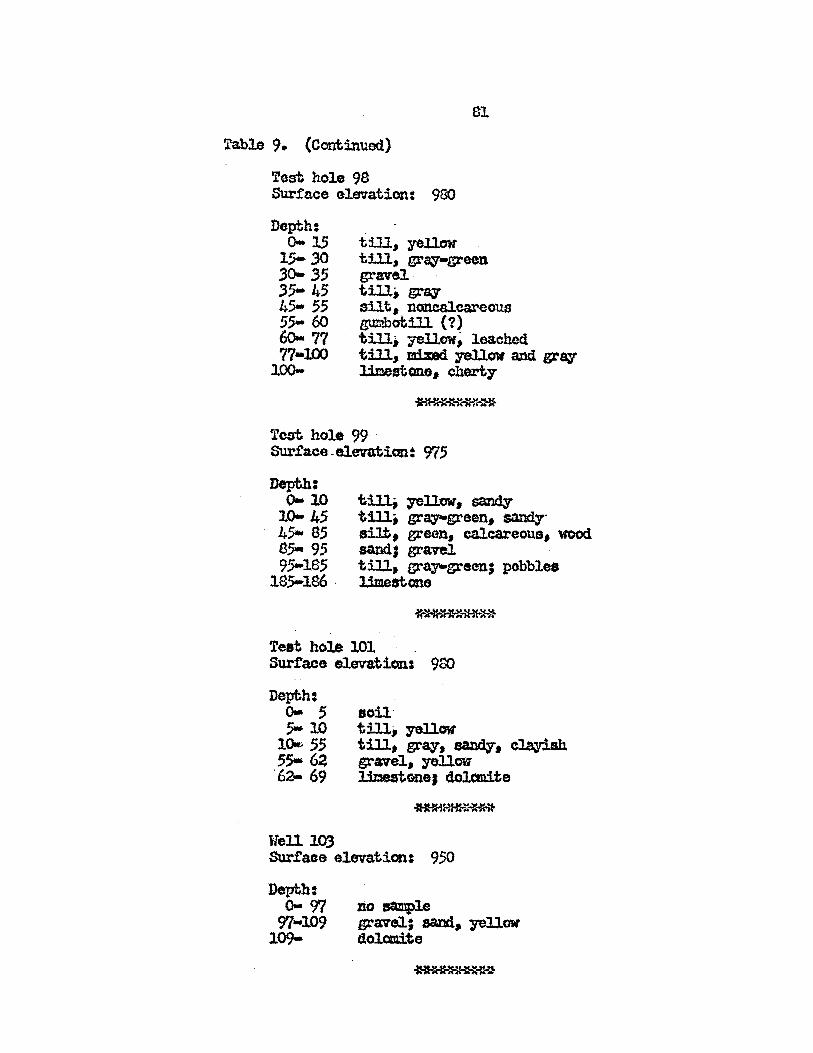
81
Table 9. (continued)
Test hoa 98 Surface elevation: 980
Depth: 0-15
15- :;0 3<>- 35 35- 45 45- 55 55- 60 60- 77 77-lIXJ
100-
till, yellDw till, gl'q-green gravel. till, £!I:tq silt, nonealcareous gurtlbotilJ. (?) till, yellow~ leached till" mixed yellow and grq limestone, chert,.
Tost hole 99 . Surfaeee1evationt 975
Depth: 0-10
10- 45 45- 85 85- 95 95-185
185-186 .
till; zrel.l.tM, sandy till. £!I:~een. sa.nd3" ailt, green, eaJ.c:areous, \'IOCc1 sandJ gravel till, grayo-green; pGbblos Umeatcme
Test hole lOl . . Surface elevation: 900
Deptht 0- 5 5-10
lOw- 55 55- 62 '62- 69.
Uelll.03 Surfaoe elevation: 950
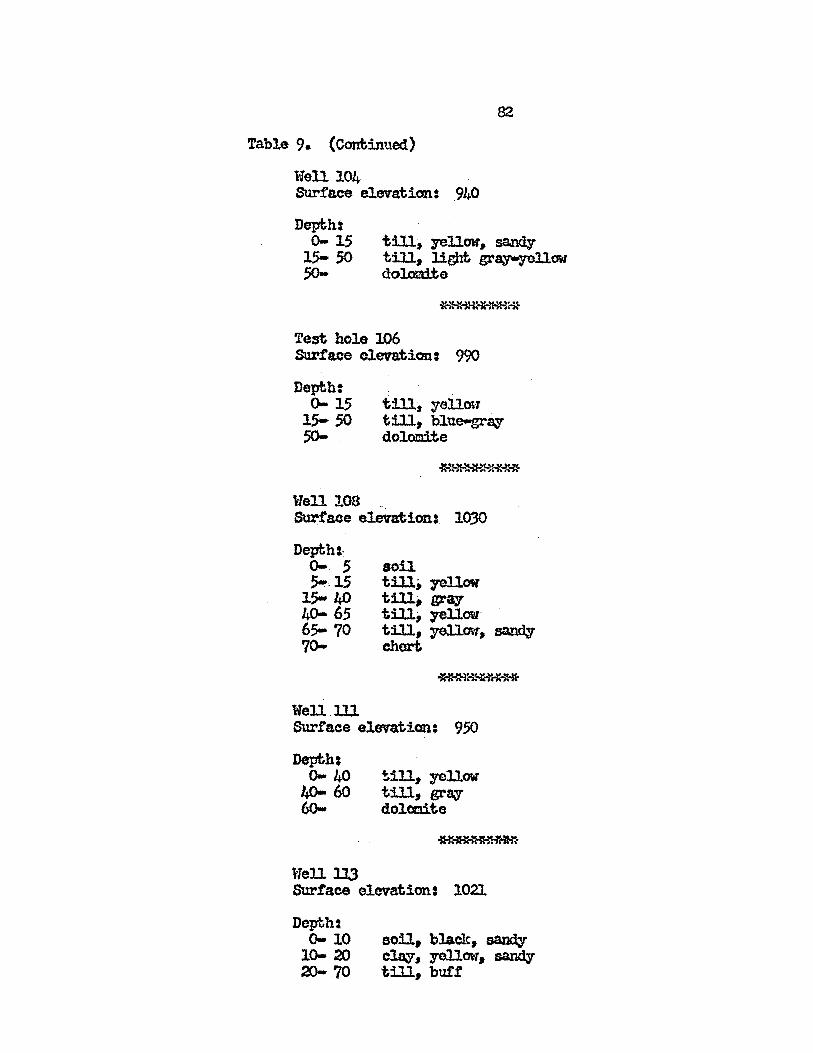
Table 9. (Continued)
W'ell104 SUrface e1evation: 940
Dept;h: 0-15
15- SO so-
Test hole 106 SUrface elevation: 990
Depth:
82
0-15 15- SO 50-
till, yellow . till, blue-gr~ . dolomite
We11108 _ SUrf'aoe elevation.. 1030
Depth:~ 0- 5 ~,15
15- l.;O IJ)a 65 65- 70 70-
Well.lll
soil tillJ )"GIlow till, gray till, Jel.low till, yollow, sandy chert.
Surface elevaticm.: 950
ilell1l3
~1ll, yellow till, gray dolce.ite
Surface elevation: 1021
Depth: 0-10
10- 20 20-70
Boil, black, ~ c~, yellow, ~ t:Ul,buf't
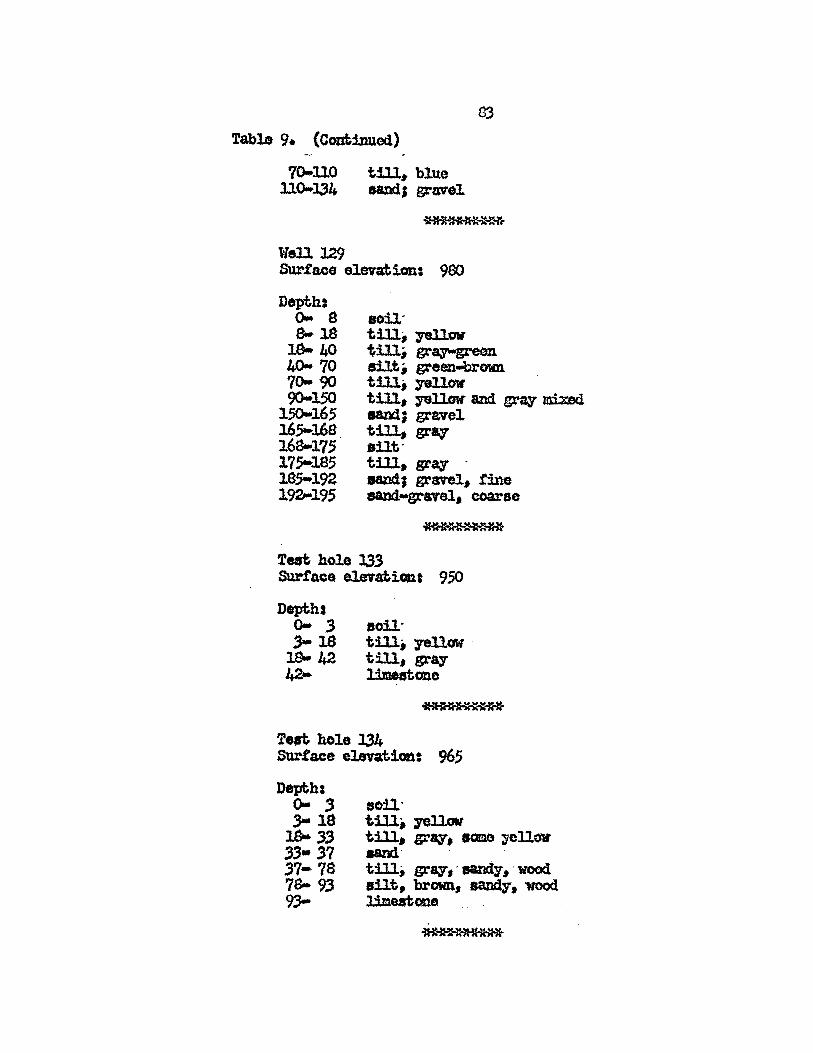
Table 9. (Continued)
70-ll0 till, blue U<>-l34 sand, gz:oavel.
Well 129 SUr.tace eleva;t.icm.l 900
Depth: 0- a g..·lS
19-40 40-70 70- 90 90-~50
150-165 165-168. 16S-175 175-185 18.5-192 192-195
sou-till. ,..nov tUl; grq-green aUt, green-brown till, yelloW tID. yellow and gray mi:md 88lld; gravel tU4 grq sUt-till. gray -aa.ndJ gravel, fine aand-gr:avel.; coarse
Teat hole 133 SUl"face e.leYationl 950
Depths 0-3 3-18
J.8- 42 42-
eoU-till; 78llow . till, gray l:imeetone
T-.t heJ.e 334 SUrface elevatiOl'1I 965
Depth: 0- .3 .3- IS
l.S- 33 33-37 37-78 78- 93 93-
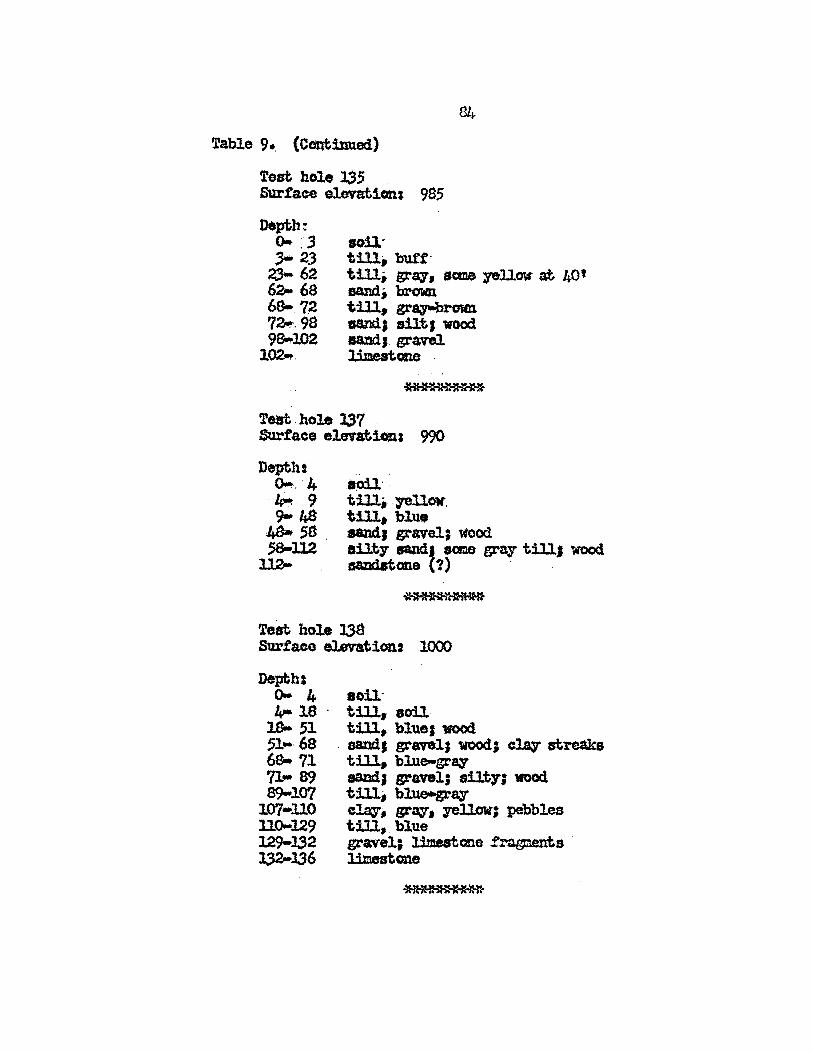
Table 9-, (Continued)
Test hole 135 SUrface elevation; 985
Depth: 0- :3 3- 23
23- 62 62- 68 68- 72 720..98 9&.102
102 ....
soU' till, butf-till, ~tJ:3, SaII& ~llow at 40' sand, brown till, gr~ sand., silt, wood eand, ~avel l:i.mestone
Teat . hole 137 Surface elevation I 990 .
Depth I ~.·4
.4-t. 9 9-48 ~5S 58-112
112-
TeSt hole 13S SUrface elevations 1000
80U-till,8oU till, blue. wood
. aand, gt'"avelJ wood, clq streaks till" blue-grq sandJ gavel, siltYJ wood till, blue-gray c1tq, gray', yellow; pebbles till .. blue gravel, lime8tone ..f~s l.:1mestone
85
Table 9. (Continued)
Test. hole 139 Surface elevation: 990
Depth: 0- 4-4- 9 9- 48
48- 58 58-112
ll2-
soU till. yellow tilll blue sand, gravel I wood silty sandI some q;:a:F till; wood sandstone (?)
Tesf# hole l40 Surface elevation: 976
Dephh: 0- 4-4t- 16
16- .38 38-115
115-128 128-:13.3 :13.3-
soU till~ yellow . till. blue ; sandJ gravel; w60dJ caupact clay lenses sand; gravel; limes1;one psbbles gravel; limestone limestone
·Test hole 143 Surface elevation: 950
Depth: 0-22
22- 5.3 5.3- 72 72- 79 79- 82 82- 92 92-125
125-l!.2 142-
till. yellow, sa.ndy' till .. blue-grq .. very sandy; wood sand; gravel eandJ gravel, wood gravel, cla;r streaks till, mixed·,.-eJ.1ov and. gray, sandy 811t, san.d1', show of' green cllQ' silt; eand J green cla~n some gruel claystone, black
Test hole l44 Surface elevation: 1025
Depth: 0- 4 4-10
10-19
soU tUl, 7ell.ow till, blue
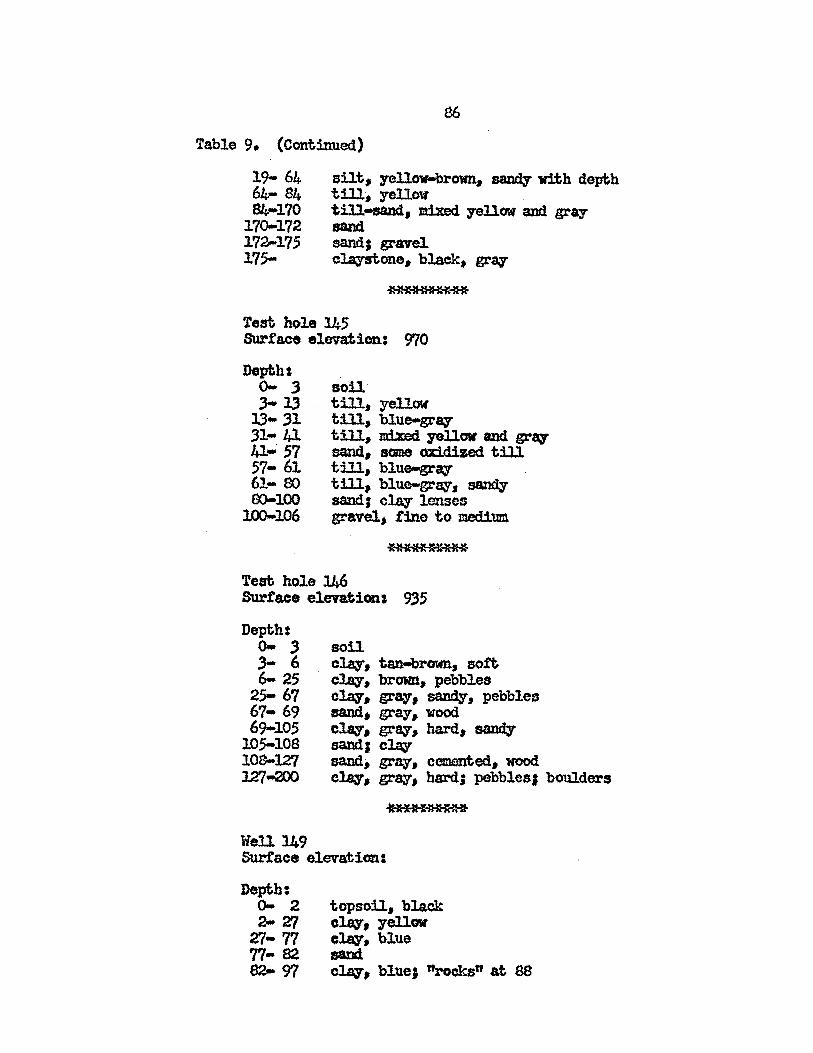
Table 9. (Continued)
19- 64 64- 84 84-170
170-172 172-175 175-
silt. yell.ow-brown, sandy with depth till, yellow tUl-sand, mixed yellOW' and gray salld sandI gravel cl.aystone, black, gray'
~
Test ho1. 145 SUrface elevation: 970
Depths 0- .3 3-13
J3. 31 .31- U 41- 57 57- 61 61- 00 00-100
100-106
soU till, yellow till, blue-grq till, mixed. JOllow and grq sand, Bome oxidized till till, b1ue-grq . till, blu.e-gr~. sandy sandJ clay l.enses gravel .. tine to med..i.um.
Teat hole 146 SUrface elevation: 9.35
Deptht 0- 3 3- 6 6- 25
25- 67 67- 69 69-105
105-10S 108-127 127-200
Wen 149 Surface e1ev8tian:
Depthl 0- 2 2-'Z/
Z/- 77 77- B2 82-97
topsoil, black cla¥, yellow cla¥. b1ue sand c1q, blueJ "rocks" at 88
Ta.b1e 9. (Continued)
c1q, blue, l.:imestone fragments lineatone ehale. hard
Test hole 152 Sur.tace elevation: ert6
Depth: 0- S 8-l3 .
l3-33 33- 63 63- 68 6a-7S 75- 00
clq, sUty cl.q " silty, sand.y sand~ medium; gravle, fine aa.nd., f:ine to nedium sand, cl.a;r lenses sand coarse, gravel; clay, some shale. medium hard
Test hole 156 Surface elevation: 914
Depth: 0- 4 sand 4- 59 glacial c~, sand7. boulders
Well 159 Surface elevation: 945
Depth. 0- 2 2- 25
25- 62 62- S9 89-109
109-1l4 114-
Well 161 Surface elevation: 1030
Depth: 0- 4 4-15
15- 25
soU clq, blue clq,78llow
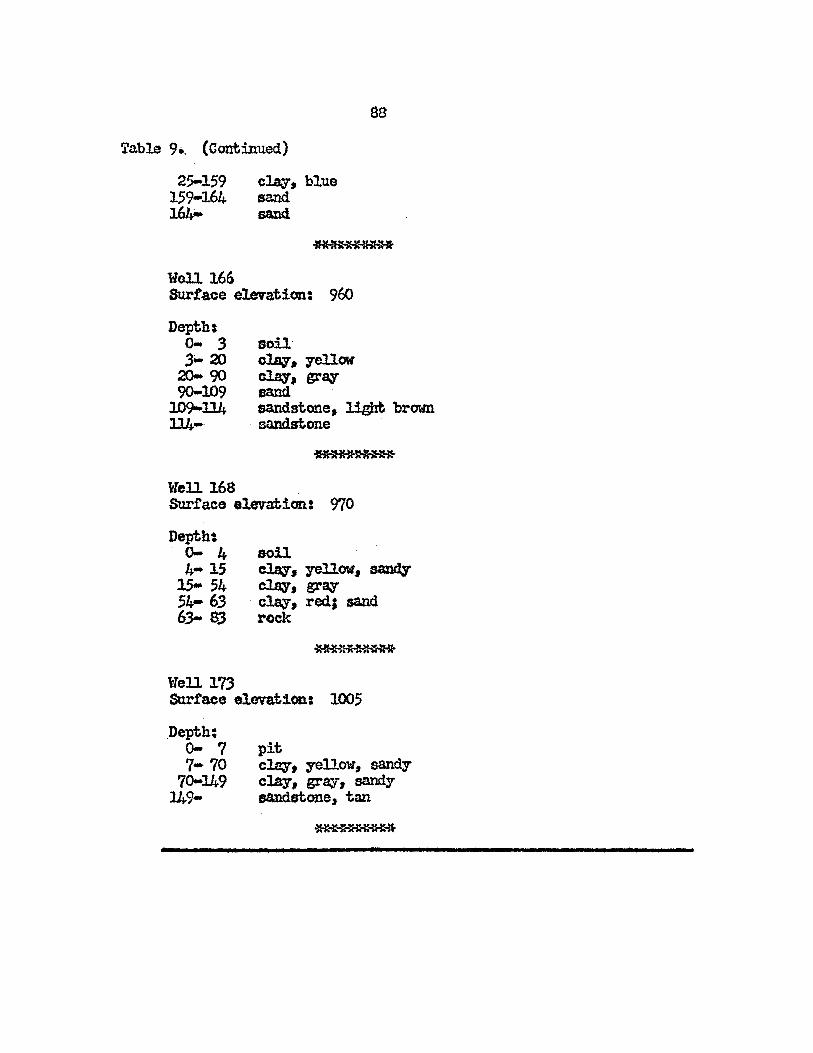
2.s-159 159-164 16Jv-
Well 166
clay, blue sand sand.
88
Surface elevation: 900
Depth: 0- :3 3-20
20- 90 90-109
109-114 114-
Velll6S
soil clq. yellow clq, grq sand sandstone, light brown sandstone
SUrface elevation: 970
Depth: 0- 4 4-15
15- 54 54- 63 63- S3
llell 173 Surface elevation: 1005
Depth: 0- 7 7-70
70-149 149-
pit c~ t yellow, san.d.3'" clay, gray, sandy sandstone, tan

Figure 12. &se map. shou1ng locations of wells and test holes
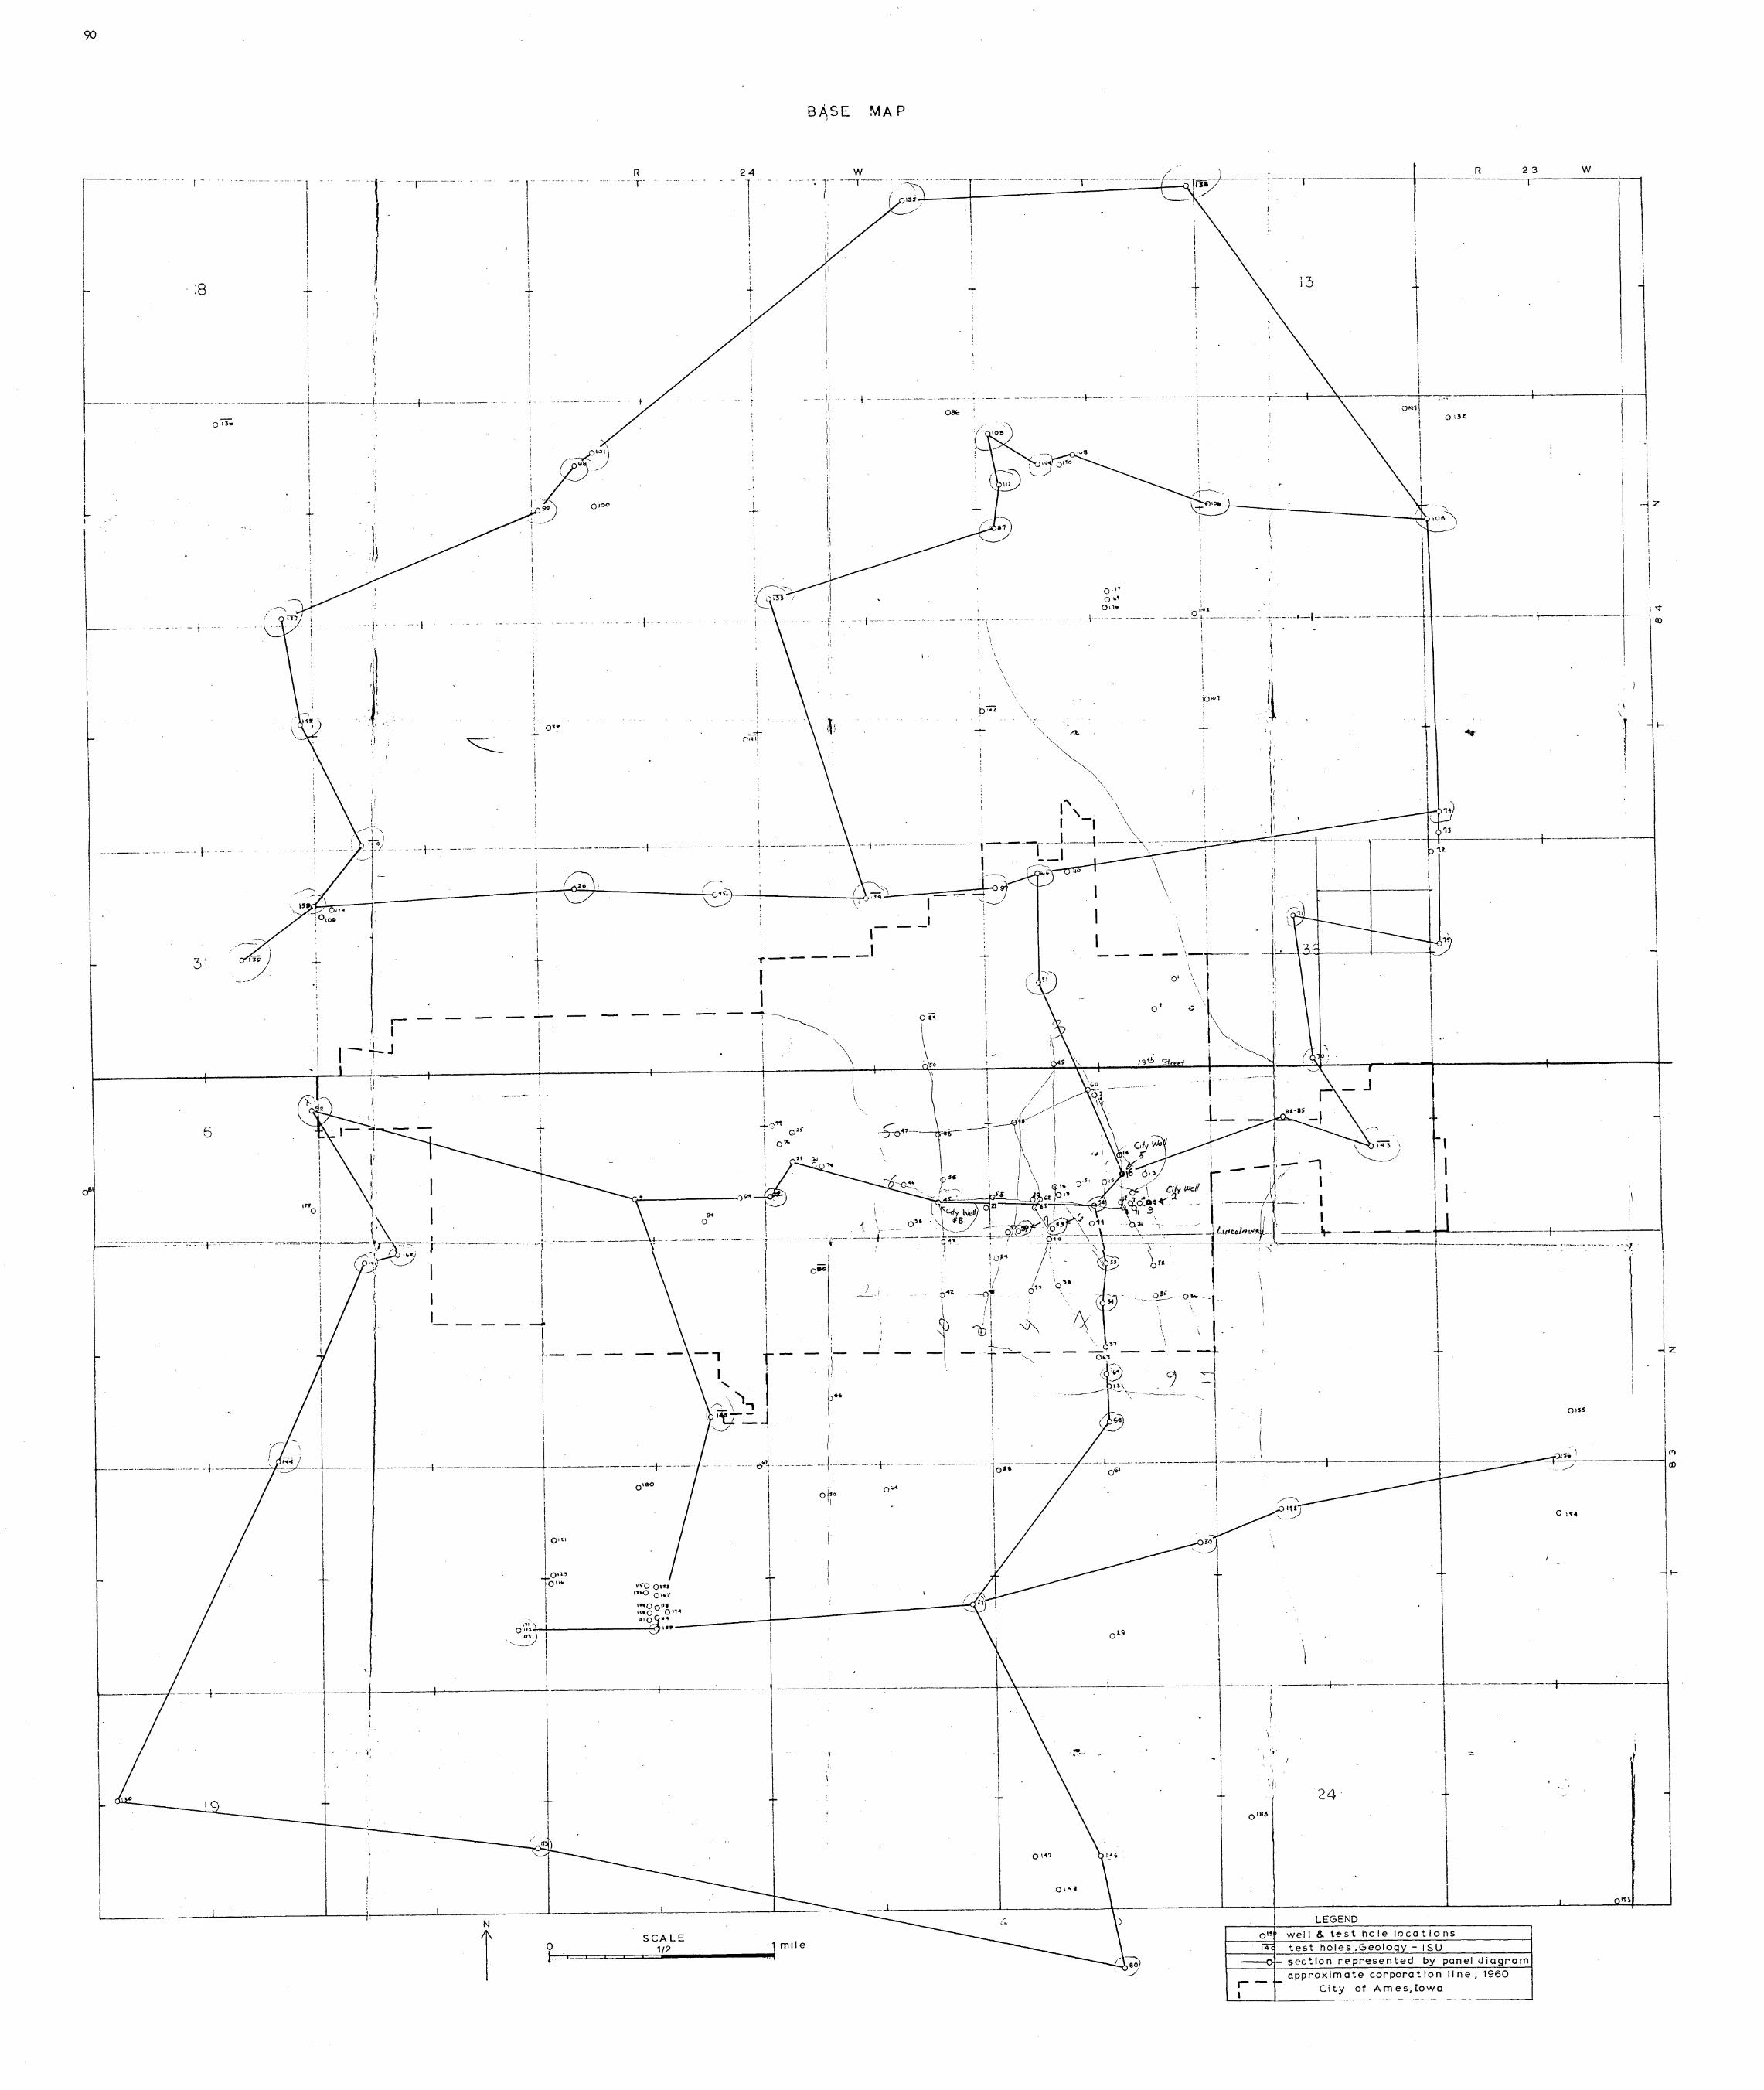
I I I I
90
i ! ,
i
j , l-I ,-.I
I
~ ,
d"
:8
.---- ----1
I 1
I i , I ! ,
+ I
r , 1 I
1
I' I'
"
t
! (
-.- r·---- -- -
--- ----------1------ - -.--- ---t--------~-------+----.
o~
,
-l-.
j -- j
.1
I ;1
I
r I !
j
, , - -f .. ,
R .-- r
t-
24
1 i , I
, ,
.... I
i -~
1 .
MAP
I ,
I' I I
__ I~ . \ _______ . __ !
I i',
,I ,I
-. - t - .. ---- - -.. - ..
, '
---- -- - ----- 1"-- --- ------('--- I~------;----r------------i--- .. ----'--n--
~.- ,.,
·1 , I
I I 1 1
I 1 I + ;3
-- - .----. ----- --+--.. - -- ----.-.-. -- '-, ---·-·-'-----T-·--t----.......
\
\
b~
0 11'
Oli .. , 011.
. - . 1---- ----
iOlO1
I I f-'-'-I- ---.- .------- -- _J\,
1 , ! ! ,
! t I I 1
1
I 1.
23 w
" \
,1
! I
11-I
I I I
i"\ \
- - j -.-- - .. ---------- .. -- ,-.---- - __ LL= .. ~-~~-=--=-~\~~~'·,\,~.·\·~:::::·~--f'-~--~--~--~-~-4~j--~--~-~--1-~--:::::--=--=-T=-=--=---::--+1-1-3------1--------I L_I_ p~~ 1_ ----.. 0 'I I
.. -. ----- t------- ---------t-----:-- ---
!
, - -- ...... _-"---_._-_._----- I . ---J
3'
"
I J
I-
I
I-I J r
I 1-
+ !
i
+
, 'J
i ! i
I --Jo
I 1_ I
i , I , , i I -- , ,
+--J~j--.- ---·--·4-·------------ j--' ------~,~~ I I. I ! ,
, Oltl
0 11.' +1011t.
,liO O'~J
/~
d-r---I-.------.....i...,..1
1
r-----I I
94 o
-, I
I ~-~
, _ .. --- -,. - . .,.. ------ - --
I '
"
I 0'"
I i I
I r-.,'" \ "l.,
I ttl ..:. I .j l
I I
.-- ---o"l-----
I I ,
I --I
/
-t
-'
0""
--tJ Ii II
I', «~ L
~ , ;
\ \
-',-t---, ,
0' \ I 0' '"
13~ S-Ir
j 1_
i
. L ..o1~
- ~-3'-'-+-----+-----tJ
I
I I ..
i .L i
I I O)~S
I 1
~z I
I I ----+~6;- ------------j -----' ----.-+--------+---- --::::;--"","-=1F~':'·;--'---------1:
I I ! Ol'H
30 I I
! 1'\10{) 0 •• 1"
! "'00·' :_----+-------------"':~ \1 •• 0 0,11 "0 .,~.3" o 111, "\"~--------~ 11f' n'
T I , I I
I
+ I
I I
-1- --' ------------+--~r I ) \ .
! I,
-------
.----4-----J ------------t------------- --- ~----.--------
I t
..
0~9
-T-------f--
.~--
0 147
0' ~.
1 ---.----.. -.
"
0 183
, I I I
--+-------, -t---------·-t---'---·-------1
24
\ ,t
~ ______________ L_ _______________ L_ __ __1\-, ________ ~ _________________ J_ ____ __ __ I
N
I SCALE o 1/2 1 mile ~I~======~------~I
I~ 'J
r I
14
LEGEND well 8. test hole locations test holes ,Geolog - ISU sec':ion represented by panel diagram
approximate corpora~ion line, 1960 City of Ames,Iowa

91

Figure 13. Contour map of bedrock configuration of area investiga.ted
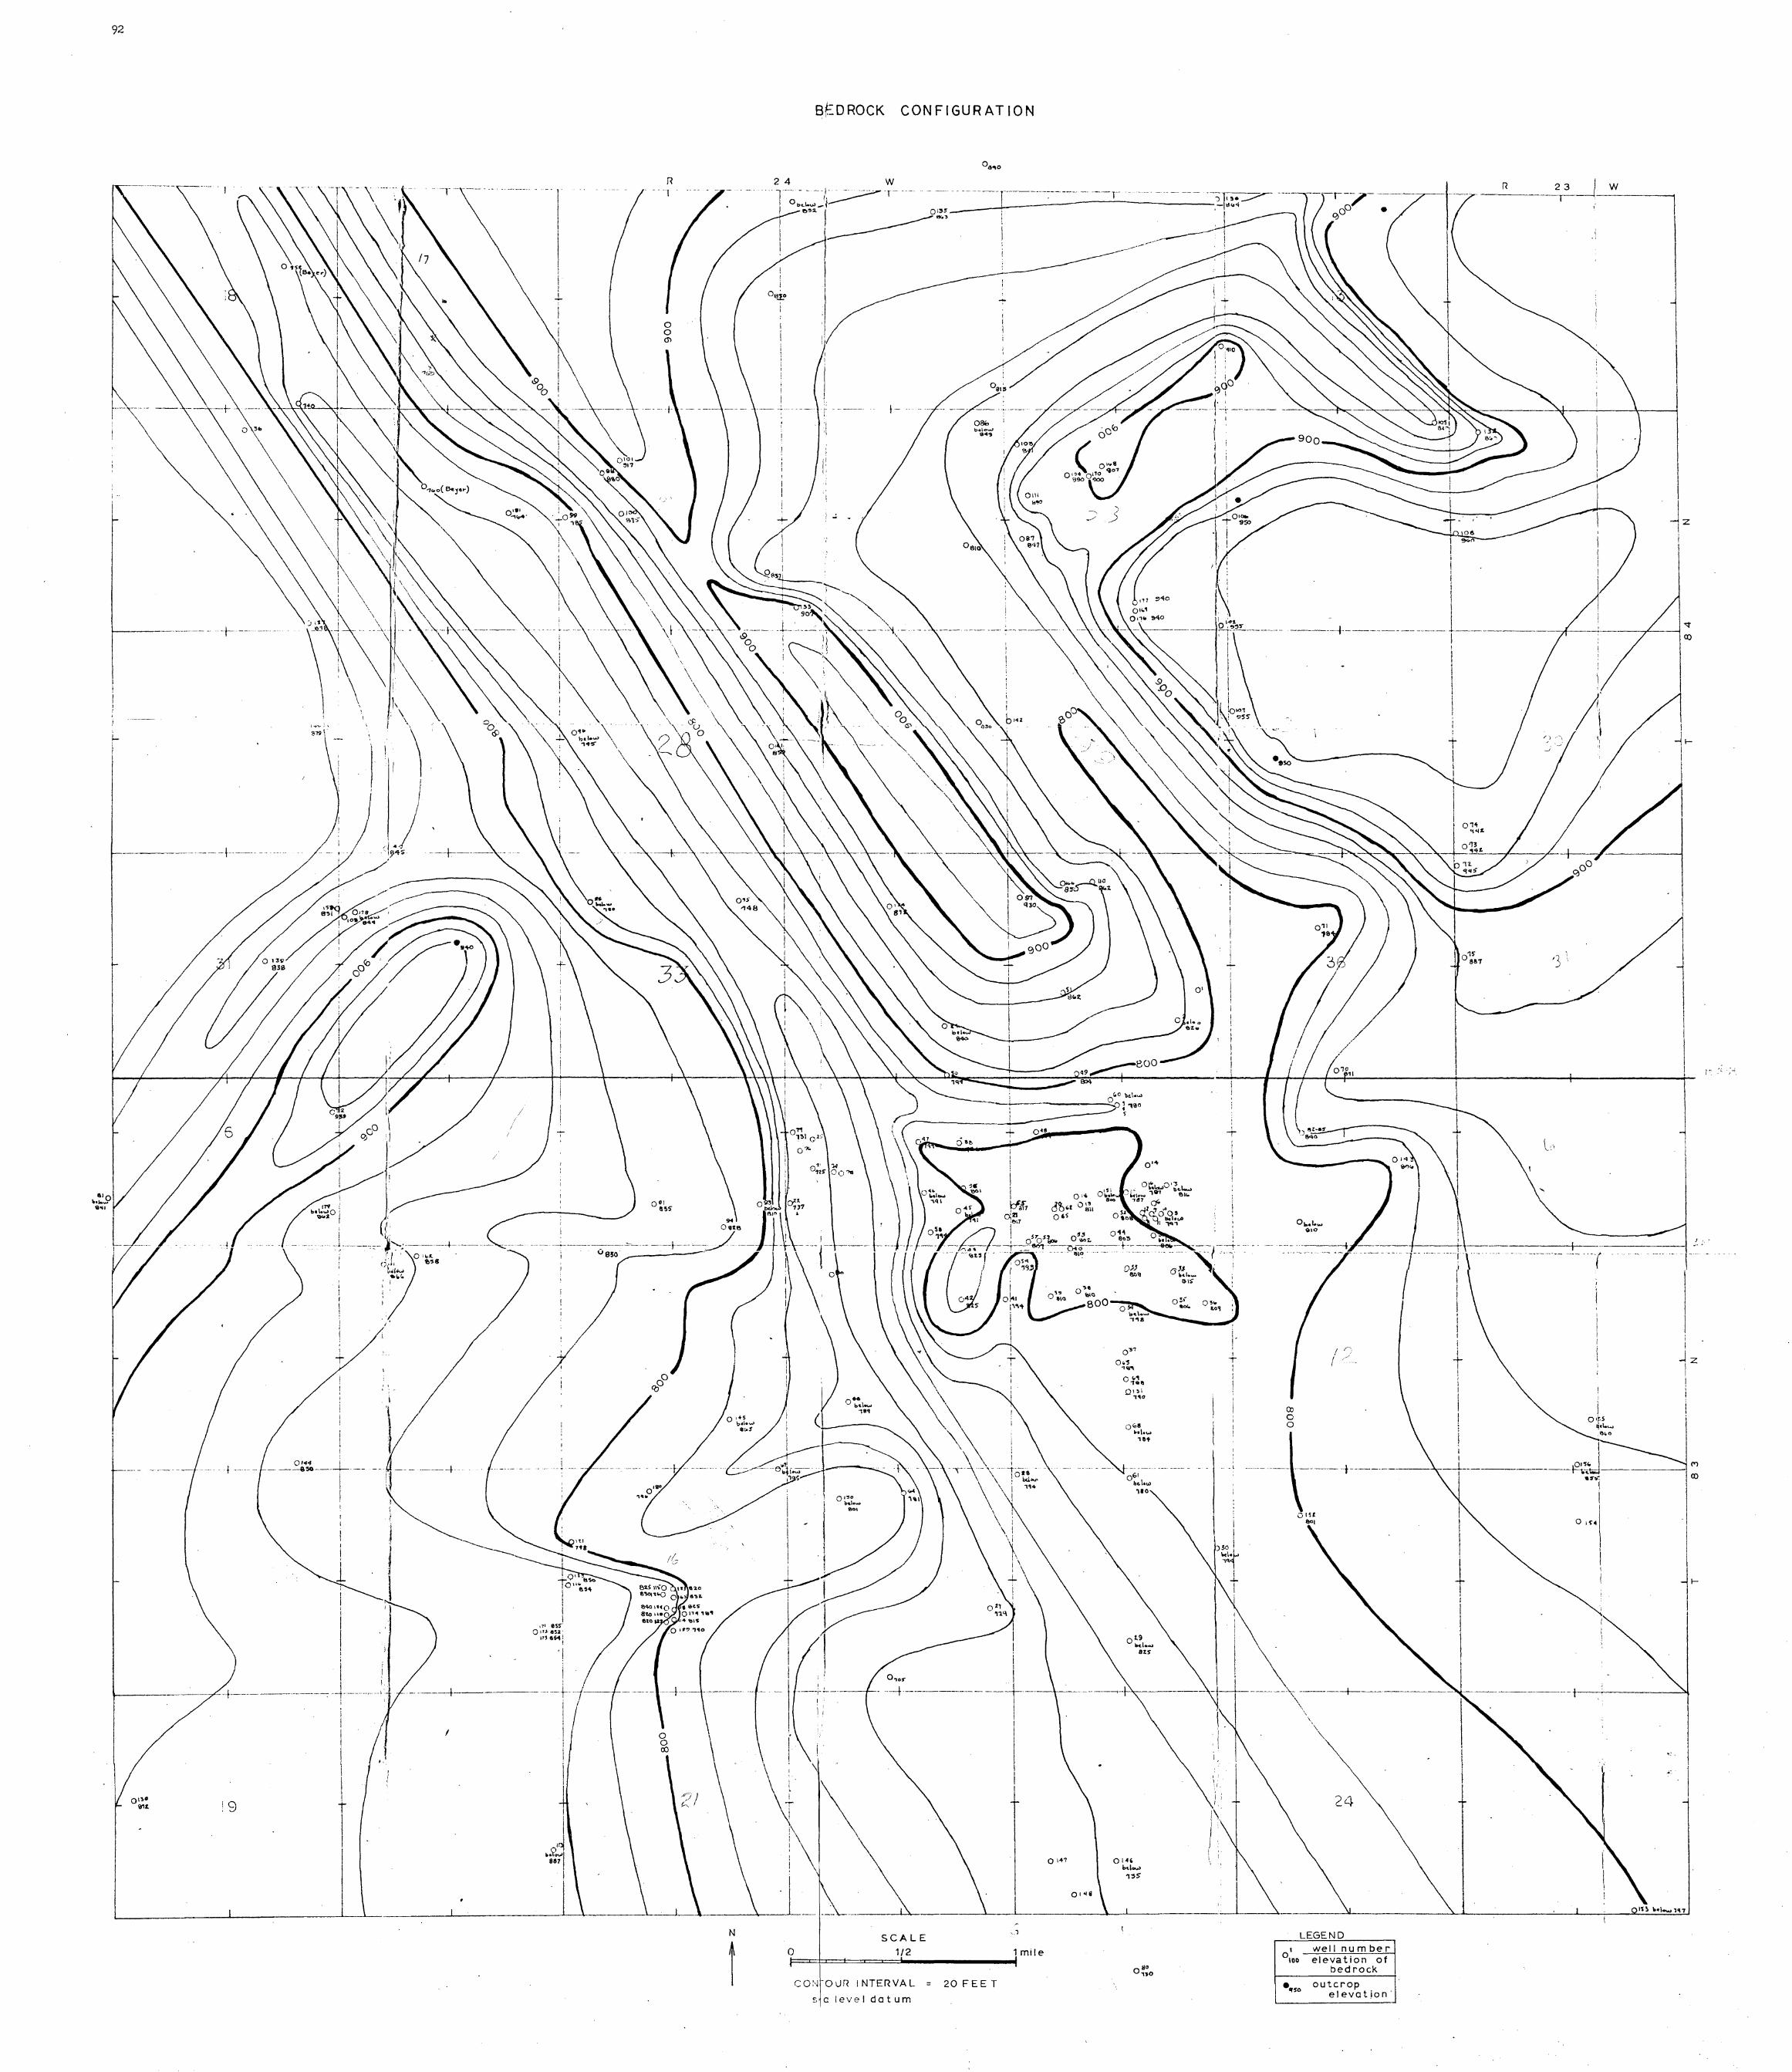
92
fi
-------. ----1----- --
~--------
, .. .,,;,
. -- t
,
i j
0144 i -, --&~--~--.+
, ! 1
/,
I I
. '--r - '1
I i
I i , 1
._--+
.. - ·--t--------·-
I
I
I ,~
""''''''1 . ., i
R
0 0 <l>
--- - - --I;
0'" ".
no ...
BEDROCK CONFIGURATION
o~~ '" (.!~--
I
.--~~L---_ i' ~
i , .,.. ,
-To" -: w_ I ,'4 i
, .. ~
.---800 '9~ , -
0'" 0" 1~'
°-t~fI o no i ".
o~· ··l.\,o) , ..
1-, T ,
, . . _ . . 1
, )30 !
Ioc\ .. ~ wI
I i ... , I
T- oa
------+--------------f---·---
OJ o o
( I ,-',
i I
t \ , I
1 I I
,. °887
I
----L-~- ----IT .... i i t , :
,
.\
I I
-II-I
i I
lZ
. ,
-- .--- ------.-- -·t ---------."'.--~---------------~;J--------I .., .~~ m
QIH 00,
I ! i
t , I
I
1 I
I
--T!------
0<9· I
i ";.';; I I,' II'
0"0:5" I I
i:
I
i , I ,
0\-+7 \ ,
0 1 -'018
. __ '--~ __ __\__L ____ ,___L _ __'_
co:·rol1[, INTERVAL
.. ' N SCALE
o 1/2 1 mile ~¥=~====~--------~
20 FEE T t s c level datum
24
LEGEND well number elevation of
bedrock
outcrop elevation'
": ..

93
Figure 14. Isometric panel diagram, shO\dng generalized Pleistocene stratigraphy
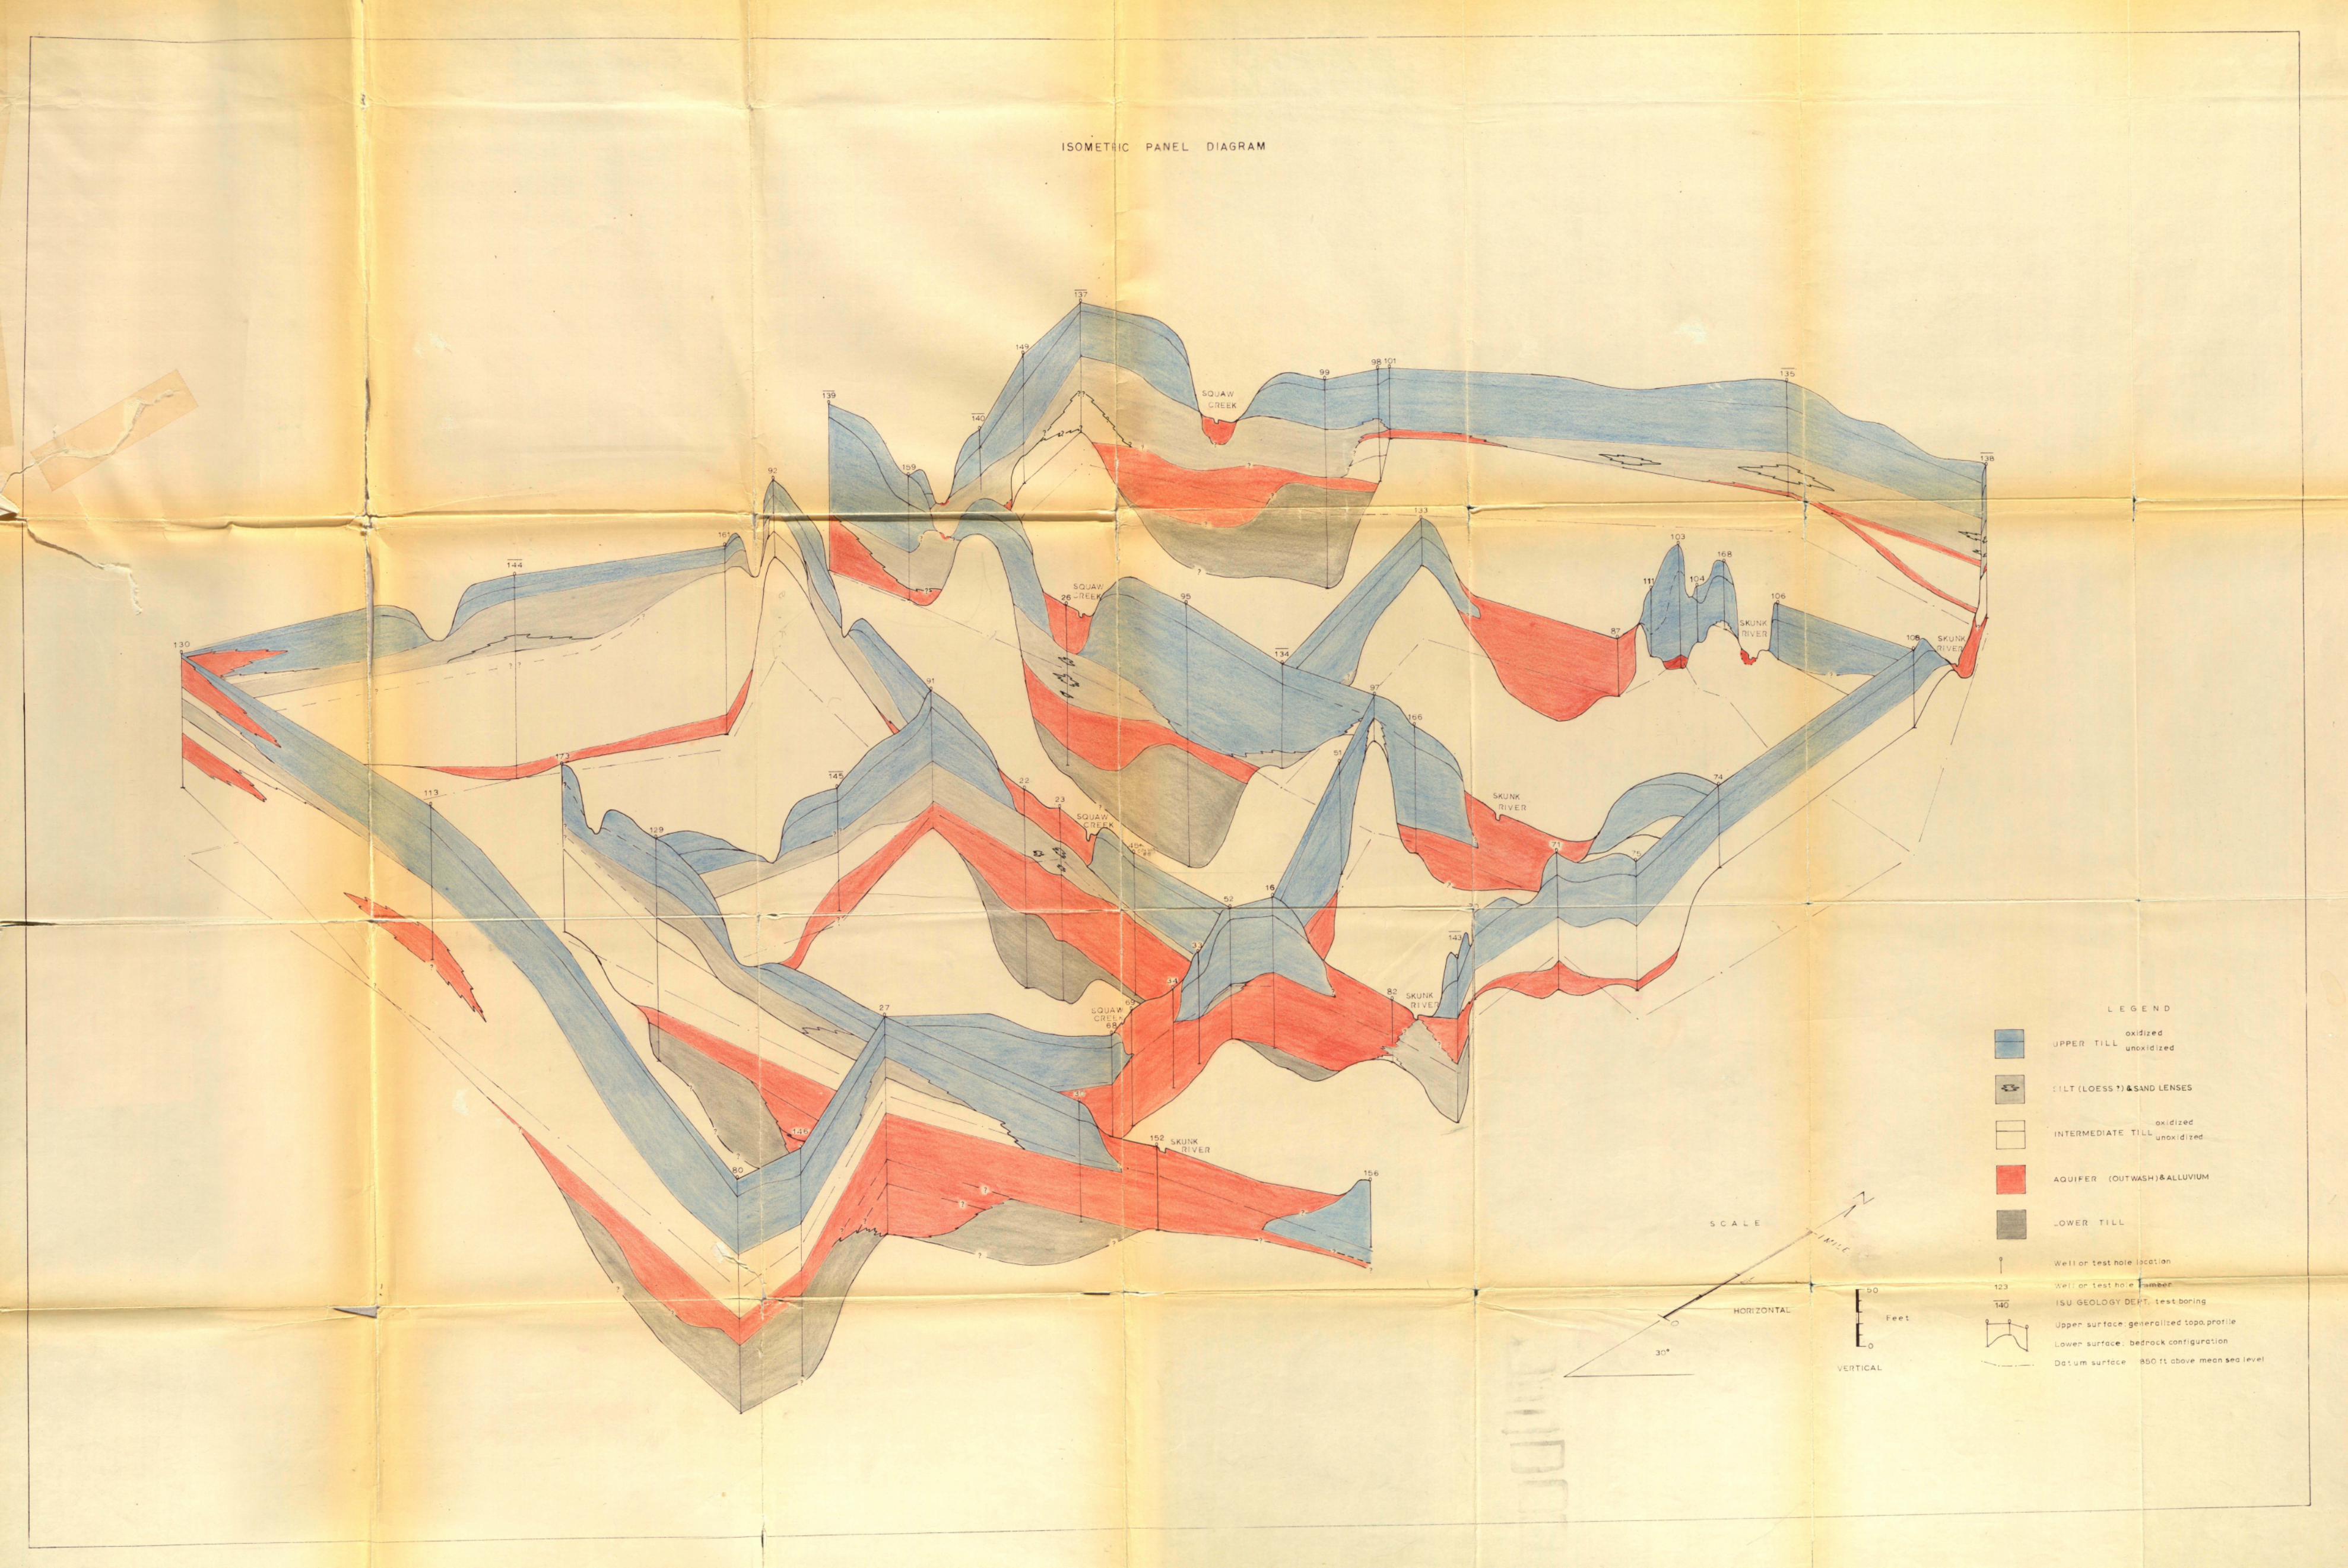

95
Figure 15. Contour map, shO\dng aquifer thickness
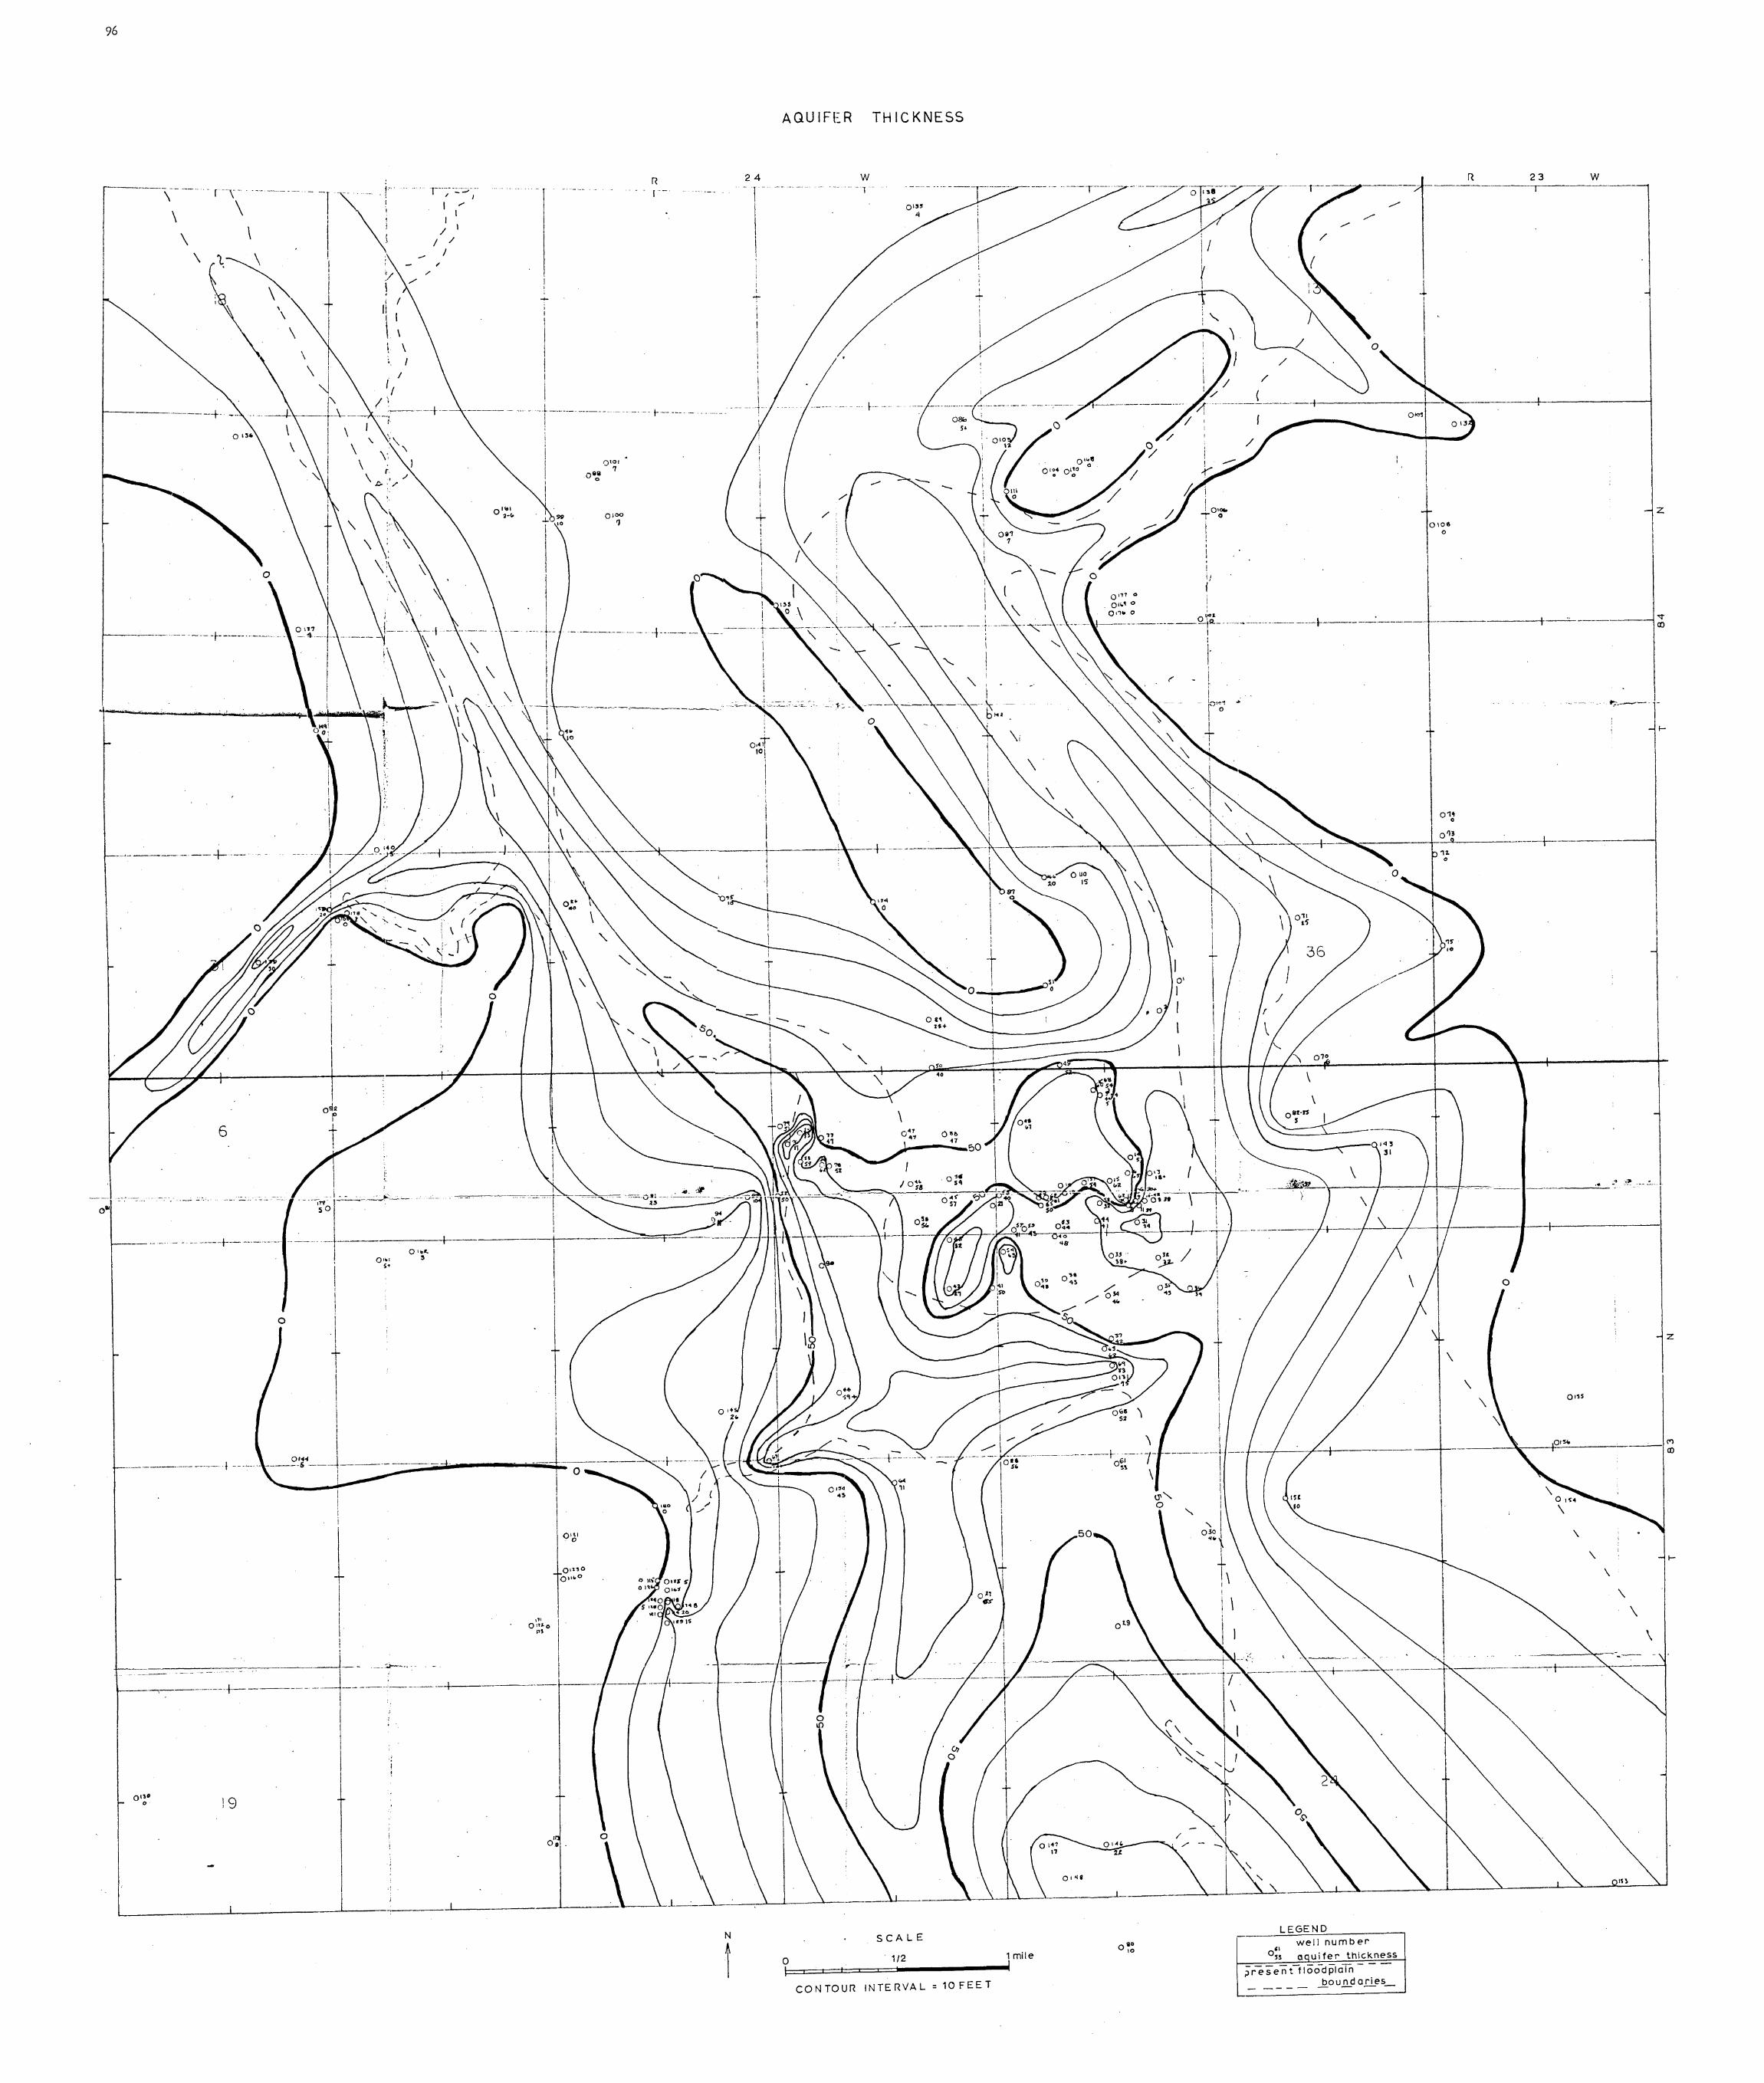
96
1 __ _
\
\
\ \
r - '\
\
o L'"
---'-~ ----t--
-- -- -1-----
\ \
\.
'/ ---\ ; I
II I
\ \
\ \
/
'/
/'
I ..I
I I /
/ /
/
/~-- ---+-
I I I
- -.- I .. .. __ _ f---.---- ----+ ----- -------! I
- --t--------
--
.:.." . --- .----" -r i
-- -----t------
----._- . + - - ._-
-------:-:: .. - .. '
' ___ --;_- -----+--
19
o
1
I I I I 1
I
t
01 .. ( ,. o IIp'•
-:
I
I
t !
I J------1 ::::::;;,;;.--~_--iii -0 O'i< __ ~ ____ _
---5 - 1 i -- I I
I i
t I ! 1
--'1---
'" Otu.o pI
N
t
AQUIFER THICKNESS
24
1 I I
I I ,
T
I
I
i I :
1 1 ___
I I
t I
1----I
',.-- .
w - 1 -
... f--
---f----
\
---1'-
0", u.
<0
••
I
I
+
OBb '--__ ,.
i I
t i o -l-__
o 1 1 =10FEET Iii E RVA L CON TOUR INT
SCALE
1/2 1 mile I
\
5' ,,0,
o (-<If
--,-
•• 0 '0
0' I , 1
1
1 I I
I
1
-~ --I I
f
----------.
1
I
------\---- .-
/
07.
\
\
\
·-nl.' 31
o
------
<. I. ___ ,, __ _
/
---
EGEND ___ ---=L_.o:o~ II nu m b er
we , kness " 'fer thlG °S3 o.0UI ,
-
- ent fIOO-dPIOlndories_ ~re5 bou n _
----
01 • •
\
\
23 w
z
----;1 ----
------1-
'.
o
z
\
I-
\
\
\
\ -. -
",

97
Figure 16. Contour map of piezometric surface of the aquifer
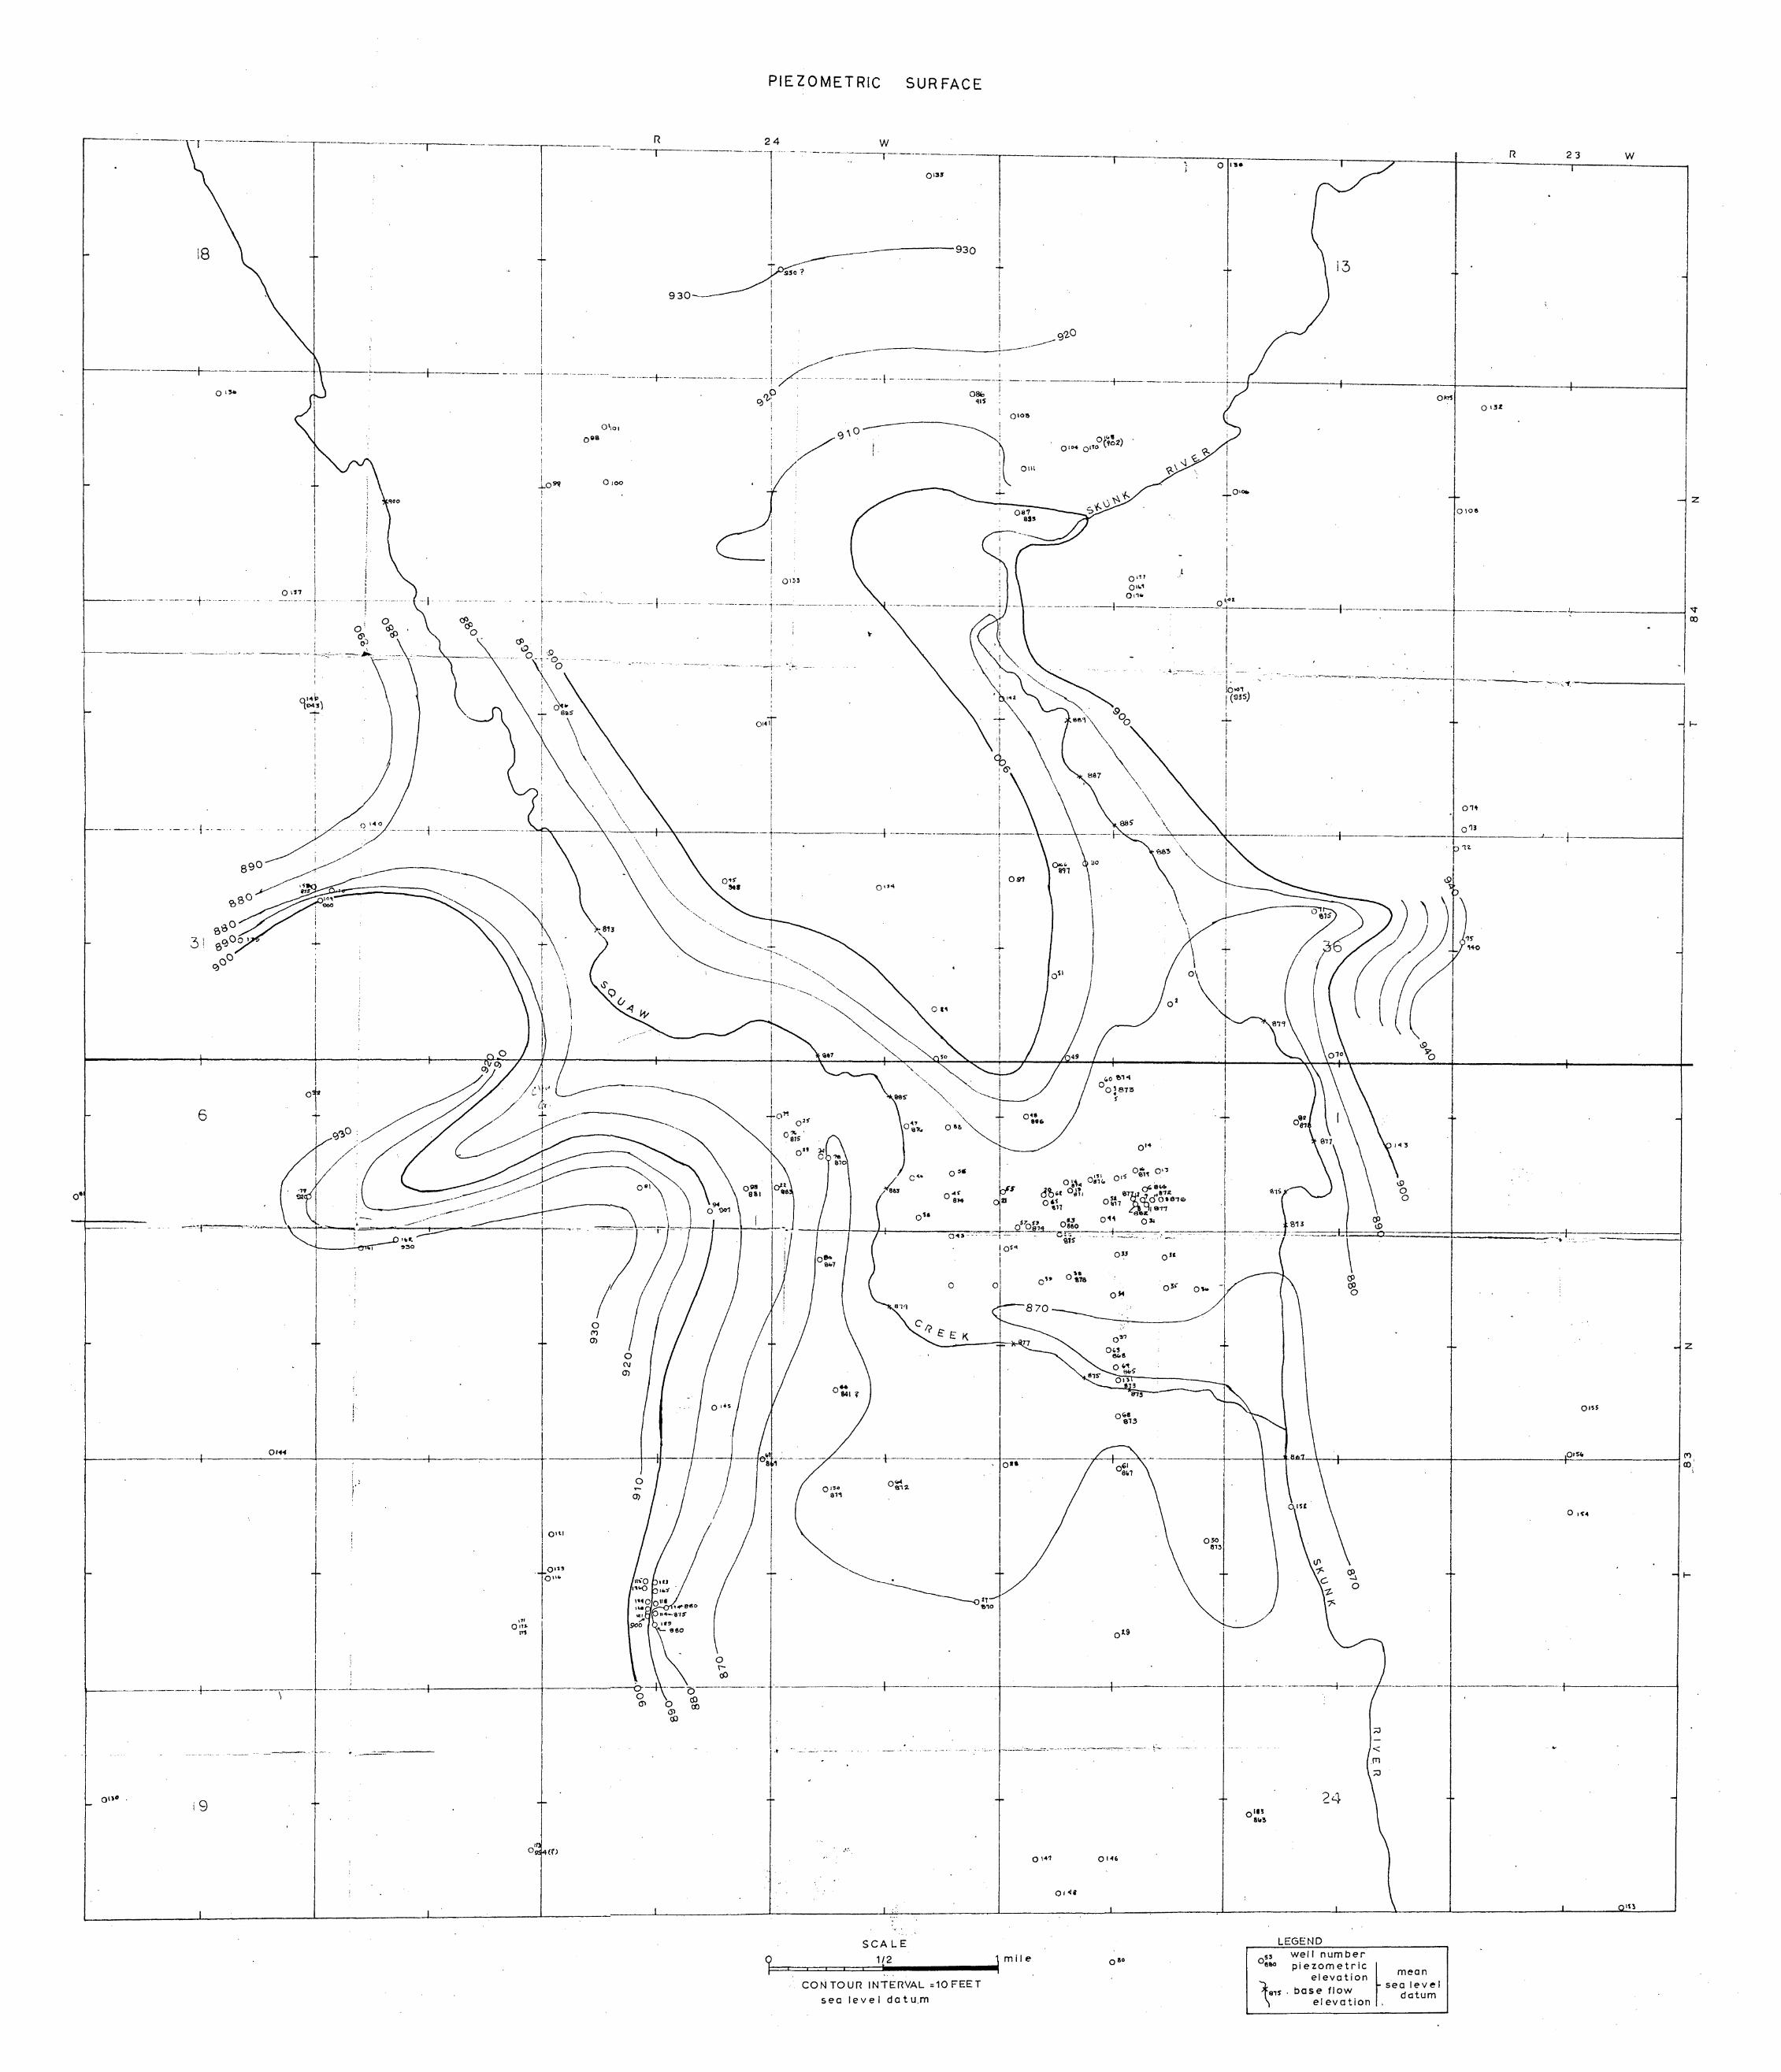
o·
I
I
------.----. ------·'1---- - --'---
t I I
I I I
--1---------- \------- ---+------ -_. ----...i ... -.------.-.
-... --- ···--·--t-·-
... -- - I - -
-3 ' ~ !
6
-------_._- -+----
I
t I
I
'.
j
-?,:,-L --F' -1- ..
0' ~ o
I I
I , , I , I
lO91l 0)00
I
i . - ,-- .- -.-------
I !
Q> ! .;) I·SJ \00 ~)
---- ~. ·f~"-:~·~·-- -:-.~ -- . I
I . i 1
;;" I I
o~L • i
~ I
I
I'
!\ . ..L °alis
! \
\
o ~ .. 0 .--- ---, .. _._--_. ----------
~----
----. -+----.-,~.
-' --+--_.-- ---i-
." o ItJ. m
0"·1
\\ \ \,
o (\J
0)
R
930-
PIEZOMETRIC SUR FACE
24 w .. - -- --.---- .-------r-.-.-.-
, I
1
---
OL~"
___ ------------930
I ~-----
I I
r I i !
I ; 9'2.0
.. ----
o I."e
r
R 23 w
13
- -+-_ .. --- .. --.. -- -. 1/-- -.--- --.j - -------t- -------f-------_+-______ .-~-----______1
--\_.- --
~~ 0,
i --. ----·l-------.. -···- -- -- -.
---~- ... ,
I , I I
, i·
0 10'&
0111
on 815
Ol';~~) . 0104 otTO ~
0 111
0'\0.'
I
1
I lata. r ,
I'
!
Ot'. ,'01
0'" o \3l
z
o ---- .. --.- -------- --. - -. - -.- --'--1--·_·--.----.--.~---------1· ___ ·_ - .------.- ----- ------.-----___ 1 ____ ... _____ -1 'l' ! , I
i I .. ,
. I I' l0 141 i (S35)
J.. I
i I
co
._--- .. ~--.-----.------. -'I~- -.------ -"'., .,----------,
I .. j,.-
I
011
--\,------- t ----+ ---------_._----- , 0~3 --'.------- ----.------. --·---I---·-------+-, -=---.---. -'---- f-- -----------1
\ '.
\ \\"
''-.,
o
!
OIJ-4
......... ~__ I
~- -+---i--"'-I -....... I '-
-1--~~ 0"
.,. "0
... 0 841 ?
'" ,.
...
K
I ,
I 097
I I
I I
J-
I 0"
I
t
0"
870
77
I I
0 .. t18
0" o1't
0" 0" "".
\.
\ + \
0\
0'"
i . ...j.. ,
I • I I
I ! I
.1
I 1._ , I I ! , ,
o~~ .,.- -0ni-1"ir---,---___ 1 3
O~· 813
F 1~
s~ ~_~._=_=_=l:_+_=:::;~O=:====~========::::~-.• 1 .. ,_'-.::--'" -:-. =-==-====1
\ cP ~
z
--7- e~'t11--- --~,~----:~------~·~Io .. -.---/ .',
/ I
I I ~. M --I--\--*-fU4-+------+------~~--I<O
,
~.
-------- '1 ~f>'O T ~
o
I I
I -.----------.. !----.--- --\--+-----:.....--- -----f --------0--+
o -0-----·-·---
($) 00
-----+-----_.
I
~-----.- .------f---- ---------l------------j--I --
0'1
. . •
i9
0' 0141
SCALE
1{2 1mile
CONTOUR INTERVAL =10FEET
sea leve I da t u.m
ol.rta
0 1• 3 8.~
LEGEND
24
well number 0" "'" piezometric f mean
elevation I I
~ sea eve
.,s· base flow datum elevation ,