geographical information systems and geostatistics for modelling radioactively contaminated land...
TRANSCRIPT

Geographical Information Systems and
Geostatistics for Modelling Radioactively
Contaminated Land Areas
NAZZARENO DIODATO1,w and MICHELE CECCARELLI21Monte Pino Research Observatory on Climate and Landscape–ROC&L, Contrada Monte Pino,82100 Benevento, Italy; 2Research Center on Software Technologies-RCOST, University ofSannio – via Port’Arsa 11, 82100 Benevento, Italy
(Received 15 July 2003; accepted: 14 October 2004)
Abstract. The Chernobyl plume contaminated vast lands of Europe with radiocaesium (137Cs)in 1986 because of the deposition of radionuclides on the ground by wet and dry depositionprocesses. Nevertheless, in a nuclear emergency, contamination data may be very sparse andthere is need to make rapid and scientifically supported decisions. Here we analyze the rainfall
field, an important precursor of the wet deposition, during the passage of the plume. Thus,estimating rainfall spatial variability can help to identify possible contaminated areas andassociated risks when rainfall exceeded a given threshold. In this paper, we show that the
conditional probabilities of exceeding threshold rainfall values could be spatially assessedusing the mutual benefits of linking geostatistical and geographical information system (GIS)to quantify the evaluation of the risk involved in decision making. In particular, the non-
parametric geostatistic technique, termed Indicator Kriging (IK), enables one to efficientlyestimate the probability that the true value exceeds the threshold values by means of theindicator coding transform. Afterward, GIS has been used to find the areas probably affectedby wash-out (probability >0.5 that rainfall is above a certain threshold). The experimental
study has been focused on a test site in Beneventan agroecosystem (Southern Italy) to modelthe spatial uncertainty over a continuous area from sparse rainfall data. This enabled togenerate probability maps delineating area potentially affected by to contamination to be
monitored after wet deposition of Chernobyl releases.
Key words: Chernobyl plume, deposition, threshold rain, geostatistics, GIS, probability maps,monitoring areas, Benevento (southern Italy)
1. Introduction
Radioactive land contamination caused by the Chernobyl accident featuresextremely complex spatial pattern. This is due to various causes, among otherare meteorological conditions, landscape and land use, soil type, source termand others (Clark and Smith, 1988; Savelieva et al., 1999). Contamination ofsoils by washout during the passage of the radioactive plume could be a
w Author for correspondence: E-mail: [email protected]
Natural Hazards (2005) 35: 229–242 � Springer 2005DOI 10.1007/s11069-004-5206-7

hazard if rainfall was even above a certain threshold after fallout. During theinitial period emergency, arrangements on advanced planning is based on fewinitial measurements. Measurements of precipitation are, instead, more denseand continuous. Thus, prompt decisions may be taken if rainfall and thus thecontamination of an area exceeded a given threshold. As referred by Lanzaet al. (2001) and Stein et al. (2001), for downscaling processes, a non-para-metric geostatistical approach is most appropriate, and point kriging can beapplied to interpolate environmental indicators (i.e. rainfall). Diverse papersin various disciplines have been published using the methods of non-para-metric geostatistics to define areas with high and low certainty of exceeding athreshold value. For example, soil scientist (Halvorson et al., 1996; Castri-gnano et al., 1999), hydrologist (Allard, 1998; Atkinson and Lloyd, 1998;Pardo-Iguzquiza, 1998), geologist (Smith and Williams, 1996; Tercan andOzcelik, 2000), and environmental scientist (Journel, 1988; Goovaerts, 1994;Oliver et al., 1996; Benamghar and Sonnet, 1999; Kyriakidis and Dungan,2001; Krivoruchko, 2001).
Our objective is to present a simple retrospective experiment and to showthe potential application of the non-parametric geostatistical approach inGIS during a nuclear emergency. For this purpose we use a type of non-linearkriging, so-called indicator kriging, to assess areas by subject monitoringafter pollution rainfalls following Chernobyl disaster in a province ofSouthern Italy (Benevento).
2. Materials and Methods
The area considered (Benevento province) is located in the southernApenninesof Italy (Figure 1) and is characterized by great ecological diversity. The abilityto identify true spatial variability in a data set depends to a great extent onancillary knowledge of the underlying phenomenon measured. This detectionprocess can also be improved with the inclusion of other attribute data. In thiscases, GIS makes it possible to incorporate data from other aspects of theenvironment with the geostatistical study of autocorrelation structures, so thatdifferentiated knowledge of different pattern of variation can be used to besteffect (Burrough, 2001). All data which will be considered in this work corre-spond to three variables: rainfall (R), actual elevation (E), and vegetation coverfactor (VCF). The VCF attribute measure the degree of green vegetation nat-ural cover, so that the values were recorded to vary from 0 (no vegetation) to 1(abundant vegetation). The VCF derive from Land Use Census (SISTAN,1994), and is discretized into a irregular grid, for a total of 238 locations.Actualelevation derive from Istituto Geografico Militare Italiano Map, and is dis-cretized from a grid lattice with step of 500 m. All the data co-registered andcomputations have been performed using the ArcGIS – ESRI software.
N. DIODATO AND M. CECCARELLI230

2.1. GEOSTATISTICAL INDICATOR APPROACH
For many GIS applications, the user only needs to interpolate point data sothat they can be displayed or combined simply with other data. Increasingly,however, GIS are being used to provide data for quantitative models ofenvironmental processes such as climate change, air pollution, land con-tamination, the diffusion of plants, animals, or people (Burrough andMcDonnell, 1998). For some models only a deterministic estimate per cell isneeded; for others, as in decision making, we need to know the localuncertainty associated to the estimates. Such decisions are often based oncritical values of the soil contamination. If the estimates are more than aspecified threshold, security measures may be enacted. But such estimate areusually affected by large uncertainty, arising from sampling, modelling andinterpolation, which must be quantified to allow an evaluation of the riskinvolved in any decision (Buttafuoco et al., 2000). Geostatistics allows toassess such uncertainty through the determination of a conditional cumula-tive distribution function (ccdf) of the unknown attribute value. We used anon-parametric type of ordinary kriging, called indicator kriging (Journel,1983; Isaaks and Srivastava, 1989), because it has the advantage of beingresistant to the effects of outlier values, and thus it is recommend for anal-ysing skewed data sets (Deutsch and Journel, 1998), and for cases in whichthe number of experimental data is relatively small and irregularly distributed(Pardo-Iguzquiza, 1998); such case is very common in ecological and engi-neering studies (Tercan and Ozcelik, 2000; Lin et al., 2002; Saito and Go-ovaerts, 2002). For example, Mohammadi et al. (1997) and Benamghar andSonnet (1999) have used indicator kriging approaches for pollution riskassessment, respectively on deposited Cadmium and Vanadium in soils.
Consider the values of the random variable primary Z (rainfall expressedin mm), at a set of locations sa, z(sa), over the study area. Indicating with F
Figure 1. Geographic location of the district of Benevento (dark grey).
GIS AND GEOSTATISTICS FOR MODELLING 231

the conditional cumulative distribution function (ccdf) of the variable Z, itresults:
Fðso; zkjðnÞÞ ¼ ProbfZðsoÞ > zkjðnÞg ð1Þwhere the notation |(n) expresses conditioning to the n data {z(sa); a ¼ 1,2…n}, retained in the neighbourhood of so. In this approach the probabilitydistribution is regarded as the conditional expectation of the indicator ran-dom variable I(so; zk), given the information (n) data:
Fðso; zkjðnÞÞ ¼ EfIðso; zkÞjðnÞg ð2Þ
with Iðso; zkÞ ¼1! zðsoÞ > zk
0! zðsoÞ � zk
(ð3Þ
The least square estimate of the indicator I(so; zk) is also the least squareestimate of its conditional expectation. Thus the ccdf F(so; zk|(n)) can beestimated by kriging the indicator I(so; zk) using transform of data. Theordinary indicator kriging (oIK) estimator is a linear combination of the nindicator variable i(sa; zk) in the neighbourhood so:
½ProbðZðsoÞ > zkjðnÞÞ�olk� ¼Xna¼1
ka;kðso; zkÞ � iðsa; zkÞ ð4Þ
where ka are the weight factors calculated by solving of the kriging simul-taneous equation system (Goovaerts, 1997, p. 294).
3. Results and Discussion
The first step in a geostatistical study is a preliminary knowledge of spatialdistribution, called exploratory data analysis. Data analysis and interpreta-tion cannot be completely automated, particularly when making crucialmodelling choices (Kitanidis, 1997). Our initial exploration of the data re-vealed two main issues which we wished to address in our choice of techniquefor spatial interpolation (Atkinson and Lloyd, 1998; Carlson and Osiensky,1998).
3.1. NON-NORMALITY OF THE DATA
Time features of rainfall event (30 April 1986) belong to a particular case.Therefore, it was quite obvious from the start that the 56 sample data rain(Figure 2) had a skewed distribution (Figure 3). Ordinary kriging is quiterobust and so there is some potential for its application. Nevertheless,probability maps for ordinary kriging require multivariate normal distribu-tion of data. Also disjunctive kriging is not appropriate at our case because isthe assumptions of data bivariate distribution not satisfied. An alternative
N. DIODATO AND M. CECCARELLI232

approach, and the one which we adopted, is indicator kriging. Since indicatorkriging works by decomposing the variable of interest into several binaryvariables, and in so doing decomposing the univariate distribution function(histogram) into several classes, the dependence on a normal distributiondisappears (Journel, 1984).
Figure 2. Georeferenced location of the 56 raingauge and borders of Benevento district.
Figure 3. Distribution and descriptive statistics of rainfall data acquired in the areaunder study.
GIS AND GEOSTATISTICS FOR MODELLING 233

3.2. CORRELATION WITH TOPOGRAPHIC DATA
In complex terrain, climatic patterns are defined and delineated by geo-graphic features, creating a mosaic of land, each potentially experiencing adifferent climate regimes. An effective approach is to use the wealth of expertknowledge on the spatial patterns of climate and their relationships withtopographic features to help enhance and parametrize a preliminary statis-tical technique (Daly et al., 2002).
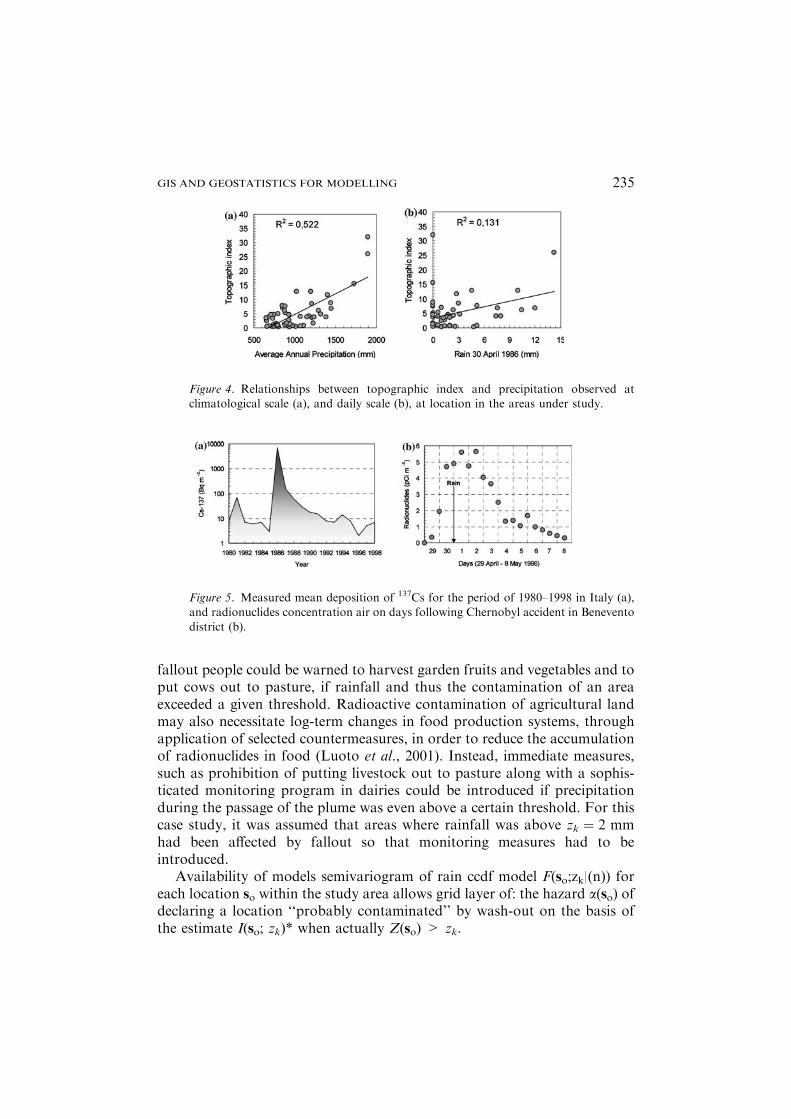
Topographic features can be delineated at a variety of scales and theirrelationship with the precipitation may have been non-linear and no obviousassociation of any kind was observed (Atkinson and Lloyd, 1998). An otherproblem may be related to time scale of observation of the precipitation. Forexample, combining stations elevation (E) and vegetation cover factor (VCF)in a simple algorithm, called topographic index (TI ¼ VCF Æ�E), we observedlarge positive correlations between TI and precipitation at climatologicalscale (Figure 4a), but not for daily scale (Figure 4b). For the above reason weadopted an univariate geostatistical techniques.
3.3. RETROSPECTIVE HAZARD ASSESSMENT
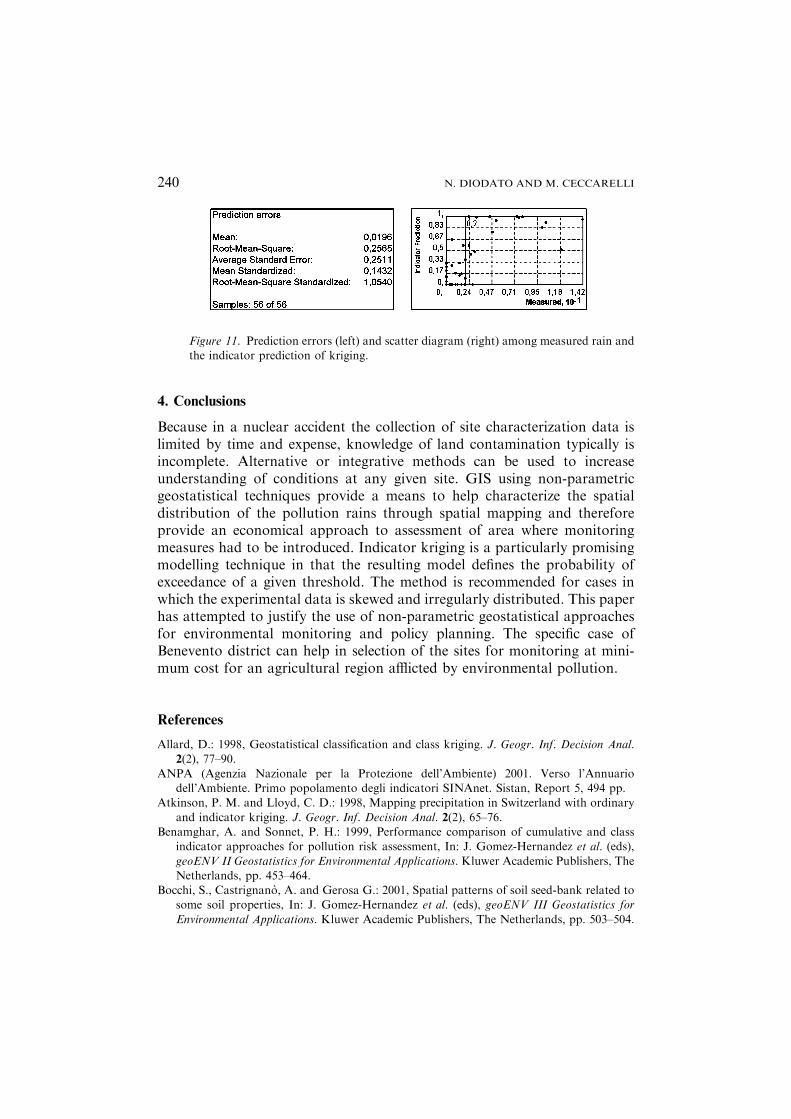
The analyzed data are related to the Chernobyl nuclear power plant accidentof the 26th of April 1986. During the days following the accident a radio-active plume was crossing some of Europe and radioactive deposition on theground was mainly a function of the rainfall (Wendelberger, 1998). Thegeographical behaviour of the trajectories of the radioactive cloud over Italyis referred by Zanella (1988). The annual total deposition of radiocaesium(137Cs) in Italy is showed in Figure 5a (ANPA Report, 2001); in it is clearlyobvious that the 1986 was the year strongly affected by the Chernobyl fall-out. The chronology of the concentration of radionuclides in the air ofregion under study on days following the Chernobyl accident is given inFigure 5b. The rainfall occurred early at period with radioactive maximumconcentration was on days April 30 to May 2 1986. It became also obviousthat the soil deposition was positively correlated with precipitation duringthe passage of the radioactive cloud (Wernli, 1987).
In a nuclear emergency the collection of site characterization data islimited by time and expense, it is affected by sampling gaps to adequatelydescribe the deposition of radionuclides over the whole landscape. Alterna-tively, a good estimations of rainfall fields can help to identify areas possiblycontaminated by deposition (Thieken, 1998). Thus, it was examined how wellthe ten highest and the ten lowest rainfall data of the whole data set (56 data)were estimated by the applied methods.
Decisions, whether certain measures will be introduced or not, are oftenrelated to thresholds or action levels. For example, in the case of radioactive
N. DIODATO AND M. CECCARELLI234
fallout people could be warned to harvest garden fruits and vegetables and toput cows out to pasture, if rainfall and thus the contamination of an areaexceeded a given threshold. Radioactive contamination of agricultural landmay also necessitate log-term changes in food production systems, throughapplication of selected countermeasures, in order to reduce the accumulationof radionuclides in food (Luoto et al., 2001). Instead, immediate measures,such as prohibition of putting livestock out to pasture along with a sophis-ticated monitoring program in dairies could be introduced if precipitationduring the passage of the plume was even above a certain threshold. For thiscase study, it was assumed that areas where rainfall was above zk ¼ 2 mmhad been affected by fallout so that monitoring measures had to beintroduced.
Availability of models semivariogram of rain ccdf model F(so;zk|(n)) foreach location so within the study area allows grid layer of: the hazard a(so) ofdeclaring a location ‘‘probably contaminated’’ by wash-out on the basis ofthe estimate I(so; zk)* when actually Z(so) > zk.
Figure 4. Relationships between topographic index and precipitation observed atclimatological scale (a), and daily scale (b), at location in the areas under study.
Figure 5. Measured mean deposition of 137Cs for the period of 1980–1998 in Italy (a),and radionuclides concentration air on days following Chernobyl accident in Benevento
district (b).
GIS AND GEOSTATISTICS FOR MODELLING 235

3.4. SPATIAL STRUCTURAL MODELLING
A model of regionalization was fitted using an iterative procedure developedby Johnston et al. (2000), and composed by two stage.
Stage 1 begins by assuming an isotropic model, and it computes theempirical semivariogram. The semivariogram distance measures the averagedegree of dissimilarity between an unsampled value z(s) and nearby datavalues. Figure 6 shows the experimental semivariograms computed from the56 data of daily rainfall occurred on April 30 1986, with three differentpermissible models fitted. Semivariogram values increase with the separationdistance, reflecting the assumption that rainfall data nearby tend to be moresimilar than rainfall data that are farther apart. The semivariogram reaches amaximum at 17000 m before dipping and fluctuating around a sill value. Thespherical model is the most widely used semivariogram model and is char-acterized by a linear behaviour at the origin. The so-called hole effect modeltypically reflects pseudo-periodic or cyclic phenomena (Journel andHuijbregts, 1978). Here, the hole effect relates to the existence of threemountains 20,000 m apart, aligned in the north to south direction in thewestern Benevento district (Figure 7), which creates three high-valued areasin the rainfall field that could be connected to so-called trend effect. In fact,exploratory data analysis showed the existence of a moderate trend, asapparent nonrandom component, in pattern data rainfall. Nevertheless, wefelt that the stationarity hypothesis does not hold for the whole region, butonly locally. Gaussian model is indicated to represent a regionalized variablethat is smooth enough (Kitanidis, 1997, p. 55), which wasn’t the our case. Inaddition, hole effect model is preferred to the Gaussian because it avoidsnumerical unstability in the kriging system and unrealistic in most applica-tions (Vackernagel, 1998, p. 121).
With stage 2 any parameter, such as range a, number of lag (assumedequal 7), or lag size h (assumed equal 5000 m), nugget Co (assumed equal0.000685 mm2) and partial sill C1 (assumed equal 0.18793 mm2) is calibratedinteractively. In this stage the assumption of an isotropic model does nothold, and so it account for direction-dependent variability (anisotropic spa-tial pattern). Directional variograms were estimated from the sample data
Figure 6. Experimental semivariogram of daily rainfall occurred on April 30, 1986 withthree different permissible models fitted.
N. DIODATO AND M. CECCARELLI236

and the directions of maximum and minimum variation (geometric anisot-ropy) were estimated as 24� and 114� with angle tolerance equal to 45�(Figure 8). Semivariograms were modelled as a combination of two distinctspatial structures: nugget variance and a hole effect structure (a1 ¼ 33411 mand a2 ¼ 15000 m, h ¼ 24�):
cðhx; hyÞ ¼0:000685 h=00:18793 �HoleEffectð hx; hy
�� ��; a1; a2; hÞþ0:000685 �Nugget h>0
8<: ð5Þ
where HoleEffect(|hx,hy|,a1,a2,h) represent a two-dimensional Hole effectvariogram of unit sill with practical ranges given by the ellipse with a a1 and
Figure 7. Terrain map of the area under study with resolution of 500 m.
Figure 8. Directional experimental indicator semivariograms (dots) and the fitted Holeeffect models (solid curves).
GIS AND GEOSTATISTICS FOR MODELLING 237

a2, and with major direction of anisotropy at h degrees with respect to thenorth-south direction. The function Hole effect model equal to (Johnstonet al., 2001):
1� sin 2Pjhja
� �sin 2Pjhj
a
� �8<:
9=;:
Ideally the value of the semivariogram should be zero when the separationvector h is zero (null nugget effect); in the case study this is not true princi-pally because measurement error exists, and secondarily because spatialvariability at distance <5000 m is unknown.
3.5. SPATIAL PATTERN OF ESTIMATION AND CLASSIFICATION
Figure 9 shows indicator kriged probability map based on the threshold ofrain 1 km · 1 km grid. The map indicated that the phenomenon accountedby IK is not smooth (i.e., daily rainfall values change strongly with thedistance). In this respect the non-linear semivariogram with nugget effect wasselected as the base model for calculations, so that variogram modelsestimations which differ significantly from the known value even at short
Figure 9. Kriged probabilities map of a rain >2.0 mm.
N. DIODATO AND M. CECCARELLI238

distances. These values depend on the complex interactions among weatherconditions and topographic features. For this purpose, additional informa-tion, derived from the relief structure and expert knowledge has been used totake into account the zone anisotropy and hole effect.
GIS was used also to find the areas probably affected by wash-out so thatmonitoring measures had to be introduced (probability >0.5) for exceedingthe threshold of rain (Figure 10 left). To this aim also the standard errors ofindicator map is important (Figure 10 right). The amalgamation of these twomaps reveal the areas that had to be intensively monitored. These areas aresituated in the Benevento north district, in extreme west and along a ellipticalzone across the Benevento city.
3.6. CROSS-VALIDATION RESULTS
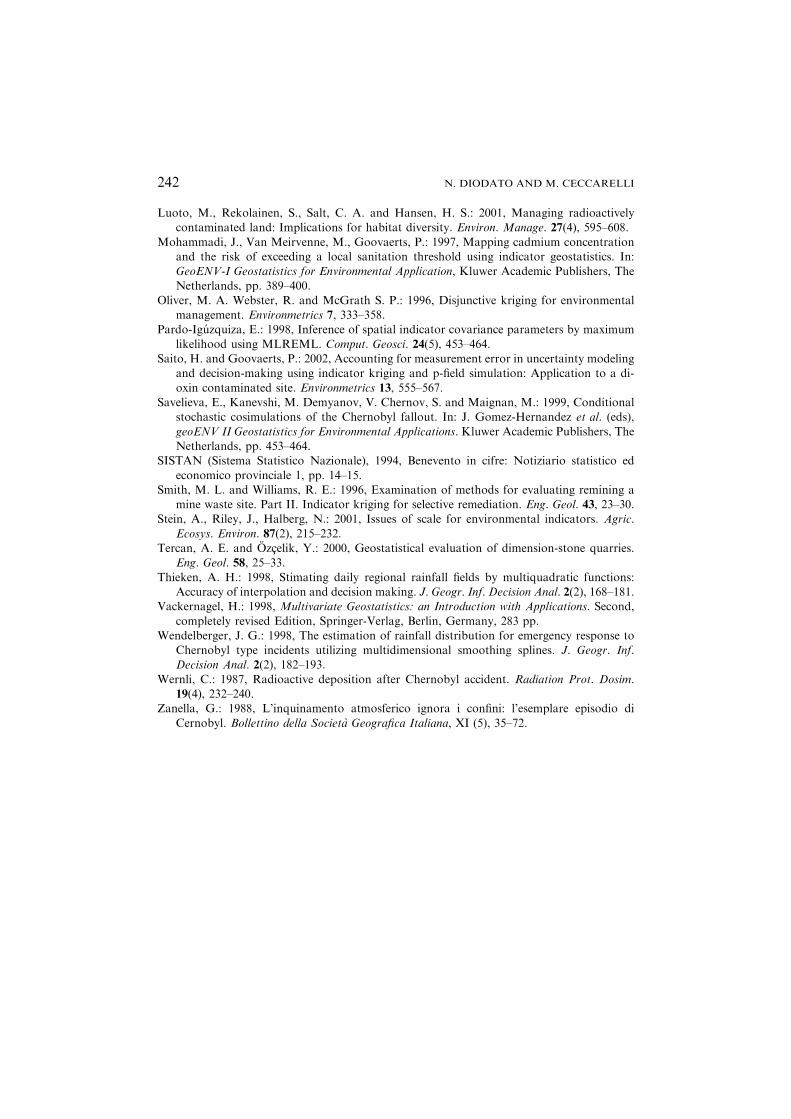
The cross-validation results are displayed in table of Figure 11. Mean equalto 0.0196, showing lack of systematic error. Since Root-Mean-Square is closeto the Average–Standard-Errors, Mean is correctly assessing the variabilityin prediction. RMSSE compare the error variance with same theoreticalvariance, such as kriging variance. Therefore, it should be close to 1. Othercriteria of comparison are given in scatter diagram of Figure 11, where thepredicted indicators values versus the measured values of rainfall are repre-sented, confirming the performance in the statistical sense.
Figure 10. Areas with high probabilities (>0.5) of a rain >2.0 mm (left) and standarderror of indicators map (right).
GIS AND GEOSTATISTICS FOR MODELLING 239
4. Conclusions
Because in a nuclear accident the collection of site characterization data islimited by time and expense, knowledge of land contamination typically isincomplete. Alternative or integrative methods can be used to increaseunderstanding of conditions at any given site. GIS using non-parametricgeostatistical techniques provide a means to help characterize the spatialdistribution of the pollution rains through spatial mapping and thereforeprovide an economical approach to assessment of area where monitoringmeasures had to be introduced. Indicator kriging is a particularly promisingmodelling technique in that the resulting model defines the probability ofexceedance of a given threshold. The method is recommended for cases inwhich the experimental data is skewed and irregularly distributed. This paperhas attempted to justify the use of non-parametric geostatistical approachesfor environmental monitoring and policy planning. The specific case ofBenevento district can help in selection of the sites for monitoring at mini-mum cost for an agricultural region afflicted by environmental pollution.
References
Allard, D.: 1998, Geostatistical classification and class kriging. J. Geogr. Inf. Decision Anal.2(2), 77–90.
ANPA (Agenzia Nazionale per la Protezione dell’Ambiente) 2001. Verso l’Annuariodell’Ambiente. Primo popolamento degli indicatori SINAnet. Sistan, Report 5, 494 pp.
Atkinson, P. M. and Lloyd, C. D.: 1998, Mapping precipitation in Switzerland with ordinary
and indicator kriging. J. Geogr. Inf. Decision Anal. 2(2), 65–76.Benamghar, A. and Sonnet, P. H.: 1999, Performance comparison of cumulative and class
indicator approaches for pollution risk assessment, In: J. Gomez-Hernandez et al. (eds),
geoENV II Geostatistics for Environmental Applications. Kluwer Academic Publishers, TheNetherlands, pp. 453–464.
Bocchi, S., Castrignano, A. and Gerosa G.: 2001, Spatial patterns of soil seed-bank related tosome soil properties, In: J. Gomez-Hernandez et al. (eds), geoENV III Geostatistics for
Environmental Applications. Kluwer Academic Publishers, The Netherlands, pp. 503–504.
Figure 11. Prediction errors (left) and scatter diagram (right) among measured rain andthe indicator prediction of kriging.
N. DIODATO AND M. CECCARELLI240

Burrough, P. A.: 2001, GIS and geostatistics: Essential partners for spatial analysis. Environ.Ecol. Stat. 8, 361–377.
Burrough, P. A. and McDonnell R. A.: 1998, Principles of Geographical Information Systems.Oxford University Press, New York, pp. 98–161.
Buttafuoco, G., Castrignano, A. and Stelluti, M.: 2000, Accounting for local uncertainty in
agricultural management decision making. 7th ICCTA International Congress for Com-puter Technology in Agriculture. Florence, November 15–18th, 1998, pp. 510–517.
Carlson, R. A., Osiensky, J. L.: 1998, Geostatistical analysis and simulation of nonpointsource groundwater nitrate contamination: A case study. Environ. Geosci. 5(4), 177–186.
Castrignano, A., Mazzoncini, M., Giugliarini, L. and Risaliti R. 1999. A geostatistical ap-proach to management decision making in alkaili soil improvement. Ital. J. Agro. 2(2),133–140.
Clark, M. J. and Smith, F. B.: 1988, Wet and dry deposition of Chernobyl releases. Nature332, 245–249.
Daly, C., Gibson, W. P., Taylor, G. H., Johnson, G. L. and Pasteris, P.: 2002, A knowledge-
based approach to the statistical mapping of climate. Clim. Res. 22, 99–113.Deutsch, C. V., Journel, A. G.: 1998, GSLIB Geostatistical Software Library and User’s Guide.
Oxford University Press, 345 pp.
Goovaerts, P.: 1994. Comparative performance of indicator algorithms for modeling condi-tional probability distribution functions. Math. Geol. 26(3), 389–411.
Goovaerts, P.: 1997, Geostatistics for Natural Resources Evaluation. Oxford Univ. Press, NewYork, 294 pp.
Halvorson, J. J., Jeffrey, L. Smith, R., Papendick, I.: 1996, Integration of multiple soilparameters to evaluate soil quality: A field example. Biol. Fertil. Soil 21(3), 207–214.
Isaaks, E. H. and Srivastava, R. M.: 1989, An Introduction to Applied Geostatistics. Oxford
University Press, New York.Johnston, K. Ver Hoef, J. M. Krivoruchko, K. and Lucas, N.: 2001, Using ArcGis Geosta-
tistical Analyst. ESRI, 300 pp.
Journel, A. G.: 1983, Non-parametric estimation of spatial distributions. Math. Geol. 15, 445–468.
Journel, A. G.: 1984, Indicator approach to toxic chemical sites. Project No. CR-811235-02-0.Stanford CA: Leland Stanford Jr. University and U.S. Environmental Protection Agency.
Journel, A. G.: 1988, Non-parametric geostatistics for risk and additional sampling assess-ment, In: L. Keith (ed), Principles of Environmental Sampling, Am. Chem. Soc., Wash-ington, DC, pp. 45–72.
Journel, A. G. and Huijbregts, C. J.: 1978, Mining Geostatistics. Academic Press, New York,600 pp.
Kitanidis, P. K.: 1997, Introduction to Geostatistics: Applications to Hydrogeology. Cambridge
University Press, 246 pp.Kyriakidis, P. and Dungan, J. L.: 2001, A geostatistical approach for mapping thematic
classification accuracy and evaluating the impact of inaccurate spatial data on ecological
model prediction. Environ. Ecol. Stat. 8(4), 311–330.Krivoruchko, K.: 2001, Using linear and non-linear kriging interpolators to produce proba-
bility maps. Report presented at Annual Conference of the International Association forMathematical Geology, Cancun, Mexico, 16 pp.
Lanza, L. G., Ramirez, J. A. and Todini E.: 2001, Stochastic rainfall interpolation anddownscaling. Hydrol. Earth Syst. Sci. 5(2), 139–143.
Lin, Y. P., Chang, T. K., Shih, C. W., Tseng, C. H.: 2002, Factorial and indicator kriging
methods using a geographic information system to delineate spatial variation and pollu-tion sources of soil heavy metals. Environ. Geol. 42(8), 900–909.
GIS AND GEOSTATISTICS FOR MODELLING 241
Luoto, M., Rekolainen, S., Salt, C. A. and Hansen, H. S.: 2001, Managing radioactivelycontaminated land: Implications for habitat diversity. Environ. Manage. 27(4), 595–608.
Mohammadi, J., Van Meirvenne, M., Goovaerts, P.: 1997, Mapping cadmium concentrationand the risk of exceeding a local sanitation threshold using indicator geostatistics. In:GeoENV-I Geostatistics for Environmental Application, Kluwer Academic Publishers, The
Netherlands, pp. 389–400.Oliver, M. A. Webster, R. and McGrath S. P.: 1996, Disjunctive kriging for environmental
management. Environmetrics 7, 333–358.Pardo-Iguzquiza, E.: 1998, Inference of spatial indicator covariance parameters by maximum
likelihood using MLREML. Comput. Geosci. 24(5), 453–464.Saito, H. and Goovaerts, P.: 2002, Accounting for measurement error in uncertainty modeling
and decision-making using indicator kriging and p-field simulation: Application to a di-
oxin contaminated site. Environmetrics 13, 555–567.Savelieva, E., Kanevshi, M. Demyanov, V. Chernov, S. and Maignan, M.: 1999, Conditional
stochastic cosimulations of the Chernobyl fallout. In: J. Gomez-Hernandez et al. (eds),
geoENV II Geostatistics for Environmental Applications. Kluwer Academic Publishers, TheNetherlands, pp. 453–464.
SISTAN (Sistema Statistico Nazionale), 1994, Benevento in cifre: Notiziario statistico ed
economico provinciale 1, pp. 14–15.Smith, M. L. and Williams, R. E.: 1996, Examination of methods for evaluating remining a
mine waste site. Part II. Indicator kriging for selective remediation. Eng. Geol. 43, 23–30.Stein, A., Riley, J., Halberg, N.: 2001, Issues of scale for environmental indicators. Agric.
Ecosys. Environ. 87(2), 215–232.Tercan, A. E. and Ozcelik, Y.: 2000, Geostatistical evaluation of dimension-stone quarries.
Eng. Geol. 58, 25–33.
Thieken, A. H.: 1998, Stimating daily regional rainfall fields by multiquadratic functions:Accuracy of interpolation and decision making. J. Geogr. Inf. Decision Anal. 2(2), 168–181.
Vackernagel, H.: 1998, Multivariate Geostatistics: an Introduction with Applications. Second,
completely revised Edition, Springer-Verlag, Berlin, Germany, 283 pp.Wendelberger, J. G.: 1998, The estimation of rainfall distribution for emergency response to
Chernobyl type incidents utilizing multidimensional smoothing splines. J. Geogr. Inf.Decision Anal. 2(2), 182–193.
Wernli, C.: 1987, Radioactive deposition after Chernobyl accident. Radiation Prot. Dosim.19(4), 232–240.
Zanella, G.: 1988, L’inquinamento atmosferico ignora i confini: l’esemplare episodio di
Cernobyl. Bollettino della Societa Geografica Italiana, XI (5), 35–72.
N. DIODATO AND M. CECCARELLI242