calculation of contaminated soil volumes : geostatistics ... · better understand the...
TRANSCRIPT

Calculation of contaminated soil volumes :Geostatistics applied to a hydrocarbons spill
Lac Megantic Case
www.envisol-canada.ca
1
Sara Godoy del Olmo

CONTEXT OF THE STUDYThis study was conducted for pedagogical purposes
In June 2014 a geostatistical training was performed for the EnvironmentalMinistry of Quebec and for other public and private companies in order tobetter understand the Geostatistical method and its applications to thecontaminated sites
The data set obtained in the Lac Megantic first characterizations was usedfor performing the study case during this training
Geostatistics: study of a PH contamination
2

PetroleumHydrocarbons
Geostatistics: study of a PH contamination
3

OBJECTIVES OF THE GEOSTATISTICAL STUDYThe geostatistical treatment has been performed in order to:
• Accurately understand the contaminants’ behaviour in soil (correlations betweencontamination and depth/topography/geology…)
• Once the behaviour of the contamination is established, we perform acontamination mapping in order to visualize the pollution migration
• Delineate, if possible, the pollution extent and the volumes of contaminated soilaffected by the PH spill
Geostatistics: study of a PH contamination
4

1. Data field integration
2. Exploratory Data Analysis
3. Variogram fitting
4. Interpolation methods:Krigging / Simulations
5. 3D mapping / Estimate ofcontaminated soil volumes
Remember:
A geostatistical study is conducted as follows:
Geostatistics: study of a PH contamination
5

1. Integrating the field data
Laboratory data
- In total, 450 PH laboratory analyses- Preferential sampling performed in surface fills- Maximum sampling depth = 8 m
Field Data: geology
- Fills layer (0-2m) and natural soil (silt and clay) until 8 m depth
Remediation threshold
Field data must be geo-referenced in a coordinate X Y Z system
Geostatistics: study of a PH contamination
6
700 ppm for the PH

2. Exploratory Data Analysis
Objectives:
Geological study,
Contamination base map,
Quick statistics, histograms
Correlations between concentration and depth/geology,
Experimental variogram construction
Geostatistics: study of a PH contamination
7

2. Exploratory Data Analysis
Contamination base map
0 10000 20000 30000 40000 50000 60000 70000 80000Contamin C10-C50
0.00.10.20.30.40.50.60.70.80.9
Frequencies
Nb Samples: 450Minimum: 100.0000Maximum: 79000.0000Mean: 2556.0222Std. Dev.: 7816.4959
Geostatistics: study of a PH contamination
8

2. Exploratory Data Analysis
Correlation between concentration and depth
719,5
5291,51
1513,911935,5
1016,81900
137,72115,38533,33
133,33 0 0 0 0 0 1000
1000
2000
3000
4000
5000
6000
Conc
entr
atio
n m
oyen
ne e
n C1
0-C5
0(p
pm)
The highest concentrations aremeasured between 0.5 and 1 m depth
Geostatistics: study of a PH contamination
9

2. Exploratory Data Analysis
Sampling
fills Sand, gravel, Silt-F
Natural soil Silt-NS, clay, organic matter
Geostatistics: study of a PH contamination
10

2. Exploratory Data Analysis
Correlation between concentration and geology
Lithology Code Frequency EffectiveMean
(PH ppm)
Minimum
concentrationMaximum concentration
2. Gravel 2 11,8 53 7584,53 100 42018,9
3. Sand 3 50,2 225 2539,87 100 79019,9
4. Silt_F 4 7,6 34 1904,41 100 30005,4
5. Silt_NS 5 28,1 126 870,95 100 25004,1
1. Clay 1 0,7 3 100 100 100
6. Org Matter 6 1,6 7 137,14 100 281,07
Geostatistics: study of a PH contamination

2. Exploratory Data Analysis
Experimental Variogram Construction
B.1/ Isotrope Directional Variogram– NO/D90
N0
19
13822349271029123501
34243760
399041663929
D-901
1
543
0 100 200 300Distance (m)
-1.0e+0070.0e+0001.0e+0072.0e+0073.0e+0074.0e+0075.0e+0076.0e+0077.0e+0078.0e+007
Variogram:ContaminC10-C50
Contamin C10-C50D-90
85
160
16 3
0 1 2 3 4 5Distance (m)-1
.0e+0070.0e+0001.0e+0072.0e+0073.0e+0074.0e+0075.0e+0076.0e+007
Variogram:ContaminC10-C50
Contamin C10-C50
Geostatistics: study of a PH contamination
12

3. Variogram Fitting
Géostatistique: étude d’une contamination aux HP et au Ni
N0
19
13822349271029123501
34243760
399041663929
D-903
3
9
0 100 200 300Distance (m)
-1.0e+0070.0e+0001.0e+0072.0e+0073.0e+0074.0e+0075.0e+0076.0e+0077.0e+0078.0e+007
Variogram:ContaminC10-C50
0 1 2 3Distance (m)0.
0e+0001.0e+0072.0e+0073.0e+0074.0e+0075.0e+0076.0e+007
Variogram:ContaminC10-C50
B.1/ Isotrope Directional Variogram– NO/D90
13

3. Variogram Fitting
Cross Validation
Mean VariancePercentage of robust
dataCorrelation
Coefficient Z/Z*
3D VariogramError -44.55817 29886681.8726
98.6 0.687Standard error -0.00355 0.96465
Geostatistics: study of a PH contamination
14

4. Interpolation method: ordinary krigging
Petroleum Hydrocarbons 0-2 m
Geostatistics: study of a PH contamination
15

4. Interpolation method: ordinary krigging
Petroleum Hydrocarbons 2-2.5 m
Geostatistics: study of a PH contamination
16

4. 4. Interpolation method: ordinary krigging
Petroleum Hydrocarbons 2.5-5 m
Geostatistics: study of a PH contamination
17
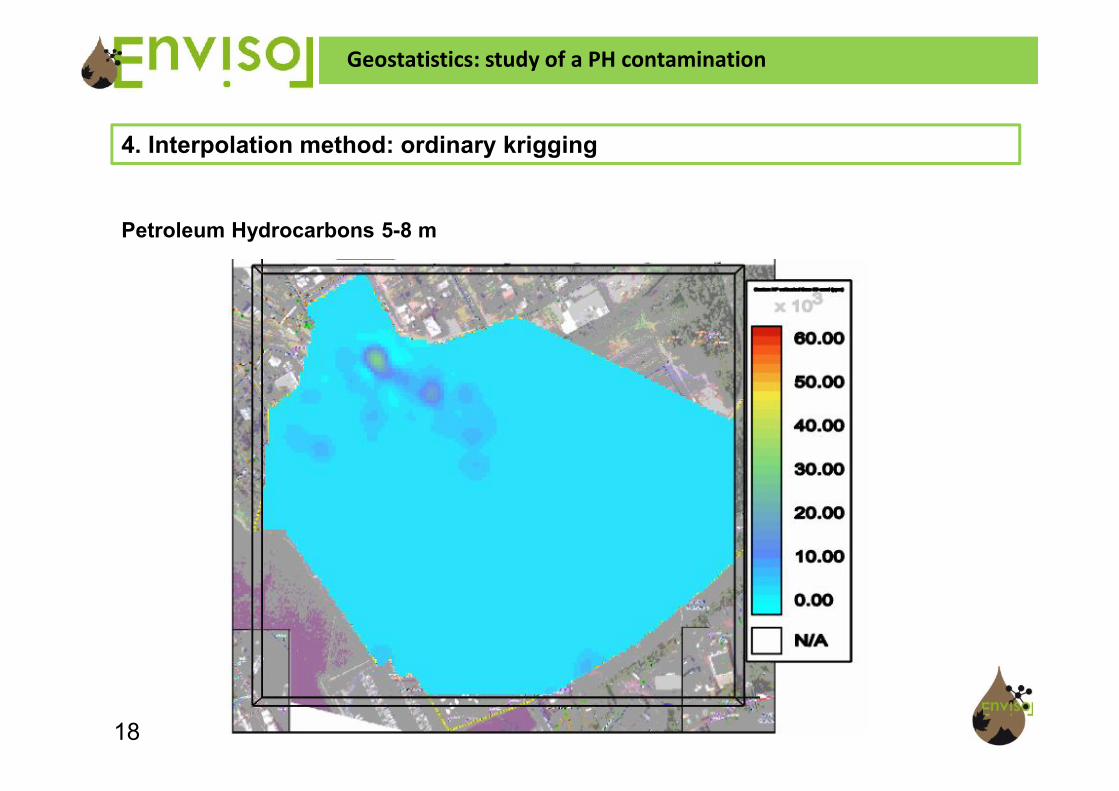
4. Interpolation method: ordinary krigging
Petroleum Hydrocarbons 5-8 m
Geostatistics: study of a PH contamination
18

4. Interpolation method: ordinary krigging
Petroleum Hydrocarbons – 3D view
Geostatistics: study of a PH contamination
19

4. Interpolation method: ordinary krigging
Is the whole site contaminated? Why?
Geostatistics: study of a PH contamination
20
Petroleum Hydrocarbons Concentrations > 700 ppm - 3D view

4. Interpolation method: ordinary krigging
Krigging reproduces the expected value of the distribution: estimates are stronglyinfluenced by the mean value of the distribution
0 10000 20000 30000 40000 50000 60000Contam HP estimated Sara 3D omni
0.0
0.1
0.2
0.3
0.4
0.5
0.6
Frequencies
Nb Samples: 56410Minimum: -3105.0647Maximum: 62710.9023Mean: 1685.3650Std. Dev.: 2420.8222
0 10000 20000 30000 40000 50000 60000 70000 80000Contamin C10-C50
0.00
0.25
0.50
0.75
1.00
Frequencies
Nb Samples: 361Minimum: 100.0000Maximum: 79000.0000Mean: 1986.1087Std. Dev.: 7518.6112
Original data histogramme - PH Krigging histogramme- PH
Geostatistics: study of a PH contamination
21
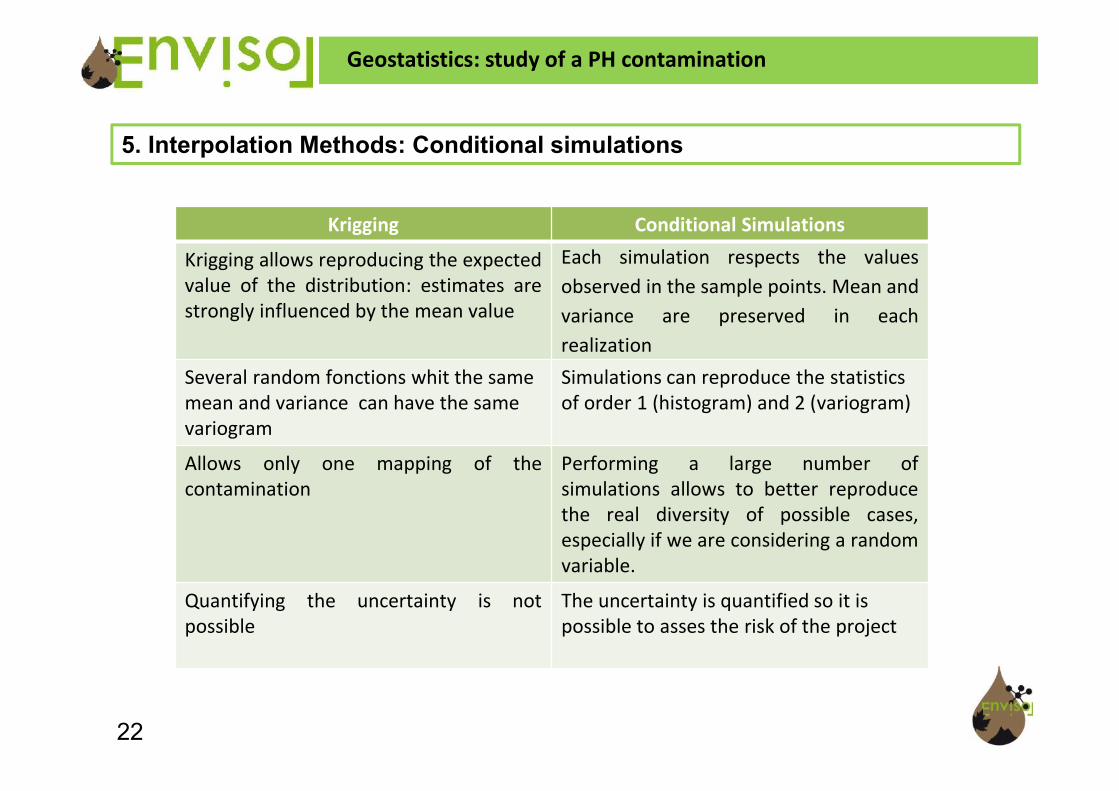
5. Interpolation Methods: Conditional simulations
Krigging Conditional Simulations
Krigging allows reproducing the expectedvalue of the distribution: estimates arestrongly influenced by the mean value
Each simulation respects the valuesobserved in the sample points. Mean andvariance are preserved in eachrealization
Several random fonctions whit the samemean and variance can have the samevariogram
Simulations can reproduce the statisticsof order 1 (histogram) and 2 (variogram)
Allows only one mapping of thecontamination
Performing a large number ofsimulations allows to better reproducethe real diversity of possible cases,especially if we are considering a randomvariable.
Quantifying the uncertainty is notpossible
The uncertainty is quantified so it ispossible to asses the risk of the project
Geostatistics: study of a PH contamination
22

5. Interpolation Method: Conditional Simulations
Conditional simulations allow us to perform several charts (with equal probability) to betterreflect the diversity of real possible cases
Simulation 1 : grid 5*5*0.5 m
Geostatistics: study of a PH contamination
23
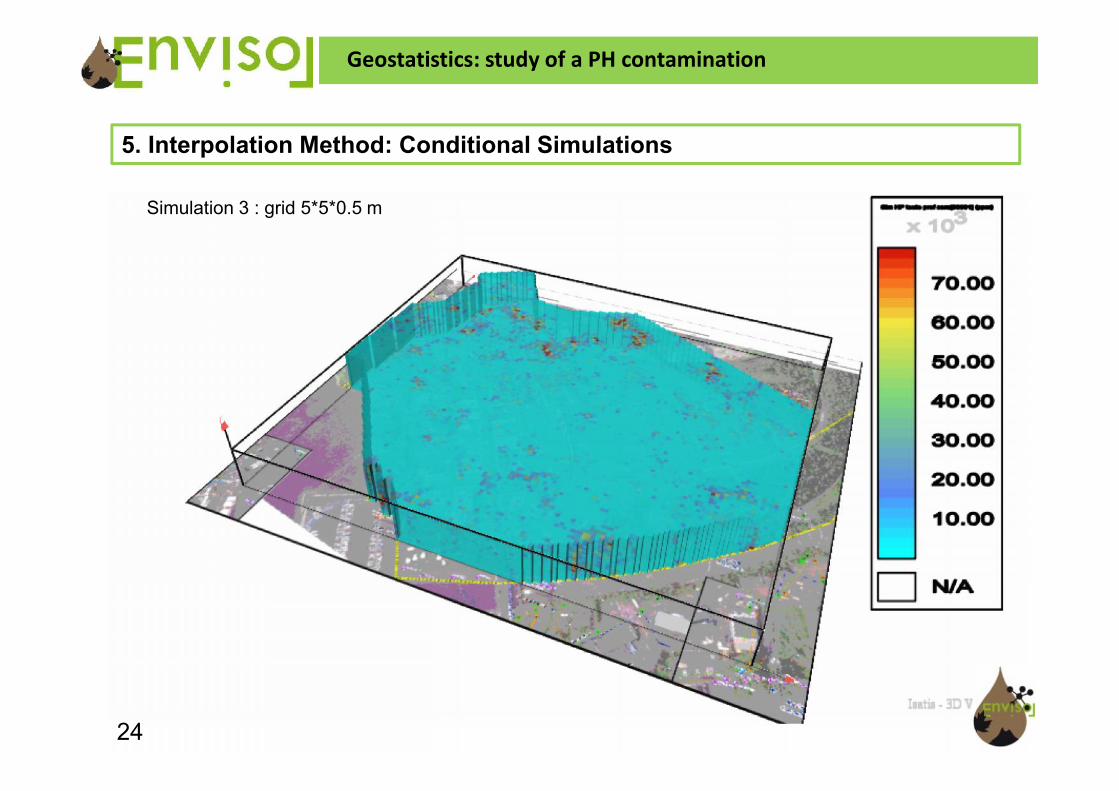
5. Interpolation Method: Conditional Simulations
Simulation 3 : grid 5*5*0.5 m
Geostatistics: study of a PH contamination
24

5. Interpolation Method: Conditional Simulations
Simulation 250: grid 5*5*0.5 metc…
Geostatistics: study of a PH contamination
25

5. Interpolation Method: Conditional Simulations
Performing a post-treatment of conditional simulations allows to ask the followingquestions:
• Where are the contaminated areas? This question is used to locally estimatethe risk of exceeding the remediation threshold
• What is the volume of contaminated soil ? This question is used to estimate theoverall level of contamination in the study area
How to answer these questions ???
Geostatistics: study of a PH contamination
26

5. Interpolation Method: Conditional Simulations
Where are the contaminated areas? This question is used to locally estimate the riskof exceeding the remediation threshold
Setting a remediation threshold probability map for the occurrence of PH in soil (foreach bloc) in concentrations higher than 750 ppm
Geostatistics: study of a PH contamination
27

5. Interpolation Method: Conditional Simulations
Blocks showing a probability of exceeding the remediation threshold greater than 0.6%
Geostatistics: study of a PH contamination
28

5. Interpolation Method: Conditional Simulations
Which risk level are we willing to accept? How to manage blocks showing anuncertain estimate?
Blocks having a probability of exceeding the remediation threshold (750 ppm)between 0.3 and 0.6%
Geostatistics: study of a PH contamination
29
5. Interpolation Method: Conditional Simulations
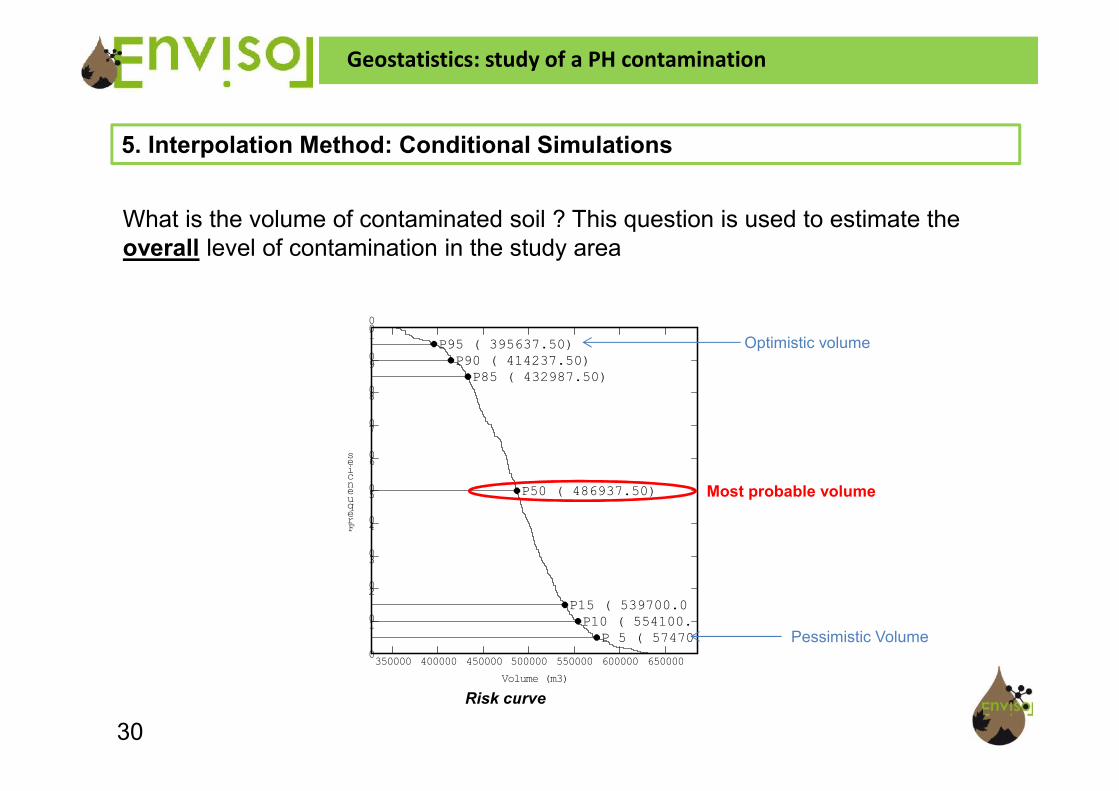
What is the volume of contaminated soil ? This question is used to estimate theoverall level of contamination in the study area
P 5 ( 57470P10 ( 554100.
P15 ( 539700.0
P50 ( 486937.50)
P85 ( 432987.50)P90 ( 414237.50)
P95 ( 395637.50)
350000 400000 450000 500000 550000 600000 650000Volume (m3)
0
10
20
30
40
50
60
70
80
90100
Frequencies
Risk curve
Most probable volume
Optimistic volume
Pessimistic Volume
Geostatistics: study of a PH contamination
30

5. Interpolation Method: Conditional Simulations
Performing conditional simulations shows that:
• The estimated volume of contaminated soil is between 574 700 m3 (pessimisticvolume) and 395 637 m3 (optimistic volume)
• The most probable volume is 486 937 m3, which corresponds to 25% probabilityof exceeding the remediation threshold (low risk)
• The uncertain volume (probability between 30% and 60%) represents a totalvolume of 237 787 m3
• This volume represents 48% of the most probable contaminated volumeannounced by the risk curve
Geostatistics: study of a PH contamination
31

5. Interpolation Method: Conditional Simulations
The calculations show a great uncertainty of the contaminated soil estimate
900 1000 1100 1200 1300 1400 1500X (m)
-8
-7
-6
-5
-4
-3
-2
-1
0
Z(m)
Sampling barelyperformed from 5 m
depth
Geostatistics: study of a PH contamination
32

5. Interpolation Method: Conditional Simulations
If the estimate is stopped at 5 m depth:
P 5 ( 298400P10 ( 283475.00
P15 ( 278175.00)
P50 ( 248250.00)
P85 ( 219700.00)P90 ( 214100.00)
P95 ( 208575.00)
200000 250000 300000 350000Volume (m3)
0
10
20
30
40
50
60
70
80
90100
Frequencies
• The difference between the pessimistic and optimisticvolumes is less important,
• The most probable volume is 248,250 m3, which ishalf of the uncertain volume calculated above, andcorresponds to approximately 25% probability ofexceeding the remediation threshold
• The volume of contaminated soil showing uncertainestimation (30% to 60% probability of exceeding thethreshold) is 66 375 m3
• This volume represents 25% of the most probablecontaminated volume (P50) announced by the riskcurve
Geostatistics: study of a PH contamination
33

5. Interpolation Method: Conditional Simulations
Mapping : Soil having 25% probability or more of being above the remediation threshold and correspondingto the most probable contaminated volume
Geostatistics: study of a PH contamination
34

5. Interpolation Method: Conditional Simulations
Blocks having a probability greater than 0.6% of exceeding 750 ppm
Changing the grid: blocks size = 25*25*1 m
Geostatistics: study of a PH contamination
35

5. Interpolation Method: Conditional Simulations
Blocks with 30 to 40% probability ofexceeding the criterion
Blocks with 40 to 60% probability ofexceeding the criterion
Blocks with more than 60% probability ofexceeding the criterion
It is possible to produce maps suitable for decontamination which will be based on the risk weare willing to take in order to define a real strategy for the remediation project
Geostatistics: study of a PH contamination
Changing the grid: blocks size = 25*25*1 m
36

Comparison between different methods: Polygons vs Geostatistics
Polygons method performed according to the observed geology (thickness of the fills layer)
Geostatistics: study of a PH contamination
37
Total volume103 000 m3
to 126 300 m3

Risk curve
Risk curve performed on the fills forthe north area, along the railways
P 5 ( 92050.0P10 ( 88675.00)
P15 ( 85950.00)
P50 ( 77975.00)
P85 ( 70275.00)P90 ( 68500.00)
P95 ( 65275.00)
60000 70000 80000 90000 100000 110000Volume (m3)
0
10
20
30
40
50
60
70
80
90100
Frequencies
Geostatistics: study of a PH contamination
Comparison between different methods: Polygons vs Geostatistics
38

Conclusions
Performing the geostatistical study highligths the following information :
• Geostatistics provide a coherent analysis of data collected at each step of a contaminated sitecharacterization by performing statistical processing of spatial data.
• Geostatistics’ ultimate goal is to determine the uncertainties associated to interpolationmethods in order to reduce the financial risks of remediation sites projects.
• The choice of the geostatistical method used for each project has a large influence whenmaking estimates, especially if the original data does not show a clear spatial structure. Tomake relevant calculations, it is necessary to conduct a comprehensive analysis of the inputdata before integrating it into the geostatistical treatment. Each choice must be justified bythe geostatistical theories but also judged by the experts working on contaminated sites.
Geostatistics: study of a PH contamination
39

Thank you for your attention
40