geog martin brokeroff-urban growth in dcs
TRANSCRIPT

8/8/2019 Geog Martin Brokeroff-Urban Growth in DCs
http://slidepdf.com/reader/full/geog-martin-brokeroff-urban-growth-in-dcs 1/22
P O P U L ATI O N A N D D E V E L O P M E N T R E VI E W 2 5 ( 4 ) : 7 5 7 – 7 7 8 ( D E C EM B E R 1 9 9 9 ) 7 5 7
D A T A A N D P E R S P E CT I V E S
Urban Grow th inDe ve lopin g Cou nt ries:A Review of Project ion sand Pred iction s
M ARTIN BROCKERHOFF
BECAUSE THE YEAR 2000 figures prominently in urban population projec-tions, it is timely to assess whether the United Nations’ earliest projectionsof urban population growth in developing countries, made in the 1970s,have been reasonably accurate, and if not, why. Despite being accompa-nied by advice to interpret urban population projections with caution and
not as forecasts (United Nations 1980), these early projections of rapidgrowth fueled comm on perceptions of an impending “urban popu lation ex-plosion” in poor countries (Bairoch 1988; Schiffer 1989), while providingmany governments with a pretext for concentrating economic resourcesand focusing population control efforts, such as restrictions on in-migra-tion, in big cities (Badshah 1996; United Nations 1981).
The recent availability of data from the 1990-rou nd censuses makes itequally opportun e to examine wh eth er influential predictive models of u r-ban and city growth in developing count ries, published arou nd 1980, haverem ained robust over time . The most prominent of these models were pe s-simistic in assessing the prospects for m odifying rapid urban growth th roughdirect interventions in cities and against urban in-migration. Economistsconcluded that pricing policies biased in favor of cities, as well as nationaldevelopmen t strategies and global econom ic conditions th at spurred man u-facturing rather than agricultural productivity, made rapid urban growthuntil th e year 2000 likely (Kelley and Williamson 1984b: Table 6.6). Mean -wh ile, dem ographers linked city growth rates closely with na tional popula-tion growth rates, implying that municipal authorities and planners werevirtually powerless in controlling the fu tu re sizes of th eir cities (Un ited Na-tions 1980: 43). These empirical stu dies supported Lipton ’s (1976) thesis of “urban bias,” wh ich conten ds that economic developmen t policies of gov-ernments in low-income countries favor cities to such an extent as to un-
8/8/2019 Geog Martin Brokeroff-Urban Growth in DCs
http://slidepdf.com/reader/full/geog-martin-brokeroff-urban-growth-in-dcs 2/22
7 5 8 U R B A N G R O W T H I N D E V E L O P I N G C O U N T R I E S
dermine efforts to slow urban growth, including measures to discouragerural-to-urban migration.
Con tradicting these scenarios of rapid growth, the United Nations and
urban scholars have ten tatively concluded th at rates of urban and city growthin the developing world have been slower in recent decades than w as oncean ticipated (Becker an d Morrison 1999; Satter thwaite 1996; United Nations1998). A glaring and often-cited example is Mexico City, whose estimatedcurren t population of about 18 m illion does not approximate th e more th an30 million inhabitants projected for 2000 as recently as 1980 (United Na-tions 1980). 1 Such discrepancy reflects in part the limitations of the data towh ich UN u rban estima tion an d projection procedures are applied. Yet, de-scriptive accoun ts are lacking to indicate w hether th e exper ience of Mexico
City is unique or w he ther it is illustrative of widespread, h ighly erron eousurban population projections at the regional, national, and city levels indeveloping countries. Moreover, it is not known whether slower-than-ex-pected urban growth has been consistent with economic trends that influ-ence migration between urban and rural areas, or with demographic fac-tors, such as declining national population growth . An examination of thepatterns and causes of unexpectedly slow urban growth in recent years isneeded to improve the basis for u rban popu lation projections in th e futur e,and thereby assist development planning. Such an exercise is also impor-tant for assessing the plausibility of current projections according to whichvirtu ally all world population growth in t he n ear futu re will occu r in u rbanareas of the developing world (United Nations 1998).
This article has two objectives: (1) to scrutinize the slower than for-merly an ticipated urban growth not ed by the United Nations for th e devel-oping world as a wh ole in recent years at lower levels of population aggre-gation—regions, countries, and cities—so as to ascertain whether thisphen omen on is comm on th roughout the South or, rather, is particular tocertain areas and sensitive to population size; and (2) to reevaluate thestrength of predictive models of city and urban growth developed around
1980 by demographers and economists, as typified respectively by Preston(1979) and Kelley and Williamson (1984a), in light of urban populationdata now available from the 1980- and 1990-round censuses, as well asdata accumulated since 1980 that may reflect changes in potent explana-tory factors (for instance, economic conditions). Reexamination of thesemodels may indicate the forces responsible for a slowdown of urban grow thin recent years, if this phenomenon has indeed occu rred.
An assessment of urb an popu lation p rojections to
the year 2000
The accuracy of population projections to 2000 and later dates can be as-sessed most conclusively through ex post facto comparisons of observed

8/8/2019 Geog Martin Brokeroff-Urban Growth in DCs
http://slidepdf.com/reader/full/geog-martin-brokeroff-urban-growth-in-dcs 3/22
M A R T I N B R O C K E R H O F F 7 5 9
popu lations in the twen ty-first centu ry to current ly available pu blished sta-tistics. For evaluation at present, one must accept the most recent UN ur-ban projections to 2000, revised in 1996, as reasonably correct given their
recent data base an d short projection period. Because the m eth odology em-ployed by the United Nations to estimate and project national urban andru ral populations was reformulated in th e late 1970s (United Nations 1980:9–11) and has not changed since then (United Nations 1998: 31–36), themost recent figures serve as a benchmark for determining to what extentsubsequen t developmen ts and th e u se of newly available data affected theaccuracy of projections made in 1980. 2 Compar ison of these sets of projec-tions is also appropriate to detect an unant icipated slowdown of urban growth,because the latest projections make full use of all available data from the 1980-
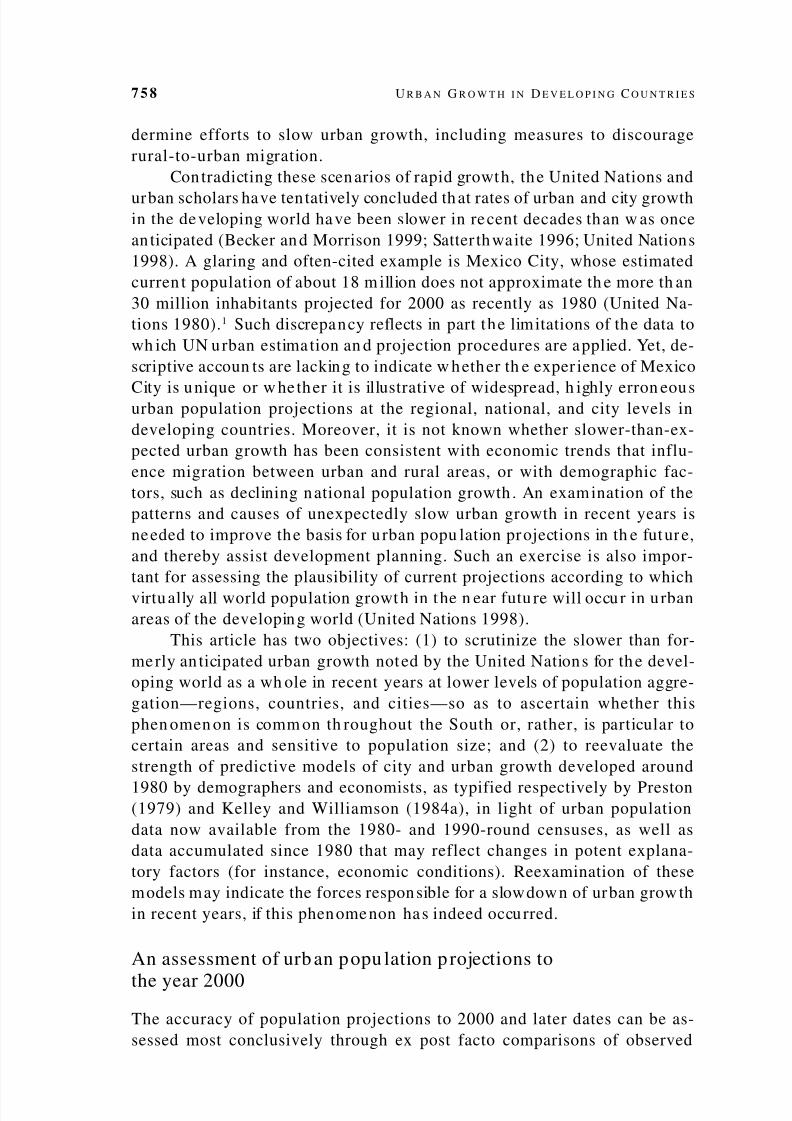
and 1990-rou nd censuses, whereas the earlier set of projections did not.Table 1 presents the size of the urban population in developing regionsand subregions in the year 2000, as projected in 1980 and 1996 by the UnitedNations. The figures in the table are derived from an identical group of 134countries classified as less developed in 1980 (therefore excluding those coun-tries in the former Soviet Union that are now classified as less developed) whosedefinitions of urban did not chan ge between th e two years. 3
The most recent United Nations projections foresee a less developedcoun try (LDC) u rban popu lation of somewh at under 1.9 billion in th e year2000, more than 10 percent (or 222 million) lower th an the somew hat over2.1 billion expected in 1980 (13 percen t lower if China is excluded) . In con-trast, the size of the projected total popu lation has been revised downwardby only 2 percent, and the size of the rural population has been revisedupward by 4 percent. These percentage changes suggest that the UnitedNations has been much more successful in projecting accurately the totalLDC population than the urban population. However, roughly half (110million) of the dow nward revision of the projected urban popu lation is at-tributable to the projected total population growth in th e developing worldthat was slower than an ticipated in 1980. 4 Slower total popu lation growth , in
turn , has largely resulted from faster-than-expected fertility declines in LDCs. 5
The 1996 projections of the size of the 2000 urban populations arelower th an those projected in 1980 in all major developing regions an d in10 of the 12 subregions listed in Table 1. Most striking is the shift in thesefigures for Latin Amer ica an d th e Caribbean: some 17 percent fewer urban-ites according to the 1996 projection (which corresponds to a sharply re-vised average annu al urban growth r ate between 1980 and 2000, from 3.31percent t o 2.54 percent). The u rban population of Asia in 2000 as projectedin 1996 is 105 million less than was projected in 1980, wh ile recen t u rban
growth in Africa—frequently claimed as occurring at high levels unprec-eden ted in history—has been appa ren tly occurring at an appreciably slowerpace than was ant icipated in 1980 (a t roughly 4.3 percen t per year, on av-erage, rather th an 4.8 percent).
8/8/2019 Geog Martin Brokeroff-Urban Growth in DCs
http://slidepdf.com/reader/full/geog-martin-brokeroff-urban-growth-in-dcs 4/22
7 6 0 U R B A N G R O W T H I N D E V E L O P I N G C O U N T R I E S
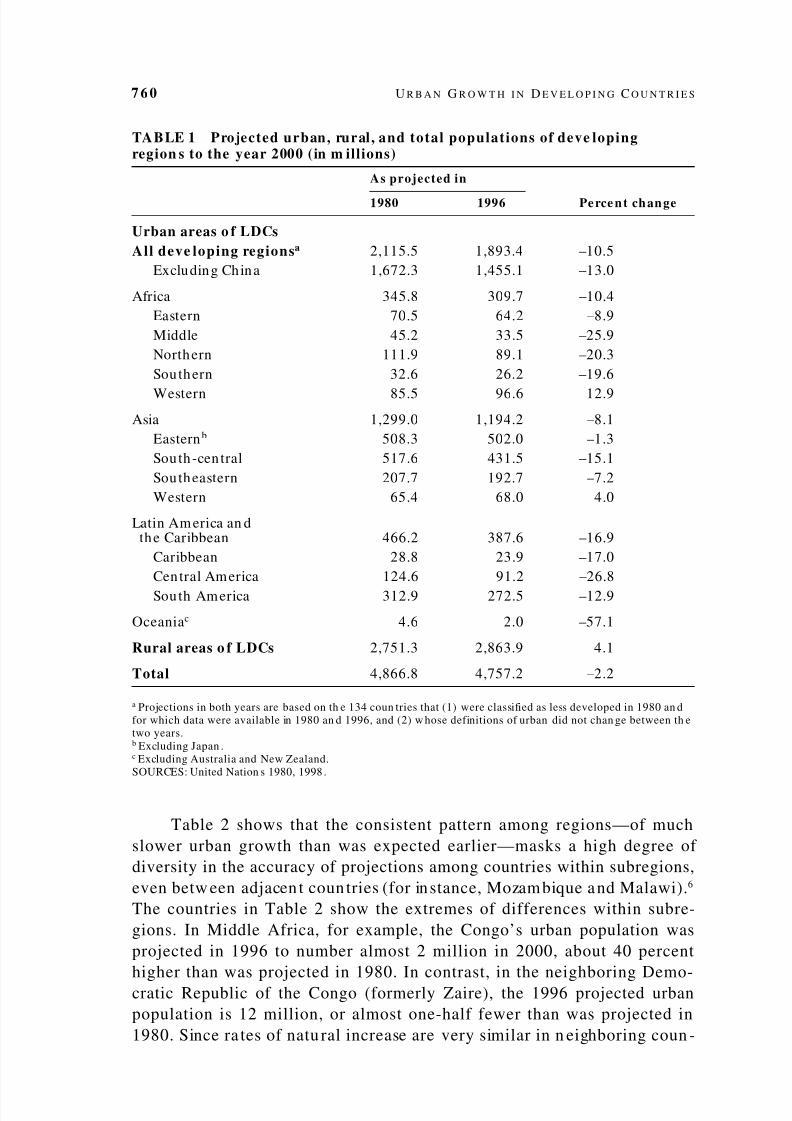
Table 2 shows that the consistent pattern among regions—of muchslower urban growth than was expected earlier—masks a high degree of diversity in the accuracy of projections among countries within subregions,even betw een adjacen t coun tries (for in stance, Mozambique and Malawi). 6
The countries in Table 2 show the extremes of differences within subre-gions. In Middle Africa, for example, the Congo’s urban population wasprojected in 1996 to number almost 2 million in 2000, about 40 percenthigher than was projected in 1980. In contrast, in the neighboring Demo-cratic Republic of the Congo (formerly Zaire), the 1996 projected urbanpopulation is 12 million, or almost one-half fewer than was projected in1980. Since ra tes of natu ral increase are very similar in n eighboring coun -
TABLE 1 Projected urban, rural , and total populations of deve lopingregion s to the year 2000 (in m illions)
As projected in
1980 1996 Perce n t change
Urban areas o f LDCsAll deve loping regions a 2,115.5 1,893.4 –10.5
Excluding Ch ina 1,672.3 1,455.1 –13.0
Africa 345.8 309.7 –10.4Eastern 70.5 64.2 –8.9Middle 45.2 33.5 –25.9Northern 111.9 89.1 –20.3Sou thern 32.6 26.2 –19.6
Western 85.5 96.6 12.9Asia 1,299.0 1,194.2 –8.1
Eastern b 508.3 502.0 –1.3Sou th -cen tral 517.6 431.5 –15.1Sou theastern 207.7 192.7 –7.2Western 65.4 68.0 4.0
Latin Am erica an dthe Caribbean 466.2 387.6 –16.9
Caribbean 28.8 23.9 –17.0Cen tral America 124.6 91.2 –26.8Sou th America 312.9 272.5 –12.9
Oceania c 4.6 2.0 –57.1
Rural areas o f LDCs 2,751.3 2,863.9 4.1
Total 4,866.8 4,757.2 –2.2
a Projections in both years are based on th e 134 coun tries that (1) were classified as less developed in 1980 an dfor which data were available in 1980 an d 1996, and (2) w hose definitions of urban did not chan ge between th etwo years.b Excluding Japan .c Excluding Australia and New Zealand.SOURCES: United Nation s 1980, 1998 .
8/8/2019 Geog Martin Brokeroff-Urban Growth in DCs
http://slidepdf.com/reader/full/geog-martin-brokeroff-urban-growth-in-dcs 5/22
M A R T I N B R O C K E R H O F F 7 6 1
tries throughout Africa, such large discrepancies—great upward revisionsin one country and massive downward revisions in another—suggest thatearly projections of urban growth in African countries were based on too
TABLE 2 Extreme s of intraregional differences in UN urban populationprojectio ns to th e ye ar 2000 (in thou sands)
As projected in
Regio n Co un try a 1980 1996 Percen t ch an ge b
AfricaEastern Mozambique 3,199 7,869 146.0
Malawi 6,489 1,686 –74.0
Middle Rep. of Congo 1,347 1,865 38.5Dem. Rep. of Congo 27,839 15,670 –45.4
(Zaire)
Northern Libya 3,405 5,597 64.4Sudan 16,551 10,772 –34.9
Sou thern Lesotho 217 641 195.4Sou th Africa 30,109 23,291 –22.4
Western Senegal 3,002 4,463 48.7Ghana 10,843 7,644 –29.5
Largest coun tries Nigeria (Western ) 45,041 55,561 25.8Egypt (Northern ) 37,048 31,297 –16.5
AsiaEastern Hong Kong 5,210 6,097 17.0
Dem. Rep. of Korea 20,006 15,021 –24.9
Sou th -cen tral Nepal 2,275 2,893 27.2
Sri Lanka 8,860 4,434 –48.8Sou theastern Singapore 2,453 3,587 46.2
Vietnam 27,574 15,891 –42.4
Western Oman 248 2,282 820.2Lebanon 5,269 2,951 –44.3
Largest coun tries China (Eastern ) 443,213 438,263 –1.1India (Sou th -cen tral) 360,688 286,323 –20.6
Latin Am erica andth e Caribbean
Caribbean Haiti 2,765 2,727 –1.4Domin ican Republic 7,834 5,537 –29.3
Cen tral America Costa Rica 2,067 1,970 –4.7El Salvador 4,628 2,947 –36.3
Sou th America Argen tina 28,875 33,089 14.6Colombia 41,779 29,154 –30.2
Largest coun tries Brazil (Sou th ) 163,027 137,527 –15.6Mexico (Cen tral) 102,293 73,553 –28.1
a Excluding countries with an estimated total population less than 2 million in 1995 (United Nations 1998).b Median chan ge for 134 developing countries: –7.5 percent.SOURCES: United Nation s 1980, 1998 .

8/8/2019 Geog Martin Brokeroff-Urban Growth in DCs
http://slidepdf.com/reader/full/geog-martin-brokeroff-urban-growth-in-dcs 6/22
7 6 2 U R B A N G R O W T H I N D E V E L O P I N G C O U N T R I E S
few reliable data sources to be taken seriously, or that these projectionswere subsequen tly nu llified by un foreseen pattern s of migration .
In South eastern Asia, Singapore and Vietnam exh ibit a pattern similar
to that of the two countries of Middle Africa just cited, with Vietnam ex-pected to have in 2000 just over half the urban population that was pro-
jected in 1980. In Latin America, th e 1980 projections of the u rban popu la-tion for 2000 have been revised downw ard in 1996 for all coun tries exceptArgentina, Bolivia, and Paraguay. In El Salvador the 1996 projection waslower by 36 percent. Upward revisions of anticipated u rban popu lations incountries such as Lesotho and Oman are not surprising, given the smallinitial size of the urban populations. Revisions of the magnitude made, forexample, for Vietnam and South Africa, however, are significant also in
term s of the absolut e n um bers of persons involved.Comparison of Tables 1 and 2 reveals that the much-revised urbanprojections of subregions correspond closely to revised projections for thelargest countries in those subregions. This is clearly the case with Egypt,China, India, Brazil, Mexico, and their respective subregions. The excep-tional upward revision in 1996 as compared to 1980 of Western Africa’su rban population projected to 2000, by 13 percen t, is largely a result of a26 percent upward revision for urban Nigeria, where about 60 percent of Western Africa’s urbanites reside. The seemingly accelerated urban growthof Nigeria in the 1980s and 1990s is remarkable given that the projectedtotal population of the country in 2000—which was much influenced bythe surpr ising resu lts of the 1991 census—was revised downward by 18 per-cent between 1980 and 1996, from 135 to 111 million; as a result of thetwo revisions, Nigeria’s expected level of urbanization in 2000 has beenchan ged from 33 to 44 percent. 7 The consisten cy of the tw o projections forChina, despite chan ge in th e n ational definition of urban dur ing 1980–96,has been explained by Banister ( 1997: 79–80). 8 The revised projection forurban India—of 75 million fewer urban residents projected in 1996 thanwas projected in 1980—is by far th e largest absolu te chan ge of an y coun try,
and represents a decrease in the 1980–2000 average annual urban growthrate from 4.24 percent to 2.95 percent. 9
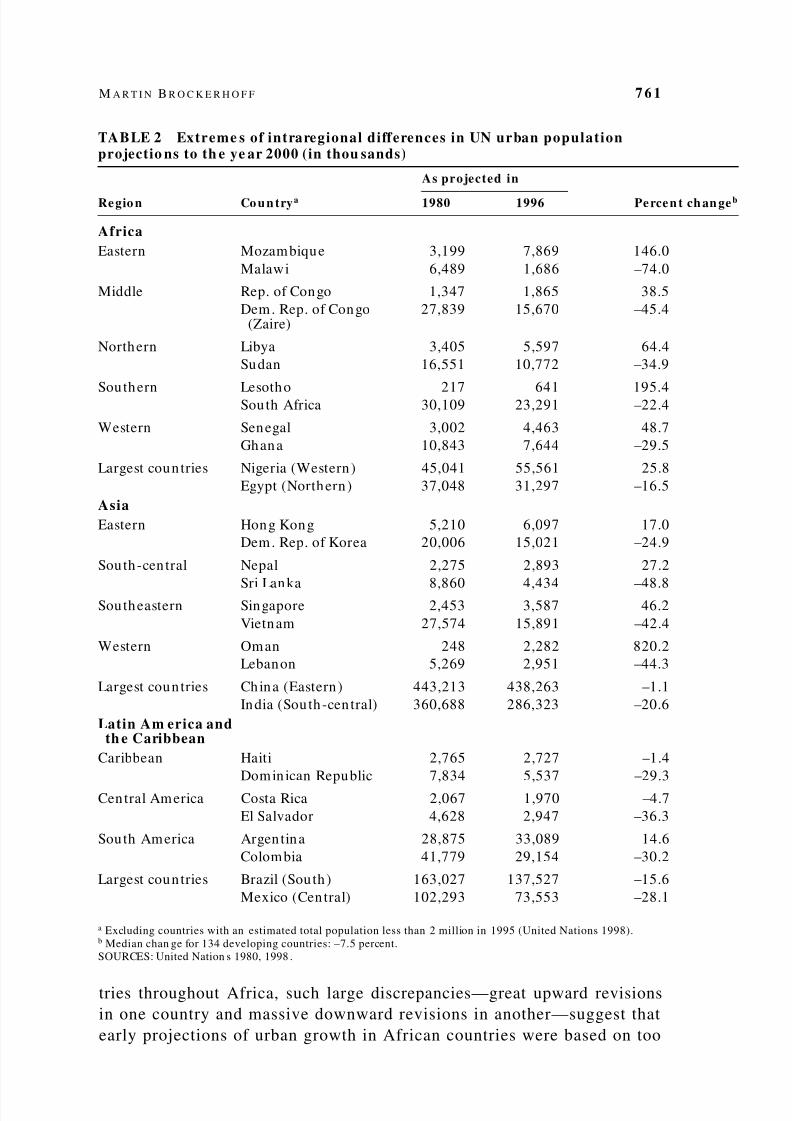
Table 3 compares projections to the year 2000 m ade in 1980 and 1996for th e largest cities of the 15 m ost populous coun tries in each of the th reemajor developing regions. The same definition of each city—as an agglom-eration, the city proper, or by the application of some other criterion—isused for both years. Most of the early projections of LDC city growth ap-pear to have been far too high, indicating the weakness of data on whichcity population statistics, in particular, are calculated. In each region, the
2000 population projected in 1980 has been lowered in the 1996 projec-tions in 9 or 10 of the 15 cities. The 13-million down ward revision of theprojection for Mexico City is hardly exceptional: projections for Shanghai,Jakarta, Baghdad, and São Paulo have each been lowered by more than 6
8/8/2019 Geog Martin Brokeroff-Urban Growth in DCs
http://slidepdf.com/reader/full/geog-martin-brokeroff-urban-growth-in-dcs 7/22
TABLE 3 Projected popu lation in 2000 of the largest city in the 15 largestcountries in e ach deve loping region (in tho usands)
As projected in
Region /coun try Largest city 1980 1996 Perce n t change a
AfricaNigeria Lagos 4,518 13,488 198.5Egypt Cairo 13,058 10,772 –17.5Eth iopia Addis Ababa 5,600 3,112 –44.4Dem. Rep. of Congo Kinshasa 8,411 5,068 –39.7Sou th Africa Cape Town 2,850 3,092 8.5Tanzan ia Dar es Salaam 4,645 2,051 –55.8Algeria Algiers 2,643 4,447 68.3Kenya Nairobi 4,869 2,320 –52.4Sudan Khartoum 5,079 2,748 –45.9Morocco Casablanca 4,624 3,535 –23.5Uganda Kam pala 3,015 1,207 –60.0
Ghana Accra 3,842 2,010 –47.7Mozambique Maputo 2,619 3,017 15.2Madagascar Antananarivo 1,880 1,128 –40.0Ivory Coast Abidjan 1,800 3,359 86.6
AsiaChina Shanghai 22,677 14,173 –37.5India Bom bay 17,056 18,042 5.8Indonesia Jakarta 16,591 9,815 –40.8Pakistan Karach i 11,774 11,774 0Bangladesh Dhaka 9,725 10,979 12.9Vietnam Ho Chi Minh City 4,502 3,678 –18.3
Iran Teheran 11,329 7,380 –34.9Ph ilippines Metro Manila 12,313 10,818 –12.1Thailand Bangkok 11,936 7,221 –39.5Myanmar Yangon 4,747 4,458 –6.1Rep. of Korea Seou l 14,246 12,215 –14.3Afghan istan Kabu l 1,270 2,716 113.9Dem. Rep. of Korea Pyongyang 2,240 2,726 21.7Iraq Baghdad 11,125 4,796 –56.9Malaysia Kuala Lumpur 2,552 1,378 –46.0
Latin Am erica andth e Caribbean
Brazil São Pau lo 25,796 17,711 –31.3Mexico Mexico City 31,025 18,131 –41.6Colombia Bogotá 6,834 6,834 0Argen tina Buenos Aires 12,104 12,431 2.7Peru Lima 8,930 7,443 –16.7Venezuela Caracas 5,209 3,153 –39.5Chile San tiago 5,760 5,261 –8.7Ecuador Guayaqu il 2,370 2,127 –10.3Guatem ala Guatemala City 2,084 2,697 29.4Cuba Havana 3,213 2,302 –28.4Domin ican Republic San to Domingo 4,176 3,601 –13.8Bolivia La Paz 1,963 1,458 –25.7
Haiti Port-au -Prince 1,558 1,791 15.0Honduras Tegucigalpa 1,150 1,241 7.9El Salvador San Salvador 895 1,415 58.1
a Median ch ange for LDC cities with at least 750,000 residents in 1995 = –15.1 percent.NOTE: Within each region the order of listing is according to popu lation size of coun try in 19 96.SOURCE: United Nations 1980, 1998.
8/8/2019 Geog Martin Brokeroff-Urban Growth in DCs
http://slidepdf.com/reader/full/geog-martin-brokeroff-urban-growth-in-dcs 8/22
7 6 4 U R B A N G R O W T H I N D E V E L O P I N G C O U N T R I E S
million. The relative over-projection of Mexico City’s 2000 population in1980 as compared to 1996 by 42 percent is exceeded by th e shift for severalsmaller cities in Africa as well as by Kuala Lumpur. A remarkable change,
as compared to the genera l pattern of cities, is the th reefold increase in theprojected 2000 population of Lagos, which accounts for 85 percent of theupward revision of Nigeria’s urban popu lation. In 1980 it was projected tha t389 cities would reach sizes of at least 750,000 by 1995; according to themost recent estimates 239 did, 150 did not (United Nations 1980, 1998).Projections in 1980 to the year 2000 were far less accurate for cities thanfor the u rban popu lation at large. For example, wh ereas the u rban popu la-tion of developing regions has been revised downward by 10.5 percen t (an dby a median average of –7.5 percent among all developing countries), the
projected population of the 239 cities with a t least 750,000 residen ts in thesecoun tries in 1995 has been lowered, on average, by 15.1 percen t. 10
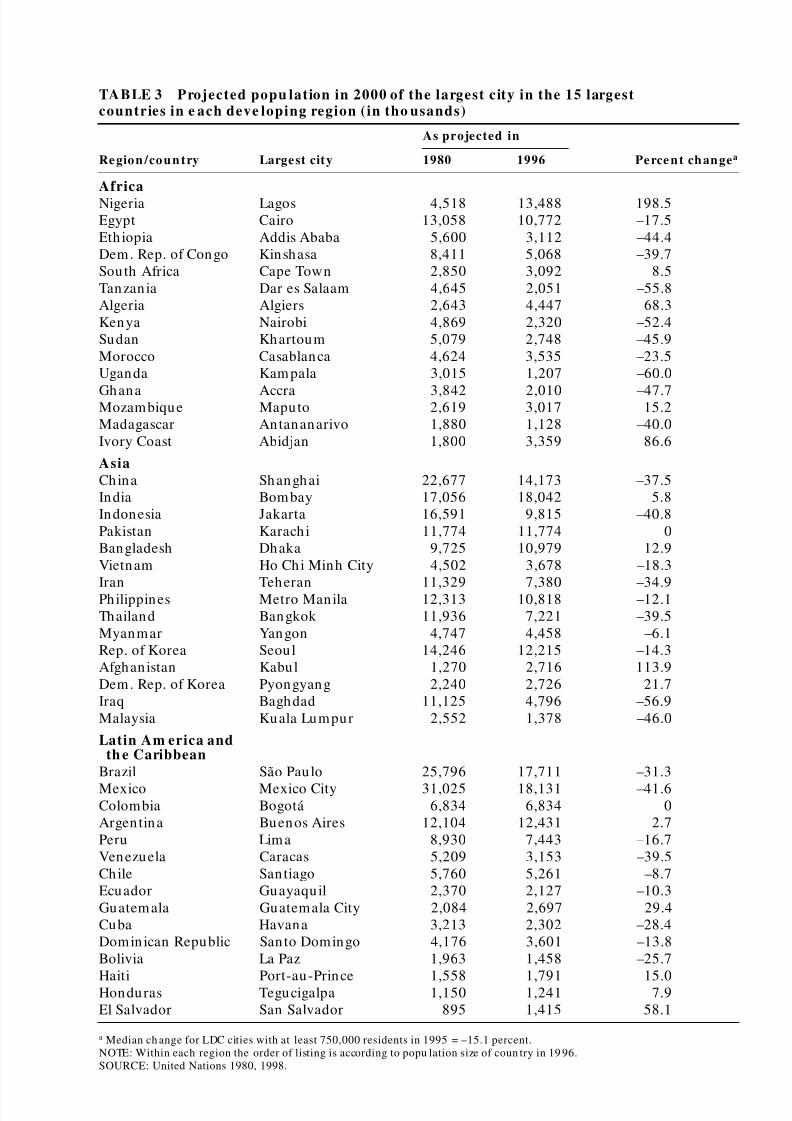
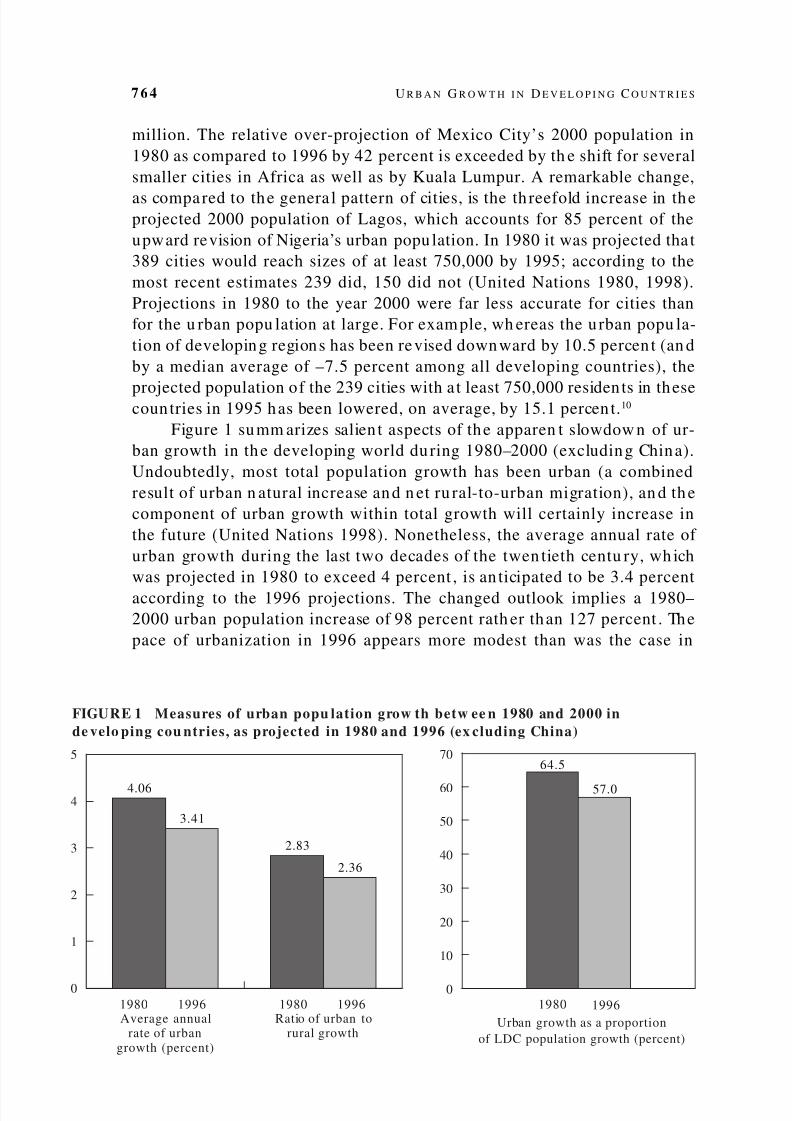
Figure 1 summ arizes salien t aspects of the apparen t slowdow n of ur-ban growth in th e developing world du ring 1980–2000 (excluding China).Undoubtedly, most total population growth has been urban (a combinedresult of urban n atural increase an d n et ru ral-to-urban migration), an d th ecomponent of urban growth within total growth will certainly increase inthe future (United Nations 1998). Nonetheless, the average annual rate of urban growth during the last two decades of the twen tieth centu ry, wh ichwas projected in 1980 to exceed 4 percent , is an ticipated to be 3.4 percentaccording to the 1996 projections. The changed outlook implies a 1980–2000 urban population increase of 98 percent rath er than 127 percent . Thepace of urbanization in 1996 appears more modest than was the case in
0
10
20
30
40
50
60
7064.5
57.0
Average annualrate of urban
growth (percent)
Ratio of urban torural growth
0
1
2
3
4
5
4.06
3.41
2.83
2.36
1980 1996 1980 19961980 1996
FIGURE 1 Measures of urban popu lation grow th betw ee n 1980 and 2000 inde velo ping cou ntries, as projected in 1980 and 1996 (ex cluding China)
Urban growth as a proportionof LDC population growth (percent)
8/8/2019 Geog Martin Brokeroff-Urban Growth in DCs
http://slidepdf.com/reader/full/geog-martin-brokeroff-urban-growth-in-dcs 9/22

8/8/2019 Geog Martin Brokeroff-Urban Growth in DCs
http://slidepdf.com/reader/full/geog-martin-brokeroff-urban-growth-in-dcs 10/22
7 6 6 U R B A N G R O W T H I N D E V E L O P I N G C O U N T R I E S
on average, by 5.002 percen t per an nu m. From th is finding, one could con-clude that th e same forces fuel population growth in cities as in the coun -tries in which they are located and thus, by implication, that high natural
increase in rur al areas does not propel cityward migration, nor are programsthat modify natural increase (for instance, family planning and child sur-vival programs) differen tially effective in cities and in the countryside. Oth ernotable results of the investigation just cited were that levels of economicdevelopmen t an d performan ce positively affect city growth rates, wh ereasrates are sign ifican tly lower in m ore u rban ized coun tries, and h igher in LatinAmerican coun tries, than elsewhere.
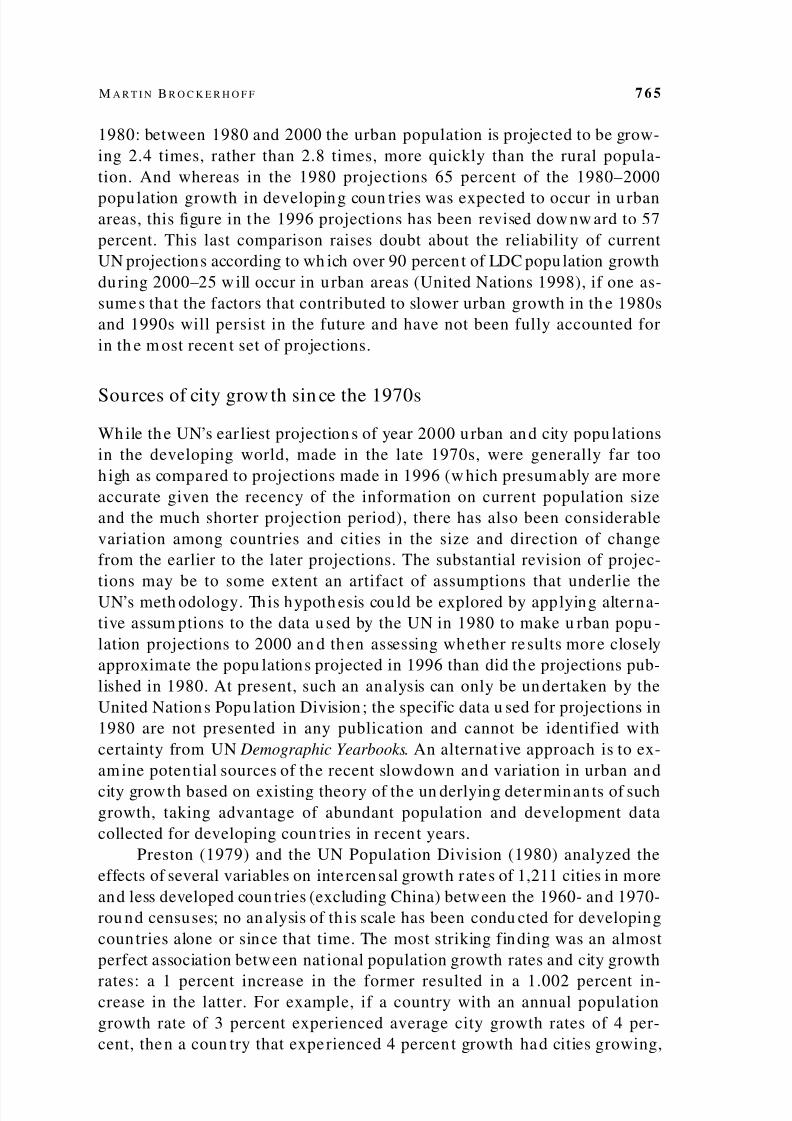
Table 4 replicates the analysis of Preston and the United Nations for1,154 cities of developing countries only, based on city popu lation data com-
piled from UN Demographic Yearbooks covering a span of 26 years (1971–97).This sample represents all cities in the developing world wh ose population sizesare reported for two t ime points—before an d after 1980, and at least eigh tyears apart—and w hose popu lation size was at least 100,000 at the earlierdate. 11 On average the period covered is 1977–90, although for some citiesestimates extend to 1996. Independent variables are derived from UnitedNations and World Bank publications for th e same years as estimates of citysize. While alternative measures of the variables may be preferable (for in-stance, adjusting conventional gross national product and gross domesticproduct according to purchasing power), this would preclude strict com-parison to resu lts of the Preston /UN study. The findings of th is earlier studyare shown in th e final column of the table.
Analyses of th e earlier and more recent periods show little consistencyof results. One constant determinant in size and direction of effect is theannua l growth rate of national GDP per capita: a 1 percen t increase raisescity growth rates by roughly 0.2 percent (or 2 per th ousand persons). Thisis not surpr ising, as fast-growing LDC econ omies (for in stance, in East Asia)presumably stimulate demand for labor in urban industry, manufacturing,and services, a situation conducive to ne t u rban in-m igration. Because cit-
ies are th e historical engines of national econom ic growth , reverse cau salitycould also be hypothesized from this relationship (that is, city populationgrowth may be driving national economic growth). As Preston observes,however, it is un likely that the average city is large enough for its popula-tion growth to contribute substantially to measured national economicgrowth dur ing a shor t period of years.
On balance, results indicate tha t factors that drove city growth in th e1960s and 1970s have had markedly different effects on LDC city growthrate s in recen t years. In itial levels of GNP per capita are gen erally irre levant
to rates of city growth in subsequen t years (b
=0.042, p=.728). The impor-tan ce of national econom ic conditions there fore appears ambiguous—eco-nomic progress as measured by GDP growth per capita spurs city growth,
8/8/2019 Geog Martin Brokeroff-Urban Growth in DCs
http://slidepdf.com/reader/full/geog-martin-brokeroff-urban-growth-in-dcs 11/22
M A R T I N B R O C K E R H O F F 7 6 7
TABLE 4 Effects of dem ographic, econo m ic, and poli t ical variables on citygrow th rates, 1960s–1990s (annual pe rcent age grow th rates)
Effect of o ne un it increase in variable
on city grow th ratea
Unit o f LDCs on ly MDCs an d LDCs com binedVariable m easurem en t (1970s–1990s) (1960s–1970s; Presto n 1979)
DemographicNational popu lation Annual percentage
growth rate growth 0.788* 1.002*Natural log, in itial city size Persons –0.314* –0.211*In itial proportion urban Urban percen tage –0.062* –0.029*
EconomicIn itial level of national Thousands of US dollars 0.042 0.332*GNP per capita (LDCs only: in itial year
of observation ; Preston :1964)
Growth rate of national Annual percen tage 0.189* 0.239*GDP per capita growth (unadjusted to
purcha sing power)
PoliticalCapital city 1 if capital city; 0 otherwise 0.933* 0.589Largest city 1 if largest city in country; 1.152* 0.292
0 otherw ise
Regional
Latin America 1 if in Latin America; –0.294 0.614*0 if Asia (excludin g Chinaand India)
Africa 1 if in Africa; 0 if Asia 0.372 –0.025(excluding China an d India)
Ch ina 1 if in China; 0 if other Asia 0.817* —(excluding India)
India 1 if in India; 0 if other Asia –0.544* —(excluding China)
Constan t 3.548 4.119R2 0.352 0.312(N) 1,154 1,212
In itial year of observation 1977 1962(mean)
Average duration 12.7 10.0of observation (years)
NOTE: Based on cities with at least 100,000 residents in t he initial year of observation.*p<.05a Partial regression coefficien ts.SOURCES: Preston 1979; United Nations 1998; United Nations Demographic Yearbook (selected volum es 1971–97); World Bank World Tables (1985, 1995); World Bank World Development Indicators 1998 ; World Bank World Development Report (selectedvolumes 1977–97).
but it does so indepen den t of a coun try’s level of econom ic developmen t.City growth rates are dampen ed in h ighly urban ized countries—in part ow ingto smaller proportions of potential in-migrants from rural areas—but the

8/8/2019 Geog Martin Brokeroff-Urban Growth in DCs
http://slidepdf.com/reader/full/geog-martin-brokeroff-urban-growth-in-dcs 12/22
7 6 8 U R B A N G R O W T H I N D E V E L O P I N G C O U N T R I E S
negative effects of urbanization levels on city growth are twice the magni-tude reported for the 1960s, at about –.06 for every one percentage pointincrease in the initial proportion urban. Given our global sample of devel-
oping countries, inclusion of both primate and smaller cities, and statisticalcontrol of regiona l effects, th is result suggests that counter-u rban ization m aybe widespread across city sizes, and within the developing world, not re-stricted to cities of Latin America. 12
Largest cities and capital cities of LDCs grew approximately 1.15 and0.93 percent more quickly per ann um than other cities, figures much h igher(an d m ore reliable statistically) th an those reported by Preston . Therefore,presuming an average annual growth rate of 4.10 percent for other citieswith at least 100,000 residents in the initial year of observation, cities that
were both the national capital and the largest city in their countries grew,on average, by 6.18 percent per annum. Several factors account for thesediscrepan cies with earlier findings. First, m ost of the cities analyzed for th e1960s are located in m ore developed coun tries, wh ereas our sample is ex-clusively from less developed countries where “urban bias,” or the concen-tration of migration-inducing resources, has been much more pronouncedin favor of major urban centers. Second, the largest and capital cities of most countries in sub-Saharan Africa, and of many countries in other re-gions, have popu lations of less than one million (United Nations 1998: Tables11, 12), population bases that are sufficiently small to translate populationincremen ts in absolute terms into high city growth rates. Th ird, high esti-mates for major urban centers run counter to the observed slowdown of mega-city growth rates since the 1970s, but these slow-growing giant cit-ies—cities of 8 million or more residents—represent less than one percentof cities in th e developing world w ith m ore th an 100,000 inh abitan ts (hen ceincluded in our sample). Fina lly, support for th ese findings comes from otherstudies that indicate th at cities of 1,000,000–5,000,000 re siden ts grew m orequickly than cities of 500,000–1,000,000 residents in developing regionsdu ring 1975–90 (Brockerh off and Brenn an 1998: 81).
With respect to regional location, cities grew more rapidly in LatinAmerica than elsewhere in the 1960s—other factors being equal—but inrecent years cities in Asia (excluding China and India from this referencecategory) grew more rapidly. The evidence of a sharp reduction in citygrowth in Latin America (relative to city growth in Asia), after controllingfor national economic conditions tha t largely determine m igration flows be-tween cities and the countryside, points to Latin America’s remarkable fer-tility decline—from an average total fertility rate of 6 in the early 1960s to3 in t he early 1990s (Un ited Nations 1999)—as a likely major compon en t
of reduced city growth in th e region. As compared to other Asian cities, themuch more rapid growth of China’s cities (greater by 0.8 percent per an-num) and more sluggish growth of Indian cities (less by 0.54 percent per

8/8/2019 Geog Martin Brokeroff-Urban Growth in DCs
http://slidepdf.com/reader/full/geog-martin-brokeroff-urban-growth-in-dcs 13/22
M A R T I N B R O C K E R H O F F 7 6 9
annum) is noteworthy insofar as China and India had virtually equivalentlevels of urban ization and GNP per capita around 1980. 13 As one might expect,these regional estimates for cities are consistent with the direction of revised
UN projections for regional urban populations shown in Tables 1 and 2.A striking result in Table 4, as compared to findings for the 1960s–
1970s, is that a on e percent increase in n ational population growth r ates of LDCs increases city population growth rates by less than 0.8 percent, de-spite the fact that urban growth has been more rapid than total populationgrowth since 1975. Indeed, 351 of the 1,154 cities in our sample experi-enced slower growth than their country’s population during the period of observation. This finding suggests that small urban centers not included inth is analysis, those with fewer than 100,000 residen ts, may be the fastest-
growing settlemen ts in the developing wor ld, as has been n oted elsewh ere(UNCHS 1996). This result also supports the notion th at, on the wh ole, therehas not been net in-migration to LDC cities from smaller urban areas andru ral areas; the ne t flow m ay be in the oth er direction, if weak city econo-mies have discouraged out-migration from small areas and encouraged re-turn migration to towns and villages. Such reverse flows from cities havebeen docum ented since th e late 1980s, for instance in Ivory Coast and Guinea(Bocquier and Traoré 1998). Alternatively, technological progress and im-proved economic performance in agriculture, as compared to urban eco-nomic sectors, may have indu ced many potential migran ts to remain in ru -ral areas, a pattern consistent with some theories of rural demographicchan ge (for instance, Boserup 1965) bu t at odds with others (for instance,Davis 1963). Yet an other explanation is that cities may have experienced awidening difference in rates of natural increase as compared to rates insmaller areas (for instan ce, resulting from more rapid fertility decline in bigcities), to an extent that more than offsets high net migration into cities.These hypotheses war ran t investigation to reveal the dem ograph ic and eco-nomic underpinnings and policy instruments in rural areas that affect thepace of city grow th .
Sources of national u rban growth sin ce 1980
In addition to exam ining sources of city population growth since th e 1970s,causes of national urban population growth since 1980 also merit investi-gation, with reference to predictions of national-level urban growth madearound 1980. Kelley and Williamson (1984a and 1984b) examined w heth erthe rate of urban growth in developing countries during 1973–79 wouldhave differed in the absence of the ma jor increase in oil prices and related
economic conditions that prevailed in those years. Their analysis was ex-ceptional in considering economywide influences on urban growth in an“open” setting, in which migration between rural and urban areas is af-

8/8/2019 Geog Martin Brokeroff-Urban Growth in DCs
http://slidepdf.com/reader/full/geog-martin-brokeroff-urban-growth-in-dcs 14/22
7 7 0 U R B A N G R O W T H I N D E V E L O P I N G C O U N T R I E S
fected by exogenou s forces tha t confront an ent ire coun try. The study foun dthat the average annua l u rban growth rate of a “representa tive” developingcountry (4.65 percent) would have been much higher—more closely ap-
proximating the rate during 1960–73—if urban-based manufacturing hadnot declined relative to rural-based agriculture in terms of trade and pro-ductivity. 14 In contrast, the slow growth of agricultural land stock and highgrowth of the popu lation of labor force age—factors that p resum ably “push”surplus ru ral population tow ard u rban areas—as well as foreign capital in-flow an d th e h igher price of fuels and raw materials did n ot affect the paceof urban growth. Kelley and Williamson concluded that imbalance betweenmanufacturing and agriculture matters most to urban growth, in part byinstigating (or inhibiting) migration to urban centers of employment and
econom ic advantage. Continu ation of un favorable trends in man ufacturingrelative to agricultu re th erefore wou ld indicate slower rates of urban growthin the 1980s and 1990s than w ould be expected othe rwise.
Table 5 presents the key findings of Kelley and Williamson and com-parable results from an analysis of data from 95 developing countries rep-resen ting the period 1980–96. Variables exam ined for recent yea rs are thoseidentified as potent causes of urban growth during 1973–79 (and, implic-itly, before and after those years) as well as factors deemed insignificant atthat time bu t non eth eless apposite to consideration of the in fluen ce of popu -lation pressures on urban growth since 1980. The importance of four na-tionwide factors that could have reduced urban growth in part by depress-ing migration from the coun tryside is also examined: (1) the percent age of popu lation aged 65 or older in 1980; (2) th e growth r ate of the proportionof the population age 65 or older du ring 1980–96; (3) a policy in 1980 toalter th e spatial distribution of popu lation—as defined by th e simu ltaneou sexisten ce of a n egative perception by governm en t of the popu lation distri-bution, inten tion to decelerate or r everse migration flows, and intent ion tomodify the ru ral/u rban configuration of settlemen ts (Un ited Nations 1981);and (4) country size in terms of area, which when large might indicate a
greater distance between ru ral and u rban places. An altern ative to counter-factuals—values that Kelley and Williamson derived from historical dataand expert opinion and that presumably approximate conditions prior tothe rise of oil prices—is used to determine the impact of national trendsan d conditions on u rban growth . Additiona lly, ana lysis of data for 1980–96shows the mean values of variables among these 95 countries as recordedby the United Nations and the World Bank, presents the median annualu rban growth rates for coun tries that experienced values above and belowthe m eans, and estimates the linear effects of variables on th e u rban growth
rate.15
A substant ial techn ological slowdown has occurred in th e developingworld since 1980 (encompassing the so-called lost decade of the 1980s),

8/8/2019 Geog Martin Brokeroff-Urban Growth in DCs
http://slidepdf.com/reader/full/geog-martin-brokeroff-urban-growth-in-dcs 15/22
TABLE 5
Effects of economywide variables on the national u
rban growth rate (UGR) in LDCs, 1973–79 and 1980–96
Kelley and Williamson, 1973–79
Observed, 1980–96
UGR from
Median annual UGR forcountries
Effect of variable on
Variable
Assumption
Counterfactual
counterfactual
Mean
> Mean
£Mean
average annual UGR
Unbalanced factor productivity
(agriculture growth /
manufacturinggrowth),
% per annum
0.8
0.5
5.86
0.89
3.65
4.83
–0.296*
Relative price ofmanufactures,
% growth per annum
–1.6
0
6.49
–0.97
5.30
2.89
–0.735*
Foreign capitalinflow
per annum, as % ofGDP
3.0
0
4.67
1.26
4.11
4.01
0.137
Agriculturalland stock,
% growth per annum
0.5
1.0
4.61
0.83
4.02
4.13
0.083
Labor force, % growth per
annum
2.68
2.54
4.60
2.50
4.46
3.92
0.261
Percent ofpopulation
aged 65 or older in 1980
—
—
—
4.20
3.24
4.83
–0.279*
Proportion ofpopulation
aged 65 or older, % growth
per annum
—
—
—
0.74
3.31
4.85
–0.412*
Policy in 1980 to curb urban
growth (1= yes, 0 = no)
—
—
—
0.40
Yes:3.53
No:4.88
–0.713*
Size ofcountry (sq. miles,
in thousands)
—
—
—
226,411
4.01
4.13
–0.002
Constant = 1.292
N = (40)
(Actualavg. UGR = 4.65)
(Actualavg. UGR = 4.05)
R 2 = .577
N = (95)
*P £ .05
NOTES:The urban growth rate resultingfrom each counterfactualassumes other counterfactuals held constant. The value of5.86 for unbalanced factor productivity is also based on a
decline from 0.5 to 0.25 percent growth per annum in urban-based capital-intensive services (e.g., electricity) relative to manufacturing. See appendixes in Kelley and Williamson 1984b
for calculation ofvariables for 1973–79. See text for definition ofpolicy to curb urban growth. The urban and elderly populations in 1996 used to calculate growth rates are derived from
linear interpolation ofvalues for years 1995 and 2000 (usingthe medium-variant projection ofpersons aged 65 and older in 2000).
SOURCES:Kelley and Williamson 1984b:Tables 5.4, 5.5;Kelley and Williamson 1984a:Table 5. World Bank WorldDevelopmentIndicators1998(book and CD-ROM). World Bank World
Tables(Selected volumes 1985–95). United Nations 1981, 1998, 1999. US Bureau ofthe Census 1991.
8/8/2019 Geog Martin Brokeroff-Urban Growth in DCs
http://slidepdf.com/reader/full/geog-martin-brokeroff-urban-growth-in-dcs 16/22
7 7 2 U R B A N G R O W T H I N D E V E L O P I N G C O U N T R I E S
and th e price “squeeze” on the agricultural sector h as been r educed. Thesetren ds are reflected by the m uch higher produ ctivity increase in ru ral agri-culture as compared to urban man ufacturing (at 0.89 percent per an nu m,
even exceeding OPEC-period levels) and by the price decline of manufac-tu res relative to agricu ltural goods (at –0.97 percent per annu m) . Count riesthat experienced lower th an average relative growth in m anufacturing hada median annu al urban growth rate of 3.65—or 0.4 percen tage point s lowerthan all countries on average, and about 1.2 percentage points lower thancoun tries with comparatively stron g manu facturing growth. Amon g coun -tries wh ere th e price of manufactures fell by more th an 0.97 percent yearlyas compared to agricultural prices, the median annual urban growth ratewas 2.89—or 1.2 percentage points lower than the aggregate average and
just over half the rate of countries where price trends have been more fa-vorable to manu factures. The effect of these sector productivity tren ds dur-ing 1980–96, quite disadvantageous to manufacturing, was to reduce theaverage annual urban growth rate by 0.3 percentage points. Likewise, de-clining relative prices for manufactures reduced the rate by 0.74 percentagepoints. In sum, results indicate that, as in the 1970s, the sluggish performan ceof man ufacturing (as compared to agriculture) remains largely responsible forthe observed slower pace of urban growth in developing countries, and mayhave decelerated urban growth from w hat oth erwise wou ld have been higherrates in th e 1980s and 1990s by curbing net rural-to-urban migration.
Sustained periods of redu ced in tern ational capital in flows experiencedby many countries since the 1980s might be expected to have dampenedurban growth —given that m ost capital inflows (hen ce income-earn ing op-portunities) typically come to cities—but strong evidence remains that, forLDCs on th e wh ole, the level of foreign capital in flow over time h as had n osignificant effect on the pace of urban growth. Likewise, agricultural landexpan sion and the rate of growth of the popu lation of labor force age (themain contributor to u rban fertility and net rural-to-urban m igration) havehad negligible effects on urban growth. In all, despite the use of more-lim-
ited data for a much earlier period, Kelley and Williamson were remark-ably on target in identifying those overarching forces that do, and do not,determ ine rates of urban growth in developing coun tries.
Of the additiona l variables considered here, size of coun try tu rns outto be u nimportan t, but population aging appears to be crucial. Aging popu -lations wou ld logically be associated w ith slower national population growth ,but th eir relationship to the pace of urban growth is un docum ented. Man ydeveloping countries, notably in Latin America and th e Caribbean , had highproportions of elderly persons among their populations in 1980 or earlier
(US Bureau of th e Census 1992: Table 5). Those coun tries with percentagesof persons aged 65 or older exceeding 4.2 experienced u rban growth rates0.8 percentage points lower than average. Moreover, a yearly increase of
8/8/2019 Geog Martin Brokeroff-Urban Growth in DCs
http://slidepdf.com/reader/full/geog-martin-brokeroff-urban-growth-in-dcs 17/22
M A R T I N B R O C K E R H O F F 7 7 3
one percent in the proportion of population aged 65 or older (for instance,from 5 percent to 5.05 percent )—a value slight ly h ighe r than the 0.74 per-cent mean increase per an nu m observed in our sample—reduces the urban
growth rate by 0.41 percentage points (for instance from 4.05 percent to3.64 percen t). The difference in median u rban an nu al growth rates betweencountries that experienced higher and lower rates of growth in their pro-portion of elderly persons than the mean exceeds 1.5 percentage points (3.31percent as compared to 4.85 percent per ann um ).
High levels and rapidly growing proportions of elderly persons couldredu ce urban growth th rough several mechan isms. These include, most di-rectly, lower and declining urban fertility and decreased propen sity amongthe aging rural population to resettle in urban areas (if rural-to-urban mi-
gration is prompted mainly by job, school, or marriage prospects). On theother han d, the concentration and growth of the elderly population in de-veloping count ries may be largely an u rban ph enomen on—given t hat cura-tive h ealth care services are overwh elmingly based in cities in many coun -tries, while higher fertility persists in the countryside. Unfortunately, nocomprehensive data on the age structures of urban and rural populationsexist to examine th ese argum en ts. Withou t engaging in u ndu e speculation,suffice it to say that the more-rapid growth expected in the future of theproportion of population aged 65 or older in developing coun tries—at 2.1percent per an nu m between 2000 and 2025, to represent over 8 percent of the total population by the end of the period (according to the UN me-dium-variant projections)—implies a potentially strong dampening effecton rates of urban growth. Whether changing age structures reduce urbangrowth purely through urban fertility decline or are associated with itth rou gh other linkages is a question for futur e research.
Spatial aspects of population policy appear m ore sign ifican t to cu rbingu rban growth than is conventionally assumed on the basis of the failed “mi-gration policies” of many governments in the 1960s and 1970s (Simmons1981). Measures implemen ted to m odify the distribution of population, in-
cluding migration policies, substan tially reduced th e average ann ual rate of u rban growth in LDCs during 1980–96, by about 0.7 percentage points, andlikely would have had a greater dampening impact on urbanization in thedeveloping world if applied in more countries. Admittedly, the policy indi-cators are crude, as th ey reflect governm en ts’ perceptions of the compara-tive desirability of alternative spatial pattern s, not th eir actual interven tions,and they are reported to the United Nations by potentially biased or notwell-informed offices of government. Nonetheless, many countries thatviewed their population distributions as un acceptable and acted to chan ge
them—for instance, Mexico, Egypt, and India—experienced lower urbangrowth rates during 1980–96 than did their global subregions, and muchlower growth than neighboring coun tries—Guatemala, Sudan , Bangladesh—
8/8/2019 Geog Martin Brokeroff-Urban Growth in DCs
http://slidepdf.com/reader/full/geog-martin-brokeroff-urban-growth-in-dcs 18/22
7 7 4 U R B A N G R O W T H I N D E V E L O P I N G C O U N T R I E S
that h ad less negative stances on u rban growth. This result point s to a needto identify wh ich migration- related policies most influence urban growth—for instance, rural development schemes versus the imposition of eligibility
requirements for movement from the countryside. In the absence of suchresearch , an d given the strong effect of migration policy on u rban growthindepen den t of economic and dem ograph ic conditions, one cannot dismissspatial distribution policies as uniformly ineffective instruments to managethe u rban tran sition.
Conclusion
While short-range population projections sometimes prove imprecise, the
large downward revision of the projected size of the urban population of most developing coun tries in the year 2000—based on a considerable am oun tof accumulated evidence—suggests that a slowdown of urban growth hasoccurred since the 1970s. A much-modified picture of the “urban popula-tion explosion” in r ecen t years reflects the e ffects of relatively weak expan -sion of urban industries and price sh ifts un favorable to man ufactured goods,popu lation aging, policies to alter m igration and spatial distribution patte rn sin some coun tries, and no doubt oth er forces not exam ined in th is analysis.National population growth rates that produce less than commensurate city
growth rates, net of other factors, suggest that reduced net rural-to-urbanmigration h as been a principal demographic componen t of slower -th an -ex-pected urban growth . However, th e con tinued absence of timely, adequ atedata on rural-to-urban migration in most developing countries, as well ason natural increase in urban and rural areas separately, precludes attribu-tion of the slowdown of urban growth in most countries to any single de-mographic process (or to statistical changes due to such causes as redraw-ing of city bou ndaries or reclassification of urban places). Furth er clarificationof the demographic underpinnings of urban growth—rather than of its un-derlying economic and social causes examined here—awaits analysis of datafrom the 2000-round censuses.
It remains to be seen w heth er econom ic down turn s and other recenttrends have just temporarily slowed the process of the urban populationtran sition in the developing w orld—as implied by curr en t projections th atan ticipate rapid urban growth and very large population incremen ts in cit-ies in th e n ext few decades—or whether conditions of the 1980s and 1990shave a more lasting effect on the fu tu re growth and size of the urban popu -lation. Comparison of the biennial urban estimates and projections issuedby the United Nations with earlier data, as done he re with r eferen ce to the
1996 revision, on a routine basis would shed light on this issue providedthat th e UN me thodology is not altered in futu re estimates and projections.
The discrepan cy between early and th e most recent u rban popu lationprojections is no doubt attributable, in part, to th e continu ed inadequ acy of
8/8/2019 Geog Martin Brokeroff-Urban Growth in DCs
http://slidepdf.com/reader/full/geog-martin-brokeroff-urban-growth-in-dcs 19/22
M A R T I N B R O C K E R H O F F 7 7 5
the underlying data on which these projections are based; urban popula-tion statistics shou ld be in terpreted with cau tion. As illustrated above , how -ever, th e increased availability of basic population , econom ic, and geograph ic
data for most developing countries in the last 20 years now enables de-tailed analysis of the causes of urban growth. With few exceptions (for in-stance, Becker, Hamer, and Morrison 1994; McGee and Robinson 1995),th is topic has been neglected for some time , despite its obvious demograph icsignificance. This article h as revisited notable examples of research on sourcesof urban and city growth in the 1960s and 1970s and has derived resultsthat inform our understanding of the causes of growth since that time (ei-ther through confirmation or refutation of earlier findings). An apparentpriority for futu re research is to determ ine whe ther policy interven tions of
governments can hasten the pace of urban growth, if more rapid growth isdeemed desirable on economic or other grounds. Alternatively, researchmight determine whether the pace of urban growth in developing coun-tries can be cont rolled by govern men ts if, for instance, doing so is suggestedby global economic conditions or by demographic conditions identified inth is study. Fortunately, sufficient da ta are becoming available in some coun -tries to address these and other questions pertinent to the growth of citiesand urban populations.
Notes
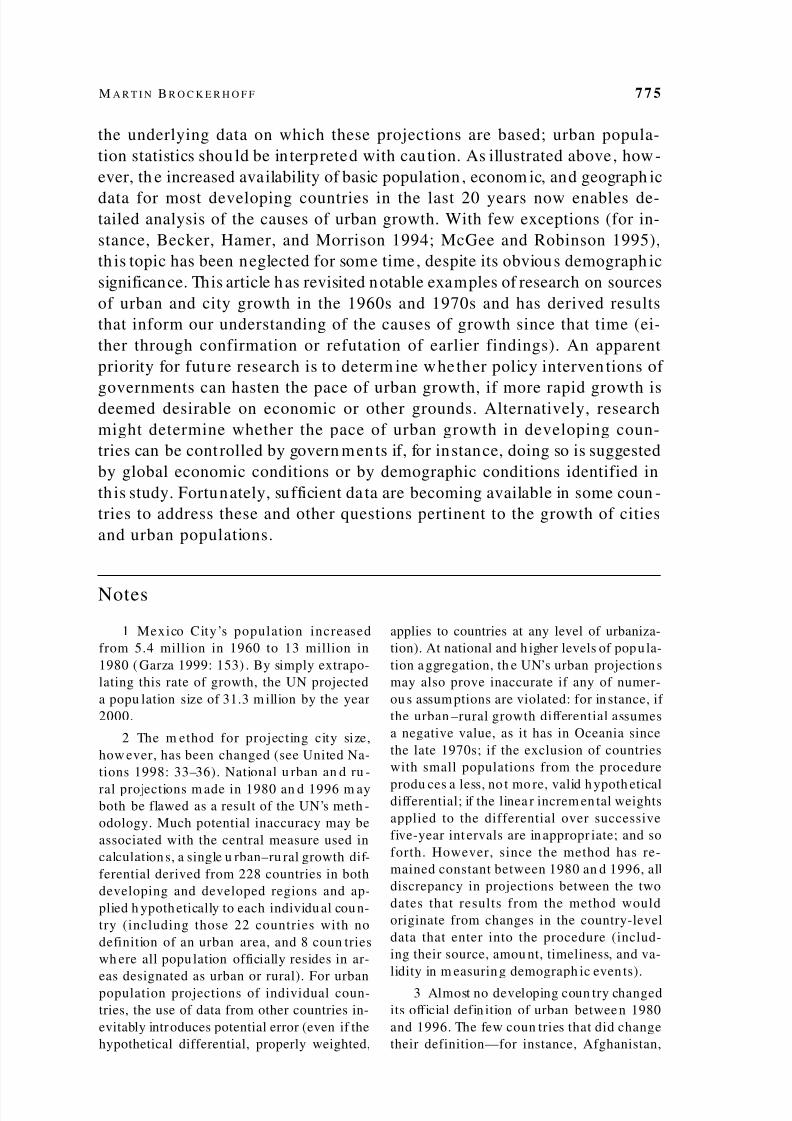
1 Mexico City’s populat ion increasedfrom 5.4 million in 1960 to 13 million in1980 ( Garza 1999: 153) . By simply extrapo-lating this rate of growth, the UN projecteda popu lation size of 31.3 m illion by the year2000.
2 The m ethod for projecting city size,how ever, has been changed (see United Na-tions 1998: 33–36). National u rban an d ru -ral projections m ade in 1980 an d 1996 m ayboth be flawed as a result of the UN’s meth -odology. Much potential inaccuracy may beassociated with the central measure used incalculation s, a single u rban–ru ral growth dif-ferential derived from 228 countries in bothdeveloping and developed regions and ap-plied h ypoth etically to each individu al cou n-try (including those 22 countries with nodefinition of an urban area, and 8 coun trieswh ere all popu lation officially resides in ar-
eas designated as urban or rural). For urbanpopulation projections of individual coun-tries, the use of data from other countries in-evitably introduces potential error (even if thehypothetical differential, properly weighted,
applies to countries at any level of urbaniza-tion). At national and h igher levels of popu la-tion a ggregation, th e UN’s urban projection smay also prove inaccurate if any of numer-ou s assum ptions are violated: for in stance, if the urban –rural growth differential assumesa negative value, as it has in Oceania sincethe late 1970s; if the exclusion of countrieswith small populations from the procedure
produ ces a less, no t mo re, valid h ypoth eticaldifferential; if the linea r increm en tal weightsapplied to the differential over successivefive-year int ervals are in appropr iate; and soforth. However, since the method has re-mained constant between 1980 an d 1996, alldiscrepancy in projections between the twodates that results from the method wouldoriginate from changes in the country-leveldata that enter into the procedure (includ-ing their source, amou nt, timeliness, and va-lidity in m easurin g demograph ic even ts).
3 Almost no developing coun try changedits official defin ition of urban betwee n 1980and 1996. The few coun tries that did changetheir definition—for instance, Afghanistan,

8/8/2019 Geog Martin Brokeroff-Urban Growth in DCs
http://slidepdf.com/reader/full/geog-martin-brokeroff-urban-growth-in-dcs 20/22
7 7 6 U R B A N G R O W T H I N D E V E L O P I N G C O U N T R I E S
Benin, an d Iran—did so in a m ann er that didnot change t he locales classified as u rban . TheUN urban projection method allows for thegraduation of rural areas to u rban areas (andvice versa) based on popu lation size criteria,and th erefore does not invalidate the tren dsshow n in Table 1.
4 The extent to which over-projection of the urban population in 1980 is attributableto over-pro jection of the total popu lation var-ies by region . For instan ce, the projected u r-ban population of Africa in 2000 has beenrevised dow nw ard by abou t 36 million sin ce1980, wh ereas the projected total populationof Africa in 2000 has been revised upward
by about 6 million. In this case, none of thedownward revision of the projected urbanpopulation can be attributed to slower totalpopulation growth in Africa than was ex-pected in 1980. In contrast, the pro jected u r-ban popu lation of Latin America and th e Car-ibbean h as been revised down ward by about79 m illion , while the pro jected total popu la-tion of the region has been revised down wardby 105 million. Therefore, in Latin Americaand the Caribbean on e could attribute all of the over-projection of the urban (and ru ral)population to slower-than-expected growthof the total population. The point to em pha-size is that errors in projecting urban popu-lations are affected by erro rs in pr ojecting to-tal populations.
5 As recently as 1988, for instance, theUN’s medium variant projection of the total fer-tility rate (TFR) in less developed regions in1990–95 was 3.69 (United Nations 1989) . TheUN now estimates th at th e TFR during this pe-riod was 3.27 (United Nations 1999). Admit-tedly, the curren t estimate includes some rela-tively low-fertility developing countries thatwere formerly part of the Soviet Union wh ereasthe earlier projection did not, but these coun-tries in sum account for a very small propor-tion of th e developing world’s population.
6 Coun tries with populations of less than2 m illion in 1995 are not examined, becausesmall absolu te chan ges in th eir projected u r-ban population sizes may have resulted insuch large percentage cha nges that comp ari-
son w ith larger coun tries is misleading.7 Faster-than-expected urbanization and
urban growth in Nigeria since 1980 are es-pecially intriguing insofar as the structural
adjustment policies imposed in that countryby international financial institutions in the1980s (though not strictly adhered to by thegovernm ents) wou ld be expected to h ave re-duced m igration to cities and perhaps to havelowered urban fertility (Olu Abiodun 1997).A plausible explanation for the revision of thesize of Nigeria’s (an d Lagos’s) ur ban popu la-tion is that estimates and projections havebeen based on po or-qu ality census data, par-ticularly preceding the 19 91 census.
8 In the 1980s, China established hu n-dreds of new cities and thousands of newtowns with extraordinarily large land areas.This reclassification of rural places as urbangreatly magnified the size of China’s urbanpopu lation (for instance, it raised th e propor-tion classified as urban from 21 percent in1982 to 57 percent in 1990). To correct forthis change in definition, the State Statisti-cal Bureau created a second, more realisticdefinition of urban applied to the 1990 cen-sus, wh ich defines the u rban population as in-cluding urbanized residents of neighborhoodcommittees.
9 Mohan (1996) speculates from 1991
census data that would-be migrants to citieswere discouraged from moving by the lack of jobs and a worsen ing qu ality of urban lifein the 1980s.
10 These represent all cities in developingregions with a population of at least 750,000in 1995 (United Nations 1998) wh ose projectedpopu lations to 2000 can be traced to those in-cluded in United Nations (1980).
11 For China, data are taken from the1982 an d 1990 n ational population censu ses.
12 In th i s case , coun ter-urbaniza t ionwou ld be defined as the m ovemen t of peopleaway from cities, regard less of city size crite-ria, toward smaller areas, including suburbsor pe ri-urban areas n ot officially recognizedas part of the city proper. Descriptive ac-coun ts of this process in th e 1980 s for largeas well as small cities are given by Gilbert(1996) and UNCHS (1996). History suggeststha t in region s wh ere ur banization levels arerelatively low, such as South Asia and sub-Saharan Africa, coun ter-urban ization wou ldbe fleeting; it may reflect the more adverseimpact on cities than on other areas of eco-nom ic down turn s in th e 1970s–1990s.

8/8/2019 Geog Martin Brokeroff-Urban Growth in DCs
http://slidepdf.com/reader/full/geog-martin-brokeroff-urban-growth-in-dcs 21/22
M A R T I N B R O C K E R H O F F 7 7 7
13 Detailed explanations of recent citygrowth pattern s in China an d India, respec-tively, are found in Scharping (1997) andMohan (1996).
14 Data for a representative developingcountry were based on u nw eighted averagesof 40 countries. These developing countriesincluded on ly “price-takers” in intern ationaltrade—the refore excluding net oil-exportingcountries of OPEC—and countries with fa-vorable economic situations between 1960and 1973. The present analysis of 95 devel-oping count ries dur ing 1980–96 includes anyof these formerly omitted states for whichsuitable and complete data are available,
since the capacity of these countries in dic-tating global fuel prices has greatly dimin-ished since 1980, and because economicforces un favorable to rapid urban growth pr e-vailed in most developing countries in the1980s and early 1990s (with the exception
of some Asian countries that experiencedrapid econom ic growth du ring that period).
The characterization of man ufacturing as“urban” and agriculture as “rural” is some-what inaccurate , especial ly in countr ieswh ere “mega-urban ization” or m etropolitansprawl has dispersed industries to adjacentrural areas (McGee and Robinson 1995), orwhere export-oriented manufacturing hasbeen establishe d in rur al hinterlan ds (for in-stance, in “New Economic Zones” of coun-tries in Southeast Asia and the Caribbean).Even in th is min ority of developing coun tries,how ever, the man ufacturing and agricultur alsectors are overwhelmingly concentrated in
ur ban an d rur al areas, respectively.15 For some small countries, data taken
from the World Bank World Development In-dicators 1998 are available only in CD-ROMformat, not in publication.
References
Badsha h, Akhta r A. 1996. Our Urban Future: New Paradigms for Equity and Sustainability . Lon -don an d New Je rsey: Zed Books.
Banister, Judith. 1997. “Chin a: Int ern al and regional migration tren ds,” in Scha rping 1997:72–97.
Bairoch, Paul (t ran slated by Christopher Braider). 1988. Cities and Economic Development: Fromthe Dawn of History to the Present . Chicago: Univer sity of Chicago Press.
Becker, Charles M., Andrew M. Hamer, and Andrew R. Morrison. 1994 . Beyond Urban Biasin Africa: Urbanization in an Era of Structural A djustment . Portsmou th, NH: Heineman n.
Becker, Charles M. and Andrew R. Morrison. 1999. “Urbanization in transforming econo-mies,” in Paul Cheshire an d Edwin S. Mills (eds.), Handbook on Applied Urban Econom-ics . New York: Oxford Un iversity Press, pp. 1673–1790.
Bocquier, Philippe and Sadio Traoré. 1998. “Migration and urbanization in West Africa:Meth odological issues in da ta collection an d inferen ce,” in Richard E. Bilsborrow (ed.),
Migration, Urbanization, and Development: New Directions and Issues . New York: UnitedNations Popu lation Fun d an d Kluw er Academic Publishe rs, pp. 249–273.
Boseru p, Ester. 196 5. The Conditions of Agricultural Growth: The Economics of Agrarian Chan geun der Population Pressure . Chicago: Aldine .
Brockerh off, Martin and Ellen Bren nan . 1998. “The poverty of cities in de veloping re gions,”Population an d Development Review 24(1): 75–114.
Davis, Kingsley. 1963. “The theory of change and response in modern demographic his-tory,” Population Index 29(4): 345–366.
Garza, Gustavo. 1999. “Global economy, metropolitan dynamics and urban policies inMexico,” Cities 16(3): 149–170.
Gilbert, Alan (ed.). 19 96. The Mega-City in Latin America . Tokyo: United Nations UniversityPress.
Kelley, Allen C. and J effrey G. Williamson . 1984a. “Population growth , indu strial revolu-tions, and th e ur ban tran sition,” Population an d Development Review 10(3): 419–441.
———. 1984 b. What Drives Third World City Growth? A Dynamic General Equilibrium Approach .Princeton : Princeton University Press.
8/8/2019 Geog Martin Brokeroff-Urban Growth in DCs
http://slidepdf.com/reader/full/geog-martin-brokeroff-urban-growth-in-dcs 22/22
7 7 8 U R B A N G R O W T H I N D E V E L O P I N G C O U N T R I E S
Lipton, Michael. 1976. Why Poor People Stay Poor: Urban Bias in World Development . Cam-bridge, MA: Harva rd Un iversity Press.
McGee, T. G. and Ira M. Robinson. 1995. The Mega-Urban Regions of South east Asia . Vancouver:Univer sity of British Colu mbia Press.
Moha n, Rakesh. 1996 . “Urbanization in India: Pattern s and eme rging policy issues,” in Josef Gugler (ed .), The Urban Transformation of the Developing World . Oxford: Oxford Univer-sity Press, pp. 93–131 .
Olu Abiodun, Josephine. 1997. “The challenges of growth and development in metropoli-tan Lagos,” in Carole Rakodi (ed.), The Urban Challenge in Africa: Growth and Manage-ment of Its Large Cities . Tokyo: United Nation s Un iversity Press, pp. 192–222.
Preston, Samuel H. 1979. “Urban growth in developing countries: A demographic reap-praisal,” Population and Development Review 5(2): 195–215.
Satterthwaite, David. 1996. The Scale and Nature of Urban Change in the South . Lon don : Int er-nation al Institute for Environm ent an d Development, Human Settlemen ts Program me.
Scharping, Thomas (ed.). 1997. Floating Population and Migration in China: The Impact of Eco-
nomic Reforms . Ham burg: Institut für Asien kun de.Schiffer, Robert L. 1989. The Exploding City: An Unforgettable Journey Through Nine Great Cit-ies. New York : St. Mar tin ’s Press.
Simmons, Alan B. 1981. “A review and evaluation of attempts to constrain migration toselected u rban centre s and re gion s,” papers of the Un ited Nations/UNFPA Workshopon Population Distribution Policies in Development Planning, Bangkok, 4–13 Sep-tember 1979, Population Distribution Policies in Development Planning . New York: Un itedNations.
United Nations. 1980. Patterns of Urban and Rural Population Growth . New York .———. 1981 . World Population Trends and Policies: 1981 Monitoring Report, Volume I, Population
Trends . New York: United Nations, Depart men t of Int ern ational Econ omic and SocialAffairs.
———. 1989. World Population Prospects 1988. New York: United Nations, Department of Intern ationa l Econo mic an d Social Affairs.
———. 1998 . World Urbanization Prospects: The 1996 Revision. New York : Un ited Nation s, De-partm en t of Econom ic and Social Affairs, Population Division.
———. 1999. World Population Prospects: The 1998 Revision. New York: United Nations Secre-tariat, Depar tm en t of Econom ic and Social Affairs, Population Division.
———. 1971–1997. (Selected volum es). Demographic Yearbook . New York: United NationsSecretariat, Departm en t of Econom ic and Social Affairs, Population Division.
United Nations Cen ter for Hum an Settlem en ts (UNCHS). 1996. An Urbanizing World: Global Report on Human Settlements, 1996 . Oxford: Oxford University Press for HABITAT.
US Bureau of th e Census. 1991. World Population Profile: 1991 (Report WP/91). Washington,
DC: US Government Printing Office.———. 1992. An Aging World II (International Population Reports, P25, 92–3). Washing-ton , DC: US Govern me nt Printing Office.
World Bank. 1977–1997 (Selected volumes). World Development Report . New York: OxfordUniver sity Press.
———. 1985, 1995. World Tables . Baltimore an d Lond on: Joh ns Hopkins University Press.———. 1998 . World Development Indicators . Washington , DC: The World Bank.