geoelectric sounding and soil physico-chemical tests for .... 7 issue... · from 36.7 - 37.2 mhos....
TRANSCRIPT
IOSR Journal of Applied Geology and Geophysics (IOSR-JAGG)
e-ISSN: 2321–0990, p-ISSN: 2321–0982.Volume 7, Issue 6 Ser. III (Nov. – Dec. 2019), PP 25-36
www.iosrjournals.org
DOI: 10.9790/0990-0706032536 www.iosrjournals.org 25 | Page
Geoelectric Sounding and Soil Physico-chemical Tests for
Subsurface Layers CorrosivityInvestigationsat Ilaramokin, near
Akure, Southwestern Nigeria
Adeyemo, Igbagbo A.1, Karounwi, Sunday A.
1andOladeji, Johnson F.
2
1Department of Applied Geophysics, Federal University of Technology, Akure, Nigeria 2Department of Applied Geology, Federal University of Technology, Akure, Nigeria
Corresponding Author: Adeyemo, I.A.
Abstract:The study is aimed at investigating the subsurface corrosivity at Ilaramokin near Akure, southwestern
Nigeria. Thirty (30) geoelectric Sounding data were acquired using Schlumberger array. The geoelectric
sounding results delineated 3 - 5 geoelectric layers across the study area. The top soil resistivity values range
from 48 - 721 Ωm indicating possible clay, sandy clay, clayey sand and lateritic clay lithologies. The weathered
layer resistivity varies from 21 - 1800 Ωm, while the resistivity value of the weathered/fractured basement
ranges from 15 - 435 Ωm. The presumed bedrock resistivity values range from 382 - 7557 Ωm. The results were
also presented as iso-resistivity maps at different depth slices (1, 2 and 3 m). The iso-resistivity depth slice map
at 1 m indicates that the northeastern part of the area is strongly corrosive (60 - 150 Ωm). The iso-resistivity
depth slice map at 2 m shows that the central part of the area is strongly corrosive (60 - 150 Ωm) to very
strongly corrosive (less than 60 Ωm). The iso-resistivity depth slice map at 3 m indicates that the southwestern
part of the area are strongly corrosive (60 - 150 Ωm) to very strongly corrosive (less than 60 Ωm). The depth
slice iso-resistivity at 2 m was considered the most appropriate for generating the corrosivity model map of the
area.Soil samples utilized for physico-chemical tests (pH and conductivity) were also collected at the same 2 m
depth. The corrosivity model map shows that the central part of the area is strongly corrosive to very strongly
corrosive, while the western and southern flanks of the area are considered to be moderately to slightly
corrosive (250 - 350 Ωm). About 65% of the study area are either strongly corrosive or very strongly corrosive,
while only about 10% of the study area are considered to be slightly or non corrosive zones.The physico-
chemical tests carried out on the soil samples indicated that the subsurface materials at the 2 m depth slice are
slightly acidic and moderately conductive. The conductivity values show a consistent increase with decrease in
resistivity; at non corrosive/slighthly corrosive zones (250 Ωm and above) conductivity values varies from 26.4
- 27.1 mhos, while at moderately corrosive zones (150 - 250 Ωm) conductivity values range from 32.3 - 33.0
and at strongly corrosive and very strongly corrosive zones (less than 60 - 160 Ωm) corrosivity values vary
from 36.7 - 37.2 mhos. The pH and conductivity test results validated the corrosivity model map, since there was
a strong correlation between the corrosivity model map and the physico-chemical tests (conductivity test).
Keywords:Geoelectric, subsurface, physic-chemical, iso-resistivity, depth-slices and corrosivity. ---------------------------------------------------------------------------------------------------------------------------------------
Date of Submission: 17-12-2019 Date of Acceptance: 31-12-2019
---------------------------------------------------------------------------------------------------------------------------------------
I. Introduction
Corrosion is the degradation of metallic materials due to their reaction with the environment (Owate et
al, 2002). Effects of corrosion on engineering structures are many such as loss of strength, fatigue, reduced bond
strength, limited ductility and reduced shear capacity among others (Gebremedhin et al, 2013). A corroded
surface when mild or of low concentration is regarded as an irritant(Adeyemo et al, 2018). Soil corrosivity is
caused by several soil properties such as; resistivity, pH, redox potential, sulfides concentrations (Najjaran et al,
2004 and Chesnokova, et al. 2015), percentage clay content (Adeyemo et al, 2018) and moisture content
(Najjaran et al, 2004 and Idornigie et al, 2006).
Several approaches have been used to investigate and predict corrosivity. Fuzzy logic have been used
in predicting deterioration of cast/ductile iron water mains using soil properties such as resistivity, pH, redox
potential, sulfides, percentage clay content and moisture content (Najjaran et al, 2004).Electrical resistivity
method have also been used to classified subsurce layers into different corrosivity zones (Idornigie et al, 2006;
Oyedele et al, 2012 and Adeyemo et al, 2018). AAS-UV spectrophotometer-generated hydro-geochemical data
obtained from surface water, hand dug wells and boreholes have been used (Gebremedhin et al,2013) in
determining corrosivity aggressiveness. Microbiological indicators (number of sulfur cycle bacteria) have also
been utilized (Chesnokova, et al. 2015) to determine the effect of sulfate-reducing bacteria and to revealed the
Geoelectric Sounding and Soil Physico-chemical Tests for Subsurface Layers ..
DOI: 10.9790/0990-0706032536 www.iosrjournals.org 26 | Page
contribution of thiobacteria in the corrosion development of underground metal pipelines. Electron scanning
microscopy was also used (Chesnokova, et al. 2016) to detect defects on oil pipeline surface by identifying soil
thionic and sulfate-reducing bacteria quantity. The effect of clay minerals and clay plasticity on corrosivity of
buried metallic utilitieshave also been researched (Adeyemo et al, 2018).
Integrated geoelectricsoundingsurvey and soil physico-chemical tests was adopted for this work. The
geoelectric sounding method and soil physico-chemical tests have been used succesfully in subsurface
corrosivity mapping (Idornigie et al, 2006; Oyedele et al, 2012 and Adeyemo et al, 2018).
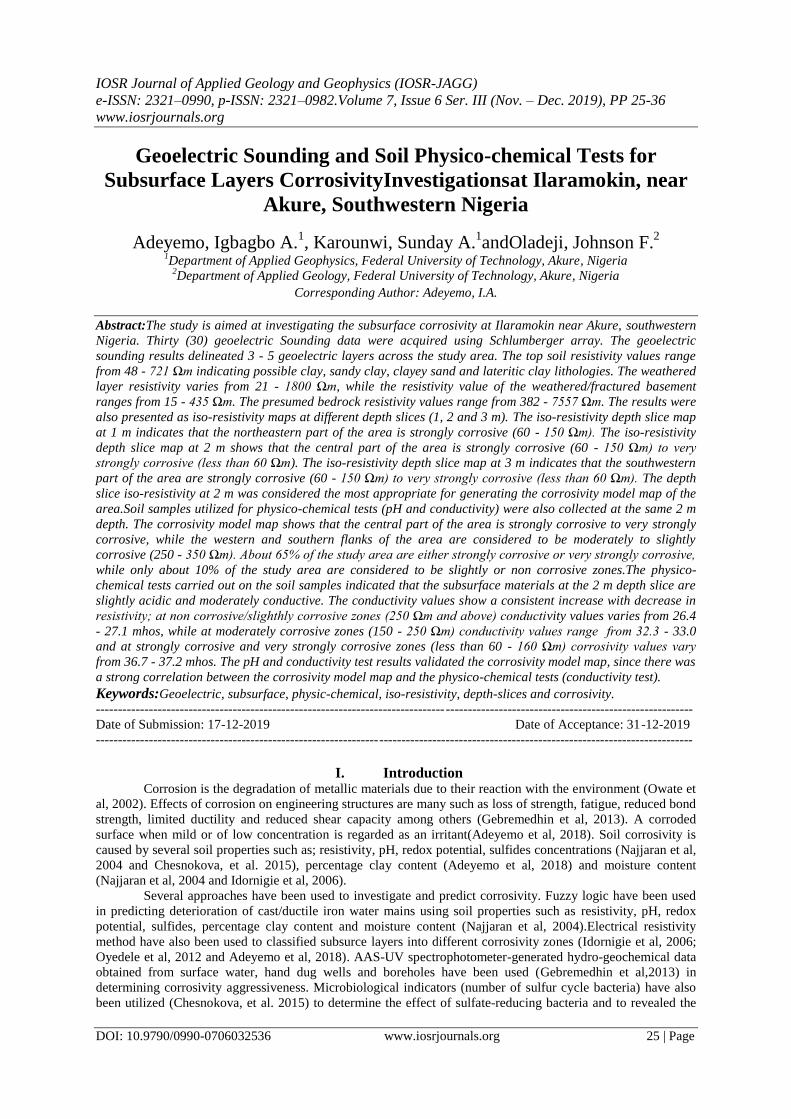
II. The Study Area The study area is Ilaramokinnear Akure Southwestern Nigeria (Figure 1). Thearea lies between the
geographic co-ordinates of 811500 - 814500 mN(Northing) and 732500 - 733500 mE(Easthing)in the Universal
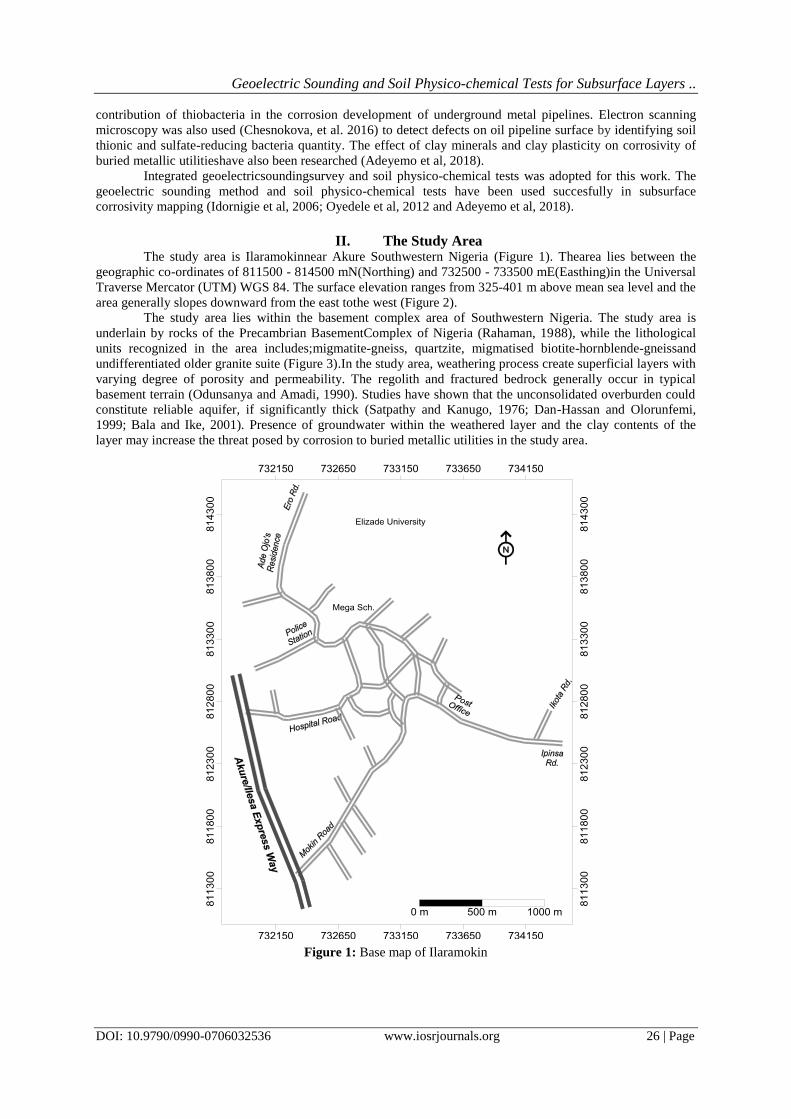
Traverse Mercator (UTM) WGS 84. The surface elevation ranges from 325-401 m above mean sea level and the
area generally slopes downward from the east tothe west (Figure 2).
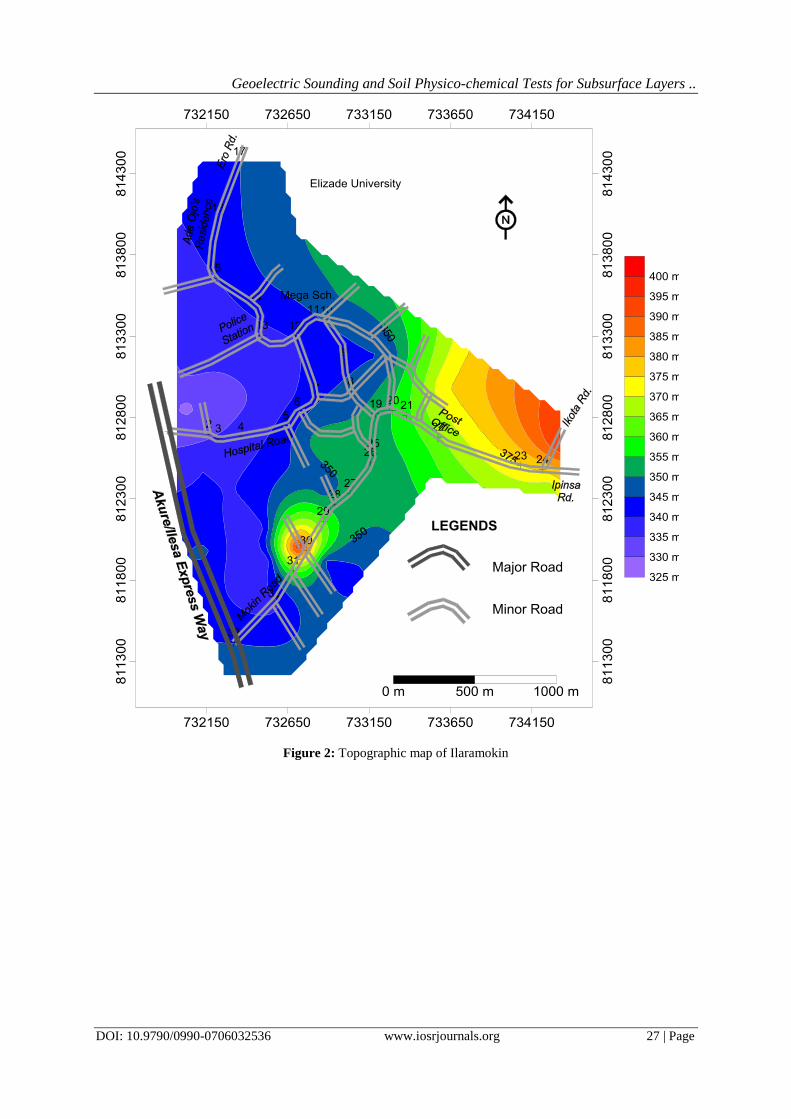
The study area lies within the basement complex area of Southwestern Nigeria. The study area is
underlain by rocks of the Precambrian BasementComplex of Nigeria (Rahaman, 1988), while the lithological
units recognized in the area includes;migmatite-gneiss, quartzite, migmatised biotite-hornblende-gneissand
undifferentiated older granite suite (Figure 3).In the study area, weathering process create superficial layers with
varying degree of porosity and permeability. The regolith and fractured bedrock generally occur in typical
basement terrain (Odunsanya and Amadi, 1990). Studies have shown that the unconsolidated overburden could
constitute reliable aquifer, if significantly thick (Satpathy and Kanugo, 1976; Dan-Hassan and Olorunfemi,
1999; Bala and Ike, 2001). Presence of groundwater within the weathered layer and the clay contents of the
layer may increase the threat posed by corrosion to buried metallic utilities in the study area.
Figure 1: Base map of Ilaramokin
Geoelectric Sounding and Soil Physico-chemical Tests for Subsurface Layers ..
DOI: 10.9790/0990-0706032536 www.iosrjournals.org 27 | Page
Figure 2: Topographic map of Ilaramokin
Geoelectric Sounding and Soil Physico-chemical Tests for Subsurface Layers ..
DOI: 10.9790/0990-0706032536 www.iosrjournals.org 28 | Page
Figure 3: Simplified Geological Map of Ilaramokin

Geoelectric Sounding and Soil Physico-chemical Tests for Subsurface Layers ..
DOI: 10.9790/0990-0706032536 www.iosrjournals.org 29 | Page
III Research Methodology Thirty (30) geoelectric sounding data was acquired across the study area (Figure 4). The data were
interpreted using partial curve matching method involving the use of 2-layer Schlumberger master curve and
auxiliary curves (Zohdy, 1965 and Koefoed, 1979).Subsequently a 1-D computer forward modeling programme,
Window Resist version 1.0 (Vander Velpen, 1989) was used to enhance the resultant geoelectric parameters
(layer thickness and resistivity). The geoelectric sounding results were presented as sounding curves and iso-
resistivity depth slice maps at three (3) different depth surfaces (1, 2 and 3 m). Soil samples were collected at six
(6) different loocations coresponding to slightly corrosive, moderately corrosive, strongly and very strongly
corrosive zones. Two samples (2) were collected at each corrosive zones. The corrosivity model map of the
study area was generated based on the isoresistivty values at 2 m depth slice and the corrosivity model map was
validated using pH and conductivity values obtained from the physico-chemical tests conducted on the collected
soil samples.
Figure 4: Base map of Ilaramokin showing geolecric and soil sampling locations
Geoelectric Sounding and Soil Physico-chemical Tests for Subsurface Layers ..
DOI: 10.9790/0990-0706032536 www.iosrjournals.org 30 | Page
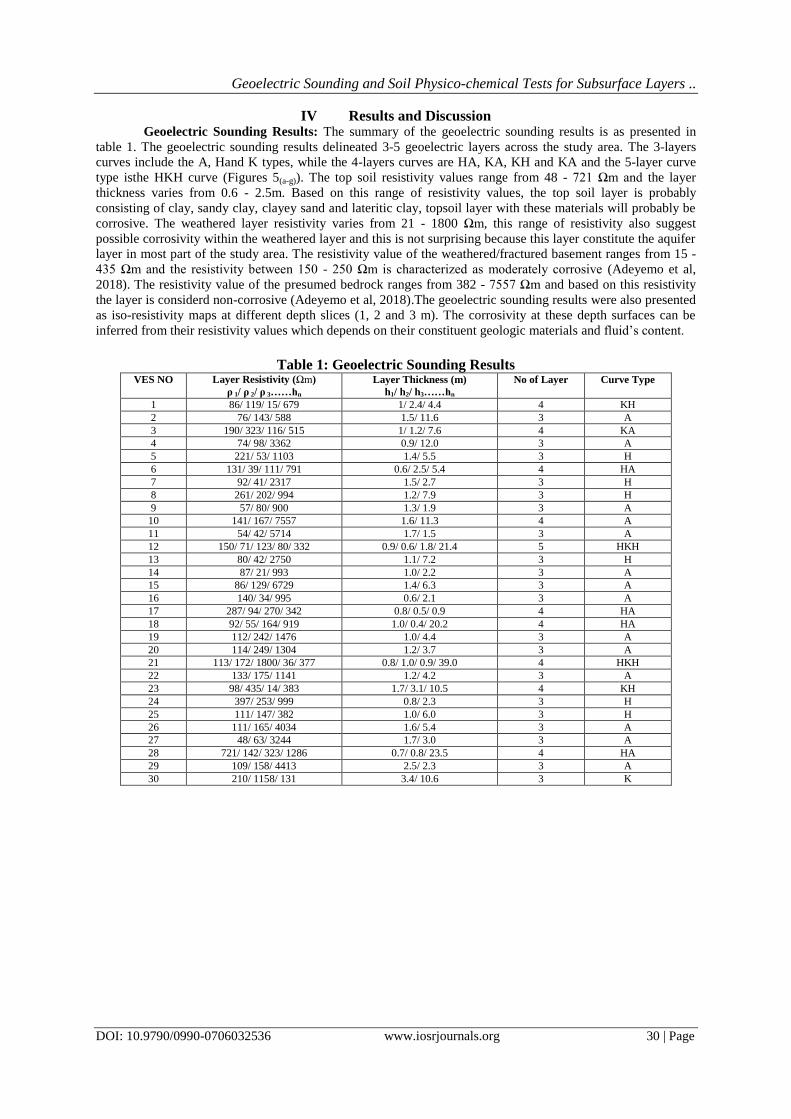
IV Results and Discussion Geoelectric Sounding Results: The summary of the geoelectric sounding results is as presented in
table 1. The geoelectric sounding results delineated 3-5 geoelectric layers across the study area. The 3-layers
curves include the A, Hand K types, while the 4-layers curves are HA, KA, KH and KA and the 5-layer curve
type isthe HKH curve (Figures 5(a-g)). The top soil resistivity values range from 48 - 721 Ωm and the layer
thickness varies from 0.6 - 2.5m. Based on this range of resistivity values, the top soil layer is probably
consisting of clay, sandy clay, clayey sand and lateritic clay, topsoil layer with these materials will probably be
corrosive. The weathered layer resistivity varies from 21 - 1800 Ωm, this range of resistivity also suggest
possible corrosivity within the weathered layer and this is not surprising because this layer constitute the aquifer
layer in most part of the study area. The resistivity value of the weathered/fractured basement ranges from 15 -
435 Ωm and the resistivity between 150 - 250 Ωm is characterized as moderately corrosive (Adeyemo et al,
2018). The resistivity value of the presumed bedrock ranges from 382 - 7557 Ωm and based on this resistivity
the layer is considerd non-corrosive (Adeyemo et al, 2018).The geoelectric sounding results were also presented
as iso-resistivity maps at different depth slices (1, 2 and 3 m). The corrosivity at these depth surfaces can be
inferred from their resistivity values which depends on their constituent geologic materials and fluid’s content.
Table 1: Geoelectric Sounding Results VES NO Layer Resistivity (Ωm)
ρ 1/ ρ 2/ ρ 3……hn
Layer Thickness (m)
h1/ h2/ h3……hn
No of Layer Curve Type
1 86/ 119/ 15/ 679 1/ 2.4/ 4.4 4 KH
2 76/ 143/ 588 1.5/ 11.6 3 A
3 190/ 323/ 116/ 515 1/ 1.2/ 7.6 4 KA
4 74/ 98/ 3362 0.9/ 12.0 3 A
5 221/ 53/ 1103 1.4/ 5.5 3 H
6 131/ 39/ 111/ 791 0.6/ 2.5/ 5.4 4 HA
7 92/ 41/ 2317 1.5/ 2.7 3 H
8 261/ 202/ 994 1.2/ 7.9 3 H
9 57/ 80/ 900 1.3/ 1.9 3 A
10 141/ 167/ 7557 1.6/ 11.3 4 A
11 54/ 42/ 5714 1.7/ 1.5 3 A
12 150/ 71/ 123/ 80/ 332 0.9/ 0.6/ 1.8/ 21.4 5 HKH
13 80/ 42/ 2750 1.1/ 7.2 3 H
14 87/ 21/ 993 1.0/ 2.2 3 A
15 86/ 129/ 6729 1.4/ 6.3 3 A
16 140/ 34/ 995 0.6/ 2.1 3 A
17 287/ 94/ 270/ 342 0.8/ 0.5/ 0.9 4 HA
18 92/ 55/ 164/ 919 1.0/ 0.4/ 20.2 4 HA
19 112/ 242/ 1476 1.0/ 4.4 3 A
20 114/ 249/ 1304 1.2/ 3.7 3 A
21 113/ 172/ 1800/ 36/ 377 0.8/ 1.0/ 0.9/ 39.0 4 HKH
22 133/ 175/ 1141 1.2/ 4.2 3 A
23 98/ 435/ 14/ 383 1.7/ 3.1/ 10.5 4 KH
24 397/ 253/ 999 0.8/ 2.3 3 H
25 111/ 147/ 382 1.0/ 6.0 3 H
26 111/ 165/ 4034 1.6/ 5.4 3 A
27 48/ 63/ 3244 1.7/ 3.0 3 A
28 721/ 142/ 323/ 1286 0.7/ 0.8/ 23.5 4 HA
29 109/ 158/ 4413 2.5/ 2.3 3 A
30 210/ 1158/ 131 3.4/ 10.6 3 K

Geoelectric Sounding and Soil Physico-chemical Tests for Subsurface Layers ..
DOI: 10.9790/0990-0706032536 www.iosrjournals.org 31 | Page
(a) A Curve type (b) H curve
(c) K Curve type (d) AA Curve type
(e) HA Curve type (f) KH Curve type
(g) HKH Curve type
Figures 5(a-g): Typical curve types obtained from the study area
Geoelectric Sounding and Soil Physico-chemical Tests for Subsurface Layers ..
DOI: 10.9790/0990-0706032536 www.iosrjournals.org 32 | Page
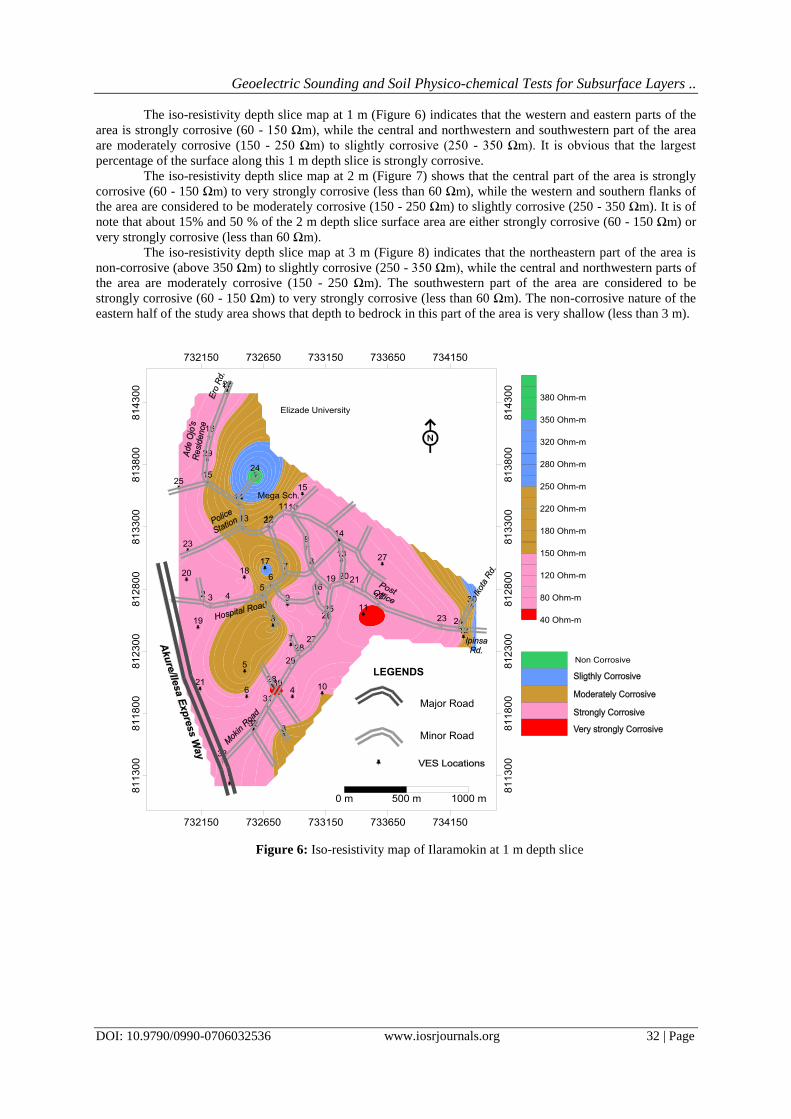
The iso-resistivity depth slice map at 1 m (Figure 6) indicates that the western and eastern parts of the
area is strongly corrosive (60 - 150 Ωm), while the central and northwestern and southwestern part of the area
are moderately corrosive (150 - 250 Ωm) to slightly corrosive (250 - 350 Ωm). It is obvious that the largest
percentage of the surface along this 1 m depth slice is strongly corrosive.
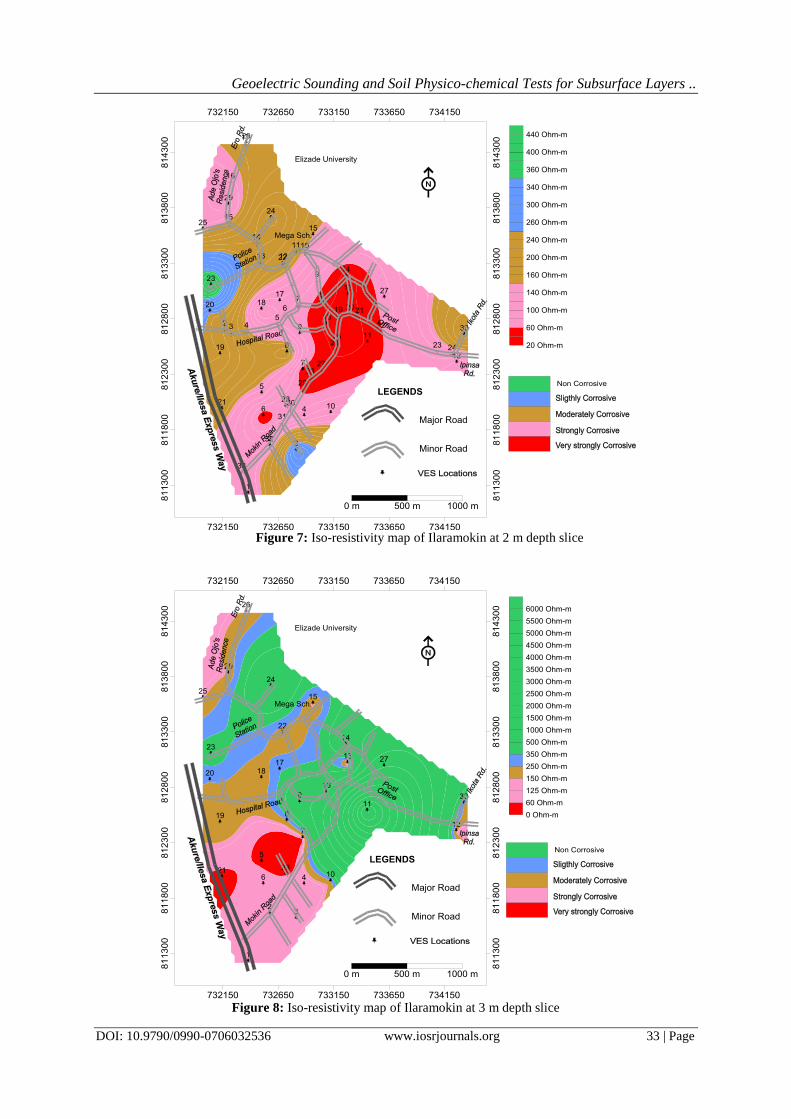
The iso-resistivity depth slice map at 2 m (Figure 7) shows that the central part of the area is strongly
corrosive (60 - 150 Ωm) to very strongly corrosive (less than 60 Ωm), while the western and southern flanks of
the area are considered to be moderately corrosive (150 - 250 Ωm) to slightly corrosive (250 - 350 Ωm). It is of
note that about 15% and 50 % of the 2 m depth slice surface area are either strongly corrosive (60 - 150 Ωm) or
very strongly corrosive (less than 60 Ωm).
The iso-resistivity depth slice map at 3 m (Figure 8) indicates that the northeastern part of the area is
non-corrosive (above 350 Ωm) to slightly corrosive (250 - 350 Ωm), while the central and northwestern parts of
the area are moderately corrosive (150 - 250 Ωm). The southwestern part of the area are considered to be
strongly corrosive (60 - 150 Ωm) to very strongly corrosive (less than 60 Ωm). The non-corrosive nature of the
eastern half of the study area shows that depth to bedrock in this part of the area is very shallow (less than 3 m).
Figure 6: Iso-resistivity map of Ilaramokin at 1 m depth slice
Geoelectric Sounding and Soil Physico-chemical Tests for Subsurface Layers ..
DOI: 10.9790/0990-0706032536 www.iosrjournals.org 33 | Page
Figure 7: Iso-resistivity map of Ilaramokin at 2 m depth slice
Figure 8: Iso-resistivity map of Ilaramokin at 3 m depth slice

Geoelectric Sounding and Soil Physico-chemical Tests for Subsurface Layers ..
DOI: 10.9790/0990-0706032536 www.iosrjournals.org 34 | Page
Corrosivity Model Map: The depth slice iso-resistivity of 2 m (Figure 7) was used generate the corrosivity
model map of the study area. The depth slice iso-resistivity of 2 m was considered the most appropriate for a
number of reasons; most metallic utilities were buried at this depth (storage tanks, pipes and others), the depth
slice have the largest corrosive surface area (about 65 %) and also most locations at the eastern part of the study
area have shallow depth to the bedrock (generally below 3 m). The Corrosivity Model Map (Figure 9) shows
that the central part of the area is strongly corrosive to very strongly corrosive, while the western and southern
flanks of the area are considered to be moderately to slightly corrosive (250 - 350 Ωm). About 65% of the study
area are either strongly corrosive or very strongly corrosive, while only about 10% of the study area are
considered to be slightly or non corrosive zones. Soil samples utilized for physico-chemical tests (pH and
conductivity test) were also collected at the same 2 m depth. The corrosivity model map of the area was
validated using the obtained pH and conductivity values from the physico-chemical analysis of soil samples.
Figure 9:Corrosivity model map of Ilaramokin showing soil sample locations
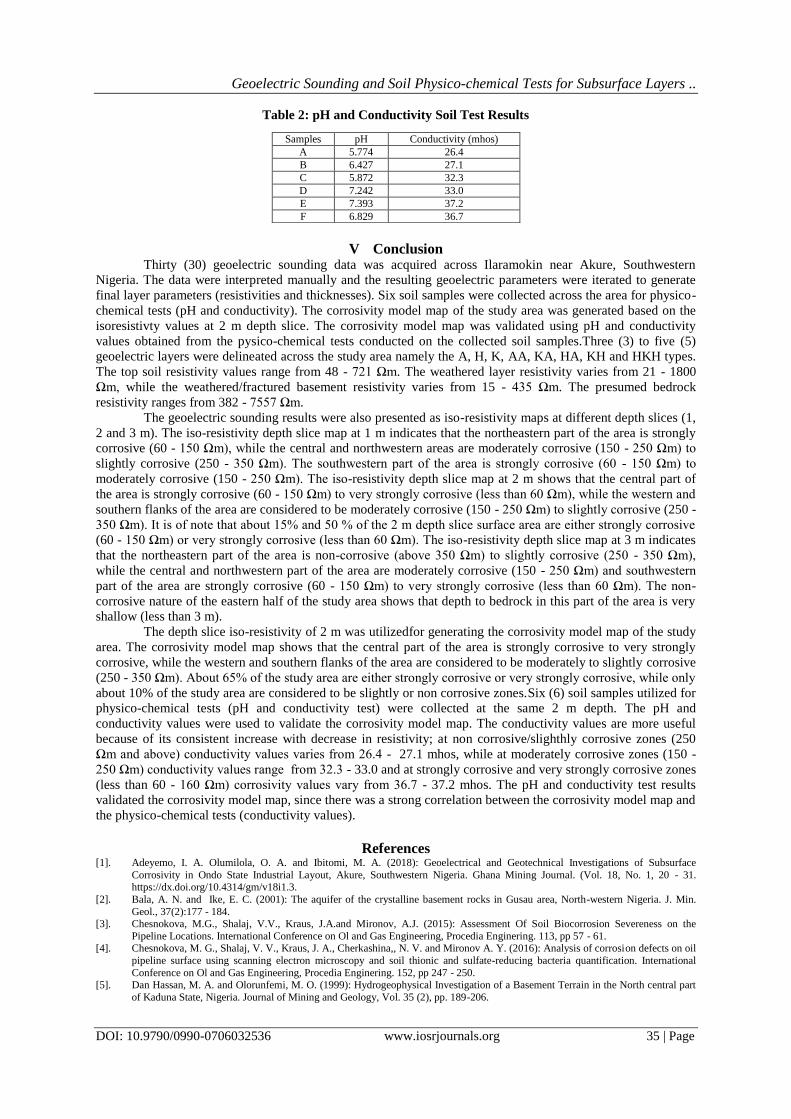
pH and Conductivity: The pH and conductivity tests were conducted on the soil samples collected
from the study area (Table 2) purposely to validate the generated corrosivity model of the area. samples A and B
were taken at the non corrosive and slightly corrosive zones and conductivityvalues at these zones vary from
26.4 - 27.1 mhos. Two samples C and D were taken at moderately corrosive zones and the conductivity values
at these zones range from 32.3 - 33.0 mhos. The two samples (E and F) collected from the strongly and very
strongly corrosive zones yields 36.7 - 37.2 mhos. The pH values measured from the six (6) collected soil
samples from the study area range from 5.774 - 7.393. The physico-chemical tests carried out on the soil
samples indicated that the subsurface materials at the 2 m depth slice are slightly acidic and moderately
conductive. The conductivity values are more useful since they show a consistent increase with decrease in
resistivity; at non corrosive/slighthly corrosive zones (250 Ωmand above) conductivity values varies from 26.4 -
27.1 mhos, while at moderately corrosive zones (150 - 250 Ωm) conductivity values range from 32.3 - 33.0 and
at strongly corrosive and very strongly corrosive zones (less than 60 - 160 Ωm) corrosivity values vary from
36.7- 37.2 mhos. The pH and conductivity test results validated the corrosivity model map, since there was a
strong correlation between the corrosivity model map and the physico-chemical tests (conductivity values).
Geoelectric Sounding and Soil Physico-chemical Tests for Subsurface Layers ..
DOI: 10.9790/0990-0706032536 www.iosrjournals.org 35 | Page
Table 2: pH and Conductivity Soil Test Results
V Conclusion Thirty (30) geoelectric sounding data was acquired across Ilaramokin near Akure, Southwestern
Nigeria. The data were interpreted manually and the resulting geoelectric parameters were iterated to generate
final layer parameters (resistivities and thicknesses). Six soil samples were collected across the area for physico-
chemical tests (pH and conductivity). The corrosivity model map of the study area was generated based on the
isoresistivty values at 2 m depth slice. The corrosivity model map was validated using pH and conductivity
values obtained from the pysico-chemical tests conducted on the collected soil samples.Three (3) to five (5)
geoelectric layers were delineated across the study area namely the A, H, K, AA, KA, HA, KH and HKH types.
The top soil resistivity values range from 48 - 721 Ωm. The weathered layer resistivity varies from 21 - 1800
Ωm, while the weathered/fractured basement resistivity varies from 15 - 435 Ωm. The presumed bedrock
resistivity ranges from 382 - 7557 Ωm.
The geoelectric sounding results were also presented as iso-resistivity maps at different depth slices (1,
2 and 3 m). The iso-resistivity depth slice map at 1 m indicates that the northeastern part of the area is strongly
corrosive (60 - 150 Ωm), while the central and northwestern areas are moderately corrosive (150 - 250 Ωm) to
slightly corrosive (250 - 350 Ωm). The southwestern part of the area is strongly corrosive (60 - 150 Ωm) to
moderately corrosive (150 - 250 Ωm). The iso-resistivity depth slice map at 2 m shows that the central part of
the area is strongly corrosive (60 - 150 Ωm) to very strongly corrosive (less than 60 Ωm), while the western and
southern flanks of the area are considered to be moderately corrosive (150 - 250 Ωm) to slightly corrosive (250 -
350 Ωm). It is of note that about 15% and 50 % of the 2 m depth slice surface area are either strongly corrosive
(60 - 150 Ωm) or very strongly corrosive (less than 60 Ωm). The iso-resistivity depth slice map at 3 m indicates
that the northeastern part of the area is non-corrosive (above 350 Ωm) to slightly corrosive (250 - 350 Ωm),
while the central and northwestern part of the area are moderately corrosive (150 - 250 Ωm) and southwestern
part of the area are strongly corrosive (60 - 150 Ωm) to very strongly corrosive (less than 60 Ωm). The non-
corrosive nature of the eastern half of the study area shows that depth to bedrock in this part of the area is very
shallow (less than 3 m).
The depth slice iso-resistivity of 2 m was utilizedfor generating the corrosivity model map of the study
area. The corrosivity model map shows that the central part of the area is strongly corrosive to very strongly
corrosive, while the western and southern flanks of the area are considered to be moderately to slightly corrosive
(250 - 350 Ωm). About 65% of the study area are either strongly corrosive or very strongly corrosive, while only
about 10% of the study area are considered to be slightly or non corrosive zones.Six (6) soil samples utilized for
physico-chemical tests (pH and conductivity test) were collected at the same 2 m depth. The pH and
conductivity values were used to validate the corrosivity model map. The conductivity values are more useful
because of its consistent increase with decrease in resistivity; at non corrosive/slighthly corrosive zones (250
Ωm and above) conductivity values varies from 26.4 - 27.1 mhos, while at moderately corrosive zones (150 -
250 Ωm) conductivity values range from 32.3 - 33.0 and at strongly corrosive and very strongly corrosive zones
(less than 60 - 160 Ωm) corrosivity values vary from 36.7 - 37.2 mhos. The pH and conductivity test results
validated the corrosivity model map, since there was a strong correlation between the corrosivity model map and
the physico-chemical tests (conductivity values).
References [1]. Adeyemo, I. A. Olumilola, O. A. and Ibitomi, M. A. (2018): Geoelectrical and Geotechnical Investigations of Subsurface
Corrosivity in Ondo State Industrial Layout, Akure, Southwestern Nigeria. Ghana Mining Journal. (Vol. 18, No. 1, 20 - 31. https://dx.doi.org/10.4314/gm/v18i1.3.
[2]. Bala, A. N. and Ike, E. C. (2001): The aquifer of the crystalline basement rocks in Gusau area, North-western Nigeria. J. Min.
Geol., 37(2):177 - 184. [3]. Chesnokova, M.G., Shalaj, V.V., Kraus, J.A.and Mironov, A.J. (2015): Assessment Of Soil Biocorrosion Severeness on the
Pipeline Locations. International Conference on Ol and Gas Engineering, Procedia Enginering. 113, pp 57 - 61. [4]. Chesnokova, M. G., Shalaj, V. V., Kraus, J. A., Cherkashina,, N. V. and Mironov A. Y. (2016): Analysis of corrosion defects on oil
pipeline surface using scanning electron microscopy and soil thionic and sulfate-reducing bacteria quantification. International
Conference on Ol and Gas Engineering, Procedia Enginering. 152, pp 247 - 250. [5]. Dan Hassan, M. A. and Olorunfemi, M. O. (1999): Hydrogeophysical Investigation of a Basement Terrain in the North central part
of Kaduna State, Nigeria. Journal of Mining and Geology, Vol. 35 (2), pp. 189-206.
Samples pH Conductivity (mhos)
A 5.774 26.4
B 6.427 27.1
C 5.872 32.3
D 7.242 33.0
E 7.393 37.2
F 6.829 36.7
Geoelectric Sounding and Soil Physico-chemical Tests for Subsurface Layers ..
DOI: 10.9790/0990-0706032536 www.iosrjournals.org 36 | Page
[6]. Gebremedhin, B. Tesfahunegn, A. and Solomon, G. (2013): Implications of Groundwater Quality to Corrosion Problem and Urban
Planning in Mekelle Area, Northern Ethiopia. Momona Ethiopian Journal of Science (MEJS), V5 (1), pp. 51 - 70.
[7]. Idornigie, A.I., Olorunfemi, M.O. and Omitogun, A.A. (2006): Electrical Resistivity Determination of Subsurface Layers Soil Competence and Soil Corrosivity at Engineering Site Location in Akungba-Akoko, Southwestern Nigeria. Ife Journal of Science
Vol. 8, No. 2, pp. 159 -177.
[8]. Koefoed, O. (1979): Geosounding Principles 1. Resistivity Measurements. Elsevier Scientific Publishing, Amsterdam, Netherlands, 275p.
[9]. Najjaran, H., Sadiq, R. and Rajani, B. (2004): Modeling Pipe Deterioration Using Soil Properties – An Application Of Fuzzy Logic
Expert System. National Research Council Canada A version of this document is published in ACSE International Conference on Pipeline Engineering and Construction, San Diego, CA., August 1-4, 2004, pp. 1-10.
[10]. Odusanya, B.O. and Amadi, U.M.P. (1999): An Empirical Resistivity Model for Predicting Shallow Groundwater Occurrence in the
Basement Complex. Water Resources, Journal of Nigeria Association of Hydrologist. 2, 77-87. [11]. Owate, I.O. Ezi, C.W.I. and Avwiri, G. (2002): Impact of Environmental Conditions on Sub-Surface Storage Tank (Part 1).
International Journal Environmental Management. Vol. 6, No. 2, pp. 79 - 83.
[12]. Oyedele, K.F., Meshida, E. A. and Obidike, C.C. (2012): Assessment of Coastal Soil Corrosivity Using Resistivity Tomography at Lekki. Lagos, Nigeria. International Journal of Science and Advanced Technology. Vol. 2, No. 6, pp. 77 - 81.
[13]. Rahaman, M. A. (1988): Recent advances in the study of the Basement Complex of Nigeria. In: Oluyide, P.O., Mbonu, W.C.,
Ogezi, A.E., Egbuniwe, I.G., Ajibade, A.C. and Umeji, A.C. (eds.). Precambrian Geology of Nigeria, G.S.N., pp. 11 - 41. [14]. Satpathy, B. N. and Kanungo, B. N. (1976): Groundwater exploration in Hard rock terrain- A case study. Geophys. Prospect., 24(4):
725-763.
[15]. Vander Velpen, B. P. A. (2004): WinRESIST Software Version 1.0. ITC, IT-RSG/GSD, Delft, Netherlands. [16]. Zohdy, A.A.R. 1965. The Auxiliary Point Method of Electrical Sounding Interpretation and its Relationship to Dar Zarrouk
Parameters. Geophysics, 30(4): 644 - 660.