geodesy lesson plan : all shook up - microsoft 1 geodesy all shook up | lesson plan geodesy lesson...
TRANSCRIPT
oceanservice.noaa.gov 1
Geodesy All Shook Up | Lesson Plan
GEODESY LESSON PLAN
All Shook UpFocus
Displacement of the Earth’s crust due to seismic events
Grade Level9-12
Focus QuestionHow can we measure movements in the Earth’s crust due to seismic events?
Learning ObjectivesStudents will be able to calculate the amount of displacement in horizontal and vertical direction due to an earthquake.
Materials• Computer with internet access and a working email account
(if computer access is not available, you may choose to use data sets included in Crustal Displacement – Teacher Answer Guide)
• Copies of Using CORS Data, one for each student or student group
• Copy of Using CORS Data – Teacher’s Guide, one copy for teacher’s reference
• Copies of Student Sheet Analyzing Crustal Displacement Due to Earthquakes, one for each student or student group
• Calculator or spreadsheet program, such as Microsoft Excel• Copies of either Geodesy Subject Review (fill-in-the-blank
version, with or without word bank) or Geodesy Subject Review Crossword Puzzle one copy for each student or stu-dent group (these tests are included in the Meet Geodesy les-son plan).
Audio/Visual MaterialsNone
Teaching TimeThree 45-minute class periods, plus one additional class period to complete the Meet Geodesy lesson, if desired
All Shook Up| Lesson Plan Geodesy
2 oceanservice.noaa.gov oceanservice.noaa.gov 3
Seating ArrangementGroups of three students
Maximum Number of StudentsThis depends upon availability of computers; if access is limited you might have one group retrieving data while the remaining groups complete one version of the Geodesy Subject Review
Key WordsGPSCORSOPUSPlate boundaryFault
Background[NOTE: See the Meet Geodesy lesson plan for background on the science and importance of geodesy.]
The National Geodetic Survey (NGS) uses Global Positioning System (GPS) data to measure 3-dimensional positions on the Earth’s surface with accuracies of 1 centimeter or better. These measurements enable the detection of subtle displacements of the Earth’s crust due to seismic events over relatively short time periods.
Hundreds of permanent and continuously tracking GPS sta-tions have been installed throughout the United States and practically all of the data produced by these stations are avail-able through the Internet. NGS provides much of these data through its Continuously Operating Reference Station (CORS) Network. NGS has also initiated its On-line Positioning User Service (OPUS) where GPS data are submitted through the OPUS Web site. The data are then processed and the results emailed back to the user within a matter of minutes. The pre-cision of these OPUS results, the density of the GPS tracking networks, the simplicity of the data processing, and the on-line data archive (reaching back in many cases over 5 years) allow analysis of crustal motions in all 50 states.
All Shook Up| Lesson Plan Geodesy
2 oceanservice.noaa.gov oceanservice.noaa.gov 3
Alaska has more earthquakes and larger earthquakes than any other state. In fact, the four largest earthquakes ever recorded in the United States all occurred in Alaska. The reason for this is that the southern portion of Alaska is located on the bound-ary between the Pacific Plate and the North American Plate. While most of the seismic activity occurs in the region of the plate boundary, there are also several active faults in Alaska that can also create earthquakes.
On November 3, 2002, a magnitude 7.9 earthquake hit Alaska. The earthquake occurred about 144 km (90 miles) south of Fairbanks along the Denali Fault. The quake fractured over 336 km (209 miles) of the Earth’s surface, triggering thou-sands of landslides and damaging runways at a nearby airport. Fortunately, the quake caused no deaths and very little struc-tural damage because the surrounding area is sparsely popu-lated. However, many locations around the epicenter did expe-rience a displacement due to the quake. These displacements consisted of both vertical and horizontal motions.
In this lesson, students will analyze geodetic data from three sites affected by the Alaskan earthquake of November 3, 2002, and determine how much the Earth’s crust was displaced by this event.
Learning Procedure[NOTE: You may want to complete part or all of the “Meet Geodesy” les-son plan if students have not been previously introduced to this science.]
Part 1: Briefly introduce the concept of measuring displacements in
the Earth’s crust using geodetic data, and describe the Alaskan earthquake of November 3, 2002 (maps and other information about the earthquake can be found at http://neic.usgs.gov/neis/poster/2002/20021103.html)
Part 2: (If students will be retrieving data via the Internet)
1. Have students review Using CORS Data. Go over this with
students ahead of time so they are familiar with how to retrieve the needed information from the NGS Web site.
Geodesy All Shook Up | Lesson Plan
All Shook Up| Lesson Plan Geodesy
4 oceanservice.noaa.gov oceanservice.noaa.gov 5
2. Student will need the following RINEX2 files from the NGS
Web site. Have each student or student group get data for one or more of the dates listed for the following sites:
3. Submit the files to OPUS. Use the following information for antennas:FAIR: AOAD/M_T [Dorne Margolin T. Chokerings
(TurboRogue)]GNAA: TRM22020.00+GP (Geodetic L1/L2 compact +
groundplane)TLKA: TRM22020.00+GP (Geodetic L1/L2 compact +
groundplane)
Use the following three sites as the base sites:AIS1 (Annette Island 1, AK)BAY1 (Cold Bay 1, AK)PBOC (Prudhoe Bay 2, AK)
4. Extract the latitude, longitude, and elevation information from
each OPUS solution.
Part 3:1. Assign one of the three sites to each student in each group.
Have students fill in the table in their worksheet using the latitude, longitude, and elevation data for their assigned site.
FAIR(Fairbanks, AK):
Oct 26, 2002Oct 30, 2002Oct 31, 2002Nov 1, 2002Nov 2, 2002Nov 4, 2002Nov 6, 2002Nov 8, 2002Nov 12, 2002Nov 13, 2002
GNAA(Glennallen, AK):
Oct 29, 2002Oct 30, 2002Oct 31, 2002Nov 1, 2002Nov 2, 2002Nov 12, 2002Nov 13, 2002Nov 21, 2002Nov 22, 2002Nov 25, 2002
TLKA(Talkeetna, AK):
Oct 29, 2002Oct 30, 2002Oct 31, 2002Nov 1, 2002Nov 2, 2002Nov 12, 2002Nov 13, 2002Nov 21, 2002Nov 22, 2002Nov 25, 2002
All Shook Up| Lesson Plan Geodesy
4 oceanservice.noaa.gov oceanservice.noaa.gov 5
2. Have students make four graphs for their assigned site:• Latitude vs. Date• Longitude vs. Date• Elevation vs. Date• Latitude vs. LongitudeNote: This can be easily done by importing the data into a spreadsheet
program; Microsoft Excel works well.
3. Have students share their graphs with the other members in
their group. They will need information from all three sites to answer the questions that follow.
4. Have students answer the questions on the worksheet. Lead
a discussion of student’s results using answers from Crustal Displacement – Teacher Answer Guide as a guide. Ask stu-dents whether displacements of several centimeters are really significant. You may want to have a student stand straight up on a piece of cardboard or a small piece of carpet, and jerk the cardboard or carpet a few centimeters along the floor. Ask students what might happen if rigid structures (such as buildings) were similarly displaced. Students should realize that relatively small displacements can still have significant effects. Students should also realize that quantifying dis-placements caused by earthquakes can provide useful data for designing earthquake-resistant structures, and possibly for developing better tools and methods for predicting earth-quakes.
The Bridge Connectionwww.vims.edu/bridge/ Click on “Search” in the box on the upper right and enter : ”earthquake.”
The “Me” ConnectionHave students write a short essay in which they predict the effects of a sudden 6 cm shift in the portion of the Earth’s crust beneath their school building.
Connections to Other SubjectsGeography, Technology, and Mathematics
Geodesy All Shook Up | Lesson Plan
All Shook Up| Lesson Plan Geodesy
6 oceanservice.noaa.gov oceanservice.noaa.gov 7
EvaluationThe teacher will review the student’s Analyzing Crustal Displacement Due to Earthquakes worksheet.
Extensions1. Visit http://geodesy.noaa.gov/TOOLS/ to learn more about the
kinds of information that can be obtained through geodesy.
2. Have students visit http://geodesy.noaa.gov/INFO/NGShistory.html and prepare a brief report highlighting advances in geodesy since the establishment of the National Geodetic Survey in 1807.
3. Visit http://mceer.buffalo.edu/education/exercises/struct.asp to learn about designing structures to perform well during an earth-quake.
4. Visit http://www.exploratorium.edu/faultline/activities/index.html for ideas from the exploratorium to learn more about earth-quakes.
Resourceshttp://www.ngs.noaa.gov/CORS/ – Web site for the National
Geodetic Survey’s network of Continuously Operating Reference Stations (CORS) that provide Global Positioning System (GPS) measurements to support accu-rate determination of locations and elevations throughout the United States and its territories.
http://www.ngs.noaa.gov/OPUS – Web site for the National Geodetic Survey’s On-line Positioning User Service (OPUS). This service allows users to submit GPS data files to NGS, where the data are processed to determine a position using NGS computers and software. Calculated positions are reported back via email.
http://oceanservice.noaa.gov/news/features/supp_sep03.html. – National Ocean Service Web site story that describes the National Spatial Reference System, Global Positioning System, and why geodesy is important.
All Shook Up| Lesson Plan Geodesy
6 oceanservice.noaa.gov oceanservice.noaa.gov 7
http://geodesy.noaa.gov/GEOID/ – National Geodetic Survey Web site with definitions, descriptions, and links to research and information about the geoid, including a slide show on gravity and the geoid.
http://geodesy.noaa.gov/GRD/ – Web site of the Geosciences Research Division of the National Geodetic Survey, with current projects, data, software and archives.
http://geodesy.noaa.gov/PUBS_LIB/thePossibilities/Imagine.html – A brochure (PDF format) explaining the role of geodesy in contemporary America.
http://geodesy.noaa.gov/PUBS_LIB/Geodesy4Layman/TR80003A.HTM – A “classic” report which presents the basic principles of geodesy in an elementary form.
http://einstein.gge.unb.ca/tutorial/tutorial.htm – An introduction to geodesy by the Geodesy Group at the University of New Brunswick.
http://geodesy.noaa.gov/faq.shtml – Frequently Asked Questions about geodesy and the National Geodetic Survey.
http://geodesy.noaa.gov/INFO/NGShistory.html – History of the National Geodetic Survey, which was the first civilian scientific agency in the United States, established by President Thomas Jefferson in 1807.
http://geodesy.noaa.gov/geodetic_links.shtml – Links to other organi-zations, information, and resources about geodesy
National Science Education StandardsContent Standard A: Science as Inquiry
• Abilities necessary to do scientific inquiry• Understandings about scientific inquiry
Content Standard B: Physical Science • Motions and forces
Content Standard D: Earth and Space Science
• Energy in the earth system
Geodesy All Shook Up | Lesson Plan

8 oceanservice.noaa.gov oceanservice.noaa.gov 9
Geodesy All Shook Up | Appendix
Content Standard E: Science and Technology • Abilities of technological design• Understandings about science and technology
Content Standard F: Science in Personal and Social Perspectives
• Natural and human-induced hazards• Science and technology in local, national, and global chal-
lenges
All Shook Up| Lesson Plan Geodesy
8 oceanservice.noaa.gov oceanservice.noaa.gov 9
Geodesy All Shook Up | Appendix
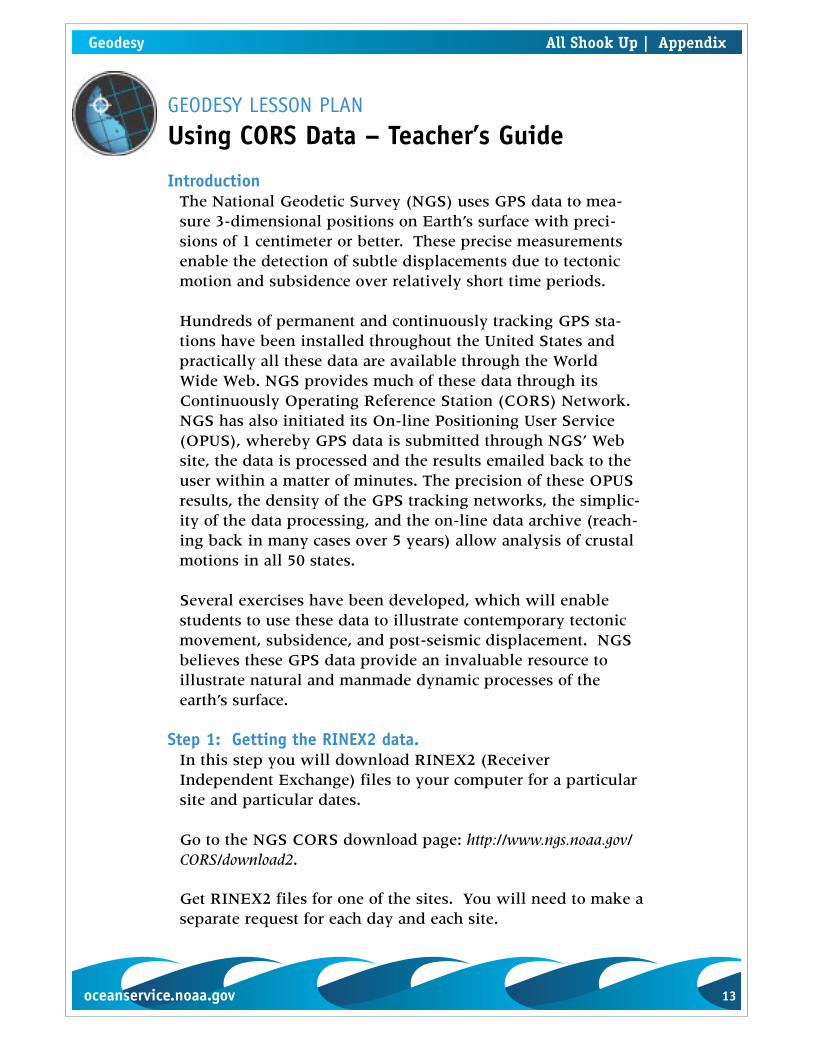
GEODESY LESSON PLAN
Using CORS Data
IntroductionThe National Geodetic Survey (NGS) uses GPS data to mea-sure 3-dimensional positions on Earth’s surface with preci-sions of 1 centimeter or better. These precise measurements enable the detection of subtle displacements due to tectonic motion and subsidence over relatively short time periods.
Hundreds of permanent and continuously tracking GPS sta-tions have been installed throughout the United States and practically all these data are available through the World Wide Web. NGS provides much of these data through its Continuously Operating Reference Station (CORS) Network. NGS has also initiated its On-line Positioning User Service (OPUS), whereby GPS data is submitted through NGS’ Web site, the data is processed and the results emailed back to the user within a matter of minutes. The precision of these OPUS results, the density of the GPS tracking networks, the simplic-ity of the data processing, and the on-line data archive (reach-ing back in many cases over 5 years) allow analysis of crustal motions in all 50 states.
Several exercises have been developed, which will enable students to use these data to illustrate contemporary tectonic movement, subsidence, and post-seismic displacement. NGS believes these GPS data provide an invaluable resource to illustrate natural and manmade dynamic processes of the earth’s surface.
Step 1: Getting the RINEX2 data.In this step you will download RINEX2 (Receiver Independent Exchange) files to your computer for a particular site and particular dates.
Go to the NGS CORS download page: http://www.ngs.noaa.gov/CORS/download2.
Get RINEX2 files for one of the sites. You will need to make a separate request for each day and each site.
10 oceanservice.noaa.gov
All Shook Up | Appendix Geodesy
oceanservice.noaa.gov 11
Geodesy All Shook Up | Appendix
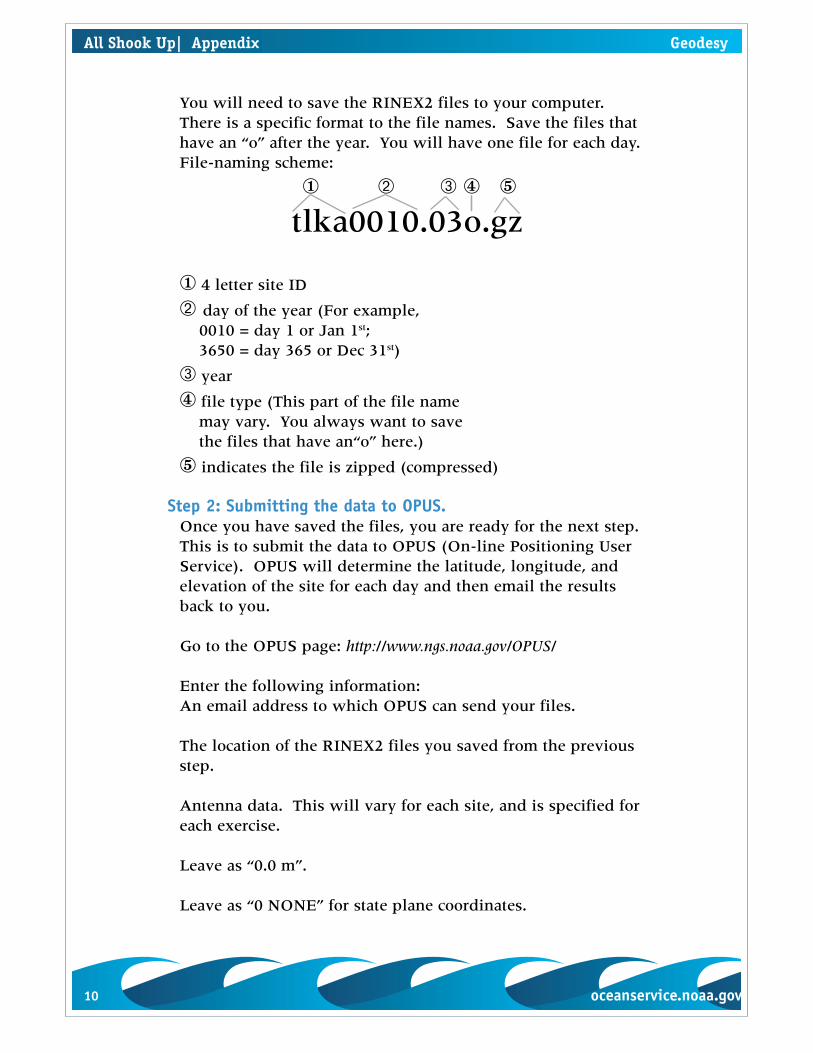
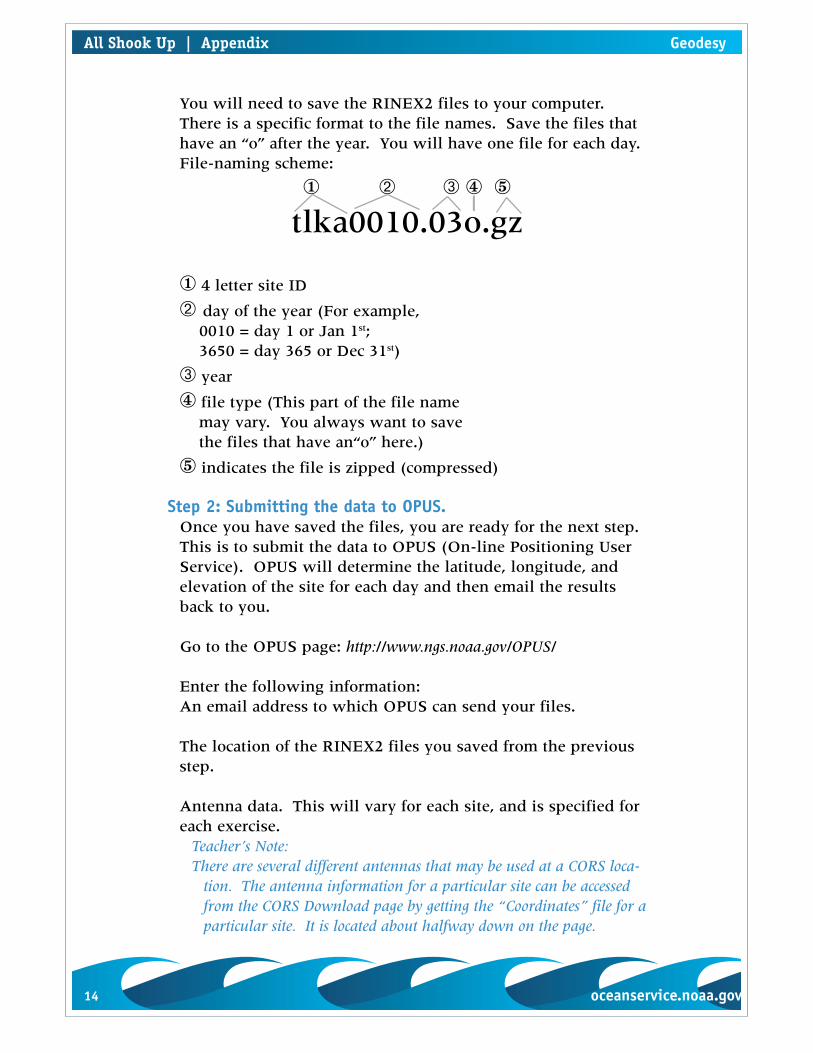
You will need to save the RINEX2 files to your computer. There is a specific format to the file names. Save the files that have an “o” after the year. You will have one file for each day.File-naming scheme:
tlka0010.03o.gz
4 letter site ID
day of the year (For example, 0010 = day 1 or Jan 1st; 3650 = day 365 or Dec 31st)
year
file type (This part of the file name may vary. You always want to save the files that have an“o” here.)
indicates the file is zipped (compressed)
Step 2: Submitting the data to OPUS.Once you have saved the files, you are ready for the next step. This is to submit the data to OPUS (On-line Positioning User Service). OPUS will determine the latitude, longitude, and elevation of the site for each day and then email the results back to you.
Go to the OPUS page: http://www.ngs.noaa.gov/OPUS/
Enter the following information:An email address to which OPUS can send your files.
The location of the RINEX2 files you saved from the previous step.
Antenna data. This will vary for each site, and is specified for each exercise.
Leave as “0.0 m”.
Leave as “0 NONE” for state plane coordinates.
All Shook Up| Appendix Geodesy
10 oceanservice.noaa.gov
All Shook Up | Appendix Geodesy
oceanservice.noaa.gov 11
Geodesy All Shook Up | Appendix
Click “OPTIONAL – PICK/REMOVE SITES”. Once you are there, you will need to choose the 3 sites to be used as base sites. This will vary and is specified for each exercise.
Click “upload file”. An OPUS solution file will be emailed to you for that particular day. Click the back button on your browser and repeat the process for the additional days.
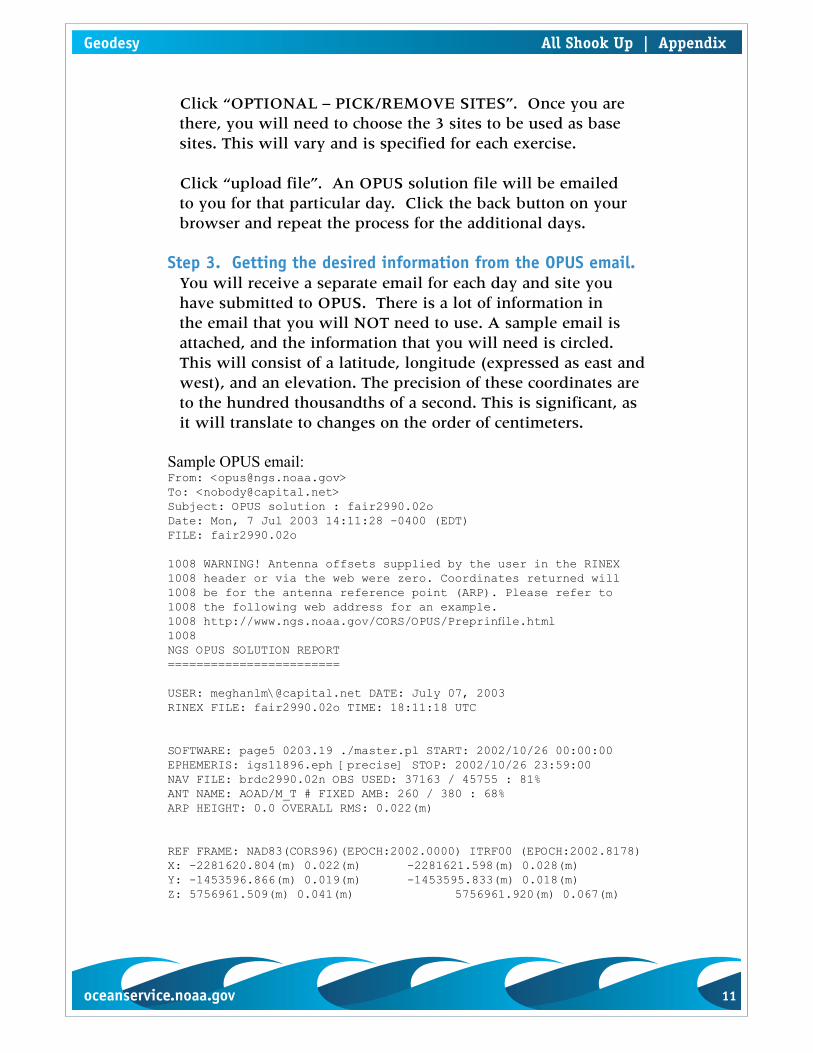
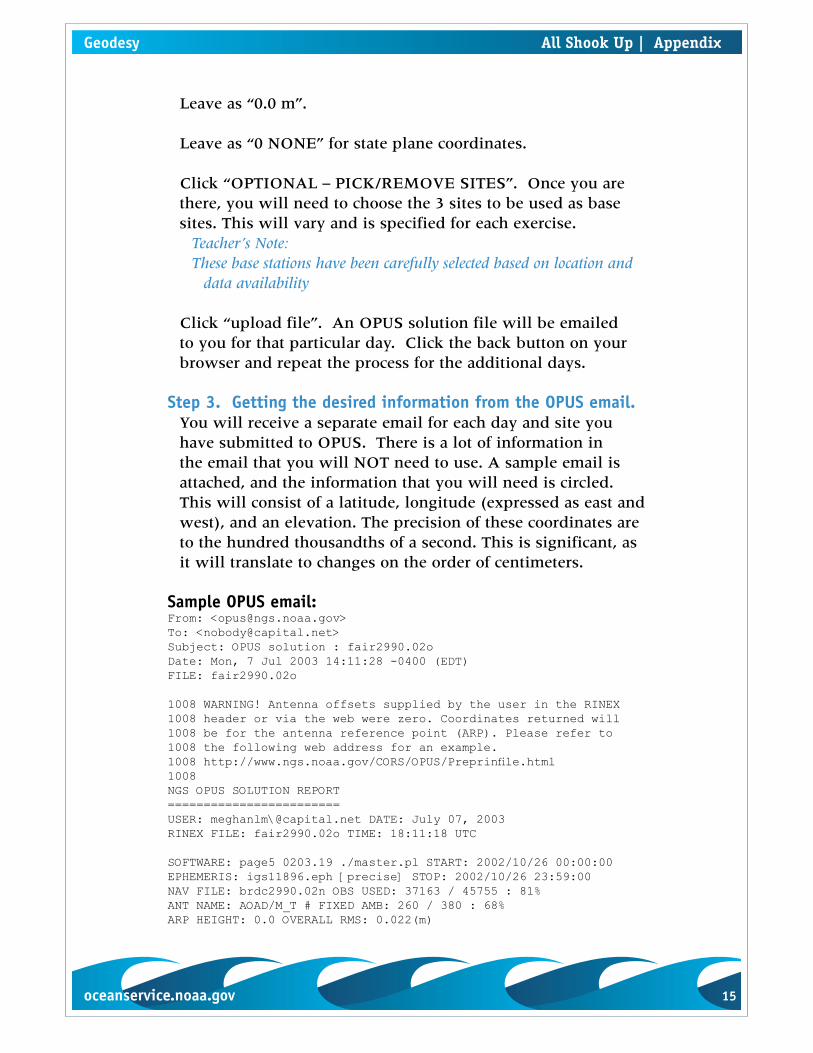
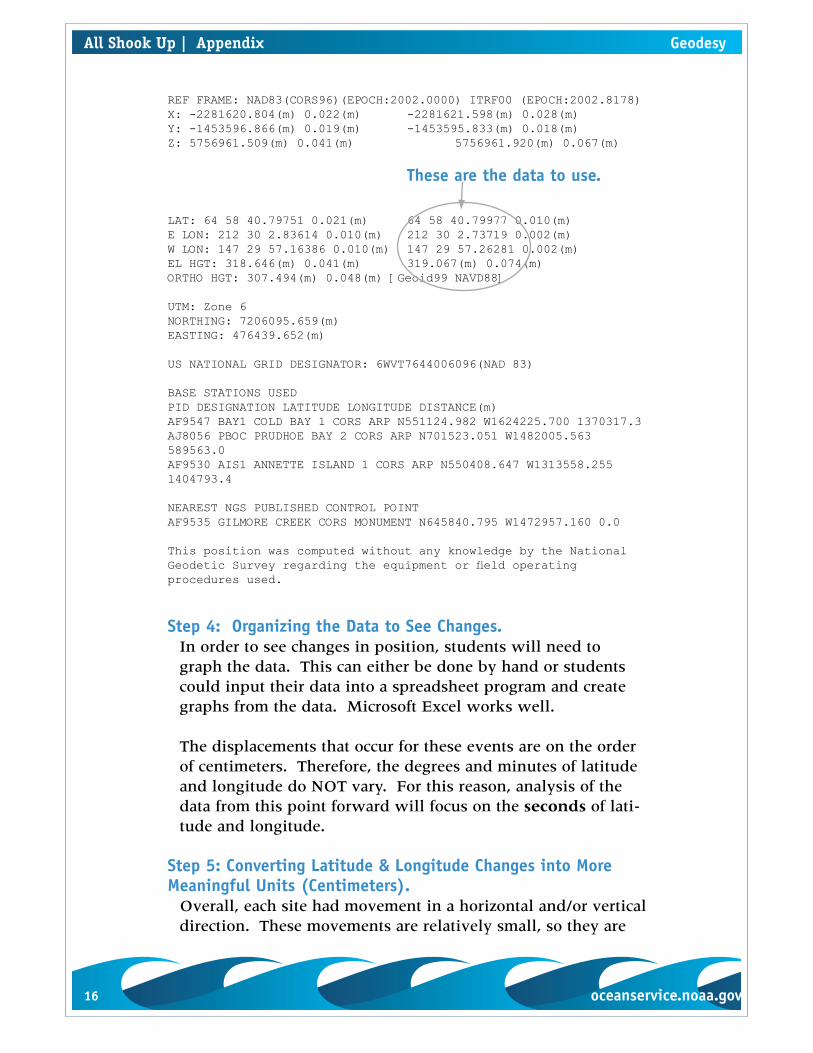
Step 3. Getting the desired information from the OPUS email.You will receive a separate email for each day and site you have submitted to OPUS. There is a lot of information in the email that you will NOT need to use. A sample email is attached, and the information that you will need is circled. This will consist of a latitude, longitude (expressed as east and west), and an elevation. The precision of these coordinates are to the hundred thousandths of a second. This is significant, as it will translate to changes on the order of centimeters.
Sample OPUS email:From: <[email protected]>To: <[email protected]>Subject: OPUS solution : fair2990.02oDate: Mon, 7 Jul 2003 14:11:28 -0400 (EDT)FILE: fair2990.02o
1008 WARNING! Antenna offsets supplied by the user in the RINEX 1008 header or via the web were zero. Coordinates returned will 1008 be for the antenna reference point (ARP). Please refer to 1008 the following web address for an example. 1008 http://www.ngs.noaa.gov/CORS/OPUS/Preprinfile.html 1008 NGS OPUS SOLUTION REPORT ========================
USER: meghanlm\@capital.net DATE: July 07, 2003 RINEX FILE: fair2990.02o TIME: 18:11:18 UTC
SOFTWARE: page5 0203.19 ./master.pl START: 2002/10/26 00:00:00 EPHEMERIS: igs11896.eph [precise] STOP: 2002/10/26 23:59:00 NAV FILE: brdc2990.02n OBS USED: 37163 / 45755 : 81% ANT NAME: AOAD/M_T # FIXED AMB: 260 / 380 : 68% ARP HEIGHT: 0.0 OVERALL RMS: 0.022(m)
REF FRAME: NAD83(CORS96)(EPOCH:2002.0000) ITRF00 (EPOCH:2002.8178) X: -2281620.804(m) 0.022(m) -2281621.598(m) 0.028(m) Y: -1453596.866(m) 0.019(m) -1453595.833(m) 0.018(m) Z: 5756961.509(m) 0.041(m) 5756961.920(m) 0.067(m)
12 oceanservice.noaa.gov
All Shook Up | Appendix Geodesy
oceanservice.noaa.gov 13
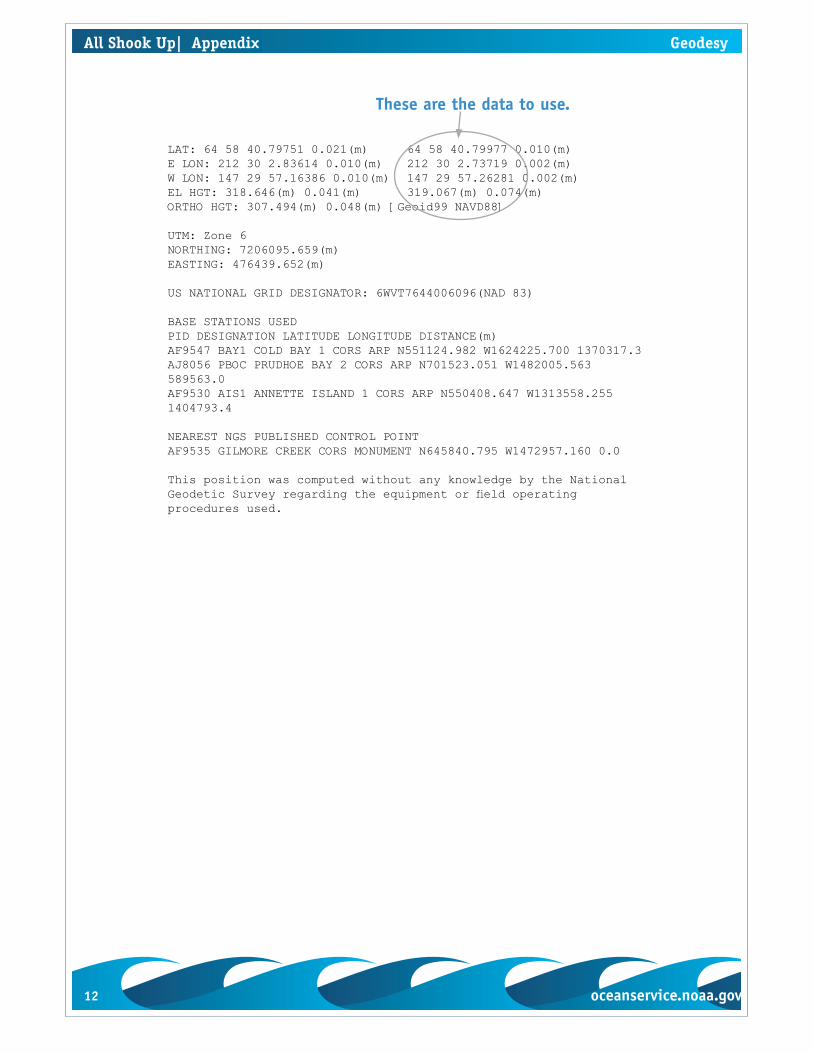
These are the data to use.
LAT: 64 58 40.79751 0.021(m) 64 58 40.79977 0.010(m) E LON: 212 30 2.83614 0.010(m) 212 30 2.73719 0.002(m) W LON: 147 29 57.16386 0.010(m) 147 29 57.26281 0.002(m) EL HGT: 318.646(m) 0.041(m) 319.067(m) 0.074(m) ORTHO HGT: 307.494(m) 0.048(m) [Geoid99 NAVD88]
UTM: Zone 6 NORTHING: 7206095.659(m) EASTING: 476439.652(m)
US NATIONAL GRID DESIGNATOR: 6WVT7644006096(NAD 83)
BASE STATIONS USED PID DESIGNATION LATITUDE LONGITUDE DISTANCE(m) AF9547 BAY1 COLD BAY 1 CORS ARP N551124.982 W1624225.700 1370317.3 AJ8056 PBOC PRUDHOE BAY 2 CORS ARP N701523.051 W1482005.563 589563.0 AF9530 AIS1 ANNETTE ISLAND 1 CORS ARP N550408.647 W1313558.255 1404793.4
NEAREST NGS PUBLISHED CONTROL POINT AF9535 GILMORE CREEK CORS MONUMENT N645840.795 W1472957.160 0.0
This position was computed without any knowledge by the National Geodetic Survey regarding the equipment or field operating procedures used.
All Shook Up| Appendix Geodesy
12 oceanservice.noaa.gov
All Shook Up | Appendix Geodesy
oceanservice.noaa.gov 13
GEODESY LESSON PLAN
Using CORS Data – Teacher’s Guide
IntroductionThe National Geodetic Survey (NGS) uses GPS data to mea-sure 3-dimensional positions on Earth’s surface with preci-sions of 1 centimeter or better. These precise measurements enable the detection of subtle displacements due to tectonic motion and subsidence over relatively short time periods.
Hundreds of permanent and continuously tracking GPS sta-tions have been installed throughout the United States and practically all these data are available through the World Wide Web. NGS provides much of these data through its Continuously Operating Reference Station (CORS) Network. NGS has also initiated its On-line Positioning User Service (OPUS), whereby GPS data is submitted through NGS’ Web site, the data is processed and the results emailed back to the user within a matter of minutes. The precision of these OPUS results, the density of the GPS tracking networks, the simplic-ity of the data processing, and the on-line data archive (reach-ing back in many cases over 5 years) allow analysis of crustal motions in all 50 states.
Several exercises have been developed, which will enable students to use these data to illustrate contemporary tectonic movement, subsidence, and post-seismic displacement. NGS believes these GPS data provide an invaluable resource to illustrate natural and manmade dynamic processes of the earth’s surface.
Step 1: Getting the RINEX2 data.In this step you will download RINEX2 (Receiver Independent Exchange) files to your computer for a particular site and particular dates.
Go to the NGS CORS download page: http://www.ngs.noaa.gov/CORS/download2.
Get RINEX2 files for one of the sites. You will need to make a separate request for each day and each site.
Geodesy All Shook Up | Appendix
14 oceanservice.noaa.gov oceanservice.noaa.gov 15
You will need to save the RINEX2 files to your computer. There is a specific format to the file names. Save the files that have an “o” after the year. You will have one file for each day.File-naming scheme:
tlka0010.03o.gz
4 letter site ID
day of the year (For example, 0010 = day 1 or Jan 1st; 3650 = day 365 or Dec 31st)
year
file type (This part of the file name may vary. You always want to save the files that have an“o” here.)
indicates the file is zipped (compressed)
Step 2: Submitting the data to OPUS.Once you have saved the files, you are ready for the next step. This is to submit the data to OPUS (On-line Positioning User Service). OPUS will determine the latitude, longitude, and elevation of the site for each day and then email the results back to you.
Go to the OPUS page: http://www.ngs.noaa.gov/OPUS/
Enter the following information:An email address to which OPUS can send your files.
The location of the RINEX2 files you saved from the previous step.
Antenna data. This will vary for each site, and is specified for each exercise.
Teacher’s Note:There are several different antennas that may be used at a CORS loca-
tion. The antenna information for a particular site can be accessed from the CORS Download page by getting the “Coordinates” file for a particular site. It is located about halfway down on the page.
All Shook Up | Appendix Geodesy
14 oceanservice.noaa.gov oceanservice.noaa.gov 15
Leave as “0.0 m”.
Leave as “0 NONE” for state plane coordinates.
Click “OPTIONAL – PICK/REMOVE SITES”. Once you are there, you will need to choose the 3 sites to be used as base sites. This will vary and is specified for each exercise.
Teacher’s Note: These base stations have been carefully selected based on location and
data availability
Click “upload file”. An OPUS solution file will be emailed to you for that particular day. Click the back button on your browser and repeat the process for the additional days.
Step 3. Getting the desired information from the OPUS email.You will receive a separate email for each day and site you have submitted to OPUS. There is a lot of information in the email that you will NOT need to use. A sample email is attached, and the information that you will need is circled. This will consist of a latitude, longitude (expressed as east and west), and an elevation. The precision of these coordinates are to the hundred thousandths of a second. This is significant, as it will translate to changes on the order of centimeters.
Sample OPUS email:From: <[email protected]>To: <[email protected]>Subject: OPUS solution : fair2990.02oDate: Mon, 7 Jul 2003 14:11:28 -0400 (EDT)FILE: fair2990.02o
1008 WARNING! Antenna offsets supplied by the user in the RINEX 1008 header or via the web were zero. Coordinates returned will 1008 be for the antenna reference point (ARP). Please refer to 1008 the following web address for an example. 1008 http://www.ngs.noaa.gov/CORS/OPUS/Preprinfile.html 1008 NGS OPUS SOLUTION REPORT ======================== USER: meghanlm\@capital.net DATE: July 07, 2003 RINEX FILE: fair2990.02o TIME: 18:11:18 UTC
SOFTWARE: page5 0203.19 ./master.pl START: 2002/10/26 00:00:00 EPHEMERIS: igs11896.eph [precise] STOP: 2002/10/26 23:59:00 NAV FILE: brdc2990.02n OBS USED: 37163 / 45755 : 81% ANT NAME: AOAD/M_T # FIXED AMB: 260 / 380 : 68% ARP HEIGHT: 0.0 OVERALL RMS: 0.022(m)
Geodesy All Shook Up | Appendix
16 oceanservice.noaa.gov oceanservice.noaa.gov 17
REF FRAME: NAD83(CORS96)(EPOCH:2002.0000) ITRF00 (EPOCH:2002.8178) X: -2281620.804(m) 0.022(m) -2281621.598(m) 0.028(m) Y: -1453596.866(m) 0.019(m) -1453595.833(m) 0.018(m) Z: 5756961.509(m) 0.041(m) 5756961.920(m) 0.067(m)
These are the data to use.
LAT: 64 58 40.79751 0.021(m) 64 58 40.79977 0.010(m) E LON: 212 30 2.83614 0.010(m) 212 30 2.73719 0.002(m) W LON: 147 29 57.16386 0.010(m) 147 29 57.26281 0.002(m) EL HGT: 318.646(m) 0.041(m) 319.067(m) 0.074(m) ORTHO HGT: 307.494(m) 0.048(m) [Geoid99 NAVD88]
UTM: Zone 6 NORTHING: 7206095.659(m) EASTING: 476439.652(m)
US NATIONAL GRID DESIGNATOR: 6WVT7644006096(NAD 83)
BASE STATIONS USED PID DESIGNATION LATITUDE LONGITUDE DISTANCE(m) AF9547 BAY1 COLD BAY 1 CORS ARP N551124.982 W1624225.700 1370317.3 AJ8056 PBOC PRUDHOE BAY 2 CORS ARP N701523.051 W1482005.563 589563.0 AF9530 AIS1 ANNETTE ISLAND 1 CORS ARP N550408.647 W1313558.255 1404793.4
NEAREST NGS PUBLISHED CONTROL POINT AF9535 GILMORE CREEK CORS MONUMENT N645840.795 W1472957.160 0.0
This position was computed without any knowledge by the National Geodetic Survey regarding the equipment or field operating procedures used.
Step 4: Organizing the Data to See Changes.In order to see changes in position, students will need to graph the data. This can either be done by hand or students could input their data into a spreadsheet program and create graphs from the data. Microsoft Excel works well.
The displacements that occur for these events are on the order of centimeters. Therefore, the degrees and minutes of latitude and longitude do NOT vary. For this reason, analysis of the data from this point forward will focus on the seconds of lati-tude and longitude.
Step 5: Converting Latitude & Longitude Changes into More Meaningful Units (Centimeters).
Overall, each site had movement in a horizontal and/or vertical direction. These movements are relatively small, so they are
All Shook Up | Appendix Geodesy
16 oceanservice.noaa.gov oceanservice.noaa.gov 17
Geodesy All Shook Up | Appendix
expressed in fractions of a second. The next step is to express these small numbers in units students are more familiar with: centimeters.
Note: You only need to deal with the seconds of latitude and longitude for all of the following steps.
Use a proportion and the information below to convert the change in latitude seconds into centimeters:
1 second of latitude = 3092.36 centimeters
Longitude is more complicated to deal with than latitude since longitude lines converge at the poles. A change in 1 degree of longitude at the equator would represent a much larger dis-tance than a change of 1 degree of longitude close to the poles. Therefore, longitude values need to be calculated as a function of latitude. Use the information below to convert the change in longitude seconds into centimeters. For this calculation, you can round the latitude to the nearest whole degree.
1 second of longitude = 3092.36 centimeters * cos (latitude)
18 oceanservice.noaa.gov oceanservice.noaa.gov 19
GEODESY LESSON PLAN
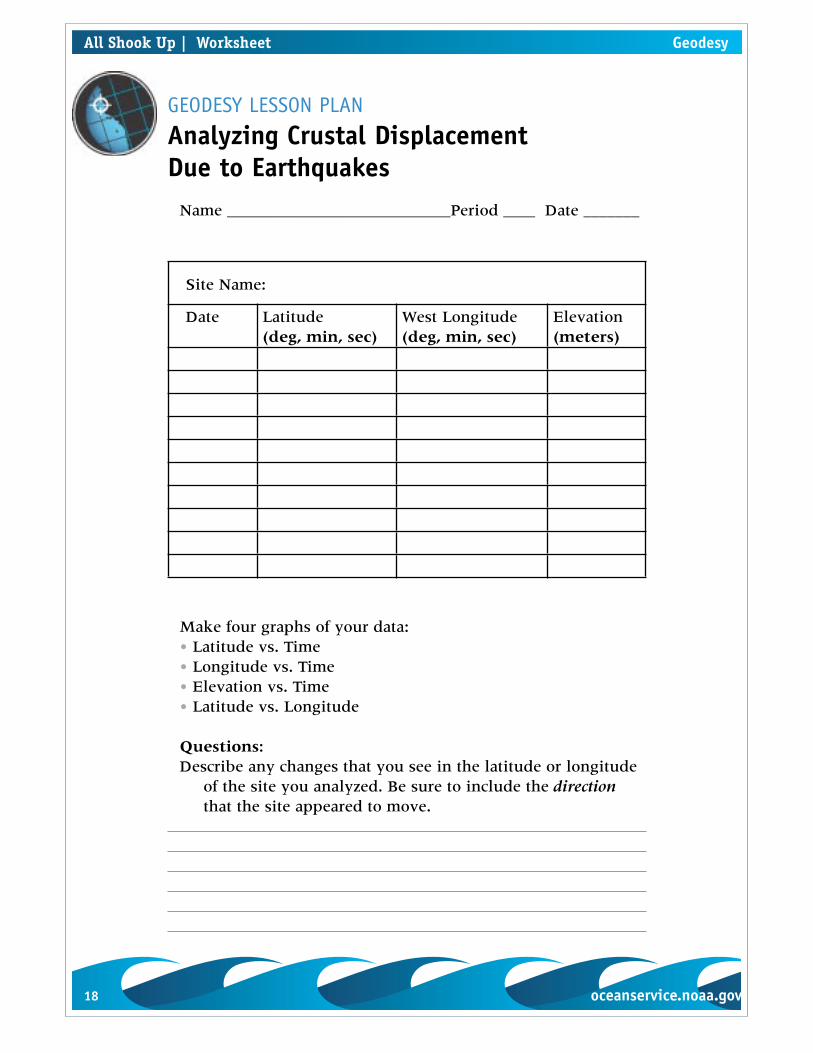
Analyzing Crustal Displacement Due to Earthquakes
Name ____________________________Period ____ Date _______
Site Name:
Date Latitude(deg, min, sec)
West Longitude(deg, min, sec)
Elevation(meters)
Make four graphs of your data:• Latitude vs. Time• Longitude vs. Time• Elevation vs. Time• Latitude vs. Longitude
Questions:Describe any changes that you see in the latitude or longitude
of the site you analyzed. Be sure to include the direction that the site appeared to move.
All Shook Up | Worksheet Geodesy

18 oceanservice.noaa.gov oceanservice.noaa.gov 19
Describe any changes that you see in the elevation of the site you analyzed.
Compare the data of the site that you analyzed with the other 2 sites. What similarities do you see? What differences?
Compare the graphs of latitude vs. longitude for all 3 sta-tions. Which graph seems to show the greatest correlation between changes of latitude and changes of longitude? Why do you think this is so?
For your site, calculate the average latitude and longitude for the site before the earthquake (November 3, 2002) and after the earthquake.
Geodesy All Shook Up | Worksheet
20 oceanservice.noaa.gov oceanservice.noaa.gov 21
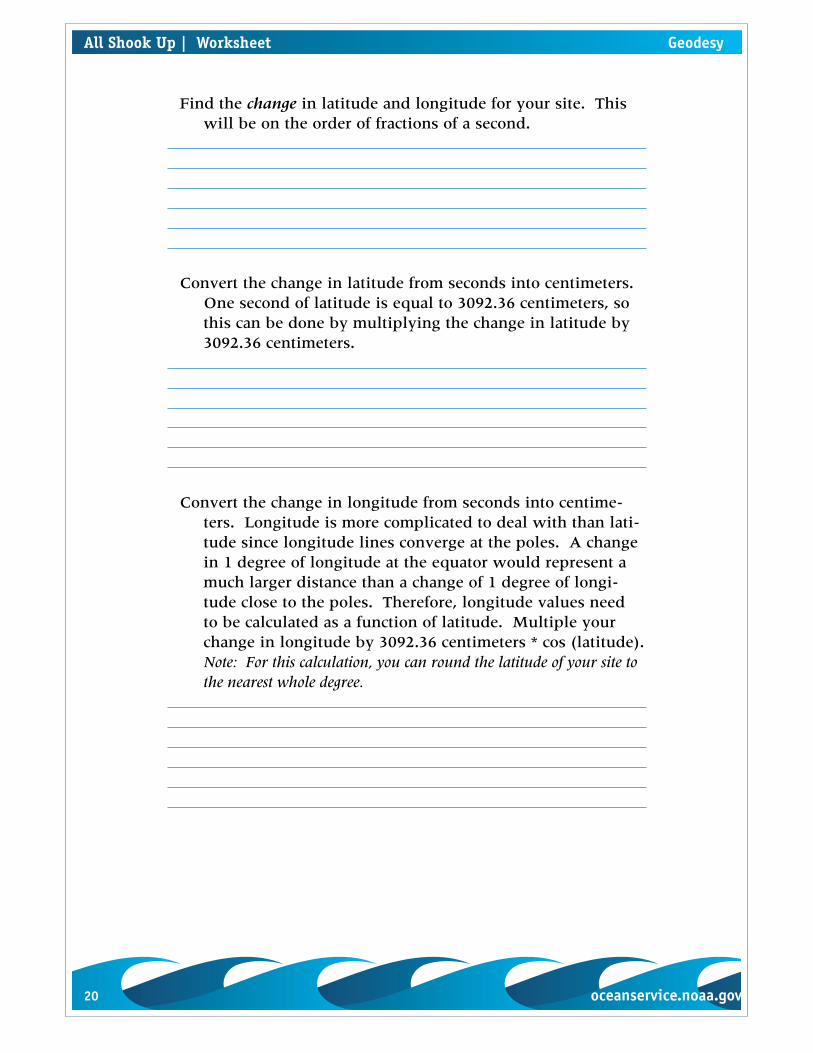
Find the change in latitude and longitude for your site. This will be on the order of fractions of a second.
Convert the change in latitude from seconds into centimeters. One second of latitude is equal to 3092.36 centimeters, so this can be done by multiplying the change in latitude by 3092.36 centimeters.
Convert the change in longitude from seconds into centime-ters. Longitude is more complicated to deal with than lati-tude since longitude lines converge at the poles. A change in 1 degree of longitude at the equator would represent a much larger distance than a change of 1 degree of longi-tude close to the poles. Therefore, longitude values need to be calculated as a function of latitude. Multiple your change in longitude by 3092.36 centimeters * cos (latitude). Note: For this calculation, you can round the latitude of your site to the nearest whole degree.
All Shook Up | Worksheet Geodesy

20 oceanservice.noaa.gov oceanservice.noaa.gov 21
Elevation changes are expressed in meters in the data from OPUS. Convert these meters into centimeters.
Compare the results from your site with your classmates’ results from the other two sites. Which site had the great-est change in latitude? In which direction did it move?
Which site had the greatest change in longitude? In which direction did it move?
Which site had the greatest change in elevation? In which direction did it move?
Geodesy All Shook Up | Work-
22 oceanservice.noaa.gov oceanservice.noaa.gov 23
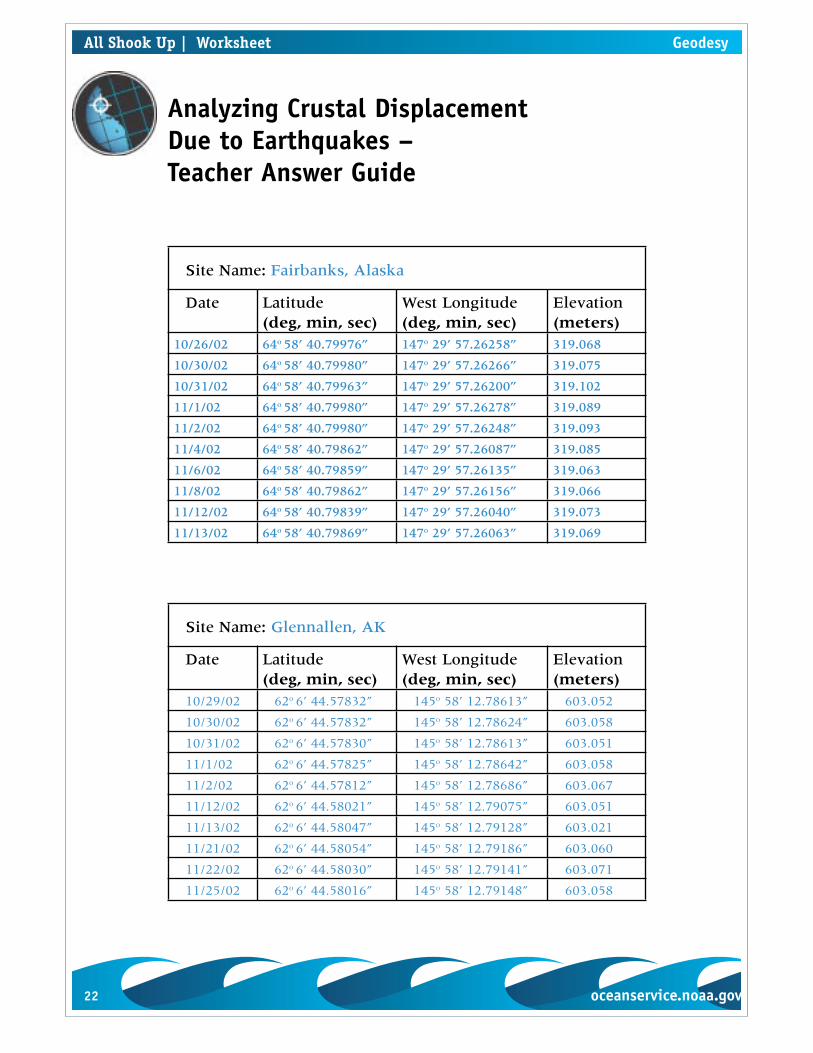
Analyzing Crustal Displacement Due to Earthquakes – Teacher Answer Guide
Site Name: Fairbanks, Alaska
Date Latitude(deg, min, sec)
West Longitude(deg, min, sec)
Elevation(meters)
10/26/02 64o 58’ 40.79976” 147o 29’ 57.26258” 319.068
10/30/02 64o 58’ 40.79980” 147o 29’ 57.26266” 319.075
10/31/02 64o 58’ 40.79963” 147o 29’ 57.26200” 319.102
11/1/02 64o 58’ 40.79980” 147o 29’ 57.26278” 319.089
11/2/02 64o 58’ 40.79980” 147o 29’ 57.26248” 319.093
11/4/02 64o 58’ 40.79862” 147o 29’ 57.26087” 319.085
11/6/02 64o 58’ 40.79859” 147o 29’ 57.26135” 319.063
11/8/02 64o 58’ 40.79862” 147o 29’ 57.26156” 319.066
11/12/02 64o 58’ 40.79839” 147o 29’ 57.26040” 319.073
11/13/02 64o 58’ 40.79869” 147o 29’ 57.26063” 319.069
Site Name: Glennallen, AK
Date Latitude(deg, min, sec)
West Longitude(deg, min, sec)
Elevation(meters)
10/29/02 62o 6’ 44.57832” 145o 58’ 12.78613” 603.052
10/30/02 62o 6’ 44.57832” 145o 58’ 12.78624” 603.058
10/31/02 62o 6’ 44.57830” 145o 58’ 12.78613” 603.051
11/1/02 62o 6’ 44.57825” 145o 58’ 12.78642” 603.058
11/2/02 62o 6’ 44.57812” 145o 58’ 12.78686” 603.067
11/12/02 62o 6’ 44.58021” 145o 58’ 12.79075” 603.051
11/13/02 62o 6’ 44.58047” 145o 58’ 12.79128” 603.021
11/21/02 62o 6’ 44.58054” 145o 58’ 12.79186” 603.060
11/22/02 62o 6’ 44.58030” 145o 58’ 12.79141” 603.071
11/25/02 62o 6’ 44.58016” 145o 58’ 12.79148” 603.058
All Shook Up | Worksheet Geodesy
22 oceanservice.noaa.gov oceanservice.noaa.gov 23
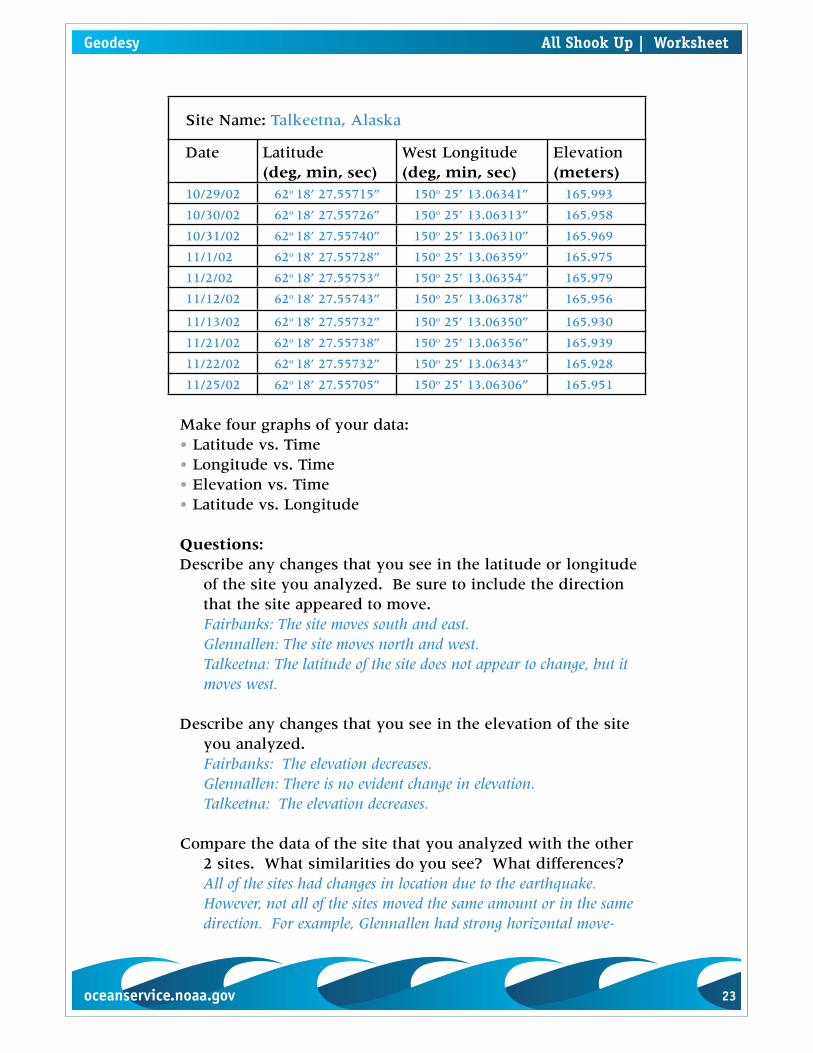
Site Name: Talkeetna, Alaska
Date Latitude(deg, min, sec)
West Longitude(deg, min, sec)
Elevation(meters)
10/29/02 62o 18’ 27.55715” 150o 25’ 13.06341” 165.993
10/30/02 62o 18’ 27.55726” 150o 25’ 13.06313” 165.958
10/31/02 62o 18’ 27.55740” 150o 25’ 13.06310” 165.969
11/1/02 62o 18’ 27.55728” 150o 25’ 13.06359” 165.975
11/2/02 62o 18’ 27.55753” 150o 25’ 13.06354” 165.979
11/12/02 62o 18’ 27.55743” 150o 25’ 13.06378” 165.956
11/13/02 62o 18’ 27.55732” 150o 25’ 13.06350” 165.930
11/21/02 62o 18’ 27.55738” 150o 25’ 13.06356” 165.939
11/22/02 62o 18’ 27.55732” 150o 25’ 13.06343” 165.928
11/25/02 62o 18’ 27.55705” 150o 25’ 13.06306” 165.951
Make four graphs of your data:• Latitude vs. Time• Longitude vs. Time• Elevation vs. Time• Latitude vs. Longitude
Questions:Describe any changes that you see in the latitude or longitude
of the site you analyzed. Be sure to include the direction that the site appeared to move.Fairbanks: The site moves south and east.Glennallen: The site moves north and west.Talkeetna: The latitude of the site does not appear to change, but it moves west.
Describe any changes that you see in the elevation of the site you analyzed.Fairbanks: The elevation decreases.Glennallen: There is no evident change in elevation. Talkeetna: The elevation decreases.
Compare the data of the site that you analyzed with the other 2 sites. What similarities do you see? What differences?All of the sites had changes in location due to the earthquake. However, not all of the sites moved the same amount or in the same direction. For example, Glennallen had strong horizontal move-
Geodesy All Shook Up | Worksheet
24 oceanservice.noaa.gov oceanservice.noaa.gov 25
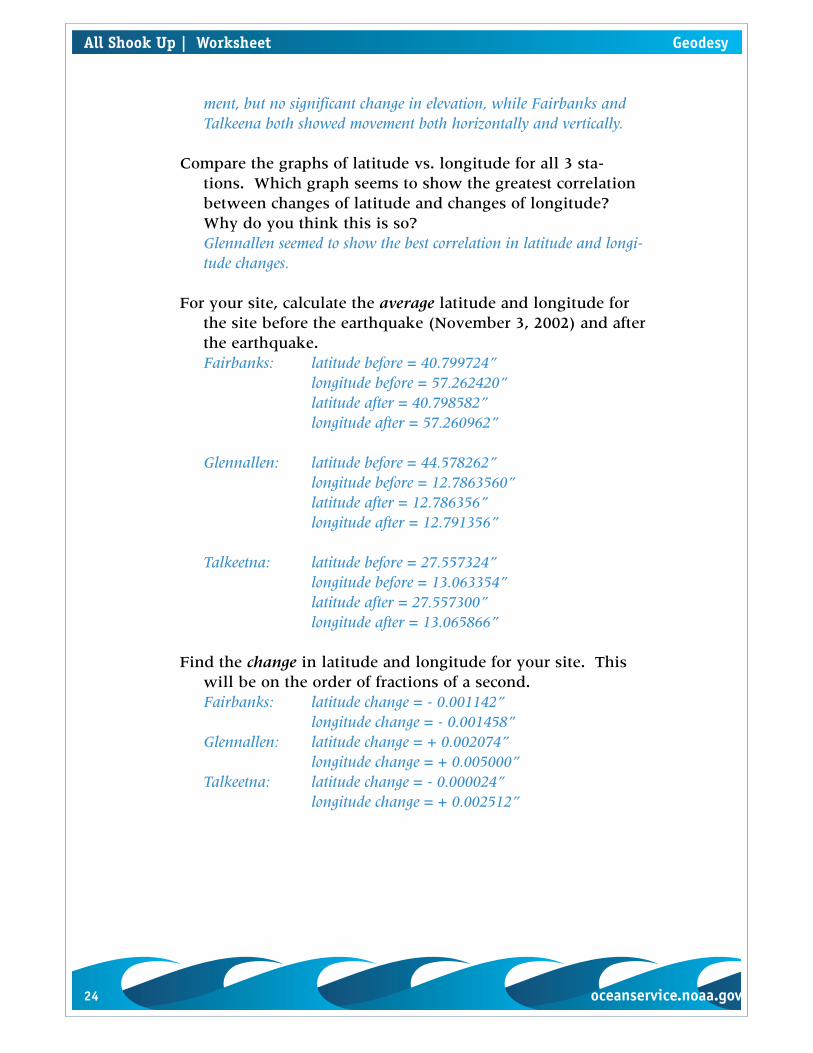
ment, but no significant change in elevation, while Fairbanks and Talkeena both showed movement both horizontally and vertically.
Compare the graphs of latitude vs. longitude for all 3 sta-tions. Which graph seems to show the greatest correlation between changes of latitude and changes of longitude? Why do you think this is so?Glennallen seemed to show the best correlation in latitude and longi-tude changes.
For your site, calculate the average latitude and longitude for the site before the earthquake (November 3, 2002) and after the earthquake. Fairbanks: latitude before = 40.799724” longitude before = 57.262420” latitude after = 40.798582” longitude after = 57.260962”
Glennallen: latitude before = 44.578262” longitude before = 12.7863560” latitude after = 12.786356” longitude after = 12.791356”
Talkeetna: latitude before = 27.557324” longitude before = 13.063354” latitude after = 27.557300” longitude after = 13.065866”
Find the change in latitude and longitude for your site. This will be on the order of fractions of a second.Fairbanks: latitude change = - 0.001142” longitude change = - 0.001458”Glennallen: latitude change = + 0.002074” longitude change = + 0.005000”Talkeetna: latitude change = - 0.000024” longitude change = + 0.002512”
All Shook Up | Worksheet Geodesy
24 oceanservice.noaa.gov oceanservice.noaa.gov 25
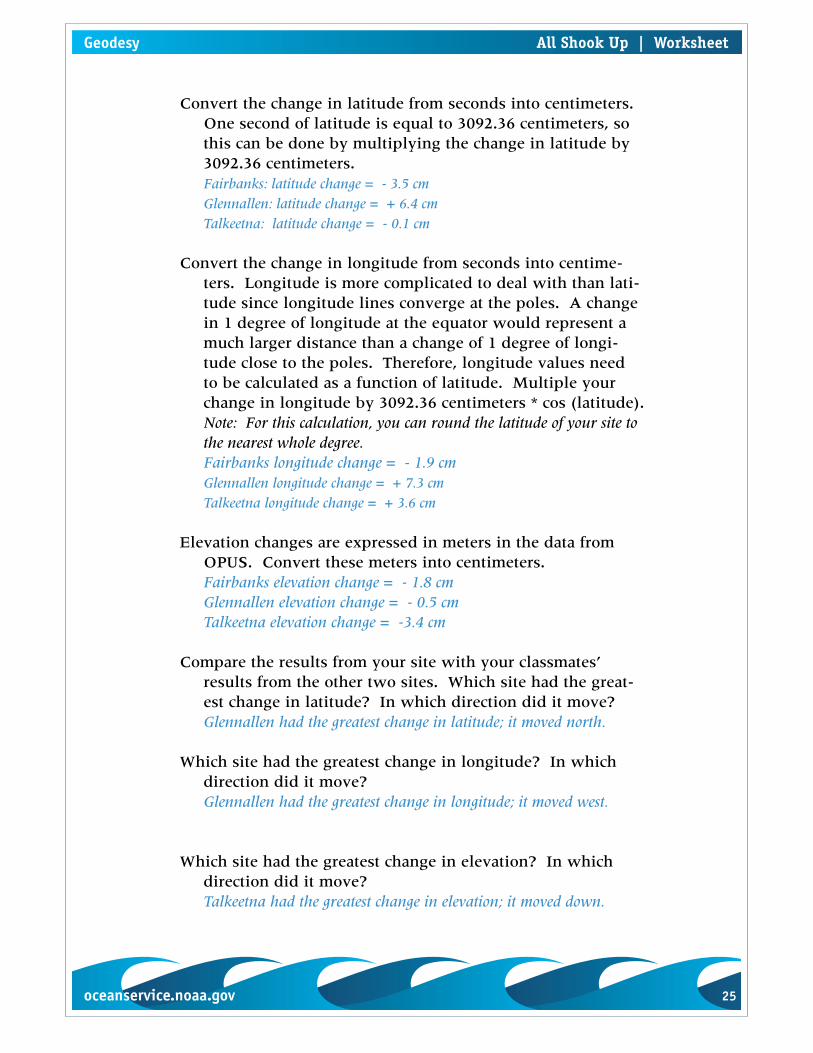
Convert the change in latitude from seconds into centimeters. One second of latitude is equal to 3092.36 centimeters, so this can be done by multiplying the change in latitude by 3092.36 centimeters.Fairbanks: latitude change = - 3.5 cm
Glennallen: latitude change = + 6.4 cm
Talkeetna: latitude change = - 0.1 cm
Convert the change in longitude from seconds into centime-ters. Longitude is more complicated to deal with than lati-tude since longitude lines converge at the poles. A change in 1 degree of longitude at the equator would represent a much larger distance than a change of 1 degree of longi-tude close to the poles. Therefore, longitude values need to be calculated as a function of latitude. Multiple your change in longitude by 3092.36 centimeters * cos (latitude). Note: For this calculation, you can round the latitude of your site to the nearest whole degree.Fairbanks longitude change = - 1.9 cmGlennallen longitude change = + 7.3 cm
Talkeetna longitude change = + 3.6 cm
Elevation changes are expressed in meters in the data from OPUS. Convert these meters into centimeters.Fairbanks elevation change = - 1.8 cmGlennallen elevation change = - 0.5 cmTalkeetna elevation change = -3.4 cm
Compare the results from your site with your classmates’ results from the other two sites. Which site had the great-est change in latitude? In which direction did it move?Glennallen had the greatest change in latitude; it moved north.
Which site had the greatest change in longitude? In which direction did it move?Glennallen had the greatest change in longitude; it moved west.
Which site had the greatest change in elevation? In which direction did it move?Talkeetna had the greatest change in elevation; it moved down.
Geodesy All Shook Up | Worksheet
26 oceanservice.noaa.gov oceanservice.noaa.gov 27
GEODESY LESSON PLAN
Geodesy Subject Review
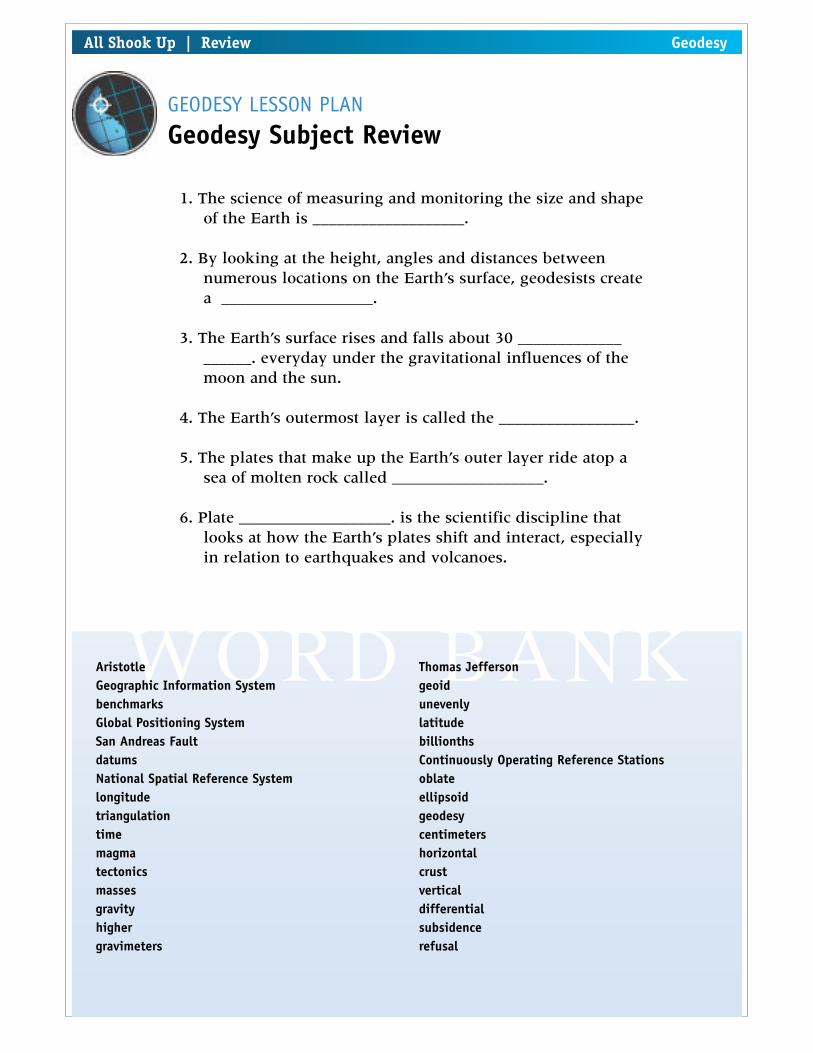
1. The science of measuring and monitoring the size and shape of the Earth is ___________________.
2. By looking at the height, angles and distances between numerous locations on the Earth’s surface, geodesists create a ___________________.
3. The Earth’s surface rises and falls about 30 ___________________. everyday under the gravitational influences of the moon and the sun.
4. The Earth’s outermost layer is called the _________________.
5. The plates that make up the Earth’s outer layer ride atop a sea of molten rock called ___________________.
6. Plate ___________________. is the scientific discipline that looks at how the Earth’s plates shift and interact, especially in relation to earthquakes and volcanoes.
WORD BANKAristotle Geographic Information SystembenchmarksGlobal Positioning SystemSan Andreas Fault datumsNational Spatial Reference Systemlongitudetriangulationtimemagmatectonicsmassesgravityhighergravimeters
Thomas Jefferson geoid unevenlylatitudebillionths Continuously Operating Reference Stations oblate ellipsoidgeodesy centimetershorizontal crust vertical differential subsidencerefusal
All Shook Up | Review Geodesy
26 oceanservice.noaa.gov oceanservice.noaa.gov 27
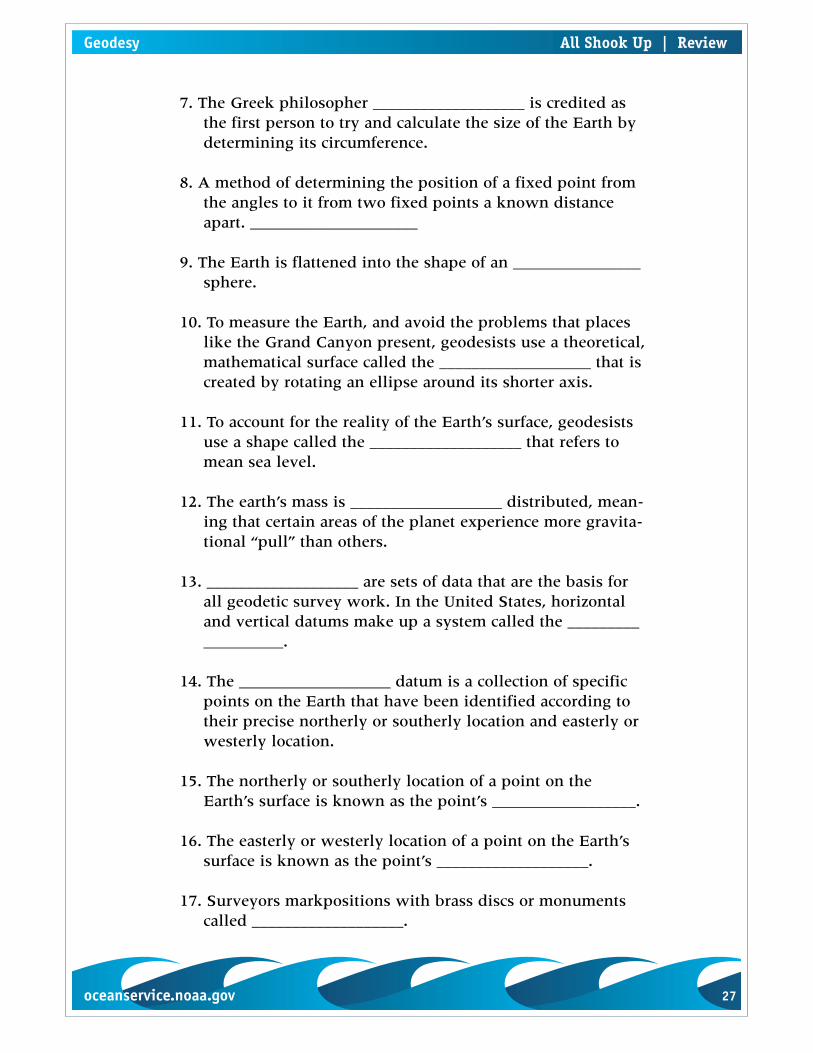
7. The Greek philosopher ___________________ is credited as the first person to try and calculate the size of the Earth by determining its circumference.
8. A method of determining the position of a fixed point from the angles to it from two fixed points a known distance apart. _____________________
9. The Earth is flattened into the shape of an ________________ sphere.
10. To measure the Earth, and avoid the problems that places like the Grand Canyon present, geodesists use a theoretical, mathematical surface called the ___________________ that is created by rotating an ellipse around its shorter axis.
11. To account for the reality of the Earth’s surface, geodesists use a shape called the ___________________ that refers to mean sea level.
12. The earth’s mass is ___________________ distributed, mean-ing that certain areas of the planet experience more gravita-tional “pull” than others.
13. ___________________ are sets of data that are the basis for all geodetic survey work. In the United States, horizontal and vertical datums make up a system called the ___________________.
14. The ___________________ datum is a collection of specific points on the Earth that have been identified according to their precise northerly or southerly location and easterly or westerly location.
15. The northerly or southerly location of a point on the Earth’s surface is known as the point’s __________________.
16. The easterly or westerly location of a point on the Earth’s surface is known as the point’s ___________________.
17. Surveyors markpositions with brass discs or monuments called ___________________.
Geodesy All Shook Up | Review
28 oceanservice.noaa.gov oceanservice.noaa.gov 29
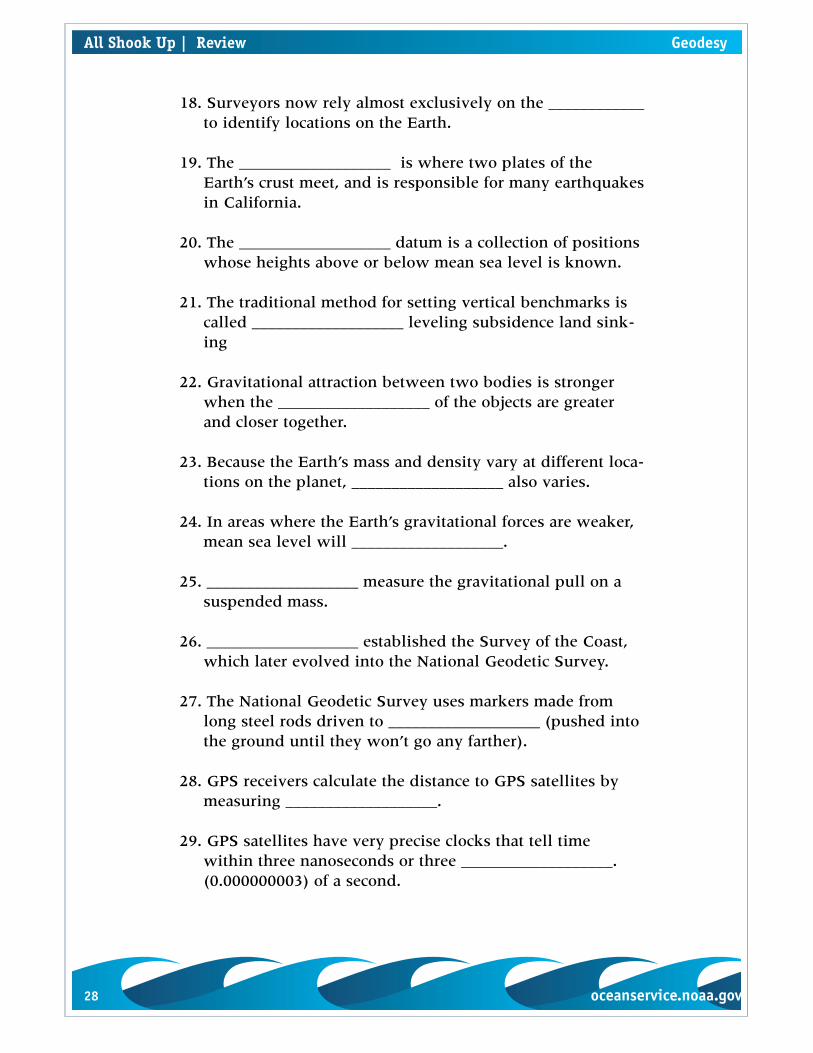
18. Surveyors now rely almost exclusively on the ____________ to identify locations on the Earth.
19. The ___________________ is where two plates of the Earth’s crust meet, and is responsible for many earthquakes in California.
20. The ___________________ datum is a collection of positions whose heights above or below mean sea level is known.
21. The traditional method for setting vertical benchmarks is called ___________________ leveling subsidence land sink-ing
22. Gravitational attraction between two bodies is stronger when the ___________________ of the objects are greater and closer together.
23. Because the Earth’s mass and density vary at different loca-tions on the planet, ___________________ also varies.
24. In areas where the Earth’s gravitational forces are weaker, mean sea level will ___________________.
25. ___________________ measure the gravitational pull on a suspended mass.
26. ___________________ established the Survey of the Coast, which later evolved into the National Geodetic Survey.
27. The National Geodetic Survey uses markers made from long steel rods driven to ___________________ (pushed into the ground until they won’t go any farther).
28. GPS receivers calculate the distance to GPS satellites by measuring ___________________.
29. GPS satellites have very precise clocks that tell time within three nanoseconds or three ___________________. (0.000000003) of a second.
All Shook Up | Review Geodesy

28 oceanservice.noaa.gov oceanservice.noaa.gov 29
30. ___________________ is a network of hundreds of station-ary permanently operating GPS receivers throughout the United States that can be used to accurately determine posi-tion.
31. In a ___________________, specific information about a place—such as the locations of utility lines, roads, streams, buildings, and even trees and animal populations—is lay-ered over a set of geodetic data.
Geodesy All Shook Up | Review
30 oceanservice.noaa.gov oceanservice.noaa.gov 31
GEODESY LESSON PLAN
Geodesy Subject Review: Crossword Puzzle1
4
5
11
14
17
20 21 22
29
32 33
24
28
31
23
25
27
26
30
9
6 7
181615
12 13
19
10
8
2 3
All Shook Up | Crossword Geodesy
30 oceanservice.noaa.gov oceanservice.noaa.gov 31
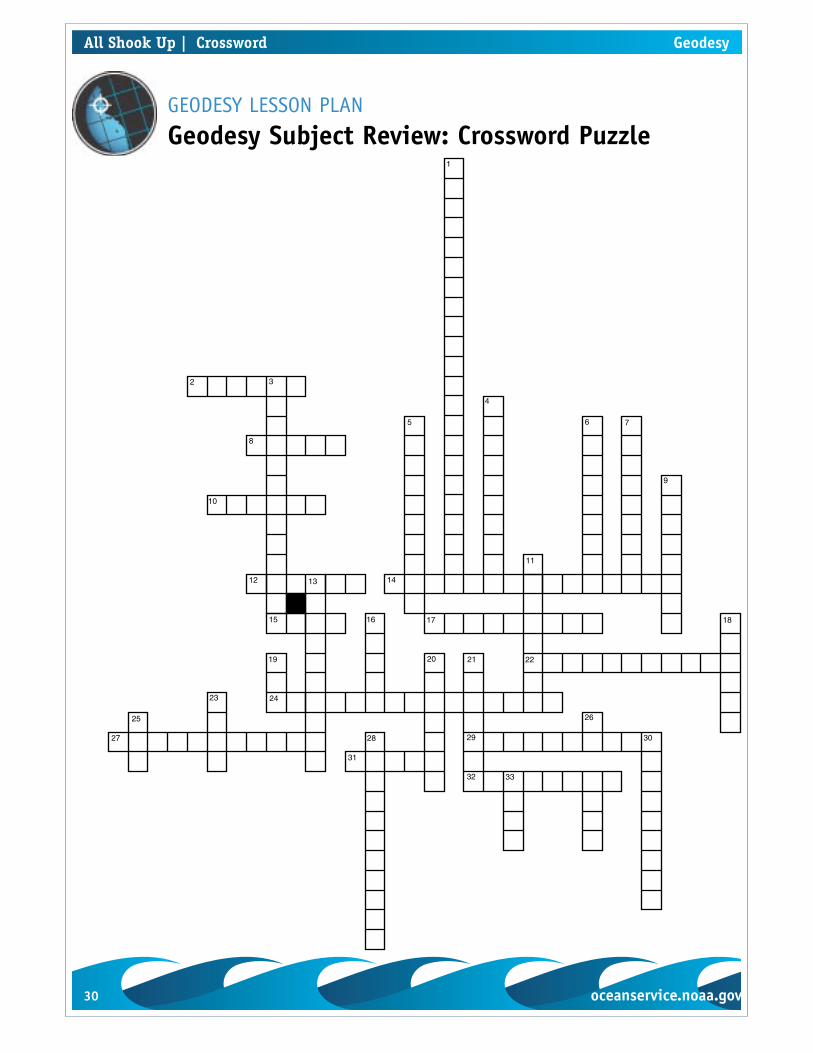
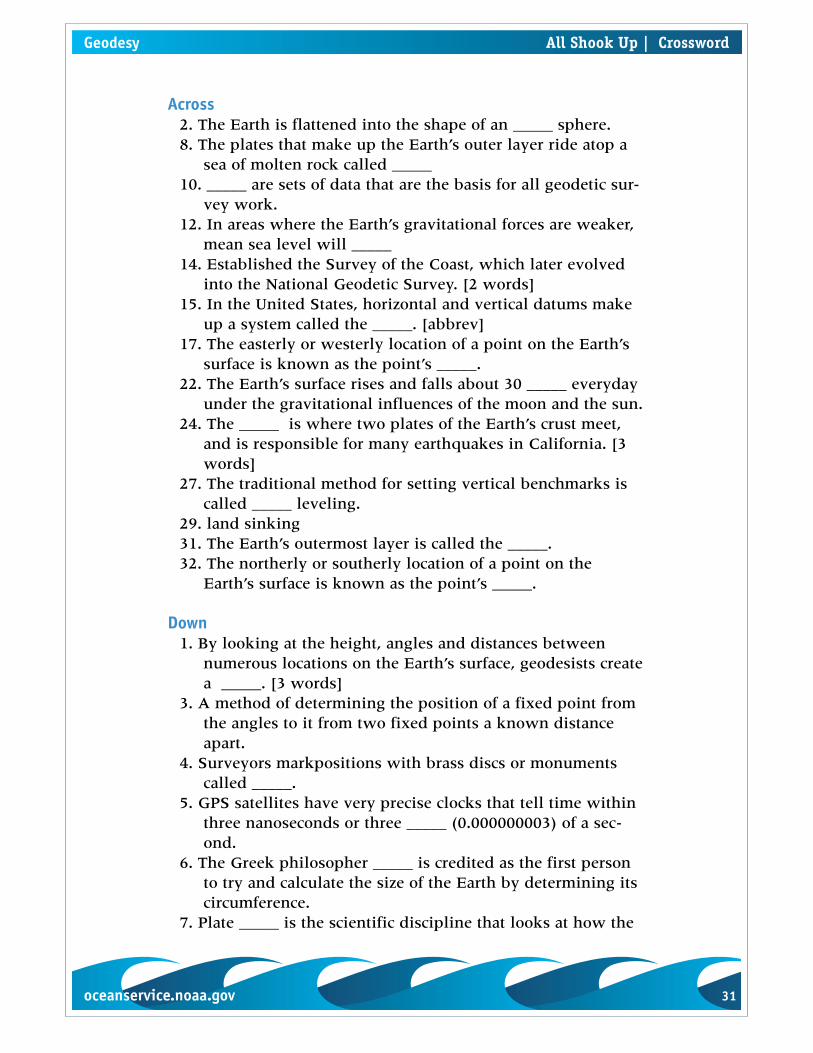
Across2. The Earth is flattened into the shape of an _____ sphere.8. The plates that make up the Earth’s outer layer ride atop a
sea of molten rock called _____10. _____ are sets of data that are the basis for all geodetic sur-
vey work.12. In areas where the Earth’s gravitational forces are weaker,
mean sea level will _____14. Established the Survey of the Coast, which later evolved
into the National Geodetic Survey. [2 words]15. In the United States, horizontal and vertical datums make
up a system called the _____. [abbrev]17. The easterly or westerly location of a point on the Earth’s
surface is known as the point’s _____.22. The Earth’s surface rises and falls about 30 _____ everyday
under the gravitational influences of the moon and the sun.24. The _____ is where two plates of the Earth’s crust meet,
and is responsible for many earthquakes in California. [3 words]
27. The traditional method for setting vertical benchmarks is called _____ leveling.
29. land sinking31. The Earth’s outermost layer is called the _____.32. The northerly or southerly location of a point on the
Earth’s surface is known as the point’s _____.
Down1. By looking at the height, angles and distances between
numerous locations on the Earth’s surface, geodesists create a _____. [3 words]
3. A method of determining the position of a fixed point from the angles to it from two fixed points a known distance apart.
4. Surveyors markpositions with brass discs or monuments called _____.
5. GPS satellites have very precise clocks that tell time within three nanoseconds or three _____ (0.000000003) of a sec-ond.
6. The Greek philosopher _____ is credited as the first person to try and calculate the size of the Earth by determining its circumference.
7. Plate _____ is the scientific discipline that looks at how the
Geodesy All Shook Up | Crossword
32 oceanservice.noaa.gov
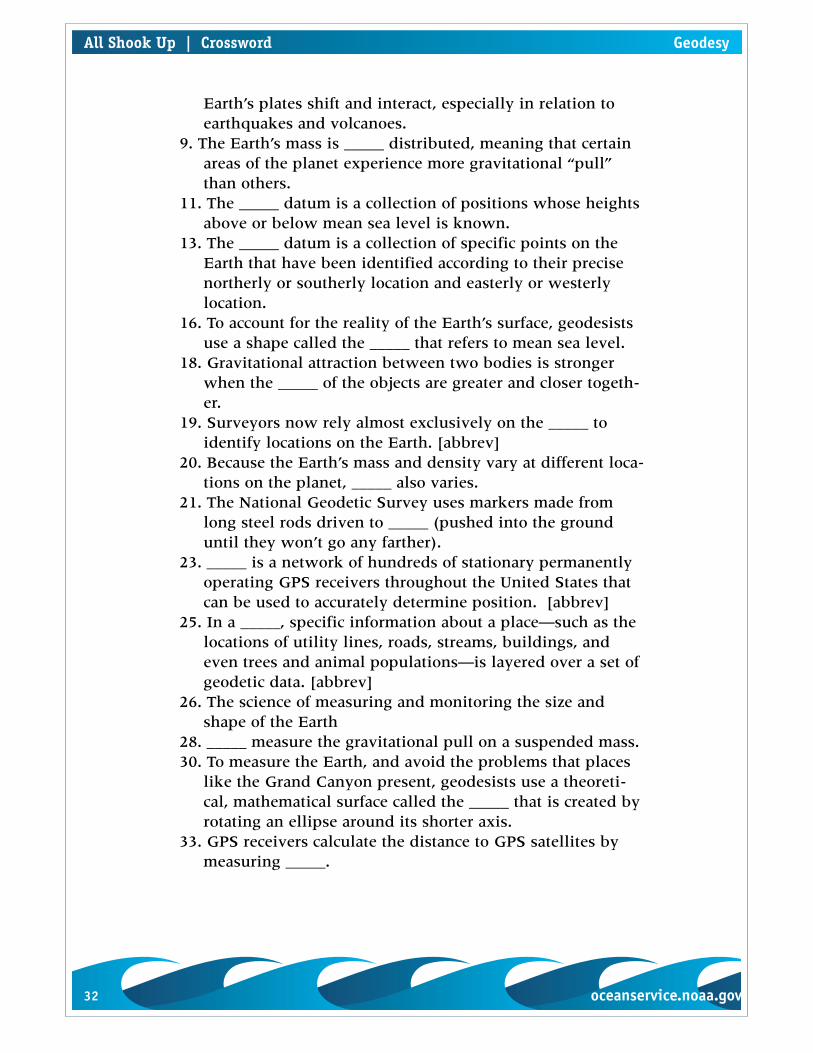
Earth’s plates shift and interact, especially in relation to earthquakes and volcanoes.
9. The Earth’s mass is _____ distributed, meaning that certain areas of the planet experience more gravitational “pull” than others.
11. The _____ datum is a collection of positions whose heights above or below mean sea level is known.
13. The _____ datum is a collection of specific points on the Earth that have been identified according to their precise northerly or southerly location and easterly or westerly location.
16. To account for the reality of the Earth’s surface, geodesists use a shape called the _____ that refers to mean sea level.
18. Gravitational attraction between two bodies is stronger when the _____ of the objects are greater and closer togeth-er.
19. Surveyors now rely almost exclusively on the _____ to identify locations on the Earth. [abbrev]
20. Because the Earth’s mass and density vary at different loca-tions on the planet, _____ also varies.
21. The National Geodetic Survey uses markers made from long steel rods driven to _____ (pushed into the ground until they won’t go any farther).
23. _____ is a network of hundreds of stationary permanently operating GPS receivers throughout the United States that can be used to accurately determine position. [abbrev]
25. In a _____, specific information about a place—such as the locations of utility lines, roads, streams, buildings, and even trees and animal populations—is layered over a set of geodetic data. [abbrev]
26. The science of measuring and monitoring the size and shape of the Earth
28. _____ measure the gravitational pull on a suspended mass.30. To measure the Earth, and avoid the problems that places
like the Grand Canyon present, geodesists use a theoreti-cal, mathematical surface called the _____ that is created by rotating an ellipse around its shorter axis.
33. GPS receivers calculate the distance to GPS satellites by measuring _____.
All Shook Up | Crossword Geodesy