geo task us-09-01a critical earth observation priorities · task us-09-01a: critical earth...
TRANSCRIPT
GEO Task US-09-01a Critical Earth Observation Priorities
Final Report • October 2010
The Task Lead for GEO Task US-09-01a is Lawrence FRIEDL (USA). The GEO User Interface Committee oversees the task. Ellsworth LEDREW (IEEE), Gary FOLEY (USA), and Hans-Peter PLAG (IAG) are Co-Leads on the task.
Battelle Memorial Institute prepared this report under contract to the NationalAeronautics and Space Administration, Washington, DC, USA; contract No. GS-23F-8167H.
Suggested citation for this report: Group on Earth Observations. Task US-09-01a: Critical Earth Observation Priorities. 2010. Available at <http://sbageotask.larc.nasa.gov>.
GEO US-09-01a Website:
http://sbageotask.larc.nasa.gov
Preface | 1
This document presents the results of GEO Task US-
09-01a. The task involved a multi-year meta-analysis
of existing documents that numerous countries and
organizations have produced regarding Earth observations
needs. GEO published a list of observations in the 10-Year
Implementation Plan, and this task report provides a set of
critical Earth observations common to many Societal Benefit
Areas (SBA). The Task Team used a “demand-side” approach
to identifying observation priorities, focusing on desired,
needed observations across a range of user types. The task
examined needs related to ground-based, in situ, airborne,
or space-based observations, including needs across all
geographic regions. The Task Team produced reports on
observation priorities for each individual SBA, reviewing over
1,700 documents in total. Then, the Task Team conducted
a meta-analysis across the SBA reports to produce this final
report on priority observations common to many SBAs.
This report describes the task’s process, prioritization
methods, and results. Since methods to identify and prioritize
needs have strengths and limitations, the Task Team used an
ensemble of methods in the Cross-SBA prioritization. This
report also provides lessons learned and makes specific
recommendations for future efforts to identify observation
priorities.
For each SBA, the task involved an ad hoc Advisory Group of
experts to review the SBA-specific prioritization methods, results
and report. The Advisory Groups involved over 160 people,
including representatives from 31 GEO Member Countries and
14 Participating Organizations. Some organizations, such as
CEOS, WMO, and former IGOS-P, supported several Advisory
Groups.
For some people, the list of priority observations may confirm
their expectations. For some, the list may identify new
observations or present unexpected prioritizations of known
observation needs. For others, a preferred observation may
not appear on the list or at the desired rank. Overall, the list
is not a judgment on any individual observation – it is simply a
reflection of the commonality of an observation need across
SBAs. Many observations of critical importance to a particular
SBA may not appear in the final cross-SBA list of observations
common to many SBAs.
The results are a starting point for GEO. The priority observations
are a baseline for further engagement with users on their needs.
In addition, the results can support numerous activities within
GEO. For example, the list can support an assessment of the
current and planned availability of the priority observations, the
presence of the observations in GEOSS registries, or possible
user-oriented investment opportunities.
Numerous people contributed to this task. On behalf of the Task
Team, I want to thank the SBA Analysts and the organizations
that sponsored them. I appreciate the contributions from
GEO Member Countries and Participating Organizations that
responded to requests for documents. The Advisory Group
members deserve special recognition for their service and
contributions. I want to thank Amy Jo Swanson, who served
as the Task Coordinator to keep the task organized. I am
especially indebted to Erica Zell and Adam Carpenter, who
managed the Cross-SBA analysis and developed this final
report. Finally, I want to thank my Task Co-Leads and the GEO
User Interface Committee for their contributions over the course
of Task US-09-01a. I welcome you to visit the task website for
more information: http://sbageotask.larc.nasa.gov.
Lawrence A. Friedl
Task Lead, GEO Task US-09-01a
Preface
2 | GEO Task US-09-01a
Table of Contents
Executive Summary
Chapter 1: Introduction
Chapter 2: Process and Methods
Chapter 3: SBA Summaries
Agriculture SBA
Agriculture SBA - Forests
Biodiversity SBA
Climate SBA
Disasters SBA
Ecosystems SBA
Energy SBA
Health SBA
4
10
12
15
16
18
20
24
26
28
30
34
Table of Contents | 3
Water SBA
Weather SBA
Chapter 4: Cross-SBA Analysis
Chapter 5: Findings
Chapter 6: Recommendations
Appendix A: Advisory Groups
Appendix B: GEO Secretariat Letter Regarding Task US-09-01a
Appendix C: Combined Set of SBAs’ Priority Observations (Alphabetical Order)
Appendix D: Combined Set of “15 Most Critical” Observations
Appendix E: Combined Set of SBAs’ Priority Observations (Priority Order)
Appendix F: List of Acronyms
38
40
42
50
54
56
68
69
71
72
76

4 | GEO Task US-09-01a
Executive Summary
The Group on Earth Observations (GEO) is an intergovernmen-tal organization working to improve the availability, access, and use of Earth observations to benefit society. GEO focuses on Earth observations for 9 areas of societal benefit (SBA): Agri-culture, Biodiversity, Climate, Disasters, Ecosystems, Energy, Health, Water, and Weather.
An activity under GEO, known as Task US-09-01a, examined users’ needs for Earth observations. The specific objective of Task US-09-01a was to establish and conduct a process to identify critical Earth observation priorities common to many of the GEO SBAs.
The Task Team approached the activity in two major phases. First, the team identified critical, priority observations for each SBA. Subsequently, the team conducted a meta-analysis across the individual SBA results, combining and prioritizing observations common to many SBAs. The GEO User Interface Committee provided oversight on Task US-09-01a.
The Task Team harvested information on observation needs expressed in existing, publicly-available documents, such as international reports, workshop summaries, conference pro-ceedings, and national- and regional-level reports. The team made concerted efforts to ensure international breadth in the documents, including materials and needs across geographic regions and representation from developing countries. In all, the Task Team assessed over 1,700 documents that contained relevant information on Earth observations for this task.
The task addressed all observation needs articulated in the documents – ground, airborne, in situ, and space-based ob-servations. The task included observed and derived observa-tion parameters as well as modeled products. The task fo-cused on the “demand” side of Earth observation needs – the observations desired and needed by users, independent of current availability or the specific sensor technology involved with producing them. Thus, the task sought to identify Earth observation needs across a full spectrum of user types asso-ciated with each SBA, such as resource managers, scientific researchers, and policy makers.
SBA Advisory Groups and AnalystsFor each SBA, an Analyst and an ad hoc Advisory Group con-ducted a 9-step process to identify priority observations and produce a report. The Analysts served as the main coordina-tors for the individual SBA activities, and the respective Advi-sory Groups aided in identifying documents, critiquing analytic methods, reviewing priority-setting criteria, assessing results, and reviewing reports.
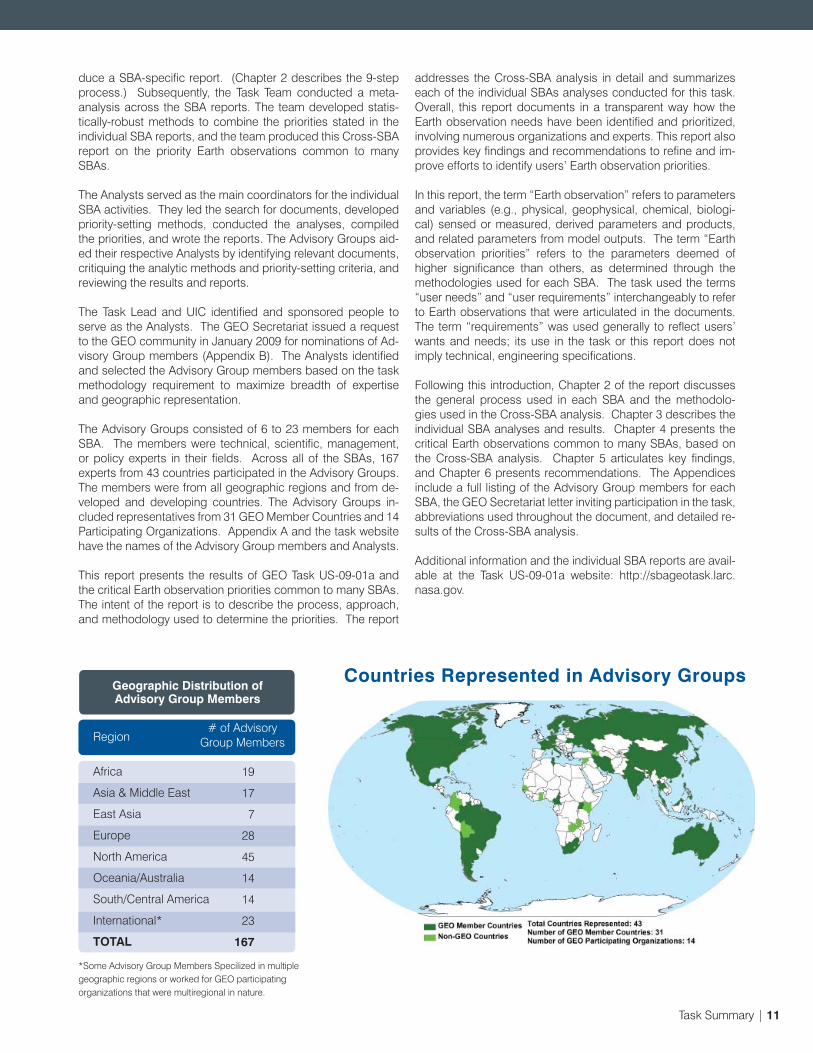
The Advisory Groups consisted of 6 to 23 members for each SBA. The members were technical, scientific, management, or policy experts in their fields. Across all of the SBAs, 167 experts from 43 countries participated in the Advisory Groups. The members were from all geographic regions and from de-veloped and developing countries. The Task Team encour-aged participation by the GEO Communities of Practice and former IGOS Themes in the Advisory Groups. The Advisory Groups included representatives from 31 GEO Member Coun-tries and 14 Participating Organizations.
Geographic Distribution of Advisory Group Members
Africa
Asia & Middle East
East Asia
Europe
North America
Oceania/Australia
South/Central America
International*
TOTAL
19
17
7
28
45
14
14
23
167
*Representing international organizations or multiple geographic regions
Region # of AdvisoryGroup Members

Executive Summary | 5
SBA Sub-Areas of Focus Examples of Priority Earth Observations
Agriculture Famine Early WarningAgriculture ProductionSeasonal/Annual Agriculture Forecasting and Risk
ReductionAquaculture Production
Vegetation Indices Crop Area Land Cover
Forests Sub-Report:Timber, Fuel, and Fiber ManagementForest Perturbations and ProtectionCarbon and Biomass
Afforestation/Deforestation Degradation Active Fires
Biodiversity Species LevelEcosystem Level
(The Biodiversity SBA report did not provide priority observations.)
Climate AtmosphereOceanLands
Lakes/Reservoir Levels Sea Surface Temperature Precipitation
Disasters EarthquakesFloods LandslidesTropical CyclonesVolcanic EruptionsWildfires
Elevation Surface Deformation Wind Properties
Ecosystems Coastal and Near-Shore Marine SystemsForestsInland/Fresh WaterOceanic Islands and ArchipelagosTundraWatersheds
Permafrost Conditions and Dynamics Vegetation Cover Soil Carbon
Energy HydropowerWind powerBioenergy (Including Transportation Biofuels)Solar PowerGeothermal Power
Water Run-off Wind Speed GHI
Health AeroallergensAir Quality Infectious Diseases
Population Density Precipitation Air Temperature
Water Surface WatersSub-Surface WatersForcings (on the Terrestrial Waters)Water Quality/Water Use
Precipitation Soil Moisture Evaporation
Weather Global Numerical Weather PredictionRegional Numerical Weather PredictionSynoptic MeteorologyNowcasting and Very Short Range ForecastingSeasonal and Inter-annual ForecastsAeronautical MeteorologyAtmospheric ChemistryOcean ApplicationsAgricultural MeteorologyHydrology
3D Humidity Field 3D Temperature Field Cloud Cover
Individual SBA AnalysesThe Analysts and Advisory Groups determined the scope of their respective SBA analysis, especially the sub-areas to ad-dress. They referred to the GEO 10-Year Implementation Plan for a description and summary of topics within each SBA. This table above lists the sub-areas addressed in each SBA and provides examples of priority observations for each SBA. The Analysts developed prioritization methods and criteria, in coor-dination with their respective Advisory Group. The prioritization methods involved a combination of quantitative and qualitative approaches, such as bibliometric analysis, weighted frequency analysis, and cross-cutting applicability within the SBA. Some Analysts incorporated SBA-specific metrics into their criteria.
The number of critical Earth observations for each SBA aver-aged 43 and ranged from 15 to 77. The Task Team allowed the number per SBA to vary to allow for the inherent differences in users’ needs among the SBAs. The Task Team also collected each SBA’s “15 Most Critical” observations. (Note: The Biodi-versity SBA did not produce a list of priority Earth observations. Thus, the meta-analysis across the SBAs involved observations from only 8 SBAs.) The combination of the individual SBA ob-servation priorities produced a set of 146 unique observations. The combination of the SBAs’ “15 Most Critical” observations lists produced a set of 97 unique observations.
Sub-Areas Addressed in Each SBA
6 | GEO Task US-09-01a
Cross-SBA Analysis: Ensemble of 4 Prioritization Methods
The Task Team conducted a meta-analysis across the results of the individual SBAs and the set of 146 observations, using a statistically robust technique for the Cross-SBA analysis. The Cross-SBA technique involved an ensemble of 4 prioritization methods to rank the Earth observation priorities. The results of the 4 prioritization methods are as follows:
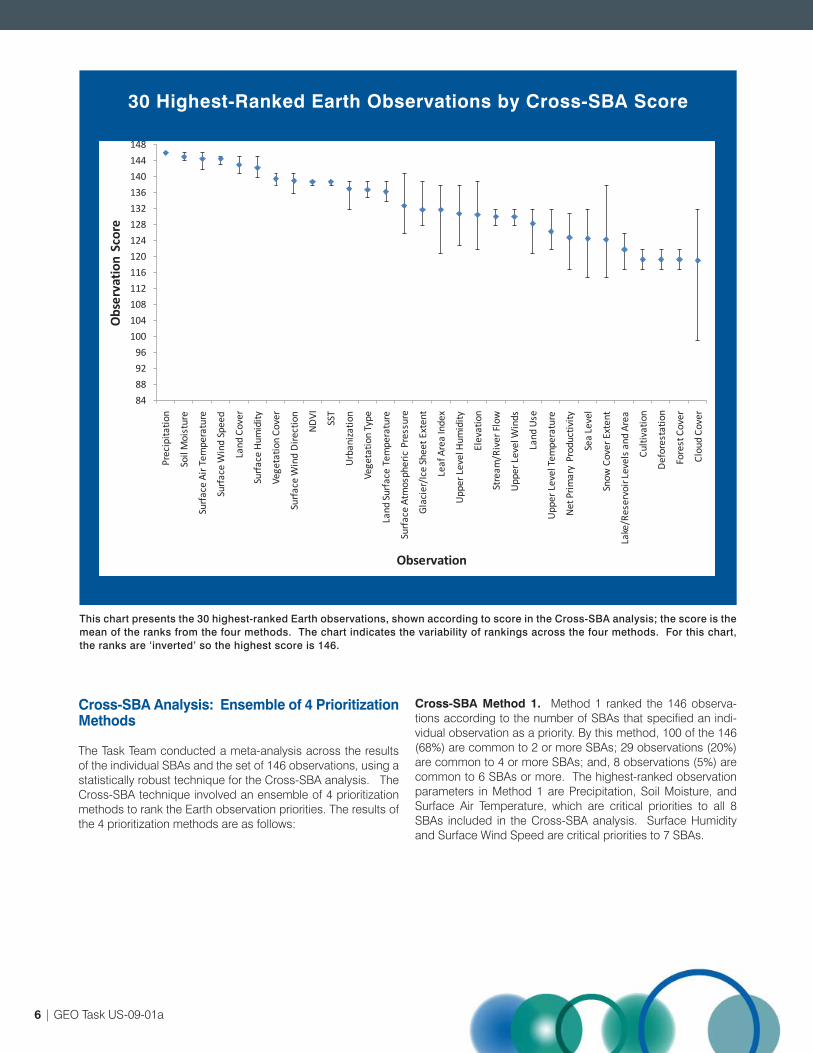
Cross-SBA Method 1. Method 1 ranked the 146 observa-tions according to the number of SBAs that specified an indi-vidual observation as a priority. By this method, 100 of the 146 (68%) are common to 2 or more SBAs; 29 observations (20%) are common to 4 or more SBAs; and, 8 observations (5%) are common to 6 SBAs or more. The highest-ranked observation parameters in Method 1 are Precipitation, Soil Moisture, and Surface Air Temperature, which are critical priorities to all 8 SBAs included in the Cross-SBA analysis. Surface Humidity and Surface Wind Speed are critical priorities to 7 SBAs.
30 Highest-Ranked Earth Observations by Cross-SBA Score
This chart presents the 30 highest-ranked Earth observations, shown according to score in the Cross-SBA analysis; the score is the mean of the ranks from the four methods. The chart indicates the variability of rankings across the four methods. For this chart, the ranks are ‘inverted’ so the highest score is 146.
84
88
92
96
100
104
108
112
116
120
124
128
132
136
140
144
148
Prec
ipita
tion
Soil
Moi
stur
e
Surf
ace
Air T
empe
ratu
re
Surf
ace
Win
d Sp
eed
Land
Cov
er
Surf
ace
Hum
idity
Vege
tatio
n Co
ver
Surf
ace
Win
d D
irect
ion
ND
VI
SST
Urb
aniz
atio
n
Vege
tatio
n Ty
pe
Land
Sur
face
Tem
pera
ture
Surf
ace
Atm
osph
eric
Pre
ssur
e
Gla
cier
/Ice
She
et E
xten
t
Leaf
Are
a In
dex
Upp
er L
evel
Hum
idity
Elev
atio
n
Stre
am/R
iver
Flo
w
Upp
er L
evel
Win
ds
Land
Use
Upp
er L
evel
Tem
pera
ture
Net
Prim
ary
Prod
uctiv
ity
Sea
Leve
l
Snow
Cov
er E
xten
t
Lake
/Res
ervo
ir Le
vels
and
Are
a
Culti
vatio
n
Def
ores
tatio
n
Fore
st C
over
Clou
d Co
ver
Obs
erva
tion
Scor
e
Observation

Executive Summary | 7
Precipitation
Soil Moisture
Surface Air Temperature
Surface Wind Speed
Land Cover
Surface Humidity
Vegetation Cover
Surface Wind Direction
Normalized Difference Vegetation Index
Urbanization
Vegetation Type
Land Surface Temperature
Surface Atmospheric Pressure
Leaf Area Index
Glacier/Ice Sheet Extent
Upper Level Humidity
Elevation
Upper Level Winds
Land Use
Upper Level Temperature
Net Primary Productivity
Sea Level
Snow Cover Extent
Ag
ricu
lture
Clim
ate
Dis
aste
rs
Eco
syst
ems
Ene
rgy
Hea
lth
Wat
er
Wea
ther
EarthObservation Parameter
GEO Societal Benefits Areas*
Sea Surface Temperature
River Flow Observations
Cross-SBA Method 2. Method 2 ranked the 146 observa-tions according to a weighted tally of the number of SBAs that specified a given observation as a priority, taking into account the observation’s relative importance in that SBA. The respec-tive SBA Analyst assigned a designation of High, Medium, or Low to each observation; these designations corresponded to numerical weightings of 3, 2, and 1, respectively, for the pur-pose of ranking. Total scores could range from 1 to 24. By this method, 12 observation parameters (8% of 146) received a score of 12 or above. Precipitation is the highest-ranked ob-servation parameter in Method 2; it received the highest pos-sible score of 24. The next 3 highest-ranked observation pa-rameters – Surface Air Temperature, Soil Moisture, and Surface Wind Speed – received a score of 18.
Cross-SBA Method 3. Method 3 ranked the 146 observa-tions according to a weighted tally of the number of SBAs that specify a given observation as a priority, giving extra weight to observations of High priority. The respective SBA Analyst as-signed a designation of High, Medium, or Low to each obser-vation; these designations corresponded to numerical weight-ings of 6, 3, and 1 respectively. Total scores could range from 1 to 48. By this method, 10 observations (7% of 146) received a score of 24 or above. Precipitation was the highest-ranked observation parameter; it received the highest possible score of 48. The next 4 highest-ranked observation parameters – Surface Wind Speed, Land Cover, Soil Moisture, and Surface Air Temperature – received scores of 31-33.
Cross-SBA Method 4. Method 4 focused on the 97 observa-tions from the combined SBA “15 Most Critical” observations lists, ranking them according to the number of SBAs that speci-fied an individual observation. Effectively, this method stan-dardized each SBA’s contribution in the prioritization. By this method, 58 of the 97 observations (60%) are critical priorities to 2 or more SBAs; 15 observations (15%) are common to 4 SBAs or more; and, 6 observations (6%) are common to 6 or more SBAs. The highest-ranked observation parameter is Pre-cipitation, which is on the “15 Most Critical” observations lists for all 8 SBAs included in the Cross-SBA analysis. Surface Air Temperature, Surface Humidity, Surface Wind Speed, Soil Moisture, and Land Cover are on the “15 Most Critical” obser-vations lists for 6 SBAs. Critical Earth Observation Priorities Common to Many SBAsThe ensemble approach produced a mean score for each ob-servation parameter and a corresponding range of rankings, which accounts for the variability in ranks from the 4 methods. The Task Team ordered the final set of Earth observations based on these scores and the variability, producing an overall ranking of the 146 critical Earth observation parameters.
The chart on the facing page shows the scores and associated variability of the 30 highest-ranked Earth observations from the ensemble technique. In general, the observation parameters with the highest rankings reflect lower variability among the en-semble methods than observations of lower rank. This result suggests that there was general agreement among Methods 1-4 as to the highest-ranked observation priorities, which in-clude Precipitation, Soil Moisture, Surface Air Temperature, Surface Wind Speed, and Land Cover.
25 Highest-Ranked Earth Observations and Associated SBAs
This table presents the 25 highest-ranked Earth observations, listed according to the score in the Cross-SBA analysis. The table indicates the corresponding SBAs that identified the observation as a priority in Method 1. This table conveys both the priority and commonality of the observations to many SBAs.
the observation was included in the SBA's set of priorities
the observation was not included in the SBA's set of priorities
*The Biodiversity SBA did not produce a list of priority Earth observations. Thus, the Cross-SBA analysis involved observations from only 8 SBAs.
8 | GEO Task US-09-01a
The Task Team used the results of the Cross-SBA ensemble approach to assess the specific SBAs that considered each observation a priority. The table on the previous page pres-ents the 25 highest-ranked observations, conveying both the priority and commonality of the observations to many SBAs. In the final list of critical Earth observations from the Cross-SBA list, 50 observations are common to 3 or more SBAs. Task US-09-01a focused on the commonality of priority ob-servations to many SBAs. Thus, some observations of critical importance to an individual SBA may not appear in the final Cross-SBA list of observations. The results do not imply an objective importance of any individual observation but rather a reflection of the commonality in need across SBAs.
Use of the ResultsThese results and overall list of priority Earth observations can support numerous activities within GEO. Possible activities include: An assessment of the availability of data from these observations – both current and planned; a review of the ob-servations in the GEO 10-Year Implementation Plan; and, an assessment of the availability of the observations in GEOSS registries. Overall, the results can support GEO members’ efforts to determine investment opportunities to serve users.
Findings The task and the results represent a significant undertaking to analyze priority observation needs across all the SBAs, involv-ing numerous organizations and experts. The results of the Cross-SBA analysis and individual SBAs provide a baseline for further engagement with users on their needs, especially as new needs develop and users’ priorities evolve.
Precipitation Reigned the Cross-SBA Analysis Precipitation was the highest-ranked observation; specific precipitation observation needs vary across the SBAs.
Methods Showed Agreement at Highest-Rankings Observations with the highest mean scores generally reflect lower variability than those of lower rank.
Task’s Approach Produced Users’ Needs in Users’ Terminology The user-based approach generated a rich array of observa-tions needs, though needs were often expressed as phenom-ena of interest rather than technical specifications.
Availability of Documents by Region VariedSome regions were better represented than others in docu-ments identified and reviewed, despite all the efforts to ensure international breadth.
Task’s Approach Achieved Desired Diversity in Prioritization Methods in the SBAsThe task generated a variety of analytic methods and priority-setting criteria across the SBAs.
Variety in Analysts’ Approaches Introduced ComplexitiesAnalysts varied in the ways they reported their SBA’s priorities, presenting challenges the Task Team had to address prior to the Cross-SBA analysis.
Advisory Groups Played Valuable Yet Variable RolesAdvisory Groups were very important for reviewing methods, criteria, and results. However, Advisory Group members varied considerably in their level of involvement and commitment. RecommendationsThe following is a sub-set of the recommendations from the US-09-01a Task Team. The recommendations address activi-ties to pursue based on the results and refinements to the pro-cess used to identify Earth observation priorities.
Gather information and engage users on specific observation parameter characteristics for the priority Earth observations, especially PrecipitationThe results can support engagement, especially by the UIC, with users across relevant SBAs to gather information on observation parameter characteristics and specific uses of the priority observations.
Conduct an assessment of the current and planned availability of the priority Earth observations A follow-on analysis of the current and planned availability can highlight key gaps where users’ needs are under-served and opportunities to enhance societal benefits.
Consider additional analytic methods to gathering users’ needs and pursue an ensemble of approachesAdditional, valid approaches for assessing users’ needs and establishing priorities can build on and enhance the document-based approach used in the task.
Prescribe the prioritization methods, SBA sub-areas, and other aspects of the SBA analysesSpecifying the methods, sub-areas, and required deliverables can promote enhanced consistency and augment the Cross-SBA analysis.
Continue the use of ad hoc Advisory Groups, with refinements Efforts to improve communications and participation of the Advisory Group members can enhance their commitment, involvement, and valuable contributions.

Executive Summary | 9

10 | GEO Task US-09-01a
Chapter 1: Introduction
The Group on Earth Observations is an intergovernmental organization working to improve the availability, access, and use of Earth observations to benefit society. GEO is coordinat-ing efforts to establish a Global Earth Observation System of Systems (GEOSS). GEOSS builds on national, regional, and international observation systems to provide coordinated Earth observations from thousands of ground, airborne, in situ, and space-based instruments. GEOSS implementation is focused on 9 areas of societal benefit, listed below.
GEO formed Task US-09-01a to assess users’ critical Earth observation priorities common to many of the GEO SBAs, and to establish a process for such assessment. The Task Team managed the task with oversight from the GEO User Interface Committee (UIC). In addition to critical observations for the individual SBAs, the primary result of this task is a set of Earth observation priorities common to many SBAs – from a user’s perspective and based on users’ needs.
The results can support numerous activities within GEO, such as a review of observations in the GEO 10-Year Implementation Plan and an assessment of the availability of Earth observa-tions relative to the users’ priorities. Overall, the results can support GEO members’ efforts to determine investment op-portunities to serve users.
Many countries and organizations have published reports, conducted workshops, and produced documents that specify Earth observation needs. Practitioners and researchers have also identified and recommended key Earth observation needs
Agriculture
Biodiversity
Climate
Disasters
Ecosystems
Energy
Health
Water
Weather
GEO Societal Benefit Areas
in publications and peer-reviewed literature. Task US-09-01a harvested information on observation needs expressed in exist-ing, publicly-available documents, and it analyzed across the materials to determine the priorities. The Task Team made con-certed efforts to ensure international breadth in the documents, including materials and needs across geographic regions and representation from developing countries.
The task addressed all observation needs articulated in the documents – ground, airborne, in situ, and space-based observations. The task focused on observed and derived pa-rameters as well as modeled products. The task sought to identify Earth observation needs across a full spectrum of user types associated with each SBA, such as resource managers, scientific researchers, and policy makers.
The task focused on the “demand” side of Earth observation needs. The Task Team concentrated on the observations de-sired and needed by users, independent of current availability or the specific collection method and sensor technology in-volved with producing the observations. The purpose of this approach was to focus on users’ wants and desires, allowing maximum flexibility in how to satisfy users’ needs. Hence, the observation parameters discussed in this report are phenom-ena of interest to users rather than specifications of technology-based measurements.
For each SBA, an Analyst and an ad hoc Advisory Group con-ducted a 9-step process to identify and analyze documents, develop priority-setting criteria, determine priorities, and pro-
Task Summary | 11
duce a SBA-specific report. (Chapter 2 describes the 9-step process.) Subsequently, the Task Team conducted a meta-analysis across the SBA reports. The team developed statis-tically-robust methods to combine the priorities stated in the individual SBA reports, and the team produced this Cross-SBA report on the priority Earth observations common to many SBAs.
The Analysts served as the main coordinators for the individual SBA activities. They led the search for documents, developed priority-setting methods, conducted the analyses, compiled the priorities, and wrote the reports. The Advisory Groups aid-ed their respective Analysts by identifying relevant documents, critiquing the analytic methods and priority-setting criteria, and reviewing the results and reports.
The Task Lead and UIC identified and sponsored people to serve as the Analysts. The GEO Secretariat issued a request to the GEO community in January 2009 for nominations of Ad-visory Group members (Appendix B). The Analysts identified and selected the Advisory Group members based on the task methodology requirement to maximize breadth of expertise and geographic representation.
The Advisory Groups consisted of 6 to 23 members for each SBA. The members were technical, scientific, management, or policy experts in their fields. Across all of the SBAs, 167 experts from 43 countries participated in the Advisory Groups. The members were from all geographic regions and from de-veloped and developing countries. The Advisory Groups in-cluded representatives from 31 GEO Member Countries and 14 Participating Organizations. Appendix A and the task website have the names of the Advisory Group members and Analysts.
This report presents the results of GEO Task US-09-01a and the critical Earth observation priorities common to many SBAs. The intent of the report is to describe the process, approach, and methodology used to determine the priorities. The report
addresses the Cross-SBA analysis in detail and summarizes each of the individual SBAs analyses conducted for this task. Overall, this report documents in a transparent way how the Earth observation needs have been identified and prioritized, involving numerous organizations and experts. This report also provides key findings and recommendations to refine and im-prove efforts to identify users’ Earth observation priorities.
In this report, the term “Earth observation” refers to parameters and variables (e.g., physical, geophysical, chemical, biologi-cal) sensed or measured, derived parameters and products, and related parameters from model outputs. The term “Earth observation priorities” refers to the parameters deemed of higher significance than others, as determined through the methodologies used for each SBA. The task used the terms “user needs” and “user requirements” interchangeably to refer to Earth observations that were articulated in the documents. The term “requirements” was used generally to reflect users’ wants and needs; its use in the task or this report does not imply technical, engineering specifications.
Following this introduction, Chapter 2 of the report discusses the general process used in each SBA and the methodolo-gies used in the Cross-SBA analysis. Chapter 3 describes the individual SBA analyses and results. Chapter 4 presents the critical Earth observations common to many SBAs, based on the Cross-SBA analysis. Chapter 5 articulates key findings, and Chapter 6 presents recommendations. The Appendices include a full listing of the Advisory Group members for each SBA, the GEO Secretariat letter inviting participation in the task, abbreviations used throughout the document, and detailed re-sults of the Cross-SBA analysis.
Additional information and the individual SBA reports are avail-able at the Task US-09-01a website: http://sbageotask.larc.nasa.gov.
Countries Represented in Advisory Groups
Africa
Asia & Middle East
East Asia
Europe
North America
Oceania/Australia
South/Central America
International*
TOTAL
19
17
7
28
45
14
14
23
167
*Some Advisory Group Members Specilized in multiple geographic regions or worked for GEO participating organizations that were multiregional in nature.
Geographic Distribution of Advisory Group Members
Region# of Advisory
Group Members

12 | GEO Task US-09-01a
The process for identifying priority Earth observations in the task involved 2 major phases. First, the Task Team identified critical, priority observations for each SBA. Subsequently, the Task Team conducted a meta-analysis across the individual SBA results, combining and prioritizing observations common to many SBAs.
Individual SBA AnalysesThe Task Lead and GEO UIC developed and refined a 9-step process for identifying the critical Earth observation priorities within an SBA. The Task Lead and GEO UIC vetted this pro-cess with the GEO Secretariat and communicated it broadly with GEO Committees and Communities of Practice. The 9-step process involved identifying existing documents, de-veloping analytic methods, establishing priority-setting crite-ria, analyzing the documents, determining priorities, reviewing results, and preparing the SBA report. While the process lists the steps serially, some of the steps were carried out in parallel and some required iteration. The 9 steps are summarized be-low. The task website has detailed information on the process.
Chapter 2: Process and Methods
The process balanced the need for consistency among the SBAs with the need for flexibility in regard to individual SBAs. The Task Team allowed each Analyst and Advisory Group some flexibility to tailor the process to the specific aspects of the SBA, such as by developing priority-setting criteria unique to the SBA. Because each SBA Analyst implemented the steps slightly differently, some reports present final parameters in a ranked or tiered order while other reports present an unordered set of priority observations.
Each Analyst worked with the Advisory Group to determine the scope of each SBA analysis, especially the sub-areas to ad-dress. The Analysts referred to the GEO 10-Year Implementa-tion Plan for a description and summary of topics within each SBA. In general, the Analyst and Advisory Group selected sub-areas to represent either logical sub-topics within their SBA (e.g., types of disasters for the Disasters SBA) or different topics on which users may focus (e.g., famine early warning within the Agriculture SBA). The Analysts also worked with and discussed the analytic methods, priority-setting criteria, and re-sults with their Advisory Group for concurrence.
Overview of Documents
The Task Team encouraged the Analysts to identify Earth ob-servation needs across a full spectrum of user types, such as scientific researchers, resource managers, and policy makers. To achieve this goal, the Analysts sought to identify as many publicly available documents as possible for consideration in the priority setting analyses. The Analysts performed literature searches and requested document references and recommen-dations from their Advisory Groups. The GEO Secretariat is-sued a letter to the GEO community in January 2009 to request “submissions or suggestions for documents, reports, work-shop summaries, etc. that address Earth observation priori-ties for any and all of the Societal Benefit Areas” (Appendix B). The Task Team established a Task email address and website to support the provision of documents. Some GEO Member Countries and Participating Organizations provided documents or suggestions of documents.
Step 1: Identify Advisory Groups and Analysts for each SBA.
Step 2: Determine scope of topics for the current priority-setting activity.
Step 3: Identify existing documents regarding observa-tion priorities for the SBA.
Step 4: Develop analytic methods and priority-setting criteria.
Step 5: Review and analyze documents for priority Earth observations needs.
Step 6: Develop a preliminary report on the priorities.Step 7: Gather feedback on the preliminary report.Step 8: Perform any additional analysis.Step 9: Complete the report on Earth observations for
the SBA.
General Process to Identify Critical Earth Observation Priorities for Each SBA
Process and Methods | 13
The types of documents identified by the Task Team included international, regional, and national-level reports, workshop and conference proceedings, summaries and presentations, peer-reviewed journal articles, and other published documents. A special section in Chapter 3 provides more information about the types of documents used in the task, including examples from the Disasters SBA analysis.
Analysts thoroughly reviewed relevant documents and harvest-ed the appropriate data for the priority setting analyses. In all, the Task Team identified over 1,700 documents that contained relevant information on Earth observations for this task.
Prioritization Methods
As the Analysts identified relevant documents for their indi-vidual SBAs, they developed prioritization methods and crite-ria, in coordination with their respective Advisory Groups. The prioritization methods involved a combination of quantitative and qualitative approaches. The Analysts utilized one or more prioritization methods, such as frequency analysis, bibliometric analysis, weighted frequency analysis, Advisory Group input, weighting based on document type, and cross-cutting applica-bility within the SBA. Some Analysts incorporated SBA-specific metrics into the priority-setting criteria. For example, a Hu-man Health SBA Analyst used the Disability-Adjusted Life Year (DALY) metric to prioritize observations that support decision-making related to diseases.
Based on these methods, the Analysts developed a list of critical Earth observation priorities for each SBA. The number of critical Earth observations for each SBA averaged 43; the range of observations per SBA was 15 to 77. The Task Team did not constrain the Analysts to designate a consistent num-ber of priority observations for all of the SBAs in order to allow for the inherent differences in users’ needs among the SBAs. The Task Team did collect each SBA’s list of “15 Most Critical” observations.
Cross-SBA AnalysisThe Task Team conducted a meta-analysis across the results of the individual SBAs. The Task Team combined the priori-ties across all of the SBAs and developed a statistically robust technique for the Cross-SBA analysis. The Cross-SBA tech-nique utilized 4 prioritization methods to rank Earth observa-tion priorities. This ensemble approach represents a sensitivity analysis, reflecting variability in rankings across the individual prioritization methods.
Method 1: Unweighted Tally of All PrioritiesMethod 1 involved a tally of the number of SBAs that identified a given observation as a priority. This method did not assign any importance or weighting to each observation. The Task Team ordered the parameters according to the number of SBAs that specified each individual observation. The highest-ranked pa-rameters by Method 1 are simply those that are priorities to the largest number of SBAs. All observations required by the same number of SBAs are considered of equal rank.
The total number of observations included in Method 1 was based on the summation of critical Earth observation priorities identified in the individual SBA reports. The Task Team did not impose a limit on the number of observations to include in this method, and the number of observations per SBA varied. The Task Team did combine similar observations parameters to overcome differences in end user terminology.
Method 2: Weighted Tally of All Priorities; Even Spread Across ObservationsMethod 2 involved a weighted tally of the number of SBAs that specified a given observation as a priority, taking into ac-count the observation’s relative importance in that SBA. This method used a weighting scheme based on a designation of High, Medium, or Low assigned to each observation. The re-spective SBA Analysts assigned a designation to each priority observation from their individual SBA based on information in their report and their work with the Advisory Groups. Note: This approach assumes that the High/Medium/Low ratings are relative terms, so observations deemed as Low priorities in this method may still be critically important for many end users.
The High, Medium, and Low designations corresponded to nu-merical weightings of 3, 2, and 1 for the purposes of ranking. The Task Team ordered the observations according to the total score, which ranged from 1 to 24. The highest possible score was 24 (8 SBAs ranking an observation High/3), and the lowest possible score was 1 (1 SBA ranking an observation Low/1). With these weightings, an observation rated Low by 6 SBAs would have the same score as an observation rated High by 2 SBAs; both would have a score of 6.
Method 2 included the same number of observations as in Methods 1 and 3.
Method 3: Weighted Tally of All Priorities; Extra Weight to High Priority ObservationsMethod 3 involved a weighted tally of the number of SBAs that specified a given observation as a priority, taking into account the observation’s relative importance in that SBA. This method used a weighting scheme based on a designation of High, Me-dium, or Low assigned to each observation. The respective SBA Analysts assigned a designation to each priority observa-tion from their individual SBAs based on information in their report and their work with the Advisory Groups.
In Method 3, the designations corresponded to numerical weightings of 6, 3, and 1, which gives slightly greater weight to observations of High priority. The total scores range from 1 to 48. The highest possible score was 48 (8 SBAs ranking an observation High/6), and the lowest possible score was 1 (1 SBA ranking an observation Low/1). With these weightings, an observation rated Medium by 4 SBAs would have the same score as an observation rated High by 2 SBAs; both would have a score of 12.

14 | GEO Task US-09-01a
Method 3 included the same number of observations as in Methods 1 and 2.
Method 4: Tally of the SBAs’ “15 Most Critical” ObservationsMethod 4 involved an unweighted tally of the “15 Most Criti-cal” Earth observations for each SBA. For this method, the respective SBA Analysts specified the “15 Most Critical” ob-servations based on information in their report, their work with the Advisory Groups, and knowledge gained over the task. This method did not assign any importance or weighting to the observations provided in each SBA’s list. The Task Team ordered the parameters according to the number of SBAs that specified each individual observation as among the “15 Most Critical.” The “15 Most Critical” lists are provided in Chapter 3 for the SBAs.
The total number of observations included in Method 4 was based on the summation of individual “15 Most Critical” lists. By limiting the priority observations designated for each SBA to an equal number, Method 4 standardizes the importance of the SBAs and each SBA’s contribution to the Cross-SBA analysis. The Task Team did combine similar observations parameters to overcome differences in user terminology.
The most highly ranked parameters by Method 4 are those that are deemed most critical for the largest number of SBAs. All observations required by the same number of SBAs are considered of equal rank.
Ensemble Technique to Combine Results of Cross-SBA Methods 1-4The Task Team used an ensemble technique to combine the results of Cross-SBA Methods 1-4. The ensemble approach produced a mean score for each observation parameter across the 4 methods. This approach also produced a cor-responding range of rankings, which indicates the variability in the rankings from the 4 methods. Some observations may rank high or low in all of the methods, while other observations may rank higher in some methods and lower in others. The Task Team ordered the observations according to the mean score. The ensemble approach attempts to account for the strengths and limitations in the 4 methods.
After identifying the observation rankings in this Cross-SBA ensemble approach, the Task Team used the results to de-termine the specific SBAs that considered each observation a priority. This tabulation conveys both the importance and commonality of the observations to many SBAs.
Overlapping Nature of SBAs By their very nature, many of the SBAs have overlapping themes and areas of focus. For example, the Climate SBA intersects with each of the other 8 SBAs, as explained in the GEOSS 10-Year Implementation Plan. As a result, the Task Team found that individual users frequently require information that is connected to more than one SBA. For example, a meteorologist might use data on sea surface temperature and wind speed/direction that are associated with the Weather SBA to predict the intensity and trajectory of a hurricane. Since a hurricane forecast can mitigate loss of life and reduce property damage from a natural disaster, the weather observations are also associated with the Disasters SBA. In order to address overlap Analysts focused on issues and users’ perspectives that were unique to their SBA. Many of the Analysts also shared documents and exchanged ideas during the task to help identify users who were most clearly tied to specific SBAs. While there may be observations overlapping between the SBAs, the task focused on users specific to each SBA and their needs and perspectives on the same observations may differ. For example, needs for precipitation observations for Agriculture users differ from Ecosystem users so their perspectives on and priorities for precipitation vary. Finally, to some degree, the overlapping nature of the observations is an aspect that allows this task to identify the observation priorities common to many SBAs.

Chapter 3: SBA Summaries
SBA Summaries | 15

16 | GEO Task US-09-01a
Agriculture SBA
Earth observations for the Agriculture SBA support local, national, and regional activities for the agriculture, rangelands, forestry, and fishery
sectors. The Agriculture SBA includes applications for a variety of users, including land managers, policy makers, researchers, agriculture development experts, and farmers. Within the range of Agriculture topics, the Advisory Group and Analyst focused on 4 sub-areas to highlight critical Earth observations for the Agriculture SBA and its user communities: agriculture production, agriculture forecasting and risk reduction, famine early warning, and aquaculture production.
The Team identified 18 critical observations for the Agriculture SBA. The top 5 critical observations were Vegetation Indices (e.g., LAI, NDVI), Crop Area, Disturbances, Precipitation, and Evapotranspiration.
The Advisory Group consisted of 12 experts from government, academia, research institutes, and international organizations. Representatives from 6 GEO Member Countries and 2 Participating Organizations were on the Advisory Group. The Team identified a total of 102 potentially-relevant documents, and the team determined that a subset of 54 documents contained explicit information on the observation needs for one or more of the sub-areas. There were documents representing all regions across the world, though the distribution was not precisely even; approximately half the documents were global in nature. The Agriculture Analyst extracted detailed information from the documents, including information about the adequacy of currently-available observations for the sub-areas. Across the 54 relevant documents, the Team identified 130 total observations.
The Team used a weighted index scheme to prioritize the critical Earth observations for the Agriculture SBA. This scheme assigned a score to each observation parameter based on how often an observation parameter was identified as a need in the documents. The scheme gave greater weight to observation parameters that were needed for more than one sub-area. The scheme also accounted for the type of document, giving greater weight to consensus documents, such as those representing the collective output of several organizations. Accounting for differences in observation terminology across the SBAs, the Team effectively contributed 61 observations for Methods 1-3 of the Cross-SBA analysis. The Team identified, based on expert opinion, the “15 Most Critical” observations (see facing page) for inclusion in Method 4 of the Cross-SBA analysis.
In general, the priority observations for the agriculture production, forecasting, and famine early warning sub-areas were very similar, though the specific order varied by sub-area. In each of these sub-areas, many factors influencing agriculture, such as meteorological parameters, were also expressed as needs by the users. While some aquaculture observations were similar to the other three sub-areas, the priority aquaculture observations had few commonalities with the other sub-areas. Bathymetry and Chlorophyll were the top two priorities for the aquaculture sub-area.

• Vegetation Indices, the overall highest-ranked priority observation for the SBA, was also the highest priority for the sub-areas of agriculture production and agriculture forecasting and risk reduction. Many of the influencing factors for Vegetation Indices, such as meteorological parameters, were also included as needs expressed by end users.
• The documents for the aquaculture production sub-area indicated a strong need for Bathymetry and Chlorophyll information, although these observations were not ranked as highly as other observations in the final list of Agriculture SBA priorities.
• Based on the documents reviewed, famine early warning was by far the least represented sub-area in terms of specification of user needs with respect to Earth observation parameters. Only 10% of the critical Earth observation priorities identified are applicable to famine early warning.
Agriculture SBA | 17
“Many of the documents highlighted the need for more systems and tools for sharing information.” – Allan Sommer, Agriculture SBA Analyst
Vegetation Indices
Crop Area
Disturbances
Precipitation
Evapotranspiration
Temperature
Solar radiation
Wind Characteristics
Weather
Soil Chemistry
Crop Residue
Hydrology
Bathymetry
Land Cover
Crop Yield
1.
2.
3.
4.
5.
6.
7.
8.
9.
10.
11.
12.
13.
14.
15.
Number of Advisory Group Members: 12
Countries Represented on the Advisory Group: Australia*, Canada*, India*, Italy*, Kuwait, Switzerland*, Uganda*, United States*
Organizations Represented on the Advisory Group: ICIMOD*, WMO*, Australian Commonwealth Scientific and Research Organization (CSIRO), Bedford Institute of Oceanography, Disaster Preparedness and Refugees Transition and Recovery Programme for North and Eastern Uganda, Institute for Environmental Protection and Research Sustainable Use of Natural Resources Service, Kuwait Institute for Scientific Research, Space Applications Center, United States Department of Agriculture (USDA), United States Geological Survey, University of Maryland
A GEO Secretariat expert participated in the Advisory Group.
Analyst: Allan Sommer, Battelle, USA
*Indicates GEO Member Countries and GEO Participating Organizations.
15 Most Critical Observations
• Famine Early Warning• Agriculture Production• Seasonal/Annual Agriculture
Forecasting and Risk Reduction• Aquaculture ProductionNumber of Documents: 54
Report Sub-Areas
Key Findings Advisory Group and Analyst

18 | GEO Task US-09-01a
Agriculture SBA – Forests
As a subset of the Agriculture SBA, the Task Team conducted an analysis of the critical Earth observations for users related to forests. The forests
sub-analysis had its own Analyst and Advisory Group; the results of the forests sub-analysis were integrated into the Agriculture SBA, and in some cases, Ecosystem SBA results. (Refer to the Task US-09-01a website for full details.) Globally, forests include a wide range of distinct ecosystems, from alpine tundra to tropical coastal mangroves. Many agriculture topics, such as silviculture, agroforestry, and land change, are closely linked to forest observations. Users of forest observations and information include scientific researchers, forest managers, and members of international groups. The Analyst and Advisory Group focused on 3 forests sub-areas for analysis: timber, fuel, and fiber management; forest perturbations and protection; and carbon and biomass.
The Analyst identified 59 observation parameters that are common to the 3 sub-areas of analysis. Of these, the Forests team identified 9 critical observation priorities for forests, which are, in approximate order of importance: Land Cover/Land Cover Change, Forest Area/Forest Area Change, Degradation, Afforestation/Reforestation, Carbon Stocks, Fire Intensity/Burn Intensity/Fire Radiative Power, Stand Height, Biomass/Stem Volume, and Burned Area. The Team also identified the “15 Most Critical” observations (see facing page) for inclusion in Method 4 of the Cross-SBA analysis as part of the Agriculture SBA.
A total of 6 experts served on the Forests Advisory Group, including representatives from 4 GEO Member Countries across 3 continents. The Analyst and Advisory Group identified 16 documents that were relevant to the priority-setting analysis. Most of these documents were consensus reports that had a global focus.
The Forests Team used a weighted indexing method to prioritize the 59 total observations based on three factors. The method weighted highly parameters that are needed by users of more than one sub-area of analysis. The method also accounted for specific recommendations or needs stated in consensus documents. Finally, the method incorporated the recommendations of the Advisory Group.
The Forests Team found that a number of the priority observation parameters for forests are highly interrelated. For example, Land Cover/Land Cover Change and Forest Area/Forest Area Change are very similar in purpose and method of observation. The Team concluded that, in order to meet critical Earth observation needs for forests users, strong linkages are required with the observation priorities of the Climate and Weather SBAs. Such linkages will give forests managers and policy-makers early warning of impending events, such as fires. The Forests Team noted that early warning of forest fires might be of little use in countries that are unable to manage forest fire planning. In the long term, it would be beneficial to have monitoring systems, infrastructure, and protocols in place to minimize fire crisis management.

Agriculture SBA - Forests | 19
Land Cover, Land Cover Change
Forest Area, Forest Area Change
Degradation
Afforestation/Reforestation
Carbon Stocks (soil organic matter, aboveground vegetation, below groundbiomass, dead wood, harvested wood, litter)
Fire Intensity/Burn Intensity/ Fire Radiative Power
Active Fires
Biomass (above ground)
Canopy Damage
Carbon Emissions (net)
Carbon Stocks (change)
Deforestation
Flood (extent, duration), Flooded Forest
Forest Type (heterogeneity, local variation)
Forest Use (forest management practices)
1.
2.
3.
4.
5.
6.
7.
8.
9.
10.
11.
12.
13.
14.
15.
Number of Advisory Group Members: 6Countries Represented on the Advisory Group: Australia*, Canada*, Sweden*, United States*Organizations Represented on the Advisory Group: CSIRO, Global Observation of Forest and Land Cover Dynamics (GOFC-GOLD), Natural Resources Canada, Swedish University of Agricultural Sciences, USDA, University of Maryland, Wageningen UniversityAnalyst: Glynis Lough, Battelle, USA*Indicates GEO Member Countries and GEO Participating Organizations.
15 Most Critical Observations
• The two highest-ranked observation parameters, Land Cover and Forest Area, are highly interrelated. The Analyst maintained separate listings for these observations to capture user language because the parameters are often used in different contexts in the documents.
• Forest observation has historically been conducted in the field, on relatively small scales, and at relatively large expense. Many of the documents indicated a great need to relate field measurements to methods, such as remote sensing, that allow understanding of forests on a larger scale, tracking of global changes, and identification of impacts.
Across regions, forest types, and observations, the documents consistently noted the need for:
• Improved correlation between remote sensing observations and ground-based observations
• Better algorithms to interpret and correct remote sensing data
• Validation and standardization of land cover maps
• Long time series of data and internally consistent products, and consistency of data availability
• Finer temporal and spatial resolution
• Model integration.
• Timber, Fuel, and Fiber Management• Forest Perturbations and Protection• Carbon and BiomassNumber of Documents: 16
Report Sub-Areas
Key Findings
Advisory Group and Analyst
“There is a growing demand from end users to unify the observations of forests made by various land-based and remote sensing techniques.”
– Glynis Lough, Agriculture SBA-Forests Analyst

20 | GEO Task US-09-01a
As explained in the GEOSS 10-Year Implementation Plan, biodiversity is organized on the genetic, species, and ecosystem levels. Issues relevant
to the Biodiversity SBA include the condition and extent of ecosystems, distribution and status of species, and genetic diversity in key populations. The Biodiversity Team focused on the Earth observation needs of users involved in technical, policy, management, and decision-making activities. In order to provide a broad overview of the observation needs for the Biodiversity SBA, the Analyst chose to focus on observations for species and ecosystems; the team did not select specific sub-areas for analysis.
A total of 8 experts served on the Biodiversity SBA Advisory Group, including representatives from 4 GEO Member Countries and 1 Participating Organization. The Analyst and Advisory Group identified 60 documents that provided relevant information for the analysis. Approximately half of these relevant documents were documents produced by organizations. The remaining half of the documents consisted of peer-reviewed journal articles. The Analyst only included documents in the analysis that are publicly available and were published from 2000 to 2009, since observation needs identified before 2000 were considered by the Analyst to be outdated.
The Biodiversity Team identified 153 observation “needs” related to the biodiversity of species and ecosystems. The “needs” were broadly interpreted as desired improvements in the biodiversity community (e.g. data management, data sharing) rather than specific observations parameters (e.g. precipitation). Each observation need was characterized using the following categories: Biodiversity Organizational Level, Biome Type, Spatial Scale, Observation Type, User Type, and the Drivers-Pressures-State-Impacts-Responses (DPSIR) Assessment Framework. (The DPSIR framework conceptually links interactive processes in a continuous causal chain, and it can help describe interactions between society and the environment.)
The Analyst found that characterizing observation needs using the DPSIR framework was the most useful approach because it allowed for aggregation of similar needs into the 5 DPSIR categories of Drivers, Pressures, State, Impacts, and Responses. The DPSIR framework categorization also allowed for further aggregation of needs into two levels of subcategories.
Using the DPSIR framework categorization, the Biodiversity Team found that the 153 overall observation needs corresponded to the DPSIR categories as follows: 0% Drivers, 5% Pressures, 46% State, 10% Impacts, and 39% Responses. The Analyst assigned the category with the highest percentage of observation needs as biodiversity priority areas; thus, priority observation needs are those addressing the State of biodiversity. However, the Biodiversity Team did not provide specific Earth observation parameters as part of the Biodiversity SBA analysis.
The Biodiversity Team found that observation needs relevant to both ecosystems and species were the most prevalent in the documents, as they accounted for 37% of the total needs identified. The subset of documents that were journal articles identified the State of biodiversity as the highest priority (60% of total needs identified). This finding may be a consequence of the nature of journals, which include articles focused on research actions to address the State of biodiversity. In contrast, the subset of documents prepared by organizations indicated that Responses by the biodiversity community are the highest priority (54% of total needs identified). Responses can address issues at the organization (data collection), system (data sharing), data management, and program evaluation levels.
BiodiversitySBA

Biodiversity SBA | 21
The Biodiverity SBA report did not include Earth observation priorities per se. The Biodiverity SBA Analyst did not provide the Task Team with Earth observations priorities for Method 1-3 nor a list of “15 Most Critical” observations.
Number of Advisory Group Members: 8Countries Represented on the Advisory Group: Bolivia, Columbia, South Africa*, Thailand*, Tunisia*, United States*. Organizations Represented on the Advisory Group: DIVERSITAS*, Birdlife International, Duke University, Kasetsart University, Observatoire de Sahara et du Sahel, South African Environmental Observation Network, Universidad de los Andes.Analyst: Greg Susanke, U.S. Environmental Protection Agency, USA*Indicates GEO Member Countries and GEO Participating Organizations.
• Biodiversity observation needs relevant to both ecosystems and species were most prevalent, with 37% of the total needs focused at those organizational levels.
• Activities related to information management, system infrastructure, and coordination of data collectively represented 35% of the total needs.
• The highest priority needs reported in journals focused on addressing the State of biodiversity. The highest priority interests reported in documents produced by organizations focused on responses (e.g. data collection, data sharing); the State of biodiversity was second priority.
• Species• EcosystemNumber of Documents: 60
Report Sub-Areas
Key Findings
Advisory Group and Analyst
15 Most Critical Observations

22 | GEO Task US-09-01a
Definition of a Observation ParameterIn this Task “Earth observation”generally refers to physical, geophysical, chemical, and biological parameters that describe the Earth’s land, oceans, and atmosphere as well as factors related to human dimensions. As noted in Chapter 2, the Analysts sought to preserve the terminology and descriptions of user needs. Hence, the required observation parameters discussed in this report are phenomena of interest to users (e.g., urbanization) rather than technical specifications (e.g., reflectance of a specific bandwidth of light). As such, the observation priorities identified as part of the task reflect users’ wants and needs.
Different users require parameter information at various levels of detail, however. For example, meteorologists may need data on 10 cloud properties, whereas solar energy facility operators may simply need a single cloud index. To address this issue, the Analysts grouped each specific observation parameter into a broader observation category at the beginning of the priority setting analysis. The aggregation of similar parameters in this manner provided more robust analyses and avoided redundancy, since document authors often used slightly different terms to describe the same parameter or did not identify detailed observations. The Task Team struck a balance between grouping many parameters into a category such that specificity was lost and the category became meaningless, and creating hundreds of separate categories such that the resulting list was unmanageable. In this report, each observation parameter is treated independently, even though several Analysts noted that some observation parameters are most useful when measured concurrently with other observation parameters.
Direct versus Indirect Observation ParametersSome Earth observation parameters can be directly sensed or measured, such as air temperature read by a thermometer or precipitation measured in a rain gauge. Observation parameters can also be indirectly derived from other observations or obtained from model outputs. Land cover, the 5th highest ranked observation parameter across all SBAs, is an example of an indirect observation parameter. Land cover is a classification derived from other data (e.g., imagery) that relies on supporting data on topography, population, agricultural statistics, soil characteristics, and wetlands in its derivation. During the course of the task, the Task Team found documents that described all 3 types of observation parameters. The Analysts noted that some observations which are not directly measurable using today’s technology may be directly measurable with future technology.
To the extent possible, the Analysts included in their analyses the underlying direct observation parameters that support critical modeled or indirect observation parameters. For example, the Disasters SBA Analysts identified medium- and long-term forecast models as secondary product priorities. These models are built on hazard maps which are created through the aggregation of many Earth observations, such as earthquake frequency maps based on accumulated seismic measurements. The Analysts captured the observation parameters that underlie these secondary products in the required observation parameters list for the Disasters SBA. Other Analysts did so similarly for the other SBA analyses.
SBA Summaries | 23
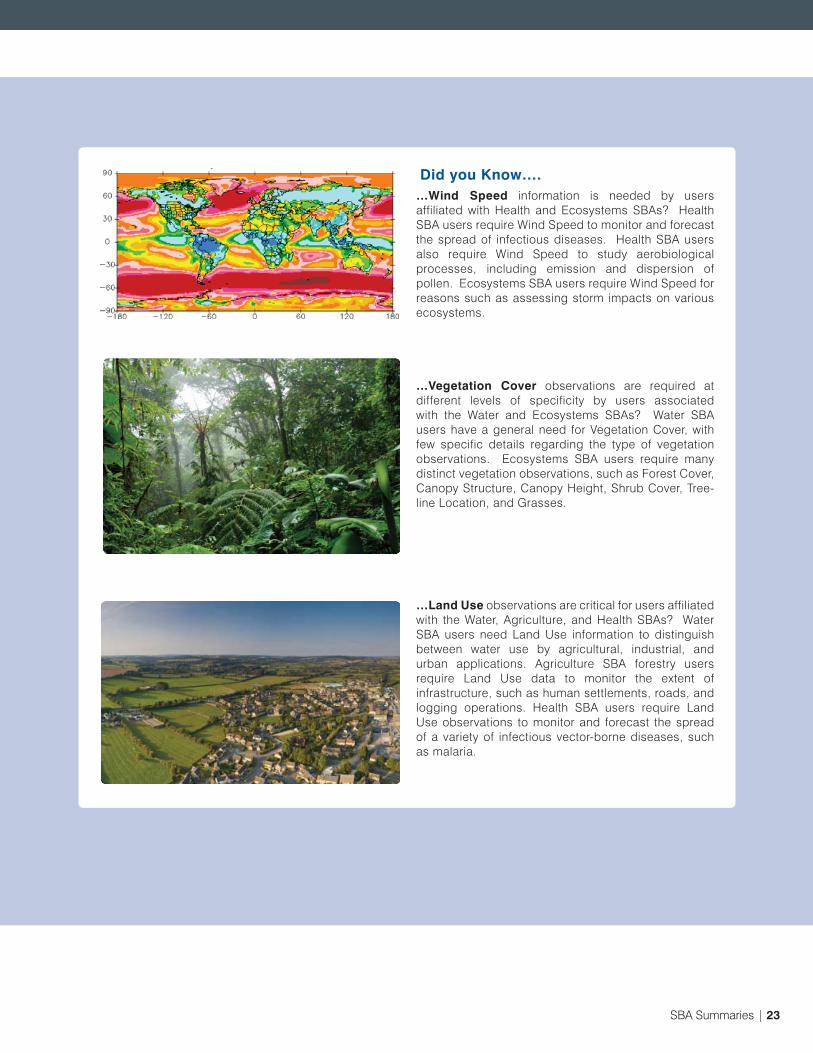
Did you Know….…Wind Speed information is needed by users affiliated with Health and Ecosystems SBAs? Health SBA users require Wind Speed to monitor and forecast the spread of infectious diseases. Health SBA users also require Wind Speed to study aerobiological processes, including emission and dispersion of pollen. Ecosystems SBA users require Wind Speed for reasons such as assessing storm impacts on various ecosystems.
…Vegetation Cover observations are required at different levels of specificity by users associated with the Water and Ecosystems SBAs? Water SBA users have a general need for Vegetation Cover, with few specific details regarding the type of vegetation observations. Ecosystems SBA users require many distinct vegetation observations, such as Forest Cover, Canopy Structure, Canopy Height, Shrub Cover, Tree-line Location, and Grasses.
…Land Use observations are critical for users affiliated with the Water, Agriculture, and Health SBAs? Water SBA users need Land Use information to distinguish between water use by agricultural, industrial, and urban applications. Agriculture SBA forestry users require Land Use data to monitor the extent of infrastructure, such as human settlements, roads, and logging operations. Health SBA users require Land Use observations to monitor and forecast the spread of a variety of infectious vector-borne diseases, such as malaria.

24 | GEO Task US-09-01a
Climate SBA
The Climate Team focused on the Earth observation needs of users involved in a range of climate change activities, including modeling, mitigation, adaptation,
and risk assessment. The Analyst and Advisory Group addressed 3 sub-areas: atmosphere, oceans, and lands. These 3 sub-areas are consistent with the treatment of climate in many of the source documents utilized for the Climate SBA analysis.
The Analyst Team identified 19 critical observations priorities for the Climate SBA. These observations encompass both the global and regional dimensions of the Climate SBA and are delineated by the 3 sub-areas of analysis. The critical observation priorities include 9 observations for the atmosphere, 6 for the oceans, and 4 for the lands. Accounting for differences in observation terminology across the SBAs, the Team effectively contributed 33 observations for Methods 1-3 of the Cross-SBA analysis. The Team also identified the “15 Most Critical” observation parameter (see facing page) for inclusion in Method 4 of the Cross-SBA analysis.
A total of 24 experts served on the Climate SBA Advisory Group, including representatives from 4 GEO Member Countries and 2 Participating Organizations. The Analyst and Advisory Group identified 40 documents that provided relevant information for the priority-setting analysis. Of the 40 documents, 27 described global needs and 13 described regional needs. Approximately one-third of the documents are previously compiled consensus reports developed by international organizations. These consensus documents served as the main source for identifying global needs of users for all 3 sub-areas, including observations specified as essential climate variables (ECVs) by the Global Climate Observing System (GCOS) and its supporting agencies.
The Climate Team identified 48 global and regional observation needs related to the 3 sub-areas of analysis. The Analyst used a bibliometric method to identify Earth observation priorities. This method involved counts and tabulations by the Analyst of the relative frequency with which specific observation needs were cited in the documents. The Analyst normalized the frequency counts by the number of documents in which the appropriate global or regional requirements were discussed. In general, the climate observations that were deemed to be of highest priority were those observations that were cited the greatest number of times as needs in the documents.
The results of the Climate SBA analysis include priority observations for both the global and regional dimensions of the Climate SBA. The Analyst Team found that observations of global and regional climate priorities intersect but do not fully overlap. Global priority observations reflect the geographic breadth of the climate as an Earth system, while regional priorities center on terrestrial processes including river discharge, lakes, and groundwater. The Team concluded that variations between global and regional climate priorities may reflect the difference between management of climate as “global public good” compared with the need to respond to the effects of climate change at the regional and national scales. In addition, the Team noted the lack of regional and national priority accorded to atmospheric observations of carbon dioxide and methane. This result may be an artifact of the more localized focus of some of the documents surveyed, since regional and national approaches center on adaptation to a changing climate rather than reduction and control of greenhouse gases. The Team noted that greenhouse gas measurements are likely to become regionally important in the future as more nations begin to take actions for greenhouse gas control.
Climate SBA | 25
Reservoir/Lake Level and Surface Temperature
River Discharge
Precipitation
Aerosol Properties
Sea Surface Temperature
Land Cover Type
Soil Moisture
Sea Level
Sea Ice
Snow Cover Area
Glacier/ice Cap Area Maps
Glacier/ice Cap Elevation
Water Use
Groundwater
Surface Radiation Budget
Number of Advisory Group Members: 7Countries Represented on the Advisory Group: Ghana, Japan*, Russia*, United States*Organizations Represented on the Advisory Group: GCOS*, WCRP*, Institute of Economic Affairs, Environment Canada, U.S. National Oceanic and Atmospheric Administration, University of Tokyo, Voeikov Main Geophysical ObservatoryAnalyst: Molly Macauley, Resources for the Future, USA *Indicates GEO Member Countries and GEO Participating Organizations.
15 Most Critical Observations (unordered)
• Examples of specific regional concerns include frost monitoring in Central Asia, ocean-related observations of the Indian Ocean, and drought monitoring in many areas.
• Sea level is an important observation for users concerned with low-lying regions, and it is interrelated with ocean density and exchange of water between the oceans, ice, and the atmosphere. Global ocean data are critical for developing confidence in forecasts of oceanic variability and change.
• The documents analyzed indicated that land, or terrestrial, data are increasingly critical for estimating climate forcing.
• A notable result is the lack of regional and national priority accorded atmospheric observations of carbon dioxide and methane. This result may be explained by the yet-to-be developed policy responses to greenhouse mitigation by policymakers.
• Atmosphere• Oceans• LandsNumber of Documents: 40
Report Sub-Areas
Key Findings Advisory Group and Analyst
26 | GEO Task US-09-01a
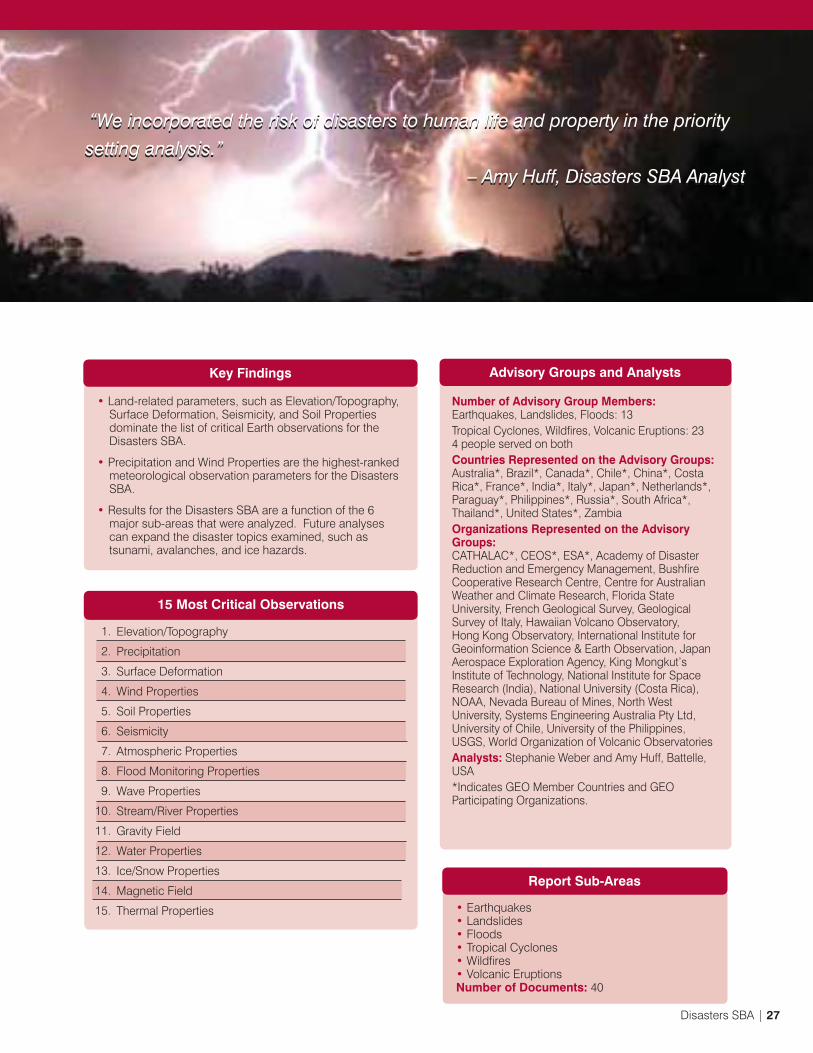
As described in the GEOSS 10-Year Implementation Plan, the Disasters SBA uses Earth observations to monitor, predict, mitigate, respond to, assess the
risk of, and provide early warning of disasters at the local, national, and global levels. The Task Team pursued 2 reports that identified critical Earth observation priorities for the Disasters SBA, each with a separate Analyst and Advisory Group. Overall, the Disasters SBA focused on the sub-areas of earthquakes, landslides, floods, wildfires, volcanic eruptions, and tropical cyclones.
The Analysts identified 40 total observation parameters that are common to the 6 sub-areas of analysis. The Analyst Team identified 6 overall critical observation priorities for the Disasters SBA, all of which have equal importance. The 6 critical observations are Elevation/Topography, Precipitation, Surface Deformation, Wind Properties, Seismic Properties, and Soil Properties. Accounting for differences in observation terminology across the SBAs, the Team effectively contributed 34 observations for Methods 1-3 of the Cross-SBA analysis. The Team also identified the “15 Most Critical” observations (see facing page) for inclusion in Method 4 of the Cross-SBA analysis.
A total of 32 experts from around the world served on the Advisory Groups for the Disasters SBA analyses, including representatives from 17 GEO Member Countries and 2 Participating Organizations. The Analysts and Advisory Group members identified 85 relevant documents that provided explicit information on user needs for one or more of the sub-areas. The majority of the documents (60%) were global in nature. No relevant documents focused on the regional-specific observation priorities for Africa or Central/South America, which highlights a gap in documentation of user needs.
The Analyst Team used a weighted indexing method to prioritize the 40 total observations based on 3 factors. The weighting scheme accounted for the number of times that the observation is mentioned in all documents as a priority, assuming that higher priority observations are mentioned more frequently. The scheme also considered the type of document, giving greater weight to consensus documents such as those representing the collective output of several organizations. Finally, the scheme weighted more highly parameters that are needed by end users of more than one sub-area, such as observation parameters that are required for both earthquakes and volcanic eruptions.
In order to account for the risk of disasters to human life and property, the Analyst Team used globally-averaged information on observed disasters from the past 30 years to conduct additional weightings on the 40 observation parameters. The Analyst Team included data in the weighting scheme on worldwide estimated damage in US dollars, the number of people affected, and the number of people killed for each of the 6 disasters sub-areas during the period 1981-2010.
Land-related parameters dominate the list of critical Earth observations for the Disasters SBA. The related observation parameters of Elevation/Topography and Surface Deformation are the highest ranked based on the analysis. Precipitation and Wind Properties are meteorological observation parameters on the “15 Most Critical” observations list. In addition, the priorities for the Disasters SBA include observation parameters such as Atmospheric Emissions, Fire Location, and Thermal Properties.
DisastersSBA
Disasters SBA | 27
Elevation/Topography
Precipitation
Surface Deformation
Wind Properties
Soil Properties
Seismicity
Atmospheric Properties
Flood Monitoring Properties
Wave Properties
Stream/River Properties
Gravity Field
Water Properties
Ice/Snow Properties
Magnetic Field
Thermal Properties
1.
2.
3.
4.
5.
6.
7.
8.
9.
10.
11.
12.
13.
14.
15.
15 Most Critical Observations
• Land-related parameters, such as Elevation/Topography, Surface Deformation, Seismicity, and Soil Properties dominate the list of critical Earth observations for the Disasters SBA.
• Precipitation and Wind Properties are the highest-ranked meteorological observation parameters for the Disasters SBA.
• Results for the Disasters SBA are a function of the 6 major sub-areas that were analyzed. Future analyses can expand the disaster topics examined, such as tsunami, avalanches, and ice hazards.
Key Findings
Number of Advisory Group Members: Earthquakes, Landslides, Floods: 13Tropical Cyclones, Wildfires, Volcanic Eruptions: 234 people served on bothCountries Represented on the Advisory Groups:Australia*, Brazil*, Canada*, Chile*, China*, Costa Rica*, France*, India*, Italy*, Japan*, Netherlands*, Paraguay*, Philippines*, Russia*, South Africa*, Thailand*, United States*, ZambiaOrganizations Represented on the Advisory Groups:CATHALAC*, CEOS*, ESA*, Academy of Disaster Reduction and Emergency Management, Bushfire Cooperative Research Centre, Centre for Australian Weather and Climate Research, Florida State University, French Geological Survey, Geological Survey of Italy, Hawaiian Volcano Observatory, Hong Kong Observatory, International Institute for Geoinformation Science & Earth Observation, Japan Aerospace Exploration Agency, King Mongkut’s Institute of Technology, National Institute for Space Research (India), National University (Costa Rica), NOAA, Nevada Bureau of Mines, North West University, Systems Engineering Australia Pty Ltd, University of Chile, University of the Philippines, USGS, World Organization of Volcanic ObservatoriesAnalysts: Stephanie Weber and Amy Huff, Battelle, USA*Indicates GEO Member Countries and GEO Participating Organizations.
Advisory Groups and Analysts
• Earthquakes• Landslides• Floods• Tropical Cyclones• Wildfires• Volcanic Eruptions Number of Documents: 40
Report Sub-Areas
“We incorporated the risk of disasters to human life and property in the priority
setting analysis.”
– Amy Huff, Disasters SBA Analyst
“We incorporated the risk of disasters to human life and property in the priority
setting analysis.”
– Amy Huff, Disasters SBA Analyst

28 | GEO Task US-09-01a
The ability to monitor and evaluate ecosystem health, function, and change is crucial for decisions that impact the preservation, adaptation, or restoration of
ecosystems. The Ecosystems SBA analysis focused on the needs of ecosystems users such as resource managers, land use planers, policymakers, and researchers. Task US-09-01a included 2 reports that identified critical Earth observation priorities for the Ecosystems SBA, each with a separate Analyst and Advisory Group. The Ecosystems Team analyzed the sub-areas of forests, coastal and near-shore marine systems, watersheds, tundra, inland/fresh water, and oceanic islands and archipelagos.
The Team identified 10 overall critical observation priorities for the Ecosystems SBA. Examples of these observations include Permafrost Condition and Dynamics; Vegetation Cover and Changes; Disturbances; and Extent, Location, and Fragmentation of Ecosystem and Habitat Types. Accounting for differences in observation terminology across the SBAs, the Team effectively contributed 77 observations for Methods 1-3 of the Cross-SBA analysis. The Team also identified the “15 Most Critical” observations (see facing page) for inclusion in Method 4 of the Cross-SBA analysis.
A total of 24 experts from around the world served on the Advisory Groups for the Ecosystems SBA analyses, including representatives from 10 GEO Member Countries and 1 Participating Organization. The Analysts and Advisory Group members identified 115 relevant documents that provided explicit information on user needs for one or more of the sub-areas. The Analysts developed and used a conceptual ecological model as a framework for identifying observational needs in the documents. This framework helped ensure that information gaps, even if not well documented in the literature, would not be missed in the analysis.
The Analysts identified 76 observation parameters that are common to the 6 sub-areas of analysis. To narrow down the list of 76 observation parameters to 10 critical priorities, the Analysts used a weighted indexing method. Three factors determined the overall priority of observations: 1) the raw frequency with which observation parameters appeared in documents, 2) the applicability of observation parameters across multiple ecosystem sub-areas, and 3) Advisory Group recommendations for high-priority observation parameters. Following the weighting procedure, the results were reviewed by Advisory Group members to identify any important gaps among identified observation parameters of high priority.
The Analysts found that the most frequently stated needs in the analyzed documents were for improvements in the ability to apply existing observation parameters, not for new or enhanced observations. The relevant documents identified the general need for more data, rather than an ideal set of observations. This result seems to be unique to the Ecosystems SBA analysis, and may be related to the fact that ecosystem observations have traditionally been gathered in the field, on relatively small scales, and at relatively large expenses of cost and manpower.
EcosystemsSBA
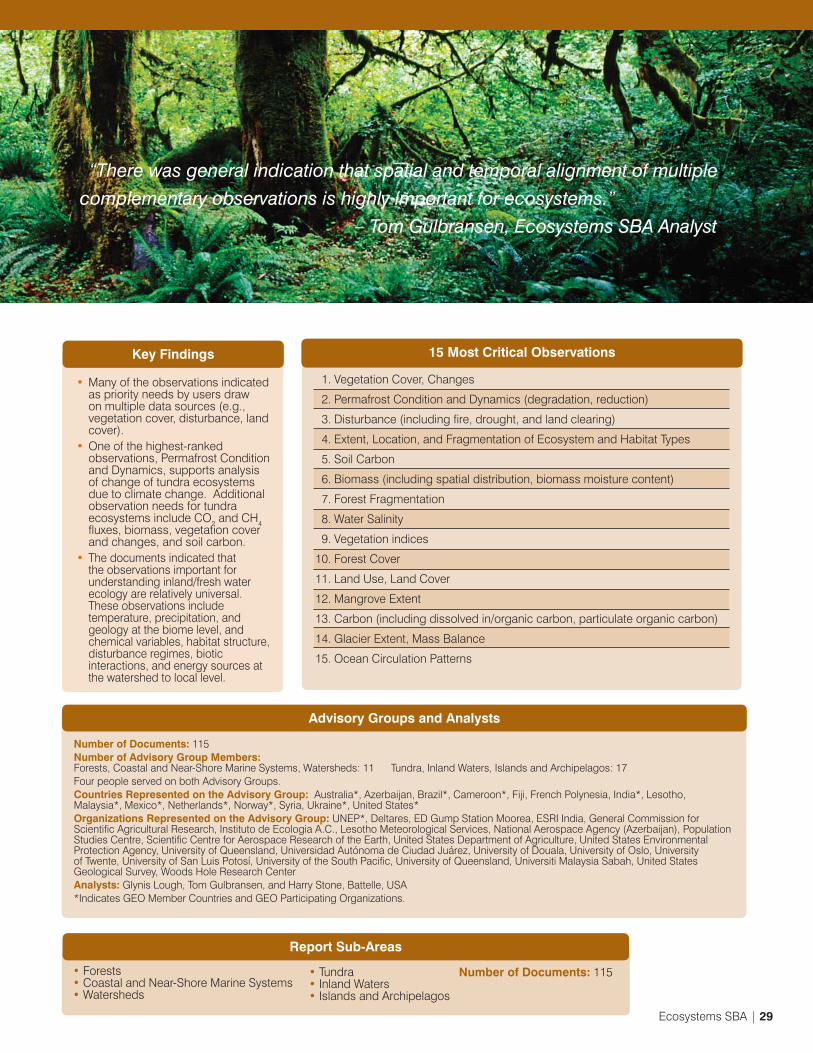
Ecosystems SBA | 29
Vegetation Cover, Changes
Permafrost Condition and Dynamics (degradation, reduction)
Disturbance (including fire, drought, and land clearing)
Extent, Location, and Fragmentation of Ecosystem and Habitat Types
Soil Carbon
Biomass (including spatial distribution, biomass moisture content)
Forest Fragmentation
Water Salinity
Vegetation indices
Forest Cover
Land Use, Land Cover
Mangrove Extent
Carbon (including dissolved in/organic carbon, particulate organic carbon)
Glacier Extent, Mass Balance
Ocean Circulation Patterns
1.
2.
3.
4.
5.
6.
7.
8.
9.
10.
11.
12.
13.
14.
15.
Number of Documents: 115Number of Advisory Group Members: Forests, Coastal and Near-Shore Marine Systems, Watersheds: 11 Tundra, Inland Waters, Islands and Archipelagos: 17Four people served on both Advisory Groups.Countries Represented on the Advisory Group: Australia*, Azerbaijan, Brazil*, Cameroon*, Fiji, French Polynesia, India*, Lesotho, Malaysia*, Mexico*, Netherlands*, Norway*, Syria, Ukraine*, United States*Organizations Represented on the Advisory Group: UNEP*, Deltares, ED Gump Station Moorea, ESRI India, General Commission for Scientific Agricultural Research, Instituto de Ecologia A.C., Lesotho Meteorological Services, National Aerospace Agency (Azerbaijan), Population Studies Centre, Scientific Centre for Aerospace Research of the Earth, United States Department of Agriculture, United States Environmental Protection Agency, University of Queensland, Universidad Autónoma de Ciudad Juárez, University of Douala, University of Oslo, University of Twente, University of San Luis Potosí, University of the South Pacific, University of Queensland, Universiti Malaysia Sabah, United States Geological Survey, Woods Hole Research CenterAnalysts: Glynis Lough, Tom Gulbransen, and Harry Stone, Battelle, USA*Indicates GEO Member Countries and GEO Participating Organizations.
15 Most Critical Observations
• Many of the observations indicated as priority needs by users draw on multiple data sources (e.g., vegetation cover, disturbance, land cover).
• One of the highest-ranked observations, Permafrost Condition and Dynamics, supports analysis of change of tundra ecosystems due to climate change. Additional observation needs for tundra ecosystems include CO2 and CH4 fluxes, biomass, vegetation cover and changes, and soil carbon.
• The documents indicated that the observations important for understanding inland/fresh water ecology are relatively universal. These observations include temperature, precipitation, and geology at the biome level, and chemical variables, habitat structure, disturbance regimes, biotic interactions, and energy sources at the watershed to local level.
Key Findings
Advisory Groups and Analysts
• Forests• Coastal and Near-Shore Marine Systems• Watersheds
Report Sub-Areas
• Tundra• Inland Waters• Islands and Archipelagos
Number of Documents: 115
“There was general indication that spatial and temporal alignment of multiple
complementary observations is highly important for ecosystems.”
– Tom Gulbransen, Ecosystems SBA Analyst

30 | GEO Task US-09-01a
Energy SBA
The Energy Team used the International Energy Agency’s 2008 World Energy Outlook (WEO) to aid in the selection of sub-areas. The WEO projected
the world energy mix out to 2030. Based on this report, the team focused on prominent renewable energy types as sub-areas: hydropower, wind power (land-based and offshore), bioenergy (including biofuels), solar power, and geothermal power.
Overall, the Team identified 44 key observations and 12 critical observations for the Energy SBA. Accounting for differences in observation terminology across the SBAs, the Team effectively contributed 15 observations for Methods 1-3 of the Cross-SBA analysis. The top 5 critical observations were Water Run-Off, Wind Speed, Land Cover, NDVI, and Net Primary Productivity.
The Advisory Group consisted of 14 experts with wide geographic distribution, including at least one member from every continent (except Antarctica). Several experts were part of the GEO Energy Community of Practice. The Energy team assessed 71 potentially-relevant, publicly-available documents and identified a subset of 54 that contained appropriate information for the analysis. The documents represented all geographic regions (except polar regions). There was rough balance in the documents across the regions as well as the Energy sub-areas. The Analyst harvested information on specific Earth observations needed by users as well as information about the adequacy of currently-available observations. Across the 54 documents, the team identified 44 key observations.
The Energy Team utilized 2 approaches in its prioritization of the 44 key observations. In one approach, the team identified the critical observations needed to serve the types of renewable energy that are projected to gain prominence over the next 20+ years. Based on the 2008 WEO, these renewable energy types are hydropower, onshore wind, biomass, and offshore wind. In a second approach, the team identified priorities based on the observations in common among the 5 sub-areas.
Of the 44 key observations, none were common to all sub-areas, 4 were common to 4 sub-areas, and 3 were common to 3 sub-areas. Using the two-part approach, the team identified 12 critical observations – 7 observations of high priority and 5 of medium priority. Accounting for differences in observation terminology across the SBAs, the Team effectively contributed 15 observations for Methods 1-3 of the Cross SBA analysis. The table on the facing page has the list of observations that the Energy SBA contributed to Method 4 of the Cross-SBA analysis.
As key findings, the team noted that historical records of some observation parameters are extremely important to some renewable energy types. In addition, the endowment of renewable energy resources varies by region, and the specific observation needs vary accordingly. Finally, the Team noted the growing need for forecasted observation parameters, especially for solar and wind resources, which gives added emphasis to the improvement of models and the Earth observation parameters that drive the models.
“Data continuity is an important issue for renewable energy users; historical records of observation parameters are required for understanding trends in renewable resource availability.” - Erica Zell, Energy SBA Analyst

Energy SBA | 31
Water Run-off
Wind Speed
Land Cover
Normalized Difference Vegetation Index (NDVI)
Net Primary Productivity (NPP)
Global Horizontal Irradiation (GHI)
Direct Normal Irradiation (DNI)
Elevation/Topography
Air Temperature
Surface Temperature
Relative Humidity
Cloud Cover (cloud index)
Temperature of Geothermal Fluid at Depth
Surface Deformation
Groundwater Chemistry (e.g., presence of borates)
1.
2.
3.
4.
5.
6.
7.
8.
9.
10.
11.
12.
13.
14.
15.
Number of Advisory Group Members: 14Countries Represented by the Advisory Group: Australia*, Brazil*, China*, Denmark*, France*, Germany*, India*, Netherlands*, South Africa*, United States*Organizations Represented by the Advisory Group: ESA*, IEEE*, ARGOSS, Brazilian National Agency for Space Research, Ecole des Mines de Paris, EPURON GmbH, Idaho National Laboratory, Institute of Remote Sensing Application, International Solar Energy Society, Natural Resource and Environment CSIR, Risoe National Laboratory, Stella Group, The Energy and Resources Institute, University of Waterloo, U.S. National Renewable Energy LaboratoryAnalyst: Erica Zell, Battelle, USA*Indicates GEO Member Countries and GEO Participating. Organizations.
15 Most Critical Observations
• The endowment of renewable energy resources varies by continent, region, country, and even sub-regions within a country. As such, the importance of a parameter that supports a specific type of renewable energy (e.g., solar energy) varies geographically.
• Many Advisory Group members noted that bioenergy and hydropower (particularly micro- and small-scale) are especially important sub-areas for developing countries.
• Historical records and forecasts of a given parameter are equally as important as near-real time measurements of Earth observation parameters.
Key Findings
Advisory Group and Analyst
• Solar Energy• Wind Energy (land-based)• Wind Energy (offshore)• Hydropower• Bioenergy• Geothermal EnergyNumber of Documents: 54
Report Sub-Areas

32 | GEO Task US-09-01a
Sample Documents
The Task Team utilized several methods to identify as many publicly available documents as possible for use in Task US-09-01a, including:• Recommendations from the GEO community, based on
a 2009 letter of invitation from the GEO Secretariat• Recommendations from Advisory Group members• Literature and internet searches.
The Task Team identified several different types of documents, including international, regional, and national-level reports; workshop and conference proceedings; summaries and presentations; and peer-reviewed journal articles. The Analysts recognized that, in general, international working group or consensus documents had the highest relevance for Task US-09-01a. These documents typically represent the viewpoints of organizations and users from a broad range of geographic locations and specialties. National-level government or working group documents had slightly less applicability, due to the more narrow geographic focus of these documents. Journal articles, conference presentations, conference proceedings, and unpublished studies, while still important, had the least pertinence for Task US-09-01a. These documents typically have narrower viewpoints or geographic focus yet offered specificity that other documents did not provide. Examples of the different types of documents identified by the Disasters SBA Analysts are listed to the right. These examples are representative of the range of documents used by the Task Team for the US-09-01a process.
International working group or consensus documents• Bureau de Recherches Géologiques et Minières, IGOS
Geohazards Theme Report, August 2007.• Committee on Earth Observation Satellites (CEOS), The
Use of Earth Observing Satellites for Hazard Support: Assessments & Scenarios., 2003.
• Integrated Global Observing Strategy (IGOS) Geohazard Bureau, GEO South East Asia Geohazards Workshop Report, 2006.
National-level government or working group documents• Joint Action Group (JAG) for the National Wildland
Fire Weather Needs Assessment (NWFWNA), National Wildland Fire Weather: A Summary of User Needs and Issues, July 2007.
• National Academy of Sciences (NAS), Earth Science and Applications from Space: National Imperatives for the Next Decade and Beyond, 2007.
• Urban Disasters Risk Management, Asian Disaster Preparedness Center Rapid Assessment: Flash Flood and Landslide Disaster in provinces of Uttaradit and Sukhothai, Northern Thailand, May 2006.
Journal articles, conference presentations, conference proceedings and unpublished studies• Dzurisin, D., A Comprehensive Approach to Monitoring
Volcano Deformation as a Window on the Eruption Cycle, Reviews of Geophysics, 2003.
• Leblon, B., Monitoring Fire Danger with Remote Sensing, Natural Hazards, 2005.
• Plag, H.P., National Geodetic Infrastructure: Current Status and Future Requirements: The Example of Norway, Nevada Bureau of Mines and Geology, 2006.
Did you Know….…Land Surface Temperature and related Thermal Property observations are needed for users affiliated with the Disasters and Water SBAs? Disasters SBA users require hotspot detection and thermal emissions/flux characterization for monitoring wildfires and volcanic eruptions. Water SBA users require land surface temperature and related soil temperature and moisture information for characterizing the water cycle.
…Global Horizontal Irradiation (GHI) is needed by users affiliated with the Energy, Agriculture, and Health SBAs? Energy SBA users need GHI (direct and diffuse irradiation) for flat plate solar applications such as photovoltaics. Agriculture SBA users need GHI for crop management. Health SBA users need GHI for understanding the presence of salmonella and hemmorhagic fever.
SBA Summaries | 33
User Types
At the start of this task, each SBA Analyst developed a set of User Types to describe the variety of users in the SBA. Some Analysts explicitly used the User Type list to guide their document searches. The User Type lists aided some Analysts in performing a gap analysis on the needs they gathered to assess and determine underrepresented users.
Users may employ Earth observations for a variety of applications, such as historical trend analysis, operational tactical decision-making, and strategic planning and forecasting. Many Analysts noted that users can be viewed as a spectrum – a “chain of users” such as managers, researchers, and decision-makers – with various organizations providing data or information products across the spectrum.
For this task, the users’ needs encompassed all types, including “end” users (e.g., shipping manager requiring weather forecasts) or “intermediate” users (e.g., meteorologist issuing weather forecasts). The Analysts noted that the needs of intermediate users are represented more than those of end users in many of the documents identified.
The task pursued a functional-orientation to User Types. The Task Team found similar, broad categories of User Types across the SBAs. Some functional user titles are common to many SBAs (e.g., planners), and some are specific to an SBA (e.g., energy commissioner). The column to the right provides a set of broad User Type categories and examples of functional user titles. A list of the User Types for each SBA is provided on the Task website.
Media ProfessionalsJournalistsBroadcast Meteorologists
Policy-MakersElected OfficialsPolicy Analysts
Financial Sector ManagersPlanners and investors Risk Assessors
Resource Managers/PlannersEmergency/ Disaster Response ManagersCoastal Managers
ForecastersHydrologistsMeteorologistsRegulatorsPermitting AgenciesEnergy Commissions
Private Citizens & Civic LeadersTouristsSchool Principals
Developers/OperatorsAviation Industry/ PilotsHealth Care ProvidersElectric Grid Operators
EngineersCivil EngineersChemical Engineers
ResearchersTechnology DevelopersScientists

34 | GEO Task US-09-01a
Health SBA
Task US-09-01a included 3 reports that identified critical Earth observation priorities for the Health SBA, each with a separate Analyst and Advisory Group.
The reports focused on the sub-areas of aeroallergens, air quality, and infectious diseases. The resulting lists of Earth observation priorities from the Health reports were merged to a single list for the purposes of the Cross-SBA analysis. Accounting for differences in observation terminology across the SBAs, the Team effectively contributed 46 observations for Methods 1-3 of the Cross-SBA analysis. The Health SBA Team also identified the “15 Most Critical” observations for inclusion in Method 4 of the Cross-SBA analysis
AeroallergensEarth observations are useful for forecasting the types and concentrations of allergens, which allows affected populations and public health officials to act in a timely fashion to prevent disease. Earth observations for the field of aeroallergens are also important as a proxy for climate change, since aeroallergens respond to warming and increased carbon dioxide effects. The Health - Aeroallergens Analyst and Advisory Group focused on analysis of Earth observation needs related to prediction of allergic airway disease, forecasting, risk assessment, and disease prevention.
The Analyst identified 160 documents that were relevant to the priority-setting analysis. The majority of these documents were peer-reviewed journal articles. The Aeroallergens Team employed a combination of quantitative and qualitative approaches to prioritize the Earth observations. These approaches were applied to a custom database populated with information from the 160 relevant documents. The database included the most common Earth observation needs reported in the documents as well as needs reported by data users from a select subset of agencies and organizations that the Analyst contacted via e-mail. Using a series of queries and data sorts, the Analyst identified the most critical observation priorities for the aeroallergens sub-area from the database.
Air QualityThe Health - Air Quality analysis focused on direct Earth observation needs. The Air Quality Team analyzed observations related to health impacts of air quality for 3 types of users: the general public, air quality managers, and scientists.

Health SBA | 35
The Analyst identified over 110 documents that were relevant to the priority-setting analysis. The Air Quality Team used a method involving multiple independent measures in order to identify Earth observation priorities. The method incorporated 3 perspectives: (a) which pollutants should be measured, (b) the required spatial and temporal coverage, and (c) the aspect(s) of air quality management that the Earth observations should support. The Analyst performed the prioritization along three independent dimensions: (1) air pollutant observation; (2) observation coverage, and (3) observation utility. The Analyst determined observation utility based on the reusability of specific Earth observations for multiple segments of the air quality system.
Infectious DiseasesThe Health - Infectious Diseases analysis focused on the identification of observations required by users for vector-borne and non-vector-borne diseases that are influenced by climate and environmental factors. The Infectious Diseases Team identified a “chain of users,” including the research community and the decision-makers. Entities identified as boundary organizations provide an informational link within the user chain.
The Infectious Diseases Analyst and Advisory Group identified user needs by analyzing the decision-making processes in which they are involved, such as forecast activities; prevention, early warning, and early response; response after the occurrence of the disease; and post-mortem evaluation. The Analyst conducted searches for relevant documents written in English, Chinese, Spanish, Portuguese, and French, and also contacted several universities and government agencies worldwide for input. The Analyst determined that 823 documents were relevant to the priority setting analysis. The Advisory Group members collectively agreed to rely upon the 2005 Disease Burden list produced by United Nations (UN) World Health Organization (WHO) for observation parameter prioritization. In the UN WHO document, the overall burden of disease is assessed using the disability-adjusted life year (DALY), a time-based measure that combines years of life lost due to premature mortality and years of life lost due to time lived in states of less than full health. Several diseases of interest did not have a quantified global burden value on this list. For the purposes of this study, the Infectious Diseases Analyst assumed a DALY value of at least one. The Analyst determined which Earth observation parameters supported which diseases, and then ranked the observation parameters based on the observation cumulative DALY impact.

36 | GEO Task US-09-01a
Number of Advisory Group Members: Aeroallergens: 16Air Quality: 11Infectious Diseases: 19Total: 46
Countries Represented on the Advisory Groups: Aeroallergens: Argentina*, Australia*, Canada*, China*, Finland*, Germany*, India*, Iran*, Netherlands*, Norway*, South Africa*, Switzerland*, United States*.
Air Quality: Brazil*, Canada*, India*, Kenya, Mexico*, Norway*, United States*.
Infectious Diseases: Australia*, Brazil*, France*, Kenya, Senegal, Switzerland*, United States*.
Organizations Represented on the Advisory Groups: Aeroallergens: WHO*, Bu-Ali Sina University, College of Urban and Environmental Sciences, Finnish Meteorological Institute, MeteoSwiss, National Jewish Health, Northern Research Institute Tromsø, Norwegian University of Science and Technology, Technical University Munich, UCT and Red Cross War Memorial Children’s Hospital, Universidad Nacional del Sur, University of Massachusetts, University of Western Sydney, University of Toronto, Visva-Bharati University, Wageningen University
Air Quality: Columbia University, Environment Canada, EPA, Health Canada, IIT Bombay, National Institute of Ecology (Mexico), Norwegian Institute of Air Research, NASA Langley, NOAA, University of Nairobi, University of São Paulo
Infectious Diseases: WHO*, CNES, Columbia University, CSE, CSUMB, Emory University, FIOCRUZ, Griffith University, HCF, JHBSPH, MSPH, NASA, NOAA, RCMRD
A GEO Secretariat expert participated in on the Infectious Diseases Advisory Group.
Analysts: Aeroallergens: Hillel Koren, University of North Carolina, USAAir Quality: Rudolf Husar, Washington University at St. Louis, USAInfectious Diseases: Pietro Ceccato, Columbia University, USA
*Indicates GEO Member Countries and GEO Participating Organizations.
• From the literature review and discussions with experts for the infectious diseases sub-report, the Analyst found that the operational use of Earth observations for human health is not yet as advanced as for other SBAs, although the potential is great.
• Through the air quality sub-report analysis, the Analyst found poor user accessibility to existing air quality health-relevant Earth observations. This means that Earth observations that are already collected are not necessarily available for reuse.
• While day-to-day aeroallergen forecasts are issued, longer-term forecasting capabilities are still evolving. Longer-term forecasting of aeroallergens can be achieved by developing models that combine remote sensing and ground-based technologies. Ideally, real-time forecasting of large-scale distribution of long-distance dispersal events can be achieved.
Key FindingsAdvisory Groups and Analysts

Health SBA | 37
Population Density
Precipitation
Air temperature
Humidity
Land Use/Land Cover
Vegetation
Water Bodies
Sea Surface Temperature
Wind
Sea Surface Height
Topography
Vector population
Atmospheric Particulates
Biodiversity
Atmospheric Trace Gases
15 Most Critical Observations (unordered)
Aeroallergens: “Allergies are on the rise world-wide presenting a serious public and environmental health issue. A wide range of Earth observa-tions, capable of longer-term aeroallergen forecasting will need to further evolve to ameliorate and eventually prevent the burden of allergic disease.”
– Hillel Koren, Health SBA: Aeroallergens Analyst
Air Quality: “The air pollutants that affect human health most were identified by the health community to be fine particles and ozone. However, assessing the magnitude of the health risk is uncertain due to inadequate monitoring, particularly in the megacities of the devel-oping world. Characterizing the emission sources, transport and ambient concentrations of air pollutants worldwide is especially important.”
– Rudy Husar, Health SBA: Air Quality Analyst
Infectious Diseases: “The report identified the Earth Observation parameters that are of importance to monitor and forecast outbreaks of 44 diseases, and several areas where GEO could intervene to improve the uptake of environmental information by the heath sector.” – Pietro Ceccato, Health SBA: Infectious Diseases Analyst
• Aeroallergens• Air Quality• Infectious DiseasesNumber of Documents: 1093
Report Sub-Areas
Comments from the Analysts

38 | GEO Task US-09-01a
WaterSBA
The Water Team focused on the Earth observation needs of users involved in a range of activities related to the terrestrial water cycle, such as water
resource management, emergency management, tourism, and recreation. The Water Team prioritized observations of the terrestrial water cycle in order to minimize overlap with the Climate and Weather SBA analyses. The Analyst and Advisory Group analyzed 4 sub-areas associated with terrestrial hydrology and water resources: surface waters, ground waters, forcings on terrestrial hydrological elements, and water quality/use.
The Water Team identified 24 critical observation priorities for the Water SBA, all of which have approximately equal importance. The Analyst separated these observation parameters into 4 categories that correspond to the sub-areas of analysis. Accounting for differences in observation terminology across the SBAs, the Team effectively contributed 49 observations for Methods 1-3 of the Cross-SBA analysis. The Team also identified the “15 Most Critical” observations” (see facing page) for inclusion in Method 4 of the Cross-SBA analysis.
A total of 14 experts served on the Water SBA Advisory Group, including representatives from 5 GEO Member Countries and 3 Participating Organizations. The Analyst and Advisory Group reviewed 200 papers, reports, and project descriptions to obtain information that was relevant to the priority-setting analysis. The Water Team focused on observation needs identified by major international, regional, and national programs and projects.
The Analyst employed a semi-quantitative method to prioritize the observation parameters for the Water SBA. This method incorporated multiple factors, including rankings made by the Analyst in consultation with the Advisory Group. The rankings were based on a weighting scheme that considered the observational priorities that had already been established for various elements of the global water cycle. The method also integrated the findings from the priority-setting analysis, such as observations currently unavailable because of technological limitations, observations needed to derive information products for applied end users, and critical observations needed to understand the water cycle.
The Water Team found that global observing systems still fail to measure some critical water cycle variables, such as Evaporation/Evapotranspiration. This parameter is important because the water budget at the terrestrial surface at any one point is determined by the difference between Precipitation and Evaporation/Evapotranspiration. Precipitation is routinely measured using a combination of in situ rain gauges and various remote sensing techniques, such as radar and space-based satellite systems. Evaporation/Evapotranspiration from land and ocean surfaces is poorly observed from in situ instruments and not readily observable using remote sensing, however. Since Evaporation/Evapotranspiration is central to Earth system science and is linked to other SBAs, the Water Team recommended that progress in the measurement of Evaporation/Evapotranspiration should be a primary focus of the water community over the next decade.
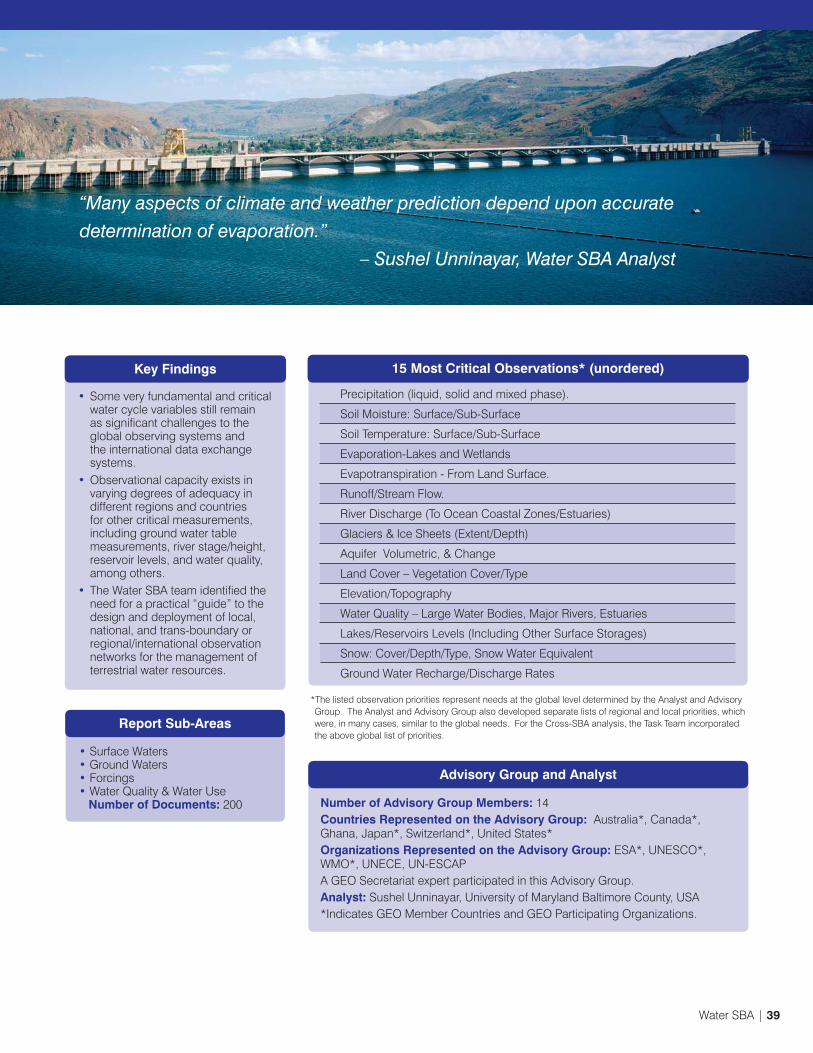
Water SBA | 39
Precipitation (liquid, solid and mixed phase).
Soil Moisture: Surface/Sub-Surface
Soil Temperature: Surface/Sub-Surface
Evaporation-Lakes and Wetlands
Evapotranspiration - From Land Surface.
Runoff/Stream Flow.
River Discharge (To Ocean Coastal Zones/Estuaries)
Glaciers & Ice Sheets (Extent/Depth)
Aquifer Volumetric, & Change
Land Cover – Vegetation Cover/Type
Elevation/Topography
Water Quality – Large Water Bodies, Major Rivers, Estuaries
Lakes/Reservoirs Levels (Including Other Surface Storages)
Snow: Cover/Depth/Type, Snow Water Equivalent
Ground Water Recharge/Discharge Rates
Number of Advisory Group Members: 14Countries Represented on the Advisory Group: Australia*, Canada*, Ghana, Japan*, Switzerland*, United States*Organizations Represented on the Advisory Group: ESA*, UNESCO*, WMO*, UNECE, UN-ESCAPA GEO Secretariat expert participated in this Advisory Group.Analyst: Sushel Unninayar, University of Maryland Baltimore County, USA*Indicates GEO Member Countries and GEO Participating Organizations.
15 Most Critical Observations* (unordered)
• Some very fundamental and critical water cycle variables still remain as significant challenges to the global observing systems and the international data exchange systems.
• Observational capacity exists in varying degrees of adequacy in different regions and countries for other critical measurements, including ground water table measurements, river stage/height, reservoir levels, and water quality, among others.
• The Water SBA team identified the need for a practical “guide” to the design and deployment of local, national, and trans-boundary or regional/international observation networks for the management of terrestrial water resources.
Key Findings
“Many aspects of climate and weather prediction depend upon accurate
determination of evaporation.”
– Sushel Unninayar, Water SBA Analyst
Advisory Group and Analyst
• Surface Waters• Ground Waters • Forcings• Water Quality & Water Use Number of Documents: 200
Report Sub-Areas
*The listed observation priorities represent needs at the global level determined by the Analyst and Advisory Group. The Analyst and Advisory Group also developed separate lists of regional and local priorities, which were, in many cases, similar to the global needs. For the Cross-SBA analysis, the Task Team incorporated the above global list of priorities.

40 | GEO Task US-09-01a
WeatherSBA
As described in the GEOSS 10-year Implementation Plan, activities in the Weather SBA focus on improving weather information, forecasting, and warning. The
Weather Team analyzed the Earth observation needs of users of weather information and services. The Analyst and Advisory Group derived 10 sub-areas for analysis from WMO Statements of Guidance (SOG). Examples of these sub-areas are global numerical weather prediction, nowcasting and very short range forecasting, and atmospheric chemistry.
The Analyst Team identified 29 most critical observations priorities for the Weather SBA, all of which have approximately equal importance. Each of these observation parameters includes information on horizontal/vertical resolution, observing cycle, latency, and accuracy. Accounting for differences in observation terminology across the SBAs, the Team effectively contributed 28 observations for Methods 1-3 of the Cross-SBA analysis. The Team also identified the “15 Most Critical” observations” (see facing page) for inclusion in Method 4 of the Cross-SBA analysis.
A total of 8 experts served on the Weather SBA Advisory Group. These experts collectively represented 4 GEO Participating Organizations. The Analyst and Advisory Group identified 25 documents that provided relevant information for the priority-setting analysis. The documents primarily included international consensus documents and high level position papers. To close apparent information
gaps in existing documents, the Weather Analyst also conducted interviews with selected experts for specific application areas.
The Analyst used a 4-level approach to prioritize Earth observation parameters for the Water SBA. The first level included all Earth observation parameters that were mentioned in the analyzed literature. The second and third levels narrowed the number of total parameters to those that were identified as the highest priorities in the analyzed literature. Finally, the fourth level further narrowed the parameters to include only those that are relevant for at least 2 of the analysis sub-areas and for which CEOS, WMO, and/or EUMESTAT have specified measurement characteristics.
The Analysis Team noted that there is a considerable lack of literature addressing national and regional user requirements pertaining to the Weather SBA. In some cases, GEO member states may have conducted relevant user requirement studies on the national or regional scale, but the study results are not available in English. The Weather Team recommends that additional documents addressing regional and national user requirements need to be identified in the framework of future user requirement studies under GEO. The Weather Analyst also indicated that many application areas are not yet able to express direct and precise requirements for weather data.
“Advanced user requirement studies in the weather domain provided strong documentation of required observation characteristics.” – Michael Nyenhuis, Weather SBA Analyst

Weather SBA | 41
3D Humidity Field
3D temperature field
Cloud Cover
Cloud Water/Ice Amounts (3D distribution)
Land Surface (skin) Temperature
Ozone
Precipitation
Sea Surface Temperature
Soil Moisture
Surface Air Humidity
Surface Air Temperature
Surface Pressure (over land)
Surface Wind
Vegetation Cover
Wind (3D) - vertical and horizontal components
Number of Advisory Group Members: 8Countries Represented on the Advisory Group: None (all members represented participating organizations)Organizations Represented on the Advisory Group: CEOS*, ECMWF*, EUMETNET*, WMO*Analyst: Michael Nyenhuis, University of Bonn, Germany*Indicates GEO Member Countries and GEO Participating Organizations.
15 Most Critical Observations (unordered)
• Mechanisms to gather users’ requirements for weather show a high level of maturity. User requirement analyses have been conducted by different national, regional and international organizations for decades.
• The WMO Rolling Requirements Review leads to a number of guidance documents which contain Earth observation priorities for a number of selected application areas.
• Most of the studies considered were conducted in the framework of international consultation processes. The requirements identified in them are significant on an international level and relevant for specific application areas without explicit consideration of regional or national priorities.
• Global Numerical Weather Prediction
• Regional Numerical Weather Prediction
• Synoptic Meteorology• Nowcasting and Very Short Range
Forecasting• Seasonal and Inter-annual
Forecasts• Aeronautical Meteorology• Atmospheric Chemistry• Ocean Applications• Agricultural Meteorology• HydrologyNumber of Documents: 25
Report Sub Areas
Key Findings
Advisory Group and Analyst

42 | GEO Task US-09-01a
Chapter 4: Cross-SBA Analysis
The Cross-SBA analysis produced an overall ranking of 146 Earth observations that were identified as priority needs across the SBAs. As described in Chapter 2, the Task Team obtained the overall rankings by using an ensemble of 4 approaches to integrate and prioritize the set of observations.
The ensemble included the results from 4 Cross-SBA prioritization methods. Each method produced a set of results that provide insight into the relative importance of Earth observations that are critical to different SBAs. By design, the results of each method generated different rankings of observation priorities. The Task Team utilized this ensemble approach to capture the range of ways to examine importance and commonality of priorities from the individual SBA analyses. The overall result is a statistically sound list of the Cross-SBA Earth observation priorities that includes the variability in each parameter’s ranking.
This section describes the results of the 4 individual Cross-SBA methods and results of the Cross-SBA ensemble analysis. This section highlights the highest- ranked observations in the Cross-SBA analysis.
Note: As discussed in Chapter 3, the Biodiversity SBA did not produce a list of priority Earth observations. Thus, the Cross-SBA analysis involved observations from only 8 SBAs.
Methods Comprising the Cross-SBA Ensemble
Method 1: Rankings based on the number of SBAs that identi-fied an observation as a priority.
Method 2: Rankings according to the total score for each ob-servation using designations of High, Medium, and Low with corresponding scores of 3, 2, 1.
Method 3: Rankings according to the total score for each ob-servation using designations of High, Medium, and Low with corresponding scores of 6, 3, 1.
Method 4: Rankings based on the number of SBAs that included an observation in its “15 Most Critical” observations list.

Cross-SBA Analysis | 43
Cross-SBA Method 1 is an unweighted tally of the number of SBAs that identified a given observation as a priority, as described in Chapter 2. This method does not assign any importance or weighting to each observation. This method provides a ranking of the 146 observation parameters according to the number of SBAs that specified a need for an individual observation. The highest-ranked observation parameters are those that are critical priorities to the largest number of SBAs. The chart above shows the spread of the number of SBAs for which the observation parameters are critical priorities.
Overall, 100 observations (68% of the 146 total) are critical priorities to 2 or more SBAs under Method 1, 29 observations (20%) are common to 4 or more SBAs, and 8 observations (5%) are common to 6 or more SBAs. The highest ranked parameters from Method 1 are Precipitation, Soil Moisture, and Surface Air Temperature; these 3 observations were identified as priorities for all 8 of the SBAs included in the Cross-SBA analysis. Surface Humidity and Surface Wind Speed are critical priorities to 7 SBAs. Critical priorities specified by 6 SBAs include Land Cover, Surface Atmospheric Pressure, and Surface Wind Direction.
Method 1: Distribution of Observations by Number of SBAs
Precipitation is the highest-ranked observation and is common to eight SBAs.
The figure shows the distribution of the 146 Earth observations by the number of SBAs that specified an observation as a priority (Method 1). 29 observations (20%) are priorities to 4 or more SBAs.
46
50
21
11 10
3 2 3
0
10
20
30
40
50
60
1 2 3 4 5 6 7 8
Num
ber o
f Obs
evat
ions
Number of SBAs Specifying an Observation as a Priority
50 observations are priorities for 2 SBAs.
Three observations, Precipitation, Soil Moisture, and Surface Air Temperature, are priorities for 8 SBAs.
Total number of observations included in Method 1 is 146.
Nu
mb
er o
f O
bse
rvat
ion
sN
um
ber
of
Ob
serv
atio
ns
Three observations Three observations (Precipitation, Soil Moisture, and (Precipitation, Soil Moisture, and Surface Air Temperature) are Surface Air Temperature) are priorities for 8 SBAs. priorities for 8 SBAs.
Total number of Total number of observations included in observations included in Method 1 is 146.Method 1 is 146.

44 | GEO Task US-09-01a
Method 2: Distribution of Observations by Method 2 Weighting
Cross-SBA Method 2 is a weighted tally of the number of SBAs that identify a given observation as a priority, taking into account the observation’s relative importance to the SBA. As described in Chapter 2, Method 2 uses a weighting scheme based on a designation of “High,” “Medium,” or “Low” assigned to each observation by the respective SBA Analyst. The High, Medium, and Low designations correspond to numerical weightings of 3, 2, and 1, respectively. The results of Method 2 are rankings of the 146 observation parameters according to the score derived from the weighting scheme. The highest possible observation parameter score is 24 (i.e., 8 SBAs ranking an observation High/3), and the lowest possible score is 1 (i.e., 1 SBA ranking an observation Low/1).
The figure above shows the distribution of scores resulting from Method 2. The figure combines both the commonality of an observation across SBAs and its priority importance to the SBAs. For example, Global Horizontal Irradiation, which was rated Low by 1 SBA and Medium by 3 SBAs, has the same score as Forest Litter, which was rated High by 2 SBAs. Precipitation is the highest-ranked parameter
in Method 2, with the highest possible score of 24. Overall, 12 observation parameters (8% of 146) received a score of 12 or above. 81 observation parameters (55%) received a score of 4 or above. Scores below 4 reflected lower levels of priority and commonality; 65 observation parameters (45%) were in this group.
Soil Moisture is the second highest-ranked observation and is common to eight SBAs.
The figure shows the distribution of the 146 Earth observations by the scores of the Method 2 weighting scheme. Scores range from 1 to 24. 81 observations (55%) received scores of 4 or above.
0
3
6
9
12
15
18
21
24
1146
Obs
erva
tion
Sco
re fr
om M
et h
od 2
lowest ranked Observations highest ranked
One observation, Precipitation, received the highest possible score of 24.
Twenty-eight observations received a score of 3.
One observation (Precipitation) One observation (Precipitation) received the highest possible score received the highest possible score of 24.of 24.
Ob
serv
atio
n S
core
fro
m M
eth
od
2O
bse
rvat
ion
Sco
re f
rom
Met
ho
d 2
Twenty-eight Twenty-eight observations received a observations received a score of 3.score of 3.

Cross-SBA Analysis | 45
Method 3: Distribution of Observations by Method 3 Weighting
Cross-SBA Method 3 is a weighted tally of the number of SBAs that specified a given observation as a priority, accounting for the observation’s relative importance to the SBA. As described in Chapter 2, Method 3 uses a weighting scheme based on a designation of “High,” “Medium,” or “Low” assigned to each observation by the respective SBA Analyst. The designations correspond to numerical weightings of 6, 3, and 1, which gives slightly greater weight to observations of High priority. The results of Method 3 are rankings of the 146 observation parameters according to the score derived from the weighting scheme. The highest possible observation parameter score is 48 (i.e., 8 SBAs ranking an observation High/6), and the lowest possible score is 1 (i.e., 1 SBA ranking an observation Low/1).
The figure above shows the distribution of scores resulting from Method 3. The figure combines both commonality of an observation across SBAs and its priority importance to the SBAs. For example, Direct Normal Irradiation, which was rated Medium by 2 SBAs, has the same score as Chlorophyll Concentration, which was rated High by 1 SBA. Precipitation is the highest ranked parameter in Method 3, with the highest possible score of 48. The next 4 highest
ranked parameters – Land Cover, Soil Moisture, Surface Air Temperature, and Surface Wind Speed – received scores of 31-33. Overall, 10 observation parameters (7% of 146) received a score of 24 or above. 109 observations (75%) received a score of 4 or above.
Surface Air Temperature is tied for third highest-ranked observation and is common to eight SBAs.
The figure shows the distribution of the 146 Earth observations by the scores of the Method 3 weighting scheme. Scores range from 1 to 48. 109 observations (75%) received scores of 4 or above.
0
4
8
12
16
20
24
28
32
36
40
44
48
1146
Obs
erva
tion
Sco
re fr
om M
etho
d 3
lowest ranked Observations highest ranked
One observation, Precipitation, received the highest possible score of 48.
Sixteen observations received a score of 12.
One observation (Precipitation) One observation (Precipitation) received the highest possible score received the highest possible score of 48.of 48.
Ob
serv
atio
n S
core
fro
m M
eth
od
3O
bse
rvat
ion
Sco
re f
rom
Met
ho
d 3

46 | GEO Task US-09-01a
Method 4: Distribution of “15 Most Critical” Observations by Number of SBAs
Cross-SBA Method 4 is an unweighted tally of the number of SBAs that identified an observation parameter as among the “15 Most Critical“ observations for that SBA. By limiting the priority observation parameters designated for each SBA to an equal number, Method 4 standardizes each SBAs contribution in the prioritization. This approach eliminates the lowest ranked observation parameters from the overall list of 146 observations, resulting in a reduced set of 97 observation parameters. The result of Method 4 is a ranking of these 97 observations by the number of SBAs for which they are deemed most critical. The highest-ranked observation parameters are those that are deemed most critical by the largest number of SBAs.
Method 4 results are shown in the figure above. This figure shows the spread of the number of SBAs for which the observation parameters are on the “15 Most Critical” observations lists. Overall, 58 observations (60% of the 97 total) are critical priorities to 2 or more SBAs under Method 4. 15 observations (15%) are common to 4 or more SBAs, and 6 observations (6%) are common to 6 or more SBAs. The highest-ranked observation parameter is Precipitation, which is on the “15 Most Critical” observations lists for all
8 SBAs included in the Cross-SBA analysis. Surface Air Temperature, Surface Humidity, Surface Wind Speed, Soil Moisture, and Land Cover are on the “15 Most Critical” observations lists for 6 SBAs. Surface Wind Direction is on the “15 Most Critical” observations lists for 5 SBAs.
Surface Wind Speed is tied for third highest-ranked observation and is common to seven SBAs.
The figure shows the distribution of the 97 observations on the “15 Most Critical” lists, according to the number of SBAs that specified an observation as a priority (Method 4). 58 observations (60%) are priorities to 2 or more SBAs.
3938
5
8
1
5
01
0
5
10
15
20
25
30
35
40
45
1 2 3 4 5 6 7 8
Num
ber o
f Obs
evat
ions
Number of SBAs Specifying an Observation as Most Critical
Total number of observations included in Method 4 is 97.
8 observations are on the “15 Most Critical” list for 4 SBAs.
8 observations are on the 8 observations are on the “15 Most Critical” list for 4 “15 Most Critical” list for 4 SBAs.SBAs.
Nu
mb
er o
f O
bse
rvat
ion
sN
um
ber
of
Ob
serv
atio
ns
Total number of observationsTotal number of observationsincluded in Method 4 is 97.included in Method 4 is 97.

Cross-SBA Analysis | 47
Rank Observation ParameterRank From Method
1 2 3 4
1 Precipitation 1 1 1 1
2 Soil Moisture 1 2 3 2
3 (tie) Surface Air Temperature 1 2 5 2
3 (tie) Surface Wind Speed 4 2 2 2
5 Land Cover 6 5 3 2
6 Surface Humidity 4 6 7 2
7 Vegetation Cover 9 7 6 8
8 Surface Wind Direction 6 8 11 7
9 (tie) NDVI 9 8 8 8
9 (tie) Sea Surface Temperature 9 8 8 8
11 Urbanization 9 8 8 15
12 Vegetation Type 9 12 12 8
13 Land Surface Temperature 9 13 13 8
14 Surface Atmospheric Pressure 6 15 21 15
15 (tie) Glacier/Ice Sheet Extent 19 17 17 8
15 (tie) Leaf Area Index 9 13 13 26
17 Upper Level Humidity 9 17 24 15
18 Elevation 9 24 25 8
19 (tie) Stream/River/Flow 19 17 17 15
19 (tie) Upper Level Winds 19 17 17 15
21 Land Use 19 15 15 26
22 Upper Level Temperature 19 24 25 15
23 Net Primary Productivity 30 17 16 26
24 Sea Level 19 24 32 15
25 Snow Cover Extent 9 24 32 26
26 Lake/Reservoir Levels and Area 30 24 21 26
27 (tie) Cultivation 30 30 25 26
27 (tie) Deforestation 30 30 25 26
27 (tie) Forest Cover 30 30 25 26
30 Cloud Cover (cloud index) 19 30 48 15
30 Highest-Ranked Earth Observations and Method 1-4 Rankings
This table presents the 30 highest-ranked Earth observations, listed according to score from the Cross-SBA analysis. The table includes the individual rankings from the 4 methods in the Cross-SBA ensemble. Ranks span from 1 to 146; 1 is the highest.

48 | GEO Task US-09-01a
30 Highest-Ranked Earth Observations by Cross-SBA Score
The chart above shows the observation scores and associated variability of the 30 Earth observations ranked highest by the ensemble technique. The chart includes the mean score for each observation parameter and the maximum and minimum rankings from the 4 methods (ranks are ‘inverted’ so the highest score is 146). The chart shows reduced variability across Methods 1-4 for the observation parameters with the higher rankings. This result suggests that there was general agreement among Methods 1-4 as to the highest-ranked observation priorities, which include Precipitation, Soil Moisture, Surface Air Temperature, Surface Wind Speed, and Land Cover. This result also suggests that rankings of other, lower-ranked observations may be dependent on the specific prioritization method. The full listing of 146 parameters is given in Appendix C. The Task Team used the rankings of the Cross-SBA Ensemble
This chart presents the 30 highest-ranked Earth observations, shown according to score in the Cross-SBA analysis; the score is the mean of the ranks from the four methods. The chart indicates the variability of rankings across the four methods. For this chart, the ranks are ‘inverted’ so the highest score is 146.
Analysis to examine the specific SBAs that considered an observation a priority. The chart on the following page shows the 25 observations with the highest ensemble scores and the corresponding SBAs that designated that observation a priority (using Method 1).
All of the highest-ranked priority parameters listed here are common to 3 or more SBAs. Also, of the 30 highest-ranked parameters, 16 observations (53%) were ranked High for 2 or more SBAs in Methods 2 and 3. Sea Level was the only observation among the 30 highest-ranked that did not receive any rankings of High in Method 2 or 3.
84
88
92
96
100
104
108
112
116
120
124
128
132
136
140
144
148
Prec
ipita
tion
Soil
Moi
stur
e
Surf
ace
Air T
empe
ratu
re
Surf
ace
Win
d Sp
eed
Land
Cov
er
Surf
ace
Hum
idity
Vege
tatio
n Co
ver
Surf
ace
Win
d D
irect
ion
ND
VI
SST
Urb
aniz
atio
n
Vege
tatio
n Ty
pe
Land
Sur
face
Tem
pera
ture
Surf
ace
Atm
osph
eric
Pre
ssur
e
Gla
cier
/Ice
She
et E
xten
t
Leaf
Are
a In
dex
Upp
er L
evel
Hum
idity
Elev
atio
n
Stre
am/R
iver
Flo
w
Upp
er L
evel
Win
ds
Land
Use
Upp
er L
evel
Tem
pera
ture
Net
Prim
ary
Prod
uctiv
ity
Sea
Leve
l
Snow
Cov
er E
xten
t
Lake
/Res
ervo
ir Le
vels
and
Are
a
Culti
vatio
n
Def
ores
tatio
n
Fore
st C
over
Clou
d Co
ver
Obs
erva
tion
Scor
e

Cross-SBA Analysis | 49
25 Highest-Ranked Earth Observations and Associated SBAs
This table presents the 25 highest-ranked Earth observations, listed according to the score in the Cross-SBA analysis. The dark blue squares in the table indicate the corresponding SBAs that identified the observation as a priority in Method 1. This table conveys both the priority and commonality of the observations to many SBAs.
Precipitation
Soil Moisture
Surface Air Temperature
Surface Wind Speed
Land Cover
Surface Humidity
Vegetation Cover
Surface Wind Direction
Normalized Difference Vegetation Index
Urbanization
Vegetation Type
Land Surface Temperature
Surface Atmospheric Pressure
Leaf Area Index
Glacier/Ice Sheet Extent
Upper Level Humidity
Elevation
Upper Level Winds
Land Use
Upper Level Temperature
Net Primary Productivity
Sea Level
Snow Cover Extent
Ag
ricu
lture
Clim
ate
Dis
aste
rs
Eco
syst
ems
Ene
rgy
Hea
lth
Wat
er
Wea
ther
EarthObservationParameter
GEO Societal Benefits Areas*
Sea Surface Temperature
River Flow Observations
the observation was included in the SBA's set of priorities
the observation was not included in the SBA's set of priorities
*The Biodiversity SBA did not produce a list of priority Earth observations. Thus, the Cross-SBA analysis involved observations from only 8 SBAs.

50 | GEO Task US-09-01a
Chapter 5: Findings
The Task Team achieved the primary objective to deliver a set of critical Earth observation priorities common to many SBAs. The Task and the results represent a significant undertaking to analyze priority observation needs across all the documents and to engage experts in the SBAs. The efforts within individual SBAs and the Cross-SBA activity represent significant contributions and key steps within GEO to articulate Earth observation priorities. Through this Task, GEO can document in a transparent way how Earth observation needs have been identified, involving numerous organizations and experts.
This chapter discusses major findings from the task. The findings present information to aid in interpreting the results, and they present known limitations and lessons learned about the process. Chapter 6 provides recommendations based on these findings.
Findings about the Results
Precipitation Reigns the Cross-SBA Analysis Precipitation is, by far, the highest-ranked Earth observation need across the societal benefit areas. All 4 prioritization methods ranked Precipitation the highest. Precipitation observation needs expressed in the SBA reports included amount, frequency, duration, information on extreme events, and information on liquid, solid, and mixed phase. While the specific information needs about Precipitation may vary across users for the SBAs, it was unanimous that Precipitation observations are the highest priority.
Methods Showed Agreement at Highest-Rankings The observations with the highest mean scores in the Cross-SBA analysis generally reflect lower variability than those of lower rank. This result suggests that there is general agreement among the 4 methods as to the highest-ranked observation priorities, which include Precipitation, Soil Moisture, Air Temperature, Wind Speed, and Land Cover. The agreement is partially because the methods all draw from a common data source. Different methods based on other data sources could produce different results.
Because the task involved numerous documents which were based on multiple methods (e.g., surveys, expert opinion), there is some variety of methods inherently represented in the task analysis.
Priorities of a Single SBA May Not Be on the Cross-SBA ListTask US-09-01a focused on the commonality of priority observations to many SBAs. Thus, some observations of critical importance to a particular SBA do not appear in the Cross-SBA list of priority observations. The ranking of an observation in the Cross-SBA list does not imply objective importance of that observation as much as commonality in need. The combined set of “15 Most Critical” observations from individual SBAs totals 97, compared to the 146 observations from the combination of the individual SBA lists. Of these 97 observations, 39 appear on the “15 Most
Land Cover is the fifth highest-ranked observation and is common to six SBAs.

Findings | 51
Critical” observations lists of only one SBA. While these 39 observations are priorities to users associated with a single SBA, they are not as critically important to other users. The individual SBA reports have information on critical Earth observations for the respective SBAs.
Findings on the Cross-SBA Methodology
Task’s Approach Produced Users’ Needs in Users’ TerminologyThe task concentrated on the observations desired and needed by users – the “demand” side of Earth observation needs. The Analysts utilized the users’ terminology in documenting the needs. At times, the users did not use terms that the Earth observations community may be familiar with – and some of their priority needs may not be Earth observations per se. Moreover, many of the needed observation parameters were expressed as phenomena of interest rather than technical specifications of the parameter. Thus, there may be a significant need to provide terms within GEOSS that resonate with the user community and a role to translate and clarify users’ needs. Overall, the demand-side, user-based approach of the task produced a rich array of observations and revealed a need for follow-on user engagement to refine parameter characteristics.
Articulation of Observation Needs in Documents VariedThe task sought to identify Earth observation needs in documents across a full spectrum of user types associated with each SBA. Many SBA Analysts noted that users’ needs were not universally well articulated across the documents reviewed. Analysts reported that some documents focused more on ways to optimize the use of current observations than on articulating specific needs for new observations. In many cases, the SBA Analysts had to infer users’ needs and desires based on statements in the documents about the adequacy of the currently-available observations. Notably, when documents did address users’ needs, the SBA Analysts
stated that reviewing the documents and harvesting needed observations was relatively straightforward.
Regional Needs Incorporated but Not Featured The Task Team emphasized geographic breadth in the documents reviewed for users’ needs. Most Analysts recorded the user needs without tying that need to a specific region, and the specific region of a need was not a factor in most SBAs’ prioritization methods. The Cross-SBA analysis focused on commonality and importance to many SBAs rather than regions. Thus, user needs that are especially unique to a single region are likely not among the higher-ranked observations. Likewise, some user needs identified as high priority in the Cross-SBA analysis may not be a priority for certain regions. For example, the Ecosystems SBA included marine ecosystems as a sub-area; however, user needs related to marine ecosystems are not likely to be priorities to users in land-locked regions.
Availability of Documents by Region VariedThe SBA Analysts reviewed over 1,700 documents with broad geographic coverage to capture users’ needs. Despite the effort to mitigate regional bias, some regions were better represented than others. The Disasters SBA Analyst reported that they found no documents which focused specifically on Earth observation priorities for Africa or South America. The Agriculture SBA Analyst reported limited documents for South America, South Asia, and the Middle East. While mechanisms to gather requirements across weather applications are mature, the Weather SBA Analyst noted a lack of documentation on regional and national needs.
Surface Humidity is the sixth highest-ranked observation and is common to seven SBAs.
Vegetation Cover is the seventh highest-ranked observation and is common to five SBAs.

52 | GEO Task US-09-01a
Insufficient Information across Documents on Parameter Characteristics An original goal of the task was to harvest information about specific observation parameter characteristics. Some of the documents identified by the SBA Analysts included quantitative information on the required characteristics (e.g., accuracy, latency) of critical observation parameters, while other documents lacked such information. Where this information was available, the SBA Analysts recorded it. However, the SBA Analysts noted that the required observation parameter characteristics vary widely according to the user and application. Ultimately, the Task Team determined that there was insufficient information about observation parameter characteristics to pursue this goal further in the task.
Lessons Learned from US-09-01a Process
Task Approach Achieved Desired Diversity in Prioritization MethodsThe Task Team conducted Task US-09-01a as a “natural experiment” of analytic methods and priority-setting criteria across the SBAs. While the 9-step process provided consistency across the SBAs, the Task Team intentionally allowed each SBA team to devise sound and creative methods to harvest, analyze, and prioritize observation needs from the documents. As an experiment, this approach was successful. The task generated a variety of methods, such as the use of the IEA’s World Energy Outlook in the Energy SBA and the use of the DALY and health outcomes in the Health SBA. In addition, some Analysts developed conceptual models to depict the relationship between
an observation and a specific decision process as part of their prioritization.
Variety in Analysts’ Approaches Introduced ComplexitiesThe SBA Analysts generally followed the 9-step process, yet there was variety in their specific approaches. Notably, the Analysts varied in the ways they reported their SBA’s priorities. Some Analysts did their prioritizations based on order of priority, some in tiers, some in an unordered list, and some grouped for global, regional, and local levels. This variety presented challenges and introduced complexity for the meta-analysis across the individual SBAs. Eventually, following discussions with the Task Team, the Analysts (except for Biodiversity) provided a list of priority observations, the designations for Methods 2 and 3, and the “15 Most Critical” observations list for incorporation into the Cross-SBA analysis SBA.
Approach to Sponsorship of Analysts Impacted ProcessThe Task Lead worked with the UIC to identify people to serve as the SBA Analysts. At first, the Task and UIC encouraged GEO members on the UIC to sponsor people as Analysts. The approach was based on voluntary contributions, and the intent was to have multiple GEO Member Countries and Participating Organizations involved in the task. However, the voluntary approach to sponsoring SBA Analysts impacted the schedule and created delays. Eventually, 3 organizations from 2 countries sponsored all the Analysts. In addition, the spread of sponsorship across organizations provided reduced accountability of the SBA Analysts to the Task Lead.
Approach to Selection of SBA Sub-Areas Introduced ChallengesThe 9-step process enabled the Analyst and Advisory Group to determine the scope of topics (i.e., sub-areas) for the SBA analysis. In general, they selected sub-areas to represent either logical sub-topics within their SBA (e.g., types of disasters for the Disasters SBA) or different topics on which users may focus (e.g., famine early warning within the Agriculture SBA). However, the determination of sub-areas after the selection of the Advisory Group members created complications. Because most Advisory Group members are usually experts in a subset of topics encompassed within the SBA, some members advocated for the importance of their particular sub-area. In some cases, members disengaged from the Advisory Group if their expertise did not align with the final sub-areas selected by the group. In these cases, either the Advisory Group became smaller or the Analyst had to commit resources to finding additional members. Surface Wind Direction is the eighth highest-ranked observation
and is common to six SBAs.

Findings | 53
Advisory Groups Played Valuable Yet Variable Roles The Advisory Groups played a valuable role in reviewing methods, criteria, and results. However, the Advisory Group members varied considerably in their level of involvement and support. The task process was designed to have the Analyst perform much of the in-depth day-to-day work, so the Advisory Group members could support targeted, specific activities at brief periods. The Analysts noted that many Advisory Group members were active and engaged, while others were intermittently involved in the activities. Some Advisory Group members were non-responsive after initially agreeing to be on the Advisory Group; in such cases, their names were removed from the Advisory Group lists contained in Appendix A.
The expectation that the Advisory Groups would be a fertile source of relevant documents was not met in many cases. This shortcoming contributed to the limited number of relevant documents for some regions. Nonetheless, many SBA Analysts reported that their Advisory Group members expressed strong interest in seeing the follow-up on this report and joining relevant GEO Communities of Practice.
Sea Surface Temperature (SST) is tied for ninth highest-ranked observation and is common to five SBAs.
Normalized Difference Vegetation Index is tied for ninth highest- ranked observation and is common to five SBAs.

54 | GEO Task US-09-01a
Chapter 6: Recommendations
This section presents recommendations from the US-09-01a Task Team. The recommendations address possible follow-on activities based on the results of the Cross-SBA analysis. The recommendations also discuss items to consider in the analytic methods and overall process as ways to improve future efforts to identify Earth observation priorities.
Recommendations for Follow-On Activities
Gather information and engage users on specific characteristics of the priority Earth observations, especially Precipitation.The Task Team originally sought to gather information about specific characteristics of the needed observations; however, there was insufficient information in the documents. Since there are several priority observations common to many SBAs, the specific characteristics of these common observations should be assessed for each SBA. As part of this effort, the Task Team recommends that the UIC engage users in the relevant SBAs for the priority observations to solicit information from them on parameter characteristics and specific uses.
Conduct an assessment of the current and planned availability of the priority Earth observations. The Task Team recommends that GEO, particularly the UIC, pursue an assessment of the availability of the highest-ranked Earth observations identified in the Cross-SBA analysis. This assessment could be a gap analysis of the current and planned availability of the observations. Such an analysis could highlight key gaps where users’ needs are under-served to determine high priority opportunities to achieve greater societal benefits. The assessment should involve all relevant GEO Committees for appropriate aspects. This assessment would be a natural follow-on to Task US-09-01a.
GEO and/or Regional Caucuses could consider pursuing similar assessments at regional levels.The Task Team emphasized geographic breadth in the documents reviewed for users’ needs. However, the specific region of need was not a factor in most SBA prioritizations. As the findings suggested, the user needs vary by geographic region, and user needs unique to a single region were not likely to appear among highly-ranked observations of the Cross-SBA analysis. Thus, an assessment of critical Earth observation priorities within regions might be beneficial to identify region-specific needs and opportunities. In addition, future endeavors could consider specifying observations common to many regions in addition to many SBAs.
Recommendations for Process Improvements
Consider additional analytic methods to gathering users’ needs and pursue an ensemble of approaches.The Task Team pursued a document-based approach since many countries and organizations had already produced documents and reports. This analysis identified the strengths in that approach, such as a level of objectivity, as well as limitations, such as a lack of documentation on some regions and topics. There are other valid approaches for assessing users’ needs and establishing priorities. The Task Team suggests that additional methods be considered in future tasks and, given sufficient resources, an ensemble of approaches be employed.
Prescribe the prioritization methods, SBA sub-areas, and other aspects of the SBA analyses.The variety in approaches across the SBAs presented some complexities in the Cross-SBA analysis. Future tasks, in coordination with the UIC or other GEO Committees, should determine the specific analytic and prioritization methods (or combination of methods) to be used. The team should prescribe the analytic method(s), prioritization approach(es), and specfic deliverables for all SBA analyses to ensure consistency. The Task Teams should allow each SBA Analyst to pursue variants in addition to the ones prescribed.

Recommendations | 55
Future Task Teams, in coordination with the UIC, should determine and instruct the Analysts on a common approach to selection of the SBA sub-areas. Examples might include topical sub-areas, functional sub-areas, or sub-areas focused on specific management and policy issues in each SBA.
Pursue broader incorporation of documents in many languages.Due to time and resources, the task’s efforts focused primarily on documents in English. In some cases, Analysts found and translated documents (or specific sections of the documents) for inclusion in the analysis. Documents describing user needs, especially regional and national needs, exist in languages other than English, yet such documents were not discovered or were underrepresented. The Task Team recommends that future endeavors plan and provide sufficient resources for the identification of documents in many languages and for necessary translations.
Continue the use of ad hoc Advisory Groups, with refinements. The Advisory Groups played an important and valuable role, yet the members varied considerably in their level of involvement. Future Task Teams should consider having a nomination process and/or an invitation directly from the GEO Secretariat as a way to raise the visibility of their efforts. As resources allow, future endeavors should consider providing a nominal honorarium to Advisory Group members, particularly to representatives from developing countries. Future Task Teams should continue to engage the Communities of Practice as much as possible. The teams should advise the Analysts to devote significant time and resources to communications with the Advisory Groups. Finally, each Analyst and Advisory Group should have at least one in-person meeting, given sufficient resources.
Strongly consider a single organization to manage the individual SBA analyses. The voluntary approach to identifying and sponsoring SBA Analysts created issues of accountability and significant variance in the presentation of results, which complicated the Cross-SBA analysis. The lack of specific observation priorities from the Biodiversity SBA is a prime example. The Task Team recommends that, if resources allow, a single organization or contractor team should oversee and manage the individual elements. A single organization/team would likely streamline the overall implementation of the task, including consistency in the format of results, schedules, and coordination of reports.
Future efforts should also plan an additional iteration between the Preliminary and Final SBA reports, with additional efforts to gather input and feedback on the priorities from user communities (part of Step 8 of the prescribed
9-step process). As part of this effort, the sponsor of the organization/team should allocate sufficient resources to ensure a comprehensive response to comments, including engagement of users at appropriate conferences, interviews, or other methods. The sponsor should also plan sufficient resources for the involvement of all SBA Analysts through completion of the Cross-SBA report.
Articulate an SBA’s community of users to support systematic collection of users’ needs. Users and end-users are broad terms, and there was considerable variety in the interpretation of users and user communities within the task. Each SBA Analyst developed a set of SBA-specific User Types as a way to encourage gathering information across the range. Future Task Teams, in coordination with the UIC, should develop or refine a set of User Types for each SBA. The Task Teams should ensure that the Analysts employ the User Types as guidance in collecting information and representing needs, utilizing them to conduct a gap analysis of their activities.
In addition, future Task Teams should encourage the Analysts, in coordination with the UIC, to engage users in targeted regions to gather feedback on the priorities and interim reports. Even for SBAs where documents are readily available, it would be especially useful to contact developing country representatives to discuss their priorities.
Urbanization is the eleventh highest-ranked observation and is common to five SBAs.

56 | GEO Task US-09-01a
Appendix A: Advisory GroupsThe following Advisory Group members supported the individual SBA analyses.
Agriculture SBA
Agriculture SBA – Forests Sub-Report
NameCountry or
OrganizationAffiliation Geographic Region Area of Expertise/ Specialty
Samira Omar ASEM Kuwait Kuwait Institute for Scientific Research Asia/Middle East
Famine Early Warning
Mark BRUSBERG United States United States Department of Agriculture North America Broad agriculture expertise
Carmela CASCONE Italy Institute for Environmental Pro-tection and Research Sustain-able Use of Natural Resources Service
Europe
Broad agriculture expertise
Jinlong FAN GEO GEO Secretariat Europe Broad agriculture expertise
Marie-Hélène FORGET Canada Bedford Institute of Oceanog-raphy North America Aquaculture Production
Mike GRUNDY Australia Australian Commonwealth Scien-tific and Research Organization Oceania/Australia Broad agriculture expertise
Chris JUSTICE United States University of Maryland North America Agriculture Production
Johnson OWARO Uganda Disaster Preparedness and Refugees Transition and Recov-ery Programme for North and Eastern Uganda
Africa
Global Agricultural Monitoring
Jai S. PARIHAR India Space Applications Centre Asia/Middle East Global Agricultural Monitoring
Basanta SHRESTHA ICIMOD The International Centre for Inte-grated Mountain Development Asia/Middle East Broad agriculture expertise
Robert STEFANSKSI WMO World Meteorological Organization Europe Global Agricultural Risk Reduction
Prasad THENKABAIL United States United States Geological Survey North America Global Agricultural Monitoring
Name Country or Organization Affiliation Geographic Region Area of Expertise/
Specialty
Michael BRADY Canada Natural Resources Canada North America Fire disturbance
Alex HELD Australia Commonwealth Scientific and Industrial Research Organisation Oceana/ Australia Forest cover and change
monitoring
Martin HEROLD Netherlands Global Observation of Forest and Land Cover Dynamics Europe/ Global Remote sensing
Håkan OLSSON Sweden Swedish University of Agricultural Sciences Europe Forest remote sensing
Kevin RYAN United States United States Department of Agriculture Forest Service North America/ Global Forest fire science,
ecophysiology
John TOWNSHEND United States University of Maryland North America/ Global Land cover dynamics
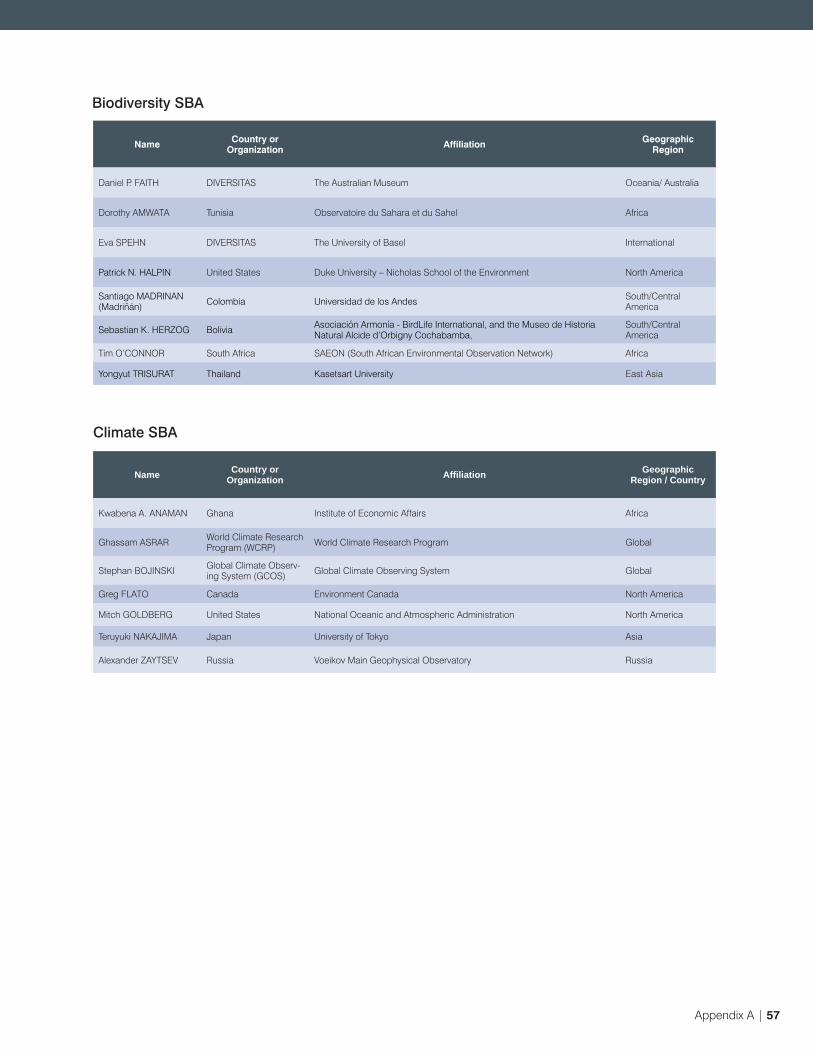
Appendix A | 57
Climate SBA
Name Country or Organization Affiliation Geographic
Region
Daniel P. FAITH DIVERSITAS The Australian Museum Oceania/ Australia
Dorothy AMWATA Tunisia Observatoire du Sahara et du Sahel Africa
Eva SPEHN DIVERSITAS The University of Basel International
Patrick N. HALPIN United States Duke University – Nicholas School of the Environment North America
Santiago MADRINAN (Madriñán) Colombia Universidad de los Andes South/Central
America
Sebastian K. HERZOG Bolivia Asociación Armonía - BirdLife International, and the Museo de Historia Natural Alcide d’Orbigny Cochabamba,
South/Central America
Tim O’CONNOR South Africa SAEON (South African Environmental Observation Network) Africa
Yongyut TRISURAT Thailand Kasetsart University East Asia
Biodiversity SBA
Name Country or Organization Affi liation Geographic
Region / Country
Kwabena A. ANAMAN Ghana Institute of Economic Affairs Africa
Ghassam ASRAR World Climate Research Program (WCRP) World Climate Research Program Global
Stephan BOJINSKI Global Climate Observ-ing System (GCOS) Global Climate Observing System Global
Greg FLATO Canada Environment Canada North America
Mitch GOLDBERG United States National Oceanic and Atmospheric Administration North America
Teruyuki NAKAJIMA Japan University of Tokyo Asia
Alexander ZAYTSEV Russia Voeikov Main Geophysical Observatory Russia

58 | GEO Task US-09-01a
Disasters SBA – Earthquakes, Landslides, Floods
Name Country or Organization Affiliation Geographic Region Area of Expertise/
Specialty
Rosario ALFARO Costa Rica Instituto Meteorologico Nacional South/Central America Broad Disasters Experience
Jay BAKER United States Florida State University North America Hurricanes/Floods
Jerome BEQUIGNON European SpaceAgency
European Space Agency Europe Disasters
George CHOY United States United States Geological Survey North America Seismic Hazards
Silvia Burgos SOSA Paraguay Paraguayan Institute for Environmental Protection South/Central America Broad Disasters
Experience
Nicola CASAGLI Italy International Consortium on Landslides Europe Landslides
Mumba Dauti KAMPENGELE Zambia National Institute for Scientific and Industrial
Research Africa Broad Disasters Experience
Ivan KOULAKOV Russia Institute of Petrol Geology and Geophysics Europe Seismic Hazards
Goneri LE COZANNET France French Geological Survey Europe Disasters
William LEITH United States USGS North America Seismic Hazards
Warner MARZOCCHI Italy World Organization of Volcano Observa-tories Europe Volcanoes
V. Madhava RAO India National Institute of Rural Development Asia/Middle East Broad Disasters Experience
Kaoru TAKARA Japan International Consortium on Landslides East Asia Floods/Landslides

Appendix A | 59
Disasters SBA – Tropical Cyclones, Wildfires, Volcanic Eruptions
Name Country or Organization Affiliation Geographic Region Area of Expertise/
Specialty
Mr. Jérôme BÉQUI-GNON ESA European Space Agency Europe Broad Disasters
Experience
Dr. CHENG Cho-ming China Hong Kong Observatory East Asia Tropical Cyclones
Mr. Emil CHER-RINGTON CATHALAC Water Center for the Humid Tropics of Latin
America and the Caribbean Central/South America Broad Disasters Experience
Dr. George CHOY United States United States Geological Survey North America Seismic Hazards
Mr. Francisco DEL-GADO CATHALAC Water Center for the Humid Tropics of Latin
America and the Caribbean Central/South America Broad Disasters Experience
Mr. Farai DONDOFEMA South Africa Environmental Consultant Africa Wildfires
Ms. Andrea FERRAZ YOUNG Brazil National Institute for Space Research Central/South America Landslides, Floods,
Sea Level Rise
Dr. Diana GREENSLADE Australia Centre for Australian Weather and Climate
Research Oceana/Australia Tropical Cyclones
Dr. Bruce HARPER Australia Systems Engineering Australia Pty Ltd Oceana/Australia Tropical Cyclones
Mr. Jamie KIBLER United States NOAA SSD, Satellite Analysis Branch North America Wildfires and Volca-nic Eruptions
Mr. Gonéri LE COZAN-NET France French Geological Survey Europe Broad Disasters
Experience
Dr. Warner MARZOC-CHI Italy World Organization of Volcanic
Observatories Europe Volcanic Eruptions
Dr. Enrico (Eric) PAR-INGIT Philippines University of the Philippines East Asia Tropical Cyclones
Dr. Matthew PATRICK United States Hawaiian Volcano Observatory Oceana/Australia Volcanic Eruptions
Dr. Andrés PÁVEZ Chile University of Chile Central/South America Volcanic Eruptions
Dr. Hans-Peter PLAG United States Nevada Bureau of Mines and University of Nevada, Reno North America Seismic Hazards
Dr. Marino PROTTI Costa Rica National University Central/South America Volcanic Eruptions
Dr. Guy SÉGUIN CEOS Committee on Earth Observing Satellites North America Broad Disasters Experience
Dr. Narisara THONG-BOONCHOO Thailand King Mongkut’s Institute of Technology East Asia Wildfires
Dr. Richard THORNTON Australia Bushfire Cooperative Research Centre Oceana/Australia Wildfires
Dr. Dewald VAN NIEKERK South Africa North West University Africa Broad Disasters
Experience
Dr. Eutizio VITTORI Italy Geological Survey of Italy Europe Broad Disasters Experience
Dr. Tsehaie WOLDAI Netherlands International Institute for Geoinformation Sciences & Earth Observation Africa Broad Disasters
Experience
60 | GEO Task US-09-01a
Name Country or Organization Affiliation Geographic Region Area of Expertise/ Specialty
Ana Laura Lara DOMIN-GUEZ Mexico Instituto de Ecologia A.C. North America Coastal/Estuarine Ecology and
Management
Hussam HUSEIN Syria General Commission for Scien-tific Agricultural Research Asia/Middle East Soils and GIS
Sevda IBRAHIMOVA Azerbaijan National Aerospace Agency Europe Land Use and GIS
Anna KOZLOVA Ukraine Scientific Centre for Aerospace Research of the Earth Europe GIS and Remote Sensing, Forest
Ecosystems
Jorge LÓPEZ-PORTILLO Mexico Instituto de Ecologia A.C. North America Coastal/Estuarine Ecology and
Management
Stuart PHINN Australia University of Queensland Oceania/Australia Biophysical Remote Sensing
Mukund RAO India ESRI India Asia/Middle East Remote Sensing and GIS
Roger SAYRE United States U.S. Geological Survey North America Biogeography and Remote Sensing
Gray TAPPAN United States U.S. Geological Survey North AmericaBiogeography, Remote Sensing, and Monitoring Specializing in Africa
Mphethe TONGWANE Lesotho Lesotho Meteorological Services Africa Applied Meteorology, Land Use, Climate Change
Andrea Ferraz YOUNG Brazil Population Studies Centre South America Land Use, Population Issues
Prasad THENKABAIL United States United States Geological Survey North America Global Agricultural Monitoring
Ecosystems SBA – Forests, Coastal and Near-Shore Marine Systems, and Watersheds

Appendix A | 61
Name Country or Organization Affiliation Geographic Region Area of Expertise/ Specialty
R. J. ASSAKO Cameroon University of Douala Africa Urban Development And Lake Pollution
Neil DAVIES French Polynesia ED, Gump Station Moorea Oceania/Australia Broad Ecosystems Expertise
Ana Laura DOMINGUEZ Mexico Instituto de Ecologia A.C. North America Coastal/Estuarine Ecology And Management
Scott J. GOETZ United States Woods Hole Research Center North America Aquatic Ecosystem Research
Anna KOZLOVA Ukraine Scientific Centre for Aerospace Research of the Earth Europe GIS And Remote Sensing, Forest
Ecosystems
Murari LAL Fiji PACE-SD, The University of the South Pacific Oceania/Australia Water Resource Management And
Landscape Ecology
Jorge LÓPEZ-PORTILLO Mexico Instituto de Ecologia A.C. North America Landscape Ecology
Gabriel OLCHIN United States
Council for Regulatory Environ-mental Modeling Office of the Science Advisor US Environmen-tal Protection Agency
North America
Large-Scale Ecosystem Processes And Modeling Policy; Remote Sensing And High Latitude Eco-systems
Deb PETERS United States USDA North America Broad Ecosystems Expertise
Stuart PHINN Australia The University of Queensland Oceania/Australia Geography, Planning, And Environ-Mental Management
Mui-How PHUA Malaysia Universiti Malaysia Sabah Oceania/Australia Landscape-Level Conservation Planning
Humberto REYES Mexico University of San Luis Potosí North America Ecosystems And Natural Re-sources Management
Erick SANCHEZ Mexico Universidad Autónoma de Ciudad Juárez North America Remote Sensing And Spatial
Analysis
Ashbindu SINGH UNEP United Nations Environmental Program North America Environment Early Warning & As-
sessment
Nicki VILLARS The Netherlands Deltares EuropeOptical Remote Sensing Data For Calibrating And Validating Water Quality Models
Anton VRIELING The Netherlands University of Twente Europe Remote Sensing, Soil Erosion, Time Series Analysis, Phenology
Frans-Emil WIELGOLASKI Norway University of Oslo Europe Fennoscandian Tundra Ecosys-
tems
Ecosystems SBA – Tundra, Inland Waters, Islands, and Archipelagos
62 | GEO Task US-09-01a
Name Country or Organization Affiliation Geographic Region Area of Expertise/
Specialty
Charlotte Bay HASAGER Denmark Risoe National Laboratory, Technical Uni-
versity of Denmark Europe Wind
Amit KUMAR India The Energy and Resources Institute Asia/Middle East Broad Renewable Energy
Ellsworth LE DREW IEEE IEEE and University of Waterloo, Canada North America Chair of GEOSS Energy COP
Maxwell MAPAKO South Africa Natural Resource and Environment, CSIR Africa Broad Renewable Energy
Pierre-Philippe MATHIEU ESA European Space Agency Europe Broad Renewable
Energy
Richard MEYER Germany EPURON GmbH Europe Solar
Monica OLIPHANT Australia International Solar Energy Society Oceania/Australia Solar
Enio PEREIRA Brazil INPE (Brazilian National Agency for Space Research) South/Central America Broad Renewable
Energy
Thierry RANCHIN France Ecole des Mines de Paris and Co-Chair of the GEO Energy Community of Practice Europe Broad Renewable
Energy
David RENNE United States Department of Energy, National Renewable Energy Laboratory North America Solar and Wind
Scott SKLAR United States Stella Group North America Broad Renewable Energy
Gerry SEHLKE United States Department of Energy, Idaho National Laboratory North America Hydropower
Han WENSINK The Netherlands ARGOSS Europe Ocean
Gu XINGFA China Institute of Remote Sensing Applications East Asia Broad Renewable Energy
Energy SBA

Appendix A | 63
Name Country or Organization Affiliation Geographic Region Area of Expertise/ Specialty
Heidrun BEHRENDT GermanyTechnical University Munich, Cen-ter for Allergy and Environmental Medicine
Europe Allergotoxicology; Allergy; Phe-nology as Related to Allergy
Kashinath BHAT-TACHARYA India Visva-Bharati University, Depart-
ment of Botany
Asia/Middle EastAerobiology; Allergy; Palynology
Abdolkarim CHEHREGANI Iran Bu-Ali Sina University, Iran Asia/Middle East
Air Pollution and Allergy; Fiesel Exhaust Particles and Pollen Allergy
Xiaoqiu CHEN China College of Urban and Environmen-tal Sciences, Physical Geography East Asia Phenology and Biometeorology
Bernard CLOT Switzerland MeteoSwiss Europe Aerobiology; Phenology; Biome-teorology; Botany
Simon HALES Switzerland WHO International Epidemiologist
Stein-Rune KARLSEN Norway Northern Research Institute Tromsø Europe Remote Sensing; GIS; Phenol-
ogy
Connie KATELARIS Australia
University of Western Sydney and
Campbelltown Hospital, Immunol-ogy and Allergy
Oceania/AustraliaClinical Immunology/Allergy; Aerobiology as Related to Respiratory Allergy
Cassim MOTALA South AfricaUCT and Red Cross War Memorial Children’s Hospital, School of Child and Adolescent Health
Africa Allergology
Maria Gabriela MURRAY Argentina Universidad Nacional del Sur South/Central America Aerobiology; Phenology
Hallvard RAMFJORD Norway Norwegian University of Science and Technology Europe Allergology; Aerobiology;
Remote Sensing
Christine ROGERS United StatesUniversity of Massachusetts, School of Public Health and Health Science
North America
Global Climate Change Effects on Aeroallergens; Forecasting; Long-Distance Transport; Health Effects
James SCOTT Canada University of Toronto, Dalla Lana School of Public Health North America
Bioaerosol Measurement and Characterization; Environmental Microbiology; Fungal Ecology
Mikhail SOFIEV Finland Finnish Meteorological Institute Europe Remote Sensing; Aerobiology Modeling
Arnold van VLIET Netherlands Wageningen University, Environ-mental Systems Analysis Group Europe Biometeorology; Aerobiology;
Phenology
Richard WEBER United States National Jewish Health North AmericaAsthma, Rhinitis, And Sinusitis Management; Allergen Aero-biology; Pollen Cross-Reactivity
Health SBA – Aeroallergens Sub-Report

64 | GEO Task US-09-01a
Name Country or Organization Affiliation Geographic Region Area of Expertise/ Specialty
Jeff BROOK Canada Environment Canada North America Air Quality
Jack FISHMAN United States NASA Langley North America Air Quality
Barry JESSIMAN Canada Health Canada North America Air Quality Health
Patrick KINNEY United States Columbia University North America Air Quality Health
Jim MEAGHER United States NOAA North America Air Quality
Rashmi S. PATIL India IIT Bombay Asia Air Quality Health
Leonora ROJAS Mexico National Institute of Ecology North America Air Quality Health
Paulo SALDIVA Brazil University of São Paulo South America Air Quality Health
Rich SCHEFFE United States EPA North America Air Quality
Kjetil TORSETH Norway Norwegian Institute of Air Re-search Europe Air Quality
Michael GATARI Kenya University of Nairobi Africa Air Quality
Health SBA – Air Quality Sub-Report
Appendix A | 65
Name Country or Organization Affiliation Geographic Region Area of Expertise/ Specialty
Ulisses E.C. CONFALONIERI Brazil FIOCRUZ South America Remote Sensing, Public Health, Infectious
Disease Ecology
Stephen J. CONNOR United States IRI - WHO - PAHO Africa, South America, Asia
Remote Sensing, Environment, Infectious Diseases
Pat DALE Australia Griffith University Australia Remote Sensing, Environment, Infectious Diseases
Joaquim DASILVA Zimbabwe WHO - AFRO Africa Medicine, Public Health, Disease Control Systems
Ruth DEFRIES United States Columbia University Africa, South America, Asia Remote Sensing, Land Cover Change
Gregory GLASS United States JHBSPH North America, South America Modeling Infectious Disease Risk
John HAYNES United States NASA North America, South America Meteorology, Remote Sensing
Darby JACK United States MSPH Africa, North America Development, Economics, Environmental Health
Isabelle JEANNE France Consultant Africa GIS, Remote Sensing and Spatial Analysis for Health
Erick KHAMALA Kenya RCMRD Africa Remote Sensing
Patrick KINNEY United States MSPH Africa, North America Public Health
Uriel KITRON United States Emory University Africa, South America Infectious Diseases Ecology, GIS, Remote Sensing
Murielle LAFAYE France CNES Europe, Africa, Asia, South America
Health Applications, Remote Sensing, Tele-communication
Forrest MELTON United States CSUMB North America, South America
Remote Sensing, Ecosystem Modeling, Deci-sion Support System
Jacques André NDIONE Senegal CSE Africa Climatologist Working on Environment Changes and Health Issues
Masami ONODA Switzerland GEO Secretariat International Environmental Policy, Satellite Program Man-agement and Data Policy
David ROGERS Switzerland HCF Africa, North America, South America
In Situ Observation and Utilization of EO Information
Leonid ROYTMAN United States NOAA Asia Remote Sensing for Infectious Diseases
Juli TRTANJ United States NOAA North America Human Health, Oceans
Health SBA – Infectious Diseases Sub-Report

66 | GEO Task US-09-01a
Name Country or Organization Affiliation Geographic Region Area of Specialty
Abou AMANI UNESCO UNESCO AfricaRegional Office
Africa Hydrology & Water Resources
Douglas CRIPE GEO GEO Secretariat Water
International Hydrology & Water Resources
Maria DONOSO UNESCO UNESCO Paraguay Regional Office
South America Hydrology & Water Resources
Jay FAMIGLIETTI United States University of Cali-fornia
North America Hydrology & Climate
Wolfgang GRABS WMO WMO Hydrology and Water Resources
International & Regional (WMO Regions I to VI)
Hydrological Forecasting & Water Resources Development
Steven GREB United StatesState of Wisconsin Department of Water Resources
North America Hydrology and Water Quality
Rick LAWFORD Canada University of Winnipeg
North America & Interna-tional (IGWCO)
Hydrology & Water Resources; HydromeTeorology
Annukka LIPPONEN Switzerland UNECEBalkans, Caucasus, Central Asia
Hydrology; Trans-Boundary Waters
Jinping LIU WMO UN-ESCAP & WMO Typhoon Committee
Asia & Pacific Hydrology, Meteorology, Typhoons
Massimo MIMENTI ESA ESA Europe & Global Remote Sensing, Hydrology and Water Resources Management
Wellens MENSAH Ghana Ghana Hydrological Services & WMO
Africa Hydrology and Water Resources
Osamu OCHIAI Japan JAXA & CEOS Water Asia & Global Remote Sensing
Masami ONODA GEO GEO Secretariat International International Coordination
Bruce STEWART Australia Australia Bureau of Meteorology
Asia & Pacific--Oceania / Australia
Agrometeorology, Weather, Hydrology & Water Resources
Water SBA

Appendix A | 67
Name Country or Organization Affi liation Geographic Region
Manfred KLOEPPEL ECMWF ECMWF Europe
Paul COUNET CEOS EUMETSAT International
Robert HUSBAND CEOS EUMETSAT International
Jochen DIBBEM EUMETNET Network of European Meteorological Services Europe
Jerome LAFEUILLE WMO WMO Space Observing Systems Division International
Geoffrey LOVE WMO WMO Weather and Disaster Risk Reduction Department International
Wenijan ZHANG WMO WMO Observing and Information Systems Department International
Climate SBA Liaison
Stephan BOJINSKI GCOS GCOS Secretariat International
Weather SBA

68 | GEO Task US-09-01a
Appendix B: GEO Secretariat Letter Regarding US-09-01a
GROUP ON EARTH OBSERVATIONS
GEO Secretariat: 7 bis, avenue de la Paix Case postale 2300 CH-1211 Geneva 2 Switzerland Tel: + 41 (0) 22 730 85 05 Fax: +41 (0)22 730 85 20 [email protected] www.earthobservations.org
Our Ref.: 2009454/GEO/US-09-01a GEO All
Geneva, 8 January 2009
Dear Colleagues,
On behalf of the GEO User Interface Committee and the team for Task US-09-01a, it is my pleasure to request your participation and contributions to this Task.
Task US-09-01a will help GEO identify critical Earth observation priorities common to the Societal Benefit Areas. The Task team has developed a process that compiles and analyzes observation needs expressed in existing, publicly-available documents from 2000 to the present. The team recognizes that GEO Member countries and Participating Organizations may have already published documents, held workshops, or written reports that identify observation needs particular to their regions or topics. The Task team will harvest the information in these documents and conduct a meta-analysis to identify common observation priorities across the existing documents.
The team is especially interested in ensuring an international breadth to this process. The team will include information from a broad, international distribution of documents, including significant representation from developing countries. A brief description of this Task is available on the GEO User Interface Committee webpage at http://earthobservations.org. To ask questions about this Task, contact the Task lead Lawrence Friedl at +1.202.358.1599 or send an inquiry to the Task US-09-01a email address: [email protected].
The Task team requests your organization’s submissions or suggestions for documents, reports, workshop summaries, etc. that address Earth observation priorities for any and all of the Societal Benefit Areas. Please provide an electronic copy, Internet link, or title and information about the document to the Task US-09-01a email address.
The Task team is forming ad hoc Advisory Groups to support its work. These informal groups of 12-15 persons from GEO Member countries and Participating Organizations will provide input on the Societal Benefit Areas, help identify documents, and review the analyses and findings. The Task team requests your organization to submit suggestions for people that can be considered for an Advisory Group. To submit suggestions, please send the name(s), brief biography, and associated societal Benefit Area to the task email address, listed above.
I strongly encourage your organization to respond to these requests for documents and Advisory Group members to support the Task team. Responses to the above requests should be sent by 6 February 2009.
Yours sincerely,
José Achache Secretariat Director

Appendix C | 69
Appendix C: Combined Set of SBAs’ Priority Observations (Alphabetical Order)
Aerosol PropertiesAmbient Nitrogen Dioxide ConcentrationAmbient Ozone ConcentrationAmbient Particulate Matter (fine) CompositionAmbient Particulate Matter Composition (coarse)Ambient Particulate Matter Concentration (coarse)Ambient Particulate Matter Concentration (fine)Ambient Sulfur Dioxide ConcentrationAmbient Volatile Organic CompoundsAnimal activity (range, season length, migration patterns)Aquatic Ecosystem ConditionBathymetryBiodiversityBiomassBurned Area/FiresCarbon (stores, uptake, flux)Carbon Dioxide ConcentrationCarbon Dioxide Partial PressureCarbon in Subsurface OceanChlorophyllCloud Cover (cloud index)Cloud Parameters (Other)Cloud Water/Ice AmountsColumn Nitrogen Dioxide ConcentrationColumn Ozone ConcentrationColumn Particulate Matter Concentration (coarse)Column Particulate Matter Concentration (fine)Column Sulfur Dioxide ConcentrationContaminants/Pollutants (Inorganic/Organic)Coral Reef Classification/MetabolismCrop EmergenceCrop ResidueCrop YieldCultivationCurrentsCurvatureDeforestationDensity of Animal HostsDesertificationDirect Normal Irradiation (DNI)Ecosystem Demand for WaterEcosystem Function/DynamicsElevationEmissivityErosion (reefs, sandbars)EvaporationEvapotranspirationEVIField Cover (Continuous)
Fish Harvest IntensityFloodsForest CoverForest LitterForest Management PracticesForest StructurefPARFraction of Absorbed Photosynthetically Active Radiation (FAPAR)Fuel Load/CharacteristicsGeologic StratificationGlacier/Ice Cap ElevationGlacier/Ice Sheet DepthGlacier/Ice Sheet ExtentGlobal Horizontal Irradiation (GHI)Gravity FieldGross Primary ProductivityGroundwaterHealth Care AccessHydrologyIceIce DepthImpervious Surface ExtentInundated Vegetation Lake/Reservoir Levels and AreaLand CoverLand Surface TemperatureLand UseLeaf Area IndexMagnetic FieldMethane ConcentrationNDVINet Primary Productivity (NPP)Non-native speciesNutrients (Phosphorous, Nitrogen, Potassium, Nitrates, Sul-fates)Ocean SalinityOcean TopographyOther long-lived GHGsOutgoing Longwave Radiation (Top of Atmosphere)Pathogen Population DynamicPermafrostPhenologyPhotosynthetically Active Radiation (PAR)PopulationPore PressurePrecipitationRock Strength, Permeability, Spacing, orientationSAVI
This list contains the full set of 146 observation parameters that resulted from combining the priority Earth observations identi-fied in each of the individual SBA reports. The priority observations are listed alphabetically.

70 | GEO Task US-09-01a
Sea Ice CoverSea Ice Surface (Skin) TemperatureSea LevelSea Surface Temperature (SST)SeismicitySlipSlope AngleSlope MovementSnow Cover ExtentSnow DepthSnow Water Equivalent (SWE)Soil CarbonSoil CompositionSoil MoistureSoil ThawSoil ThicknessSoil TypeSource of Drinking WaterSpecies CompositionStand Density/Height/VolumeStrainStratospheric OzoneStream/River FlowSurface Air TemperatureSurface AlbedoSurface Atmospheric PressureSurface DeformationSurface HumiditySurface Radiation BudgetSurface Wind DirectionSurface Wind SpeedSuspended particulates/turbidity/water attenuation coefficientThermokarstUpper Level HumidityUpper Level TemperatureUpper Level WindsUrbanizationVector PopulationVegetation CoverVegetation TypeWater Algal bloomsWater Bodies (location)Water Depth (Shallow Near-Shore)Water Quality & Composition, pH and Salinity, Dissolved Oxygen ContentWater Run-OffWater UseWave DirectionWave HeightWave Period

Appendix D | 71
Appendix D: Combined Set of “15 Most Critical” Observations
Aerosol PropertiesAmbient Nitrogen Dioxide ConcentrationAmbient Ozone ConcentrationAmbient Particulate Matter (fine) CompositionAmbient Particulate Matter Composition (coarse)Ambient Particulate Matter Concentration (coarse)Ambient Particulate Matter Concentration (fine)Ambient Sulfur Dioxide ConcentrationAmbient Volitile Organic CompoundsBathymetryBiodiversity BiomassBurned Area/FiresCarbon (stores, uptake, flux)Cloud Cover (cloud index)Cloud Parameters (Other)Cloud Water/Ice Amounts (3D Distribution)Column Nitrogen Dioxide ConcentrationColumn Ozone ConcentrationColumn Particulate Matter Concentration (coarse)Column Particulate Matter Concentration (fine)Column Sulfur Dioxide ConcentrationContaminants/Pollutants (Inorganic/Organic)CultivationCurrentsCurvatureDeforestationDesertificationDirect Normal Irradiation (DNI)ElevationEvaporationEvapotranspirationEVIFloodsForest CoverForest Management PracticesForest StructureFraction of Absorbed Photosynthetically Active Radiation (FAPAR)Fraction of Photosynthetically Active Radiation (fPAR)Fuel Load/CharacteristicsGlacier/Ice Cap ElevationGlacier/Ice Sheet DepthGlacier/Ice Sheet ExtentGlobal Horizontal Irradation (GHI)Gross Primary ProductivityGroundwaterLake/Reservoir LevelsLand CoverLand Surface Temperature
Land UseLeaf Area IndexNet Primary Productivity (NPP)Non-Native SpeciesNormalized Difference Vegetation Index (NDVI)Nutrients (Phosphorous, Nitrogen, Potassium, Nitrates, Sulfates)Ocean SalinityOcean TopographyPhotosynthetically Active Radiation (PAR)PopulationPore PressurePrecipitationRock Strength, Permeability, Spacing, orientationSAVISea Ice CoverSea LevelSea Surface Temperature (SST)SeismicitySlipSlope AngleSlope MovementSnow Cover ExtentSnow DepthSnow Water Equivalent (SWE)Soil CarbonSoil CompositionSoil MoistureSoil ThicknessStrainStream/River Flow, Discharge, Height, StageSurface Air TemperatureSurface Atmospheric PressureSurface DeformationSurface HumiditySurface Radiation BudgetSurface Wind DirectionSurface Wind SpeedUpper Level HumidityUpper Level TemeratureUpper Level WindsUrbanizationVector PopulationVegetation CoverVegetation TypeWater Bodies (location)Water Quality & Composition, pH and salinity, Dissolved Oxygen ContentWater Run-OffWater Use
This list contains the 97 observation parameters (a subset of the list in Appendix C) that resulted from combining the “15 Most Criti-cal” observation lists from the SBA Analysts for Method 4 of the Cross-SBA analysis. The observations are listed alphabetically.

72 | GEO Task US-09-01a
Appendix E: Combined Set of SBAs’ Priority Observations (Priority Order)This table contains the prioritized results of the Cross-SBA analysis. The 146 observation parameters are listed in order by score. The score represents the average rank of the observation parameter across Methods 1 through 4 of the Cross-SBA analysis. To convert from rank to score, the Task Team inverted the ranks and set the score of the highest priority observation to be 146. For ref-erence, the table includes the maximum and minimum scores of each observation parameter across Methods 1 through 4 to show the variability in results across the methods. Finally, the table includes the number of SBAs for which an SBA indicated the observa-tion parameter was a priority using Method 1. The maximum possible number of SBAs for this table is 8, because the Biodiversity SBA report did not provide a set of priority observations.
Observation ParameterScore
(Inverted Mean Rank)
Maximum Score from
Methods 1-4
Minimum Score from Methods
1-4
# of SBAs
Precipitation 146 146 146 8
Soil Moisture 145 146 144 8
Surface Air Temperature 144.5 146 142 8
Surface Wind Speed 144.5 145 143 7
Land Cover 143 145 141 6
Surface Humidity 142.25 145 140 7
Vegetation Cover 139.5 141 138 5
Surface Wind Direction 139 141 136 6
NDVI 138.75 139 138 5
Sea Surface Temperature (SST) 138.75 139 138 5
Urbanization 137 139 132 5
Vegetation Type 136.75 139 135 5
Land Surface Temperature 136.25 139 134 5
Surface Atmospheric Pressure 132.75 141 126 6
Glacier/Ice Sheet Extent 131.75 139 128 4
Leaf Area Index 131.75 138 121 5
Upper Level Humidity 130.75 138 123 5
Elevation 130.5 139 122 5
Stream/River/Flow 130 132 128 4
Upper Level Winds 130 132 128 4
Land Use 128.25 132 121 4
Upper Level Temperature 126.25 132 122 4
Net Primary Productivity (NPP) 124.75 131 117 3
Sea Level 124.5 132 115 4
Snow Cover Extent 124.25 138 115 5
Lake/Reservoir Levels and Area 121.75 126 117 3
Cultivation 119.25 122 117 3
Deforestation 119.25 122 117 3

Appendix E | 73
Forest Cover 119.25 122 117 3
Cloud Cover (cloud index) 119 132 99 4
Ocean Topography 118.25 132 96 4
Soil Composition 117.5 121 115 3
fPAR 116.5 130 87 4
Soil Type 116 130 91 3
Global Horizontal Irradation (GHI) 115.5 128 96 4
Groundwater 112.5 132 96 3
Ambient Particulate Matter Concentration (fine) 111.75 122 91 3
Gross Primary Productivity 111.75 122 91 3
Cloud Water/Ice Amounts 109.75 121 96 3
Evaporation 109.75 121 96 3
Evapotranspiration 109.75 121 96 3
Ambient Ozone Concentration 109 121 95 2
Biomass 109 121 95 2
Burned Area/Fires 109 121 95 2
Desertification 109 121 95 2
EVI 109 121 95 2
Glacier/Ice Sheet Depth 109 121 95 2
SAVI 109 121 95 2
Water run-off 109 121 95 2
Column Particulate Matter Concentration (fine) 108.75 128 91 4
Floods 106.5 123 87 2
Ambient Particulate Matter (fine) Composition 104.5 117 91 2
Bathymetry 102.25 117 91 3
Photosynthetically Active Radiation (PAR) 102.25 117 91 3
Water Quality & Composition, pH and salinity, Dissolved Oxygen Content 102.25 117 91 3
Ambient Particulate Matter Composition (coarse) 101.5 115 91 2
Ambient Particulate Matter Concentration (coarse) 101.5 115 91 2
Soil Carbon 101.5 115 91 2
Fraction of Absorbed Photosynthetically Active Radiation (FAPAR) 100.25 130 85 2
Biodiversity 100 117 87 3
Non-native species 99.75 132 85 2
Column Ozone Concentration 97 121 85 2
Currents 97 121 85 2
Glacier/Ice Cap Elevation 97 121 85 2
Water Use 97 121 85 2
Permafrost 95 117 47 3
Ocean Salinity 92.5 117 77 3
Forest Litter 90.5 115 47 2
Direct Normal Irradiation (DNI) 90 121 69 2
Column Particulate Matter Concentration (coarse) 89.5 95 85 2
Observation ParameterScore
(Inverted Mean Rank)
Maximum Score from
Methods 1-4
Minimum Score from Methods
1-4
# of SBAs

74 | GEO Task US-09-01a
Population 89.5 95 85 2
Carbon (stores, uptake, flux) 84.25 95 75 2
Contaminants/Pollutants (Inorganic/Organic) 84.25 95 75 2
Nutrients (Phosphorous, Nitrogen, Potassium, Nitrates, Sulfates) 84.25 95 75 2
Slope Angle 84.25 95 75 2
Snow Water Equivalent (SWE) 84.25 95 75 2
Water Bodies (location) 84.25 95 75 2
Forest management practices 82.5 95 69 2
Ice 81.25 117 47 3
Column Nitrogen Dioxide Concentration 80.5 117 49 3
Snow Depth 80 95 65 2
Cloud Parameters (Other) 75 95 49 2
Forest Structure 75 95 49 2
Sea Ice Cover 75 95 49 2
Surface Deformation 75 121 45 1
Surface Radiation Budget 75 95 49 2
Soil Thickness 72.25 121 36 2
Ecosystem Function/Dynamics 71.5 95 47 2
Species Composition 71.5 95 47 2
Aerosol Properties 67.5 91 45 1
Ambient Nitrogen Dioxide Concentration 67.5 91 45 1
Ambient Sulfur Dioxide Concentration 67.5 91 45 1
Curvature 67.5 91 45 1
Pore Pressure 67.5 91 45 1
Rock Strength, Permeability, Spacing, orientation 67.5 91 45 1
Seismicity 67.5 91 45 1
Slip 67.5 91 45 1
Slope Movement 67.5 91 45 1
Strain 67.5 91 45 1
Carbon Dioxide Concentration 66.5 117 37 3
Ice Depth 64 95 47 2
Impervious Surface Extent 64 95 47 2
Surface Albedo 64 95 47 2
Wave Direction 64 95 47 2
Wave Height 64 95 47 2
Wave Period 64 95 47 2
Vector Population 62.5 91 45 1
Fuel Load/Characteristics 62.25 95 27 2
Chlorophyll 56.5 69 45 1
Erosion (reefs, sandbars) 56.5 69 45 1
Fish Harvest Intensity 56.5 69 45 1
Observation ParameterScore
(Inverted Mean Rank)
Maximum Score from
Methods 1-4
Minimum Score from Methods
1-4
# of SBAs
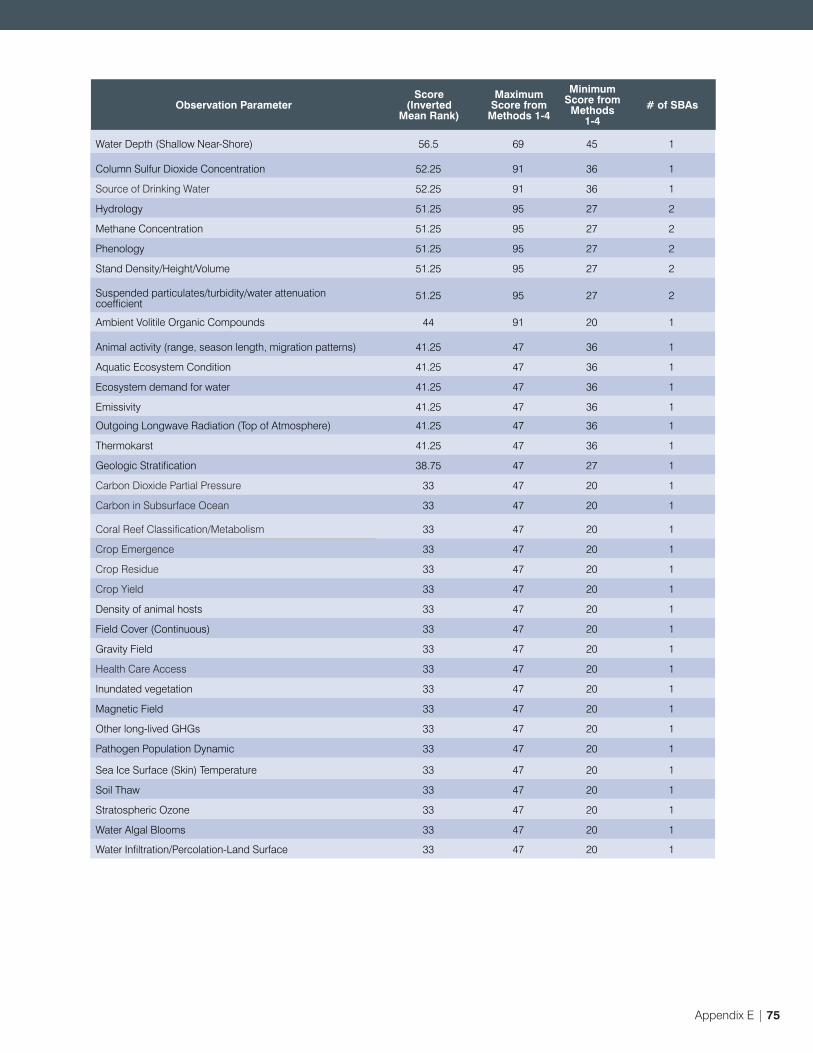
Appendix E | 75
Water Depth (Shallow Near-Shore) 56.5 69 45 1
Column Sulfur Dioxide Concentration 52.25 91 36 1
Source of Drinking Water 52.25 91 36 1
Hydrology 51.25 95 27 2
Methane Concentration 51.25 95 27 2
Phenology 51.25 95 27 2
Stand Density/Height/Volume 51.25 95 27 2
Suspended particulates/turbidity/water attenuation coefficient
51.25 95 27 2
Ambient Volitile Organic Compounds 44 91 20 1
Animal activity (range, season length, migration patterns) 41.25 47 36 1
Aquatic Ecosystem Condition 41.25 47 36 1
Ecosystem demand for water 41.25 47 36 1
Emissivity 41.25 47 36 1
Outgoing Longwave Radiation (Top of Atmosphere) 41.25 47 36 1
Thermokarst 41.25 47 36 1
Geologic Stratification 38.75 47 27 1
Carbon Dioxide Partial Pressure 33 47 20 1
Carbon in Subsurface Ocean 33 47 20 1
Coral Reef Classification/Metabolism 33 47 20 1
Crop Emergence 33 47 20 1
Crop Residue 33 47 20 1
Crop Yield 33 47 20 1
Density of animal hosts 33 47 20 1
Field Cover (Continuous) 33 47 20 1
Gravity Field 33 47 20 1
Health Care Access 33 47 20 1
Inundated vegetation 33 47 20 1
Magnetic Field 33 47 20 1
Other long-lived GHGs 33 47 20 1
Pathogen Population Dynamic 33 47 20 1
Sea Ice Surface (Skin) Temperature 33 47 20 1
Soil Thaw 33 47 20 1
Stratospheric Ozone 33 47 20 1
Water Algal Blooms 33 47 20 1
Water Infiltration/Percolation-Land Surface 33 47 20 1
Observation ParameterScore
(Inverted Mean Rank)
Maximum Score from
Methods 1-4
Minimum Score from Methods
1-4
# of SBAs

76 | GEO Task US-09-01a
Appendix F: List of Acronyms
CATHALAC Water Center for the Humid Tropics of Latin America and the CaribbeanCEOS Committee on Earth Observation SatellitesCSIRO Australia’s Commonwealth Scientific and Industrial Research OrganisationDALY Disability Adjusted Life YearDNI Direct Normal IrradiationECMWF European Centre for Medium-Range Weather ForecastsEO Earth Observation ESA European Space AgencyEUMESTAT European Organisation for the Exploitation of Meteorological SatellitesEVI Enhanced Vegetation IndexfPAR Fraction of Photosynthetically Active RadiationGCOS Global Climate Observing SystemGEO Group on Earth ObservationsGEOSS Global Earth Observation System of SystemsGHI Global Horizontal IrradiationIAG International Association of GeodesyICIMOD International Centre for Integrated Mountain DevelopmentIEA International Energy AgencyIEEE Institute of Electrical and Electronics EngineersIGOS Integrated Global Observing StrategyLAI Leaf Area IndexNASA U.S. National Aeronautics and Space AdministrationNDVI Normalized Difference Vegetation IndexNOAA U.S. National Oceanic and Atmospheric AdministrationNPP Net Primary ProductivitySAVI Soil Adjusted Vegetation IndexSBA Societal Benefit AreaSST Sea Surface TemperatureUIC GEO User Interface CommitteeUNEP United Nations Environment ProgrammeUNESCO United Nations Educational, Scientific and Cultural OrganizationUS EPA U.S. Environmental Protection AgencyUSGS U.S. Geological SurveyWCRP World Climate Research ProgrammeWHO World Health OrganizationWMO World Meteorological Organization

Group on Earth ObservationsThe Group on Earth Observations is an intergovernmental organization working to improve the availability, access, and use of Earth observations to benefit society. GEO is coordinating efforts to establish the Global Earth Observation System of Systems.
GEO User Interface Committee The User Interface Committee engages a broad range of user communities in the development of GEOSS, identification of needs, and use of Earth observations on national, regional and global scales.
GEO Task US-09-01a: Critical Earth Observation Priorities Task US-09-01a is an activity to identify critical Earth observation priorities common to many societal benefit areas across a range of users.
www.earthobservations.org