genome wide expression profiling of two accession of g. herbaceum l. in response to drought
TRANSCRIPT

RESEARCH ARTICLE Open Access
Genome wide expression profiling of twoaccession of G. herbaceum L. in responseto droughtAlok Ranjan1†, Deepti Nigam1†, Mehar H Asif1, Ruchi Singh1, Sanjay Ranjan1, Shrikant Mantri2, Neha Pandey1,Ila Trivedi1, Krishan Mohan Rai1, Satya N Jena1, Bhupendra Koul1, Rakesh Tuli2, Uday V Pathre1 andSamir V Sawant1*
Abstract
Background: Genome-wide gene expression profiling and detailed physiological investigation were used forunderstanding the molecular mechanism and physiological response of Gossypium herbaceum, which governs theadaptability of plants in drought conditions. Recently, microarray-based gene expression analysis is commonly usedto decipher genes and genetic networks controlling the traits of interest. However, the results of such an analysisare often plagued due to a limited number of genes (probe sets) on microarrays. On the other hand,pyrosequencing of a transcriptome has the potential to detect rare as well as a large number of transcripts in thesamples quantitatively. We used Affymetrix microarray as well as Roche’s GS-FLX transcriptome sequencing for acomparative analysis of cotton transcriptome in leaf tissues under drought conditions.
Results: Fourteen accessions of Gossypium herbaceum were subjected to mannitol stress for preliminary screening;two accessions, namely Vagad and RAHS-14, were selected as being the most tolerant and most sensitive toosmotic stress, respectively. Affymetrix cotton arrays containing 24,045 probe sets and Roche’s GS-FLXtranscriptome sequencing of leaf tissue were used to analyze the gene expression profiling of Vagad and RAHS-14under drought conditions. The analysis of physiological measurements and gene expression profiling showed thatVagad has the inherent ability to sense drought at a much earlier stage and to respond to it in a much moreefficient manner than does RAHS-14. Gene Ontology (GO) studies showed that the phenyl propanoid pathway,pigment biosynthesis, polyketide biosynthesis, and other secondary metabolite pathways were enriched in Vagadunder control and drought conditions as compared with RAHS-14. Similarly, GO analysis of transcriptomesequencing showed that the GO terms responses to various abiotic stresses were significantly higher in Vagad.Among the classes of transcription factors (TFs) uniquely expressed in both accessions, RAHS-14 showed theexpression of ERF and WRKY families. The unique expression of ERFs in response to drought conditions reveals thatRAHS-14 responds to drought by inducing senescence. This was further supported by transcriptome analysis whichrevealed that RAHS-14 responds to drought by inducing many transcripts related to senescence and cell death.
Conclusion: The comparative genome-wide gene expression profiling study of two accessions of G.herbaceumunder drought stress deciphers the differential patterns of gene expression, including TFs and physiologicallyrelevant processes. Our results indicate that drought tolerance observed in Vagad is not because of a singlemolecular reason but is rather due to several unique mechanisms which Vagad has developed as an adaptationstrategy.
* Correspondence: [email protected]† Contributed equally1Council of Scientific and Industrial Research-National Botanical ResearchInstitute, Rana Pratap Marg, Lucknow 226001, UP, IndiaFull list of author information is available at the end of the article
Ranjan et al. BMC Genomics 2012, 13:94http://www.biomedcentral.com/1471-2164/13/94
© 2012 Ranjan et al; licensee BioMed Central Ltd. This is an Open Access article distributed under the terms of the Creative CommonsAttribution License (http://creativecommons.org/licenses/by/2.0), which permits unrestricted use, distribution, and reproduction inany medium, provided the original work is properly cited.

BackgroundDrought is a major abiotic stress that affects plantgrowth and reduces plant yield. Many plants haveevolved specific adaptive mechanisms in response to thedrought stress exhibiting either drought escape ordrought-tolerant mechanisms. Drought tolerance is apolygenic trait that involves a cascade of responses ran-ging from physiological changes to transcriptional regu-lation. The adaptive mechanisms in response to droughtin plants are reduced water loss, reduced radiationabsorption, reduced evaporation surfaces, and low tissuewater potential. Other adaptive mechanisms includemaintaining cell turgor pressure and reduced water lossby the accumulation of compatible solute moleculessuch as betaine, proline, sorbitol, and so on [1]. Theknown molecular adaptive mechanisms in response todrought in plants involve the activation of transcrip-tional regulators such as DREB/CBF, MYB, and MYC[2,3]. The development of microarray-based expressionprofiling methods have triggered significant progress inthe characterization of the plant response to variousabiotic stresses. Some recent efforts include identifica-tion of the gene networks involved in response to high-temperature stress in developing barley caryopses [4].Further, the cross-hybridization studies using Rice Genechip lead to the identification of drought-induciblegenes in banana [5]. The dynamics of gene networksthat are functional at the reproductive stage in responseto drought stress have recently been studied in contrast-ing barley genotypes [6]. Another technology for tran-scriptome sequencing that uses Roche’s GS-FLXpyrosequencer leads to the identification of several uniquegenes in rice seedlings exposed to drought stress [7].Further, pyrosequencing helps in the identification ofsmall RNA [7], microsatellite markers [8], and importantagronomic traits [9-11] involved in the adaptation ofplants to various abiotic stress conditions. Taken together,microarray and pyrosequencing have enormously contrib-uted to the advancement of knowledge related to variousgenetic networks involved in adaptation.
Cotton (Gossypium sp.) is a leading textile fiber as wellas the second most important oil seed crop in the world[12], and its productivity is vulnerable to drought. Mole-cular studies on cotton in response to drought arescanty. In drought-prone areas in Asia, diploid speciesGossypium herbaceum (A1-genome) and Gossypiumarboreum (A2-genome) are cultivated preferentially dueto their inherent ability to withstand drought [13]. Inthe NCBI database, till date, only 662 partial nucleotidesequences and 268 ESTs have been deposited for G. her-baceum, which is considerably low considering the gen-ome size of G. herbaceum, which is 1.7 Gbp [14]. The
present study was undertaken to explore the G. herba-ceum species with the aim of understanding the differ-ent genomic and physiological responses that might beinvolved in the inherent ability of this species to adaptto drought stress.
MethodsScreening of G. herbaceum accessions for droughttolerance and sensitivityFourteen accessions (Vagad, Gujcot21, RAHS-14,RAHS-IPS 187, H-17, AH-7GP, AH-127, RAHS 127,AH41, DB3-12, RAHS131, Jayelehar, GH18-2LC, andRAHS 132) of G. herbaceum that had been collectedfrom different geographical locations in India were ana-lyzed for drought tolerance and sensitivity based onmannitol-imposed drought stress in the DT1 experi-ment. Fifty seeds were maintained for germination, eachat 2%, 4%, 6%, and 8% of mannitol in MS media of four-teen accessions. Accessions that grew and survived in8% mannitol were considered drought tolerant, andother accessions that grew in only 4% mannitol wereconsidered drought sensitive. In the DT2 experiment,two-week-old seedlings were exposed to drought bywithholding water for seven days (soil moisture below30%), whereas the control pots were irrigated daily. Inthe DT3 experiment, drought stress was given to theplants by withholding watering till soil moisture reachesbelow 30% in pots and drooping effects on plant leavesbecame prominent.
Field experimentVagad and RAHS-14 seedlings were grown during thesummer of 2010 under field conditions at the MahatmaGandhi Mission, Aurangabad, at Padegaon, India (19°15’ N; 75° 23’ E, 513 m above sea level), in the rainoutexperimental station. Ten replicates of both the acces-sions were grown in three plots each with a surfacearea of 36 m2, filled with 1 m deep black cotton soil. Amobile greenhouse-grade polyethylene roof covered theplants during rainfall, and water was supplied througha trickle irrigation system in each plot. Plants weregrown using otherwise normal agricultural practices,that is, plant spacing, fertilizers, and so on. Controlplots were irrigated to field capacity twice weekly.Drought treatment was imposed by withholding irriga-tion. The measurements of different parameters weremade after ten days (moderate stress) and after thirtydays (severe stress) while withholding water. All gasexchange measurements were made between 8 h and12 h, as gas exchange and environmental parametersdid not show significant diurnal variation during thisperiod.
Ranjan et al. BMC Genomics 2012, 13:94http://www.biomedcentral.com/1471-2164/13/94
Page 2 of 18

Measurement of physiological parametersLeaf gas exchange net photosynthetic rate (A), stomatalconductance (gs), and transpiration rate (E) were mea-sured with an LI-6400 portable photosynthesis system(Li-Cor, Lincoln, NE) with red and blue LED lightsources. All measurements were made on the third andfourth leaves from the terminal bud of a twig. Measure-ments were made between 8 h and 10 h on five leavesper treatment per accession on different plants. Mea-surements were conducted at c. 400 μmol CO2 mol_1
air, constant leaf temperature (T leaf = 33 ± 2°C), andconstant vapor pressure deficit (VPD = 2.5 kPa ± 0.2)after the attainment of steady-state photosynthetic rates.The ratio of (A) to (E) was taken as the intrinsic photo-synthetic water use efficiency (WUE). Dark respiration(R) was measured under similar microclimatic condi-tions after dark adaptation of the leaf for more than 30min. Measurements of water potential and relative watercontent (RWC) were made at predawn on single, fullyexpanded leaves (third and fourth leaves from the term-inal bud of a twig) immediately after excision. Leafwater potential (Ψ) was measured with a plant waterstatus console (Soilmoisture, Santa Barbara, CA),whereas RWC of the leaf was calculated as 100 × (freshweight - dry weight)/(turgid weight - dry weight) [15].
Sample collection and RNA isolationTwo accessions (Vagad and RAHS-14) of G.herbaceumwere used for this study. Drought stress was given topotted plants by withholding water to maintain the soilmoisture always less than 30%. The drought treatedplants were watered only once in every alternate weekwhile the control pots were irrigated daily. A total 12plants were grown in earthen pots, including six plantsfrom each accession. Drought stress, was given toplants by withhold watering in six pots including threefrom both accession. The drought treatment was giventill the visible differences became apparent. Remainingsix pots including three pots from both accessionswere watered normally and considered as control.Thus, three plants from each accession at given condi-tion were considered as biological replicates. TotalRNA were extracted from the leaf tissues using Spec-trum plant total RNA Kit, (Sigma-Aldrich) accordingto the manufacturer’s instructions. After DNaseI treat-ment (Ambion), RNA were quantified and checked forthe integrity by using a Bioanalyzer 2100 (Agilent, Inc.,Palo Alto, CA, USA).
RNA labeling and hybridizationThe direct labeling procedure was used with 1 μg oftotal RNA sample; double-stranded cDNA was synthe-sized with a T7 promoter-containing oligo (dT) primerusing a Gene chip one-cycle cDNA synthesis kit
(Affymetrix), followed by in vitro transcription using aGene chip IVT labeling kit (Affymetrix). The biotiny-lated cRNA was fragmented for hybridization to Affy-metrix cotton genome arrays and incubated at 45°Ctemperature for 16 h at 60 RPM in a hybridizationoven. Arrays were washed and stained on an AffymetrixFluidics Station 450. The arrays were scanned usingGene chip Scanner 3000. A summary of the image sig-nal data for every gene interrogated on the array wasgenerated using the Affymetrix MAS 5.0 (GCOS v1.3)statistical algorithm.
Microarray data analysisWe used Affymetrix Cotton Gene chip and Array AssistSoftware 5.2.2 (Agilent Technologies, Santa Clara, CA,USA) for comparative gene expression analysis. Raw celfiles were exported from GCOS® software using datatransfer tools for data processing and analysis in MeVand Array Assist Software 5.2.2 (Agilent Technologies,Santa Clara, CA, USA). Gene expression data analyseswere completed using a filtered RMA expression value[16]. Missing values were filtered, normalized, and nat-ural log2 transformed for biological replicates. The t-testwas used to determine the statistical significance of thedifferentially expressed gene. Probe IDs with detection pvalue ≤ 0.05 in three biological replicates were consid-ered as present. Expression of genes in watered condi-tion was compared between Vagad and RAHS-14 at pvalue ≤ 0.05 and fold Change (FC) ≥ 2.0. Similarlyunder drought stress condition expressed genes wereanalyzed between Vagad and RAHS-14. We have com-pared microarray data of Vagad and RAHS-14 in controland drought condition. Thus, when we indicate thegenes as uniquely expressed in Vagad that means theywere up-regulated in Vagad as compared to RAHS-14and thus those genes were down regulated in RAHS-14and vice a versa. The cRNA hybridization data weresubmitted according to MIAME guidelines, which wereaccessible through GEO series accession numberGSE26522 http://www.ncbi.nlm.nih.gov/geo/query/acc.cgi?acc=GSE26522. The statistical analyses were con-ducted by MeV and Array Assist [17].
Annotation analyses of cotton Gene chipDifferentially up-regulated genes were analyzed usingthe functional categorization based on three GO cate-gories at p-values ≥ 0.05. The agriGO tool http://bioinfo.cau.edu.cn/agriGO/ was used to perform theenrichment analysis using SEA (Singular EnrichmentAnalysis) coupled with available background data of cot-ton probes. Gene percentage analysis was calculated foreach agriGO annotation in the GO category. CottonGene chip annotation was based on the top hits againstthe Arabidopsis genome (from TAIR release 8) using
Ranjan et al. BMC Genomics 2012, 13:94http://www.biomedcentral.com/1471-2164/13/94
Page 3 of 18

the PLEXdb tool and the Arabidopsis Genome Initiativedatabases.
Double-strand cDNA library preparation for GS-FLXpyrosequencingTotal RNA (3 μg) from apical leaf tissue from both theaccessions were reverse transcribed using a T7-Oligo(dT) Promoter Primer in the first-strand cDNA synth-esis (Affymetrix). After RNase H-mediated second-strand cDNA synthesis, the double-stranded cDNA wasenriched and served as a template in the subsequent invitro transcription (IVT) reaction (Affymetrix). The IVTreaction was carried out in the presence of T7 RNAPolymerase (Affymetrix). The cRNA (3 μg) was reversetranscribed in the first-strand cDNA synthesis step byusing a random hexamer primer, followed by RNase H-mediated second-strand cDNA synthesis in replicates.The replicate samples were pooled and purified by theQIAquick PCR purification column (Qiagen) and thepurified samples were used for sequencing.
Emulsion-based clonal amplification and pyrosequencingDouble-strand cDNA was nebulized in a fragment sizebetween 400 and 600 bp. The fragmented cDNA wereamplified in aqueous droplets that were made throughthe creation of a PCR reaction mixture in emulsion oil.The droplets act as separate microreactors in which par-allel DNA amplifications are performed while yieldingapproximately 107 copies of a template per bead. Onemicroliter of emulsion containing approximately 1.8thousand beads was prepared. After PCR, the emulsionwas broken to release the beads containing the amplifiedDNA template. The beads carrying the templates wereenriched and deposited by centrifugation into openwells of a 70 × 70 mm2 optical picotiter plate. Thebeads containing a mixture of ATP sulfurylase and luci-ferase were loaded on the plates to generate light fromfree pyrophosphate to create the individual sequencingreactors in wells. The light generated from free pyro-phosphate was transmitted through the base of the opti-cal picotiter plate and detected by a large-format CCD.The images were processed to yield the sequenceinformation.
Assembly and annotation of transcriptomesAll sequence analyses was conducted using publiclyavailable software, such as R package http://www.R.pro-ject.org, MeV, and custom perl scripts. The quality-fil-tered reads were assembled at criteria of overlap size100 bp and percent identity 96% using the CAP3 pro-gram. To remove the redundancy within both libraries,blastN was used in both libraries against itself, and thepooled sequences had ≥ 90% identity over the length of75%. Only the largest sequence in each of these pools
was considered. Using these criteria, the sequencesobtained were called exemplars. The exemplarsequences for both libraries were tagged with the libraryname and pooled for annotation. For annotation, thepooled exemplars were queried against the NCBInucleotide database (NT) using blastN at evalue of 10-10
and an alignment length of more than 50% of the querysequence. All the Gossypium ESTs available at the NCBIdatabase were downloaded and pooled. The pooledexemplars were also queried against all public CottonEST databases to identify new transcripts of Gossypium.Roche’s GS-FLX sequence reads discussed in this articlecan be found in the Genebank http://www.ncbi.nlm.nih.gov/genbank of the National Center for Biotechnologywith accession number SRA029162.
ESTScan modelTo assign the orientation of the transcripts, all the pooledexemplar sequences were analyzed by the ESTScan Model,which is trained on Arabidopsis and Oryza models. Thesequences that passed the ESTScan model were translatedaccording to the frame decided by the ESTScan program.These protein sequences were annotated using the blastPprogram against the NR Uniprot and pfam databases, atevalue of 10-10, and an alignment length of at least 50% ofthe query length. Gene names were assigned to eachsequence based on the best blast hit.
GO analysesThe GO annotations for the sequences were derivedusing their Uniprot annotation. The Uniprot databasewas used, as it had extensive GO mapping. The GOannotation for level 5 was extracted for each library andused for further analysis.
Digital expression analysesFor the digital expression analysis, the reads for bothlibraries were tagged and pooled to form a large datasetof 141,722 reads. These reads were assembled using theCAP3 program at an overlap of 100 bp and 80% iden-tity. These reads were assembled into 17,752 contigs.Further, the contigs were filtered to include only thosethat have more than five reads. We calculated the R sta-tistics for the filtered genes to identify significant differ-entially expressing genes [18]. To reduce the falsediscovery rate, only genes with an R value > 9 were con-sidered. These filtered contigs were annotated usingblastN against the NCBI nucleotide (NT) database,blastX against the NCBI non-redundant proteins (NR)and the Uniprot database.
The Quantitative Gene Expression (QGE) analysesRecently, matrix-assisted lazer desorption ionizationtime of flight mass spectrometry (MALDI-TOF MS) was
Ranjan et al. BMC Genomics 2012, 13:94http://www.biomedcentral.com/1471-2164/13/94
Page 4 of 18

adopted for analyzing gene expression [19]. Each PCRreaction was performed with 1 μl diluted cDNA (0.025ng/μl), 0.5 μL 10x HotStar Taq PCR buffer, 0.2 μLMgCl2 (25 mM), 0.04 μL dNTP mix (25 mM each),0.02 μL HotStar Taq Polymerase (50 U/μL, Qiagen), 0.1μL competitor oligonucleotide (5 × 10⁻⁹ μM), 1 μL for-ward and reverse primer (1 μM each) (primers list,Additional file 1), and 2.14 μL ddH2O. The PCR condi-tion was as follows: 95°C for 15 min for hot start, fol-lowed by denaturing at 94°C for 20 sec, annealing at 56°C for 30 sec, extension at 72°C for 1 min for 45 cycles,and finally, incubation at 72°C for 3 min. Excess dNTPswere removed from PCR products with shrimp alkalinephosphatase. A mixture of 0.17 μLhME buffer (SEQUE-NOM), 0.3 μL shrimp alkaline phosphatase (SEQUE-NOM), and 1.53 μL ddH2O was added to each PCRreaction. The reaction solutions were incubated at 37°Cfor 20 min, followed by 85°C for 5 min to inactivate theenzyme. Base extension reaction was performed byusing 0.2 μL of selected ddNTPs/dNTP mixture(SEQUENOM), 0.108 μL of selected extension primer,0.018 μL of ThermoSequenase (32 U/μL, SEQUENOM),and 1.674 μL ddH2O. The reaction mixture was kept at94°C for 2 min, followed by 94°C for 5 sec, 52°C for 5sec, and 72°C for 5 sec for 40 cycles. The extended reac-tion product was purified with spectroCLEAN resin(SEQUENOME) to remove salts in the buffer, and 16μL resin/water solution was added into each base exten-sion reaction. Approximately 10 nL of purified reactionproduct was dispensed onto a 384-format SpectroCHIP(SEQUENOM). A modified Bruker Biflex MALDI-TOFmass spectrometer was used for data acquisitions fromthe SpectroCHIP. Mass spectrometric data were auto-matically imported into the SpectroTYPER (SEQUE-NOM) database for automatic analysis such as noisenormalization and peak area analysis.
ResultsAnalysis of drought tolerance in G. herbaceum L.accessionsG. herbaceum accessions were studied for drought toler-ance and sensitivity in three experiments: DT1, DT2,and DT3 (details in M&M). In the DT1 experiment, G.herbaceum accessions were subjected to mannitol stressin the screen for tolerance to osmotic stress. Among thedifferent accessions, Vagad showed 100% germination ofseeds in 6% of mannitol and 86% germination in 8% ofmannitol, but RAHS-14 showed only 12% germinationin 4% of mannitol and in the case of 6% and 8% of man-nitol, the seeds were not germinated at all (Table 1).Accession Gujcot-21 showed 82% and 66% germinationof seeds in 6% and 8% of mannitol concentrations,respectively. RAHS-IPS 187 showed only 16% germina-tion in 4% of mannitol, and seeds were not germinated
in 6% and 8% of mannitol. Germination of seeds of theremaining accessions was not affected by 4% of manni-tol, but a difference was observed at 6% and 8% of man-nitol concentrations. In DT2 experiments, thecotyledonary leaves of Vagad seedlings remained greenand turgid after seven days of water stress (Figure 1a),whereas RAHS-14 seedlings turned pale and exhibited adrooping effect (Figure 1b). In DT3 experiments, bothVagad and RAHS-14 showed prominent effect ofdrought stress. However, Vagad showed much betterdevelopment, less wilting and higher biomass as com-pared to RAHS-14 (Figure 1c, d), where as RAHS-14showed stunted growth of plants, more leaf wilting andpale leaves in response to drought stress (Figure 1e, f).In view of the contrasting response of Vagad and
Table 1 Screening of G. herbaceum accessions atdifferent concentrations of mannitol.
Mannitol percentage
Accessions Control 2% 4% 6% 8%
Vagad 100 100 100 100 86
Guj cot-21 100 100 100 82 66
RAHS-14 100 76 12 0 0
RAHS-IPS-187 100 100 16 0 0
H-17 100 100 84 62 14
AH-7GP 100 100 100 14 0
AH-127 100 100 100 22 4
AH-41 100 100 100 18 0
RAS-45 100 100 100 18 0
DB-3-12 100 100 100 64 30
RAHS-131 100 100 100 16 0
JYLEHAR 100 100 100 14 2
GH-18-2LC 100 100 100 86 22
RAHS-132 100 100 34 16 10
Fifty seeds were kept for germination at 2%, 4%, 6%, and 8% of mannitolconcentration in Hoagland media for fourteen different accessions of G.herbaceum. The percentage of seed germination was calculated after 2 weeksof growing seedlings
Figure 1 Effect of drought on cotyledonary stage and one-month-old plants of Vagad and RAHS-14 accessions, (A)Tolerant accession; and (B) Sensitive accession in cotyledonarystage withhold watering for one week; (C) Tolerant accessioncontinuous watering; (D) Tolerant accession; and (E) Sensitiveaccession of one-week alternate watering; (F) Sensitiveaccession continuous watering of one-month-old plants.
Ranjan et al. BMC Genomics 2012, 13:94http://www.biomedcentral.com/1471-2164/13/94
Page 5 of 18

RAHS-14, the two accessions were subjected to furtherphysiological and molecular investigation.
Analyses of various physiological parameters in responseto droughtMeasurement of gas exchange parameters under irri-gated conditions (control) showed marginal differencesin the A and gs in Vagad and RAHS-14 with RAHS-14showing slightly higher A and gs (Figure 2a, b). How-ever, after 10 days of drought, Vagad showed a sharpdecrease in A (> 50%), gs (> 75%), and E (> 60%),whereas in RAHS-14, insignificant differences wereobserved. In RAHS-14, the E was 25% higher than thatin Vagad in control plants and further increased aftermoderate drought (Figure 2c). The WUE was 20% morein Vagad as compared with the RAHS-14 irrigated con-dition and decreased under moderate drought in boththe accessions (Figure 2d). Unlike A, the RD was lowerin Vagad compared with that in RAHS-14 and slightlydecreased (10%) after moderate drought, but in RAHS-
14, the RD was increased almost 2 fold after 10 days ofdrought (Figure 2f). Vagad showed substantially higherthermal dissipation (NPQ) under irrigated and moderatedrought conditions as compared with RAHS-14 (Figure2e). Predawn water potential in both the accessions wassimilar, but RWC was higher in RAHS-14 leaves ascompared with Vagad in irrigated and water-stressedplants (Figure 2g). Both the accessions showed contrast-ing results for various physiological parameters undermoderate drought conditions; however, when the stresswas continued further for 30 days, we observed thatboth accessions have a similar response to severedrought, except for RWC and predawn water potential.Under severe drought conditions, both the accessionsshowed a substantial increase in water potential: Vagadshowed a 5-fold increase, whereas RAHS-14 showed a10-fold increase in water potential, but RWC wasdecreased by only 10% (Figure 2g). Leaf dehydrationcurves for Vagad and RAHS-14 are shown in Figure 3a,b. The initial sharp drop of curves represents the stoma-tal transpiration that was closing during leaf dehydra-tion. The steady-state decline under the irrigatedcondition in both the accessions exhibited a similarslope; however, as drought progressed, the slope in
Figure 2 Effect of moderate and severe drought on (A)Photosynthesis (A, μmol m-2 s-1); (B) stomatal conductance (gs,mmol m-2 s-1); (C) transpiration rate (E, mmol m-2 s-1); (D)water use efficiency (WUE mmol CO2 mol H2O m-2 s-1); (E) non-photochemical quenching; (F) dark respiration (RD μmol m-2 s-1); (G) relative water content (RWC %); and (H) predawn waterpotential (ψpre MPa) in Vagad (Black bars) and RAHS-14 (graybars). Data are given as mean values ± n = 5.
Figure 3 Effect of moderate (○) and severe drought (●) on leafdehydration curve in comparison to irrigated plants (▼) of (A)Vagad and (B) RAHS-14 accessions.
Ranjan et al. BMC Genomics 2012, 13:94http://www.biomedcentral.com/1471-2164/13/94
Page 6 of 18

Vagad remained the same under moderate drought andthen decreased under severe drought, whereas in RAHS-14, the slope remained constant under irrigated anddrought conditions.
Transcriptional profiling during drought and irrigatedconditions in Vagad and RAHS-14We used Affymetrix microarray and cotton chip forcomparative expression profiling of leaves of irrigatedand water-stressed plants of Vagad and RAHS-14 at a pvalue ≤ 0.05 and a fold change (FC) ≥ 2.0. We identified656 and 535 genes as being differentially up-regulated inVagad and RAHS-14, respectively, during the irrigatedcondition (Additional files 2 and 3). Similarly, 430 and411 genes were differentially up-regulated in Vagad andRAHS-14, respectively, under the drought condition(Additional files 4 and 5). These differentially up-regu-lated genes were further annotated through the SEA(Singular Enrichment Analysis) method and identifiedenriched gene ontology (GO) terms. We consideredonly those GO terms that had been enriched at leasttwice over background cotton data and observed varioussignificant differences in the metabolic pathways in bothsensitive and tolerant accession.
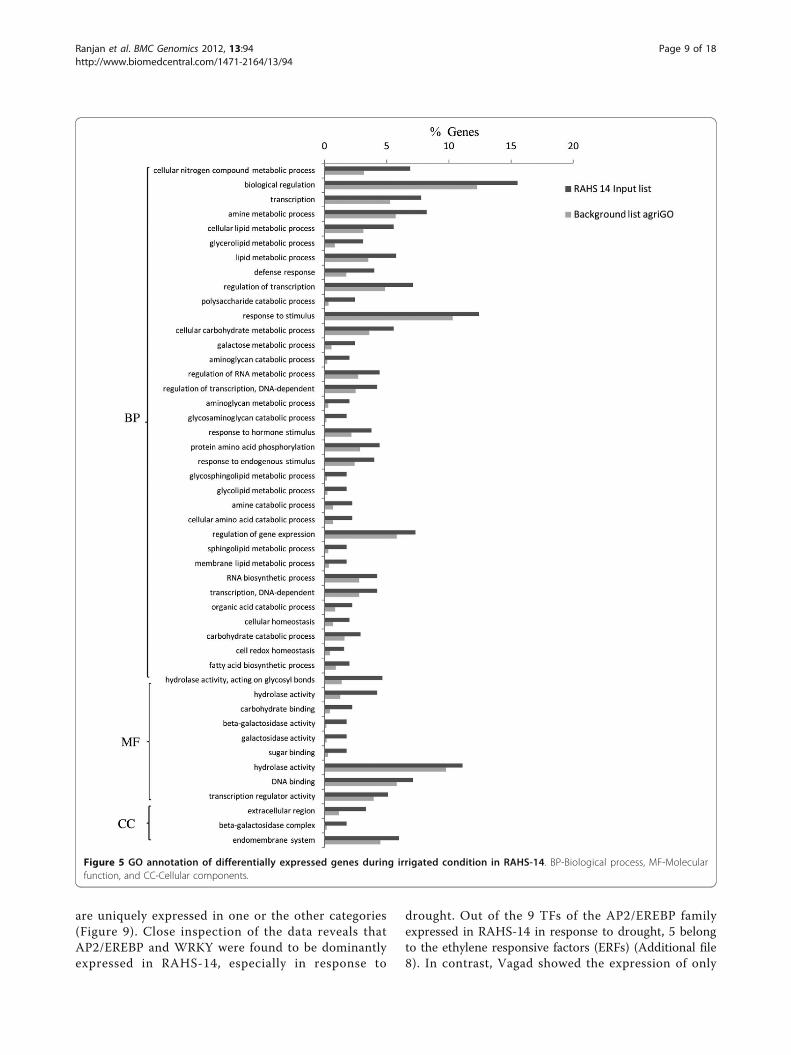
Singular Enrichment Analysis (SEA) for identification ofenriched GO terms in Vagad and RAHS-14 duringirrigated conditionGene ontology using the SEA method revealed distinctdifferences in the overall metabolism of Vagad andRAHS-14 even under the irrigated condition. Vagad hasmany enriched biological processes compared withRAHS-14 (Figure 4). The phenyl propanoid pathwaysleading to coumarin and similarly, a lignin biosynthesisflavonoid pathway leading to polyketide biosynthesissuch as stilbene biosynthesis were enriched during theirrigated condition in Vagad (Figure 4). Genes werefurther mapped to the KEGG metabolic pathway ofthese processes (Additional files 6 and 7). Other biologi-cal processes such as ketone biosynthesis, pigmentmetabolism, and reductive pentose phosphate were alsoenriched in Vagad during the irrigated condition. Inmolecular functions and cellular components, variousmembrane transporters, ligases, chalcone synthase, gly-ceraldheyde-3-phosphate dehydrogenase, oxidoreductase,and negative regulation of transcription-related activitieswere enriched in Vagad (Figure 4). In RAHS-14, in con-trast to Vagad, various biological processes such asmembrane lipid metabolism involving fatty acid bio-synthesis, glycolipid, sphingolipid, and glycosaminogly-can metabolism-related processes were enriched (Figure5). RAHS-14 also invests its energy in carbohydratemetabolism, various homeostasis-related processes,defense response, auxin metabolism, and root-
development-related biological processes (Figure 5). InRAHS-14, molecular function and cellular componentswere enriched with various activities such as hydrolases,beta-galactosidase, lipases, and esterases.
Singular Enrichment Analysis (SEA) for identification ofenriched GO terms in Vagad and RAHS-14 during droughtconditionVagad showed the various biological processes that areinvolved in the phenyl propanoid pathway, flavonoidpathway, pigment metabolism, polyketide biosynthesis,coumarins, and lignin biosynthesis enriched duringdrought as observed during the irrigated condition (Fig-ures 4 and 6). In addition, Vagad showed the negativeregulation of various forms of cellular biosynthesis andmetabolism during the drought condition. Further biolo-gical processes involved in response to various stimuli,auxin response, response to light intensity, heat and jas-monic acids, plant cell wall organization, lipid transport,and lipid organization were enriched in Vagad. RAHS-14 showed various biological processes leading to senes-cence, whereas ABA response and cell death, responseto various pathogens, immune response, and responseto various hormones were enriched during the droughtcondition (Figure 7).
Abiotic-stress-related process analysis of differentiallyexpressed genesGene ontology enrichment analysis http://bioinfo.cau.edu.cn/agriGO/ was performed using an FDR-adjustedp-value of ≤ 0.05 as the cutoff. The distribution of abio-tic-enriched GO terms showed several noteworthy find-ings. In Vagad, almost all the abiotic responses werehigher compared with RAHS-14 in irrigated as well asin drought conditions (Figure 8). The significantlyenriched GO terms, including response to abiotic stimu-lus (GO: 0009651, FDR p-value = 1.40E-03), response tostress (GO: 0009737, FDR p-value = 3.40E-04), responseto stimulus (GO:0009723, FDR p-value = 1.40E-04),response to inorganic substances (GO:0042542,FDR p-value = 0.00018), and response to salt stress(GO:0006950, FDR p-value = 4.2e-05) showed a signifi-cantly higher level in Vagad compared with RAHS-14.The results indicate that the inherent preparedness andresponsiveness of Vagad toward drought stress wasmuch higher as compared with RAHS-14.
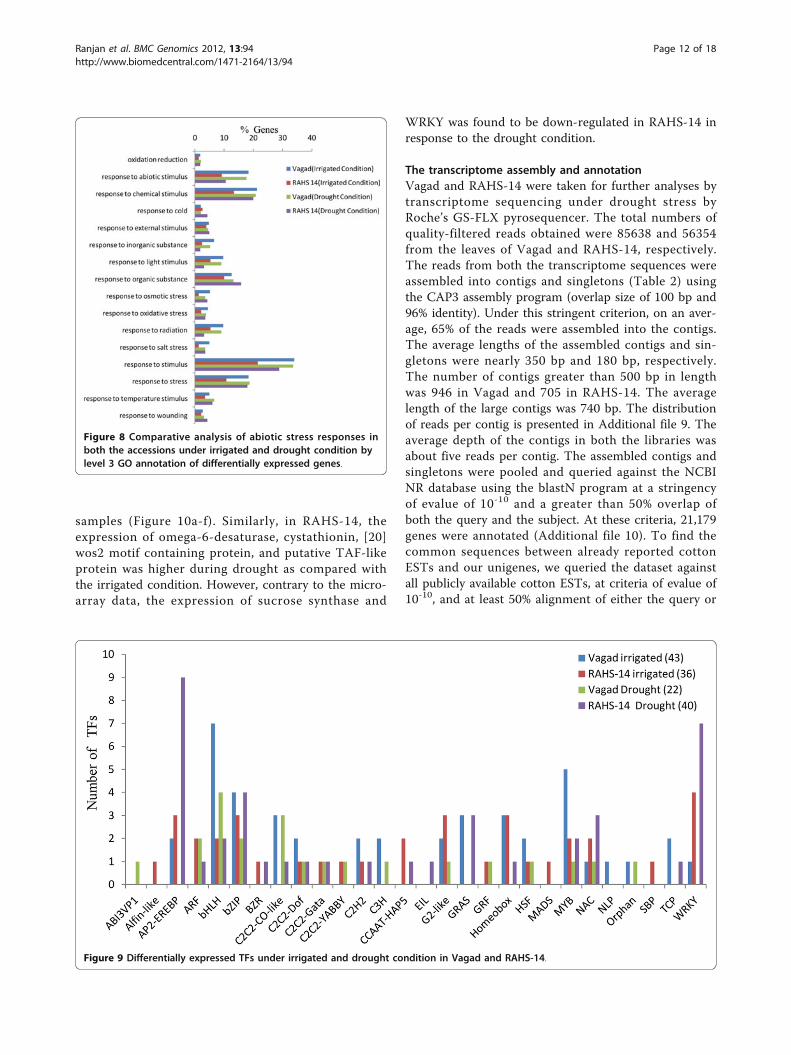
RAHS-14 responds to drought by uniquely expressingERFs (AP2/EREBP) and WRKYNext, we examined differentially the transcription fac-tors (TFs) expressed in Vagad and RAHS-14 under theirrigated and drought conditions. The homologous locusIDs corresponding to the differentially expressed genesin Vagad and RAHS-14 were queried against the AGRIS
Ranjan et al. BMC Genomics 2012, 13:94http://www.biomedcentral.com/1471-2164/13/94
Page 7 of 18

database http://arabidopsis.med.ohio-state.edu/AtTFDB/.In the irrigated condition, Vagad and RAHS-14 showeda similar number uniquely expressing TFs, being 43 and36, respectively (Figure 9); however, in the drought
condition, the number uniquely expressing TFs inRAHS-14 was almost double (40) as compared withVagad (22). The TFs representing all the four categoriesbelong to 28 different classes of TFs, and some of them
Figure 4 GO annotation of differentially expressed genes during irrigated condition in Vagad. BP-Biological process, MF-Molecularfunction, and CC-Cellular components.
Ranjan et al. BMC Genomics 2012, 13:94http://www.biomedcentral.com/1471-2164/13/94
Page 8 of 18
are uniquely expressed in one or the other categories(Figure 9). Close inspection of the data reveals thatAP2/EREBP and WRKY were found to be dominantlyexpressed in RAHS-14, especially in response to
drought. Out of the 9 TFs of the AP2/EREBP familyexpressed in RAHS-14 in response to drought, 5 belongto the ethylene responsive factors (ERFs) (Additional file8). In contrast, Vagad showed the expression of only
Figure 5 GO annotation of differentially expressed genes during irrigated condition in RAHS-14. BP-Biological process, MF-Molecularfunction, and CC-Cellular components.
Ranjan et al. BMC Genomics 2012, 13:94http://www.biomedcentral.com/1471-2164/13/94
Page 9 of 18

two AP2/EREBP TFs in the irrigated condition belong-ing to the CRF2 and RAP2.4 class; however, in neitherthe irrigated nor the drought condition, Vagad showedexpression of ERFs. The other most contrasting TFs
family found to be dominantly expressing RAHS-14 inthe irrigated (4) and drought (7) conditions was WRKY.In Vagad, bHLH and MYB were the two major TFsfamilies found to be dominantly expressing in the
Figure 6 GO annotation of differentially expressed genes during drought condition in Vagad. BP-Biological process and MF-Molecularfunction.
Ranjan et al. BMC Genomics 2012, 13:94http://www.biomedcentral.com/1471-2164/13/94
Page 10 of 18

irrigated condition. Thus, differences in the expressionof the unique TFs families in Vagad and RAHS-14 mayreflect the manner in which these two accessions differin their response to drought.
Validation of identified significant genes by quantitativegene expression (QGE)The six genes identified by microarray analysis as beingcommonly up-regulated during the drought condition
are omega-6-desaturase, sucrose synthase, cystathionin,wos2 motif containing protein, putative TAF-like pro-tein, and a WRKY transcription factor, and they werevalidated using Quantitative Gene Expression (QGE)assay using SEQUENOM (see M&M). The QGE wasperformed with three biological replicates for Vagad andRAHS-14 on drought and irrigated samples. The expres-sions of all the six genes were significantly higher inVagad during drought as compared with the irrigated
Figure 7 GO annotation of differentially expressed genes during drought condition in RAHS-14. BP-Biological process, MF-Molecularfunction, and CC-Cellular components.
Ranjan et al. BMC Genomics 2012, 13:94http://www.biomedcentral.com/1471-2164/13/94
Page 11 of 18
samples (Figure 10a-f). Similarly, in RAHS-14, theexpression of omega-6-desaturase, cystathionin, [20]wos2 motif containing protein, and putative TAF-likeprotein was higher during drought as compared withthe irrigated condition. However, contrary to the micro-array data, the expression of sucrose synthase and
WRKY was found to be down-regulated in RAHS-14 inresponse to the drought condition.
The transcriptome assembly and annotationVagad and RAHS-14 were taken for further analyses bytranscriptome sequencing under drought stress byRoche’s GS-FLX pyrosequencer. The total numbers ofquality-filtered reads obtained were 85638 and 56354from the leaves of Vagad and RAHS-14, respectively.The reads from both the transcriptome sequences wereassembled into contigs and singletons (Table 2) usingthe CAP3 assembly program (overlap size of 100 bp and96% identity). Under this stringent criterion, on an aver-age, 65% of the reads were assembled into the contigs.The average lengths of the assembled contigs and sin-gletons were nearly 350 bp and 180 bp, respectively.The number of contigs greater than 500 bp in lengthwas 946 in Vagad and 705 in RAHS-14. The averagelength of the large contigs was 740 bp. The distributionof reads per contig is presented in Additional file 9. Theaverage depth of the contigs in both the libraries wasabout five reads per contig. The assembled contigs andsingletons were pooled and queried against the NCBINR database using the blastN program at a stringencyof evalue of 10-10 and a greater than 50% overlap ofboth the query and the subject. At these criteria, 21,179genes were annotated (Additional file 10). To find thecommon sequences between already reported cottonESTs and our unigenes, we queried the dataset againstall publicly available cotton ESTs, at criteria of evalue of10-10, and at least 50% alignment of either the query or
Figure 8 Comparative analysis of abiotic stress responses inboth the accessions under irrigated and drought condition bylevel 3 GO annotation of differentially expressed genes.
Figure 9 Differentially expressed TFs under irrigated and drought condition in Vagad and RAHS-14.
Ranjan et al. BMC Genomics 2012, 13:94http://www.biomedcentral.com/1471-2164/13/94
Page 12 of 18

the subject. This leads to identification of 30,133sequences matching to the cotton ESTs (Additional file11); 4946 sequences did not have any match to the cot-ton ESTs and could be novel sequences specific to G.herbaceum. For assessing the full-length transcripts, the
pooled contigs and singlets that comprised the unigenedataset were screened using the ESTScan program. BothOryza and Arabidopsis gene models were used to trainthe program (Additional file 12). Out of the total uni-gene datasets, the numbers of the gene models obtainedwere 16,283 in Vagad and 14,885 in RAHS-14. Both thelibraries were annotated by the blastX program againstthe Uniprot database, at criteria of 50% alignmentlength, and evalue of 1 × 10⁻¹⁰ (Additional file 13; work-sheet 1 and 2). The ESTScan passed 32.9% genes andwas annotated using a Uniprot database. Approximately20% of the large contigs from both the libraries wereunannotated when compared against the Uniprot andNCBI NR database.
GO annotation of transcriptomeThe GO annotation was obtained from the Uniprotaccession numbers, and GO classification for five levelswas obtained. The GO annotation was plotted for levelthree from both the libraries (Figure 11). For most ofthe categories, the gene counts were similar in both thelibraries. However, genes related to catalytic activity,binding, cellular and metabolic processes were signifi-cantly higher in Vagad, whereas GO categories, such asresponse to stimulus, reproductive processes, reproduc-tion, multi-organism processes, multi-cellular organism
Figure 10 Gene expression profiling of up-regulated genes in microarray analysis, validated by quantitative gene expression (QGE)during irrigated and drought condition in both the accessions. (A) Omeg-6-desaturase; (B)Sucrose synthase; (C) Cystathionine; (D) Wos 2motif; (E) TBP-associated factor; and (F) WRKY DNA binding domains. SD represents RAHS-14 in drought, and SW represents the irrigatedcondition. TD represents Vagad under drought, and TW represents the irrigated condition.
Table 2 Summary of 454 transcriptome sequencing datagenerated for Vagad and RAHS-14 of G. herbaceumleaves transcriptome and assembly
Parameters Vagad RAHS-14
Total reads (overlap size of 100 bp and 96% identity)a 85368 56354
Total contigs (100 bp or greater)b 11439 6313
Singleton 24087 20780
Exemplar 31244 23155
Average length of contigs 350bp
180 bp
Number of contigs with greater than 500 bp 946 705cNumber of genes with significant hits in NCBI NRdatabase
10772 10408
dNumber of genes with significant hits in cotton ESTdatabase
16301 13822
aTotal number of reads separated for both transcriptome libraries. bContigsgenerated by CAP3 assembly. cContigs showing significant hits (evalue 10-10
and ≥ 50% overlap) in the NCBI database. dContigs showing significant hits (evalue 10-10, and ≥ 50% alignment of either the query or the subject) in thecotton EST database
Ranjan et al. BMC Genomics 2012, 13:94http://www.biomedcentral.com/1471-2164/13/94
Page 13 of 18

processes, developmental processes, and organelle parts,were significantly higher in RAHS-14.
Differential gene expression analyses of transcriptomesFor differential expression analysis of the genes in boththe transcriptome libraries, the reads from both thelibraries were tagged and pooled to form one large data-set that was assembled into contigs using the CAP3 pro-gram (overlap length ≥ 100 bp and 80% identity). The1,41,722 reads clustered into 17,752 contigs and resultedin 13,586 genes for the expression analysis. Significantchanges in gene expression were calculated using R sta-tistics (R value ≥ 9) (Additional file 14) and resulted in2,026 genes, which seemed to be differentially regulated,and their differential expression was analyzed usingPearson uncentered correlation [18]. Differentiallyexpressed genes were annotated using the NCBI NRdatabase (50% alignment length, evalue of 1 × 10⁻¹⁰).For each contig, the counts were converted to tran-scripts per million, which was transformed [log2 (foldchange values)], and their ratio was calculated for fold
changes between drought-tolerant and drought-sensitivetissues. A total of 275 contigs showed a very highexpression in Vagad with nearly 49% (137) showing nohits to any proteins in the database (NR, NT, and Uni-prot), and 10% genes were either hypothetical or puta-tive expressed proteins, as they showed significantchanges in expression. The remaining genes such asascorbate peroxidase, cysteine protease, delta tonoplasticintrinsic proteins, LEA proteins, and so on that wererelated to drought stress were up-regulated (Additionalfile 15 worksheet 1). In RAHS-14, out of 484 genes,only 80 (15%) showed no hits to any protein or nucleo-tide in the database (NR and NT), and 18% werehypothetical proteins. The remaining 36% annotatedgenes were from the photosynthesis pathway, with ahigh expression of Rubisco activase, photosystem II D,and chlorophyll a\b binding proteins. The senescence-associated proteins constituted about 4% of the differen-tially expressed genes. Other up-regulated genes werecytochrome p450, heat shock protein 90, methioninesynthase, and so on (Additional file 15 worksheet 2).
Figure 11 GO-based annotation of the transcriptome analysis of Vagad and RAHS-14 under drought stress.
Ranjan et al. BMC Genomics 2012, 13:94http://www.biomedcentral.com/1471-2164/13/94
Page 14 of 18

DiscussionTo analyze the differences in the drought tolerance ofthe G. herbaceum accessions at physiological and mole-cular levels, the plants were exposed to moderate andsevere drought stress. It was observed that Vagad andRAHS-14 showed substantial differences in several phy-siological parameters and relative gene expression inresponse to drought. Vagad responded to moderate andsevere drought by a gradual decline in A, gs, and E and,thus, has better WUE (Figure 2). In contrast, RAHS-14had higher A and gs and, thus, lower WUE, which con-tinued under moderate drought and then declinedunder severe stress (Figure 2a-d). In Vagad, earlier sto-matal closure (Figure 2b) provides a large safety marginagainst embolism formation as observed in several spe-cies [20-22]; rather, plants are capable of pre-emptingthe water stress-induced xylem cavitation by closingtheir stomata [23-25]. Further, a reduction in A and ahigher NPQ in Vagad accession under drought stresssuggested that stress had been imposed and hypothe-sized that antioxidant defense systems and secondarymetabolic pathways would have been enhanced inresponse. Indeed, our microarray expression analysisresults showed that in Vagad, various primary and sec-ondary metabolic pathways were enhanced (Figure 5).Flavonoid biosynthesis pathways especially lead to theformation of xanthophyll and finally convert it intoanthocyanin, antheraxanthin, and zeaxanthin, whichallows the quenching of excess energy from chlorophyllbefore it reaches reaction centers [26]; the transcriptrepresenting flavonoid biosynthesis pathways was foundto be enriched in Vagad (Figure 5). In contrast, thexanthophyll-cycle conversion state was lower in RAHS-14 (Figure 2e and Additional file 7). Concurrent to phy-siological data, transcriptome analysis showed a higherexpression of the vitamins metabolic process, such as a-tocopherol in Vagad (Additional file 13; worksheet 1).The a-tocopherol is a powerful antioxidant that sca-venges and prevents the formation of free radicals andprevents lipid peroxidation, thereby resulting in damageto thylakoid and chloroplast membranes [27]. Besidesflavonoid pathways in Vagad, various other metabolicpathways, including polyketide biosynthesis, phenyl pro-panoid biosynthesis, and shikimate pathways, synthesizeprotective molecules such as stilbene, coumarins, andligninis and are enriched in Vagad, which might help inthe detoxification of free radicals and give an advantageto Vagad for surviving in drought stress (Figure 4).These secondary metabolites, particularly phenylpropa-noid, were widely reported for their multiple function inresponse to various forms of environmental stress [28].The genes related to the shikimate and phenylpropanoidpathways have been reported to express a higher level in
drought-tolerant tomato cultivars (Solanum lycopersi-cum L.) as compared with drought-sensitive tomato cul-tivars [29]. In RAHS-14, the lipid metabolism processeswere significantly higher (Figure 5). In water-deficit con-ditions, the membranes are the main targets of thedegradative process, resulting in the formation of polarand non-polar lipid molecules [27]. Thus, the higherlipid metabolic processes in RAHS-14 probably reflecthigher membrane degeneration and, hence, the necessityof higher lipid metabolism for membrane homeostasiscorrelated with their susceptibility of drought stress.Vagad, in contrast to RAHS-14, maintained lipid meta-bolism and membrane integrity to resist the droughtstress. RAHS-14 showed a higher expression of genesrelated to nucleic acid (DNA/RNA) metabolism, whereasthe expression of these genes remains unchanged inVagad (Additional file 5 and Figure 6). Higher nucleicacid metabolism in RAHS-14 might show an interestingmechanism related to the energy state of the cell that isrepresented by the salvage pathways [30]. Phosphoribo-syl-1-pyrophosphate, a key intermediate component forthe synthesis of ribose-5-phosphate in nucleic acidmetabolism, showed higher expression in RAHS-14 asrepresenting the operation mechanism of salvage path-ways and helps RAHS-14 keep the energy pools frombeing used up too quickly (Additional file 13; worksheet2). It indicated that RAHS-14 responds to drought byinducing energy-consuming processes, whereas Vagadhas various inherent primary and secondary metabolicprocesses that maintain growth, albeit slow even underdrought. This is further evident from dark respiration(R) data which show that R declined in Vagad andincreased in RAHS-14 during drought (Figure 2h).Many genes that were up-regulated in response todrought stress in Vagad are reported to be involved inmultiple mechanisms that may contribute to droughttolerance (Additional files 4 and 15, worksheet 1). Forexample, Aquaporins (AQP), a water-selective channelprotein, known to mediate and regulate rapid trans-membrane water flow during a wide range of stressresponse, stomatal movement, and water channel move-ments, was expressed at a higher level in Vagad (Addi-tional file 4) [31]. Similarly, many tonoplastic intrinsicproteins (TIPs) from maize, Arabidopsis, and radish areknown to control water exchange between cytosol andvacuole in salt stress and drought stress [32] and thesegenes were expressed at a higher level in Vagad (Addi-tional file 4). DnaJ heat shock protein/chaperone andDelta 1-pyrroline-5-carboxylate synthase 2 (P5CS2),which enhance root biomass, flowering, and seed settingduring abiotic stress [33], were expressed at a higherlevel in Vagad (Additional files 2 and 3). Yet another sig-nificantly induced gene in Vagad was the ERF/AP2-type
Ranjan et al. BMC Genomics 2012, 13:94http://www.biomedcentral.com/1471-2164/13/94
Page 15 of 18

transcription factor (RAP2.1), which was reported to beinduced in drought and cold via an ABA-independentpathway [34]. RAHS-14 expressed more senescence-related genes, whereas we found that in Vagad, genesrelated to alcohol dehydrogenase and late embryogenesisprotein 5 was expressed at a higher level (Additional files5 and 15). Previous studies indicate that the accumula-tion of late embryogenesis abundant proteins and alcoholdehydrogenase (Adh) gene are correlated with stress tol-erance [35,36]. The significant up-regulation of LEA andAdh genes in Vagad in drought stress suggests that thesegenes play an important role in conferring drought toler-ance, whereas RAHS-14 tends toward the senescenceduring drought stress. Several transcription families weresignificantly and differentially expressed in both theaccessions. Ethylene-responsive element binding factors(ERFs) are members of a novel family of transcriptionfactors that are specific to plants and which regulatenuclear gene expression under various stress conditions.Six different members homologous to the ArabidopsisERF family (At1g19210; At1g28360; At4g34410;At5g44210; At5g47220; At5g47230) were expressedexclusively in RAHS-14 under drought stress. Theexpression of ERF in RAHS-14 in the drought conditionindicates that RAHS-14 responds to drought mainly bythe ethylene pathway, thereby leading to senescence.This relates well with transcriptome data showing ahigher level of senescence-related transcripts in RAHS-14. In Vagad, these AP2/EREBP TFs belong to the Cyto-kinin Response Factors (CRF2) class (At1g78080;At4g23750). CRFs function redundantly to regulate thevarious metabolic functions, including transpiration, sto-matal conductance, and respiration [37,38]. Further, inRAHS-14, seven (At1g29860; At1g80840; At2g23320;At2g24570; At2g38470; At3g56400; At4g24240) and four(At1g80840; At2g47260; At4g24240; At5g49520) WRKYtranscription factors were found to be uniquely expressedin drought and irrigated conditions, respectively. Previousreports showed that abscisic acid and salicylic acid havebeen involved in the WRKY-mediated hormone signalpathway during abiotic and biotic stress [39]. Their pre-cise role in the abiotic stress response regulatory networkis not fully understood [40]. In contrast, the MYC-typebHLH transcription factor, which regulates the expres-sion of CBF3/DREB1A in abiotic stress, was enriched inVagad, which suggests the involvement of the MYC-typebHLH transcription factors in the expression of CBF/DREB1 genes in Vagad but less involvement in RAHS-14[41]. Interactions between CBF/DREB1 genes and bHLHTFs and their involvement in various oxidative-mediatedprocesses justify their presumed roles as regulators ofdrought response in Vagad. Other members of TFs, suchas bZIP (At2g46270; At4g34590; At5g24800) and GRASfamilies (At5g48150; At5g52510; At5g66770), were
expressed in higher numbers in Vagad; the regulatoryroles of these TFS have been reported in stress responsesin plants. The GO-based analysis of both the transcrip-tome libraries revealed many metabolic processes andresponses to various forms of abiotic stress that were spe-cific to Vagad and RAHS-14 (Figure 11). The shift in theprocesses toward reproductive growth and senescence inRAHS-14 clearly showed that they had crossed thethreshold of stress and were proceeding toward senes-cence. The up-regulation of several metallothioneins,lipid transfer proteins, lea proteins, sucrose synthase, andso on in Vagad showed the induction of defense andstress-related genes to combat drought stress. In addi-tion, the down-regulation of many photosynthesis-relatedgenes during drought stress (Additional file 15 worksheet2) can be attributed to the conservation of energy for thesurvival in drought stress. The up-regulation of genessuch as aquaporins, lea, and metallothioneins may haveplayed a major role in imparting tolerance to Vagad.
We further compared differentially expressed genesobtained by microarray and contigs obtained in tran-scriptomic data using Pearson uncentered correlation. Atotal 167 differentially expressed genes obtained inmicroarray showed very high Pearson correlation coeffi-cient of 0.845 with transcriptomic contigs obtainedunder drought stress condition (Additional file 16). Outof these 167 differentially expressed genes, 78 and 48genes were uniquely represented in Vagad and RAHS-14 respectively under drought stressed condition.Uniquely represented genes under drought stress inVagad were mainly involved in synthesis of membraneand cytoskeleton associated proteins, oxidoreductases,kinases, heat shock proteins, sugar alcohols and second-ary metabolites like, cumurin and stilbene. Similarly inRAHS-14, these genes were mainly associated with tran-scription factors (viz, WRKY, AP2, WD40, Zinc fingerand ERF), senescence associated proteins, ethylene andauxin responsive elements (Additional file 17). The GObased analysis of these 167 genes revealed many pro-cesses that were specific to Vagad and RAHS-14. Theupregulation of pyrroline-5- carboxylase, ATPase, inosi-tol etc. (Additional file 17) in Vagad may have played amajor role in imparting drought tolerance. In RAHS-14higher numbers of these genes were involved in senes-cence and ethylene mediated signaling which clearlyindicate the RAHS- 14 crossed the threshold of droughtstress and are proceeding towards senescence (Addi-tional file 15). Thus both the method in an unbiasedway identifies same mechanistic model operating fordrought responsiveness in Vagad and RAHS 14.
ConclusionWe conclude that drought-tolerant accessions such asVagad must have developed multiple mechanisms as
Ranjan et al. BMC Genomics 2012, 13:94http://www.biomedcentral.com/1471-2164/13/94
Page 16 of 18
adaptive behavior against drought. These mechanismsare interlinked and probably cannot be seen in isolation;understanding these mechanisms will be helpful fordeveloping our future drought-tolerant varieties.
Additional material
Additional file 1: List of primers for QGE assay. Excel file containingall primer sequences used for the QGE experiment.
Additional file 2: Annotation and fold change (fold change > = 2)of up-regulated unique genes in Vagad during irrigated condition.Excel file containing the list of unique up-regulated genes of Vagadduring irrigated condition.
Additional file 3: Annotation and fold change (fold change > = 2)of up-regulated unique genes in RAHS-14 during irrigatedcondition. Excel file containing the list of unique up-regulated genes ofRAHS-14 during irrigated condition.
Additional file 4: Annotation and fold change (fold change > = 2)of up-regulated unique genes in Vagad during drought stress. Excelfile containing the list of unique up-regulated genes of Vagad duringdrought condition.
Additional file 5: Annotation and fold change (fold change > = 2)of up-regulated unique genes in RAHS-14 during drought stress.Excel file containing the list of unique up-regulated genes of RAHS-14during drought condition.
Additional file 6: Phenylpropanoid biosynthesis pathways analysisby KEGG using differentially up-regulated genes in Vagad indrought condition. JPEG image file containing the pathways mappingof phenylpropanoid biosynthesis from differentially up-regulated genesin Vagad in drought condition. Red color highlighted steps in pathwaysshow involvements of genes in pathways from input gene list.
Additional file 7: Flavonoid biosynthesis pathways analysis by KEGGusing differentially up-regulated genes in Vagad in droughtcondition. JPEG image file containing the pathway mapping offlavonoid biosynthesis from differentially up-regulated genes in Vagad indrought condition. Red color highlighted steps in pathways showinvolvements of genes in pathways from input gene list.
Additional file 8: Analysis of differentially expressed TFs. Excel filecontaining the summary result of expressed TFs number in both theaccessions under drought and irrigated condition. Arabidopsis homologIDs were mapped from TAIR10.
Additional file 9: Histogram of frequency of the number of readsassembled in contigs. In JPEG image file, X-axis represents the numberof reads, and Y-axis represents the number of genes. The color codeindicates the contigs of Vagad and RAHS-14.
Additional file 10: BlastN analysis of both transcriptome contigsand singlets against the NCBI NR database. Excel file containingsummary result of BLAST analysis and short description.
Additional file 11: BlastN analysis of both transcriptome contigsand singlets against publicly available Cotton EST sequences. Excelfile containing summary of BLAST analysis from cotton EST.
Additional file 12: Percentage of contigs passing the ESTScanmodel in both libraries. JPEG image showed the total number of ESTthat has passed through the ESTScan model.
Additional file 13: Uniprot analyses of Vagad and RAHS-14. Excel filecontaining uniprot analysis of Vagad in worksheet 1 and RAHS-14 inworksheet 2.
Additional file 14: Differentially expressing contigs that werefiltered by an R value of 9. Excel file containing differentially expressedcontigs in Vagad and RAHS-14 and EST counts.
Additional file 15: Fold change gene analysis by digitaltranscriptome of both the accessions. Excel file containing shortdescription and fold change of both the accessions. Worksheet 1
showed up-regulated contigs, and worksheet 2 showed down-regulatedcontigs in Vagad compared with RAHS-14.
Additional file 16: Correlation analysis between differentiallyexpressed genes obtained in microarray and contigs obtained fromtranscriptome sequencing. PPT file containing Pearson correlationgraph between microarray and contigs of transcriptome sequencing. Foreach contigs the counts were converted to transcripts per million whichwas then converted to log2 counts and their ratio was calculated forfold change between Vagad and RAHS-14.
Additional file 17: Annotation analysis of 167 gene obtained incorrelation analysis of microarray and transcriptomic contigs. Excelfile contacting detail analysis of differentially expressed genes obtainedin microarray correlated with transcriptomic contigs.
AbbreviationscDNA: Complementary deoxyribonucleic acid; IVT: In vitro-transcription;cRNA: Complementary ribonucleic acid; FC: Fold change; FDR: Falsedetection rate; SEA: Singular enrichment analysis; GO: Gene ontology; EST:Expressed sequence tag; QGE: Quantitative gene expression; CCD: Chargecouple device; WUE: Water use efficiency; RD: Dark respiration; NPQ:Nonphotochemical quenching; RWC: Relative water content.
AcknowledgementsWe thank Dr. S. S. Patil for providing accessions of G. herbaceum. AR and DNthanks to CSIR India for supporting fellowship as SRF. This work wassupported under CSIR supra institutional projects SIP03 and SIP05.
Author details1Council of Scientific and Industrial Research-National Botanical ResearchInstitute, Rana Pratap Marg, Lucknow 226001, UP, India. 2National Agri-FoodBiotechnology Institute, Department of Biotechnology, C-127, Industrial Area,S.A.S. Nagar, Phase 8, Mohali-160071, Punjab, India.
Authors’ contributionsAR carried out stress treatment and sample collection, design and executionof microarray, transcriptome sequencing, QGE analysis, data integration, anddrafted the manuscript. DN analyzed microarray data. MAH and SM analyzedtranscriptome data. RS and SR performed physiological experiment, UVPdesigned and monitor physiological and analyzed the data. NP helped indrafting and revising the manuscript. IT, KMR, SNJ and BK assisted in samplecollection, screening and other experimental help. SVS was responsible forthe overall concept, designing of problem and experiments, coordinationamong groups, data analysis and drafting and revising the manuscript. RTmentored the entire project, critical discussion and suggestions. All authorsread and approved the manuscript.
Competing interestsThe authors declare that they have no competing interests.
Received: 12 September 2011 Accepted: 16 March 2012Published: 16 March 2012
References1. Seki M, Umezawa T, Urano K, Shinozaki K: Regulatory metabolic networks
in drought stress responses. Curr Opin Plant Biol 2007, 10(3):296-302.2. Bartels D, Sunkar R: Drought and salt tolerance in plants. Crit Rev Plant Sci
2005, 24(1):23-58.3. Ingram J, Bartels D: The Molecular Basis of Dehydration Tolerance in
Plants. Annu Rev Plant Physiol Plant Mol Biol 1996, 47:377-403.4. Mangelsen E, Kilian J, Harter K, Jansson C, Wanke D, Sundberg E:
Transcriptome analysis of high-temperature stress in developing barleycaryopses: early stress responses and effects on storage compoundbiosynthesis. Molecular Plant 2011, 4(1):97-115.
5. Davey MW, Graham NS, Vanholme B, Swennen R, May ST, Keulemans J:Heterologous oligonucleotide microarrays for transcriptomics in a non-model species; a proof-of-concept study of drought stress in Musa. BMCGenomics 2009, 10(1):436.
Ranjan et al. BMC Genomics 2012, 13:94http://www.biomedcentral.com/1471-2164/13/94
Page 17 of 18

6. Guo P, Baum M, Grando S, Ceccarelli S, Bai G, Li R, von Korff M,Varshney RK, Graner A, Valkoun J: Differentially expressed genes betweendrought-tolerant and drought-sensitive barley genotypes in response todrought stress during the reproductive stage. J Exp Bot 2009,60(12):3531-3544.
7. Li YF, Zheng Y, Addo-Quaye C, Zhang L, Saini A, Jagadeeswaran G,Axtell MJ, Zhang W, Sunkar R: Transcriptome-wide identification ofmicroRNA targets in rice. The Plant Journal 2010, 62(5):742-759.
8. Wheat CW: Rapidly developing functional genomics in ecological modelsystems via 454 transcriptome sequencing. Genetica 2010, 138(4):433-451.
9. Wilkins TA, Arpat AB: The cotton fiber transcriptome. Physiol Plant 2005,124(3):295-300.
10. Barbazuk WB, Emrich SJ, Chen HD, Li L, Schnable PS: SNP discovery via454 transcriptome sequencing. Plant J 2007, 51(5):910-918.
11. Varshney RK, Nayak SN, May GD, Jackson SA: Next-generation sequencingtechnologies and their implications for crop genetics and breeding.Trends Biotechnol 2009, 27(9):522-530.
12. Wendel JF, Cronn RC: Polyploidy and the evolutionary history of cotton.Advances in Agronomy 2003, 78:139-186.
13. Kulkarni VN, Khadi BM, Maralappanavar MS, Deshapande LA, Narayanan SS:The Worldwide Gene Pools of Gossypium arboreum L. and G.herbaceum L., and Their Improvement. New York: springer; 20093.
14. Chen ZJ, Scheffler BE, Dennis E, Triplett BA, Zhang T, Guo W, Chen X,Stelly DM, Rabinowicz PD, Town CD: Toward sequencing cotton(Gossypium) genomes. Plant Physiol 2007, 145(4):1303-1310.
15. John S, Boyer RA: Passioura Osmotic adjustment leads to anomalouslylow estimates of relative water content in wheat and barley. Funct PlantBiol 2008, 35:1172-1182.
16. Irizarry RA, Hobbs B, Collin F, Beazer-Barclay YD, Antonellis KJ, Scherf U,Speed TP: Exploration, normalization, and summaries of high densityoligonucleotide array probe level data. Biostatistics 2003, 4(2):249-264.
17. Eisen MB, Spellman PT, Brown PO, Botstein D: Cluster analysis and displayof genome-wide expression patterns. Proc Natl Acad Sci USA 1998,95(25):14863-14868.
18. Stekel DJ, Git Y, Falciani F: The comparison of gene expression frommultiple cDNA libraries. Genome Res 2000, 10(12):2055-2061.
19. Ding C, Cantor CR: A high-throughput gene expression analysistechnique using competitive PCR and matrix-assisted laser desorptionionization time-of-flight MS. Proc Natl Acad Sci USA 2003,100(6):3059-3064.
20. Froux FHR, Ducrey M, Dreyer E: Xylem hydraulic efficiency versusvulnerability in seedlings off our contrasting Mediterranean tree species(Cedrusatlantica, Cupressus sempervirens, Pinushalepensis andPinusnigra). Ann For Sci 2002, 59:409-418.
21. Martínez-Vilalta J, Prat E, Oliveras I, Piñol J: Xylem hydraulic properties ofroots and stems of nine Mediterranean woody species. Oecologia 2002,133(1):19-29.
22. Pockman WT, Sperry JS: Vulnerability to xylem cavitation and thedistribution of Sonoran Desert vegetation. Am J Bot 2000,87(9):1287-1299.
23. Nardini A, Salleo S: Limitation of stomatal conductance by hydraulictraits: sensing or preventing xylem cavitation? Trees-Struct Funct 2000,15(1):14-24.
24. Cochard H, Coll L, Le Roux X, Améglio T: Unraveling the effects of planthydraulics on stomatal closure during water stress in walnut. PlantPhysiol 2002, 128(1):282-290.
25. Brodribb TJ, Holbrook NM: Stomatal closure during leaf dehydration,correlation with other leaf physiological traits. Plant Physiol 2003,132(4):2166-2178.
26. Park H, Kreunen SS, Cuttriss AJ, DellaPenna D, Pogson BJ: Identification ofthe carotenoid isomerase provides insight into carotenoid biosynthesis,prolamellar body formation, and photomorphogenesis. Plant Cell Online2002, 14(2):321-332.
27. Gigon A, Matos AR, Laffray D, Zuily-Fodil Y, Pham-Thi AT: Effect of droughtstress on lipid metabolism in the leaves of Arabidopsis thaliana (ecotypeColumbia). Ann Bot 2004, 94(3):345-351.
28. Dixon RA, Paiva NL: Stress-induced phenylpropanoid metabolism. ThePlant Cell 1995, 7(7):1085-1097.
29. Sánchez-Rodríguez E, Moreno DA, Ferreres F, Rubio-Wilhelmi MM, Ruiz JM:Differential responses of five cherry tomato varieties to water stress:
changes on phenolic metabolites and related enzymes. Phytochemistry2011, 72(8):723-729.
30. Dobrota C: Energy dependant plant stress acclimation. Rev Environ SciBiotechnol 2006, 5:243-251.
31. Gao Z, He X, Zhao B, Zhou C, Liang Y, Ge R, Shen Y, Huang Z:Overexpressing a Putative Aquaporin Gene from Wheat, TaNIP,Enhances Salt Tolerance in Transgenic Arabidopsis. Plant Cell Physiology2010, 51(5):767-775.
32. Forrest KL, Bhave M: Major intrinsic proteins (MIPs) in plants: a complexgene family with major impacts on plant phenotype. Funct IntegrGenomics 2007, 7(4):263-289.
33. Kishor P, Hong Z, Miao GH, Hu C, Verma D: Overexpression of [delta]-Pyrroline-5-carboxylate synthetase increases proline production andconfers osmotolerance in transgenic plants. Plant Physiol 1995,108(4):1387-1394.
34. Zhu Q, Zhang J, Gao X, Tong J, Xiao L, Li W, Zhang H: The ArabidopsisAP2/ERF transcription factor RAP2.6 participates in ABA, salt andosmotic stress responses. Gene 2010, 457(1-2):1-12.
35. Dalal M, Tayal D, Chinnusamy V, Bansal KC: Abiotic stress and ABA-inducible Group 4 LEA from Brassica napus plays a key role in salt anddrought tolerance. J Biotechnol 2009, 139(2):137-145.
36. Li Y, Zhu Y, Liu Y, Shu Y, Meng F, Lu Y, Bai X, Liu B, Guo D: Genome-wideidentification of osmotic stress response gene in Arabidopsis thaliana.Genomics 2008, 92(6):488-493.
37. Dodd IC: Hormonal interactions and stomatal responses. J Plant GrowthRegul 2003, 22(1):32-46.
38. Rivero RM, Shulaev V, Blumwald E: Cytokinin-dependent photorespirationand the protection of photosynthesis during water deficit. Plant Physiol2009, 150(3):1530-1540.
39. Cheong YH, Chang HS, Gupta R, Wang X, Zhu T, Luan S: Transcriptionalprofiling reveals novel interactions between wounding, pathogen,abiotic stress, and hormonal responses in Arabidopsis. Plant Physiol 2002,129(2):661-677.
40. Yun KY, Park M, Mohanty B, Herath V, Xu F, Mauleon R, Wijaya E, Bajic V,Bruskiewich R, de los Reyes B: Transcriptional regulatory networktriggered by oxidative signals configures the early responsemechanisms of japonica rice to chilling stress. BMC plant biology 2010,10(1):16.
41. Guo Y, Xiong L, Ishitani M, Zhu JK: An Arabidopsis mutation in translationelongation factor 2 causes superinduction of CBF/DREB1 transcriptionfactor genes but blocks the induction of their downstream targetsunder low temperatures. Proc Natl Acad Sci 2002, 99(11):7786-7791.
doi:10.1186/1471-2164-13-94Cite this article as: Ranjan et al.: Genome wide expression profiling oftwo accession of G. herbaceum L. in response to drought. BMC Genomics2012 13:94.
Submit your next manuscript to BioMed Centraland take full advantage of:
• Convenient online submission
• Thorough peer review
• No space constraints or color figure charges
• Immediate publication on acceptance
• Inclusion in PubMed, CAS, Scopus and Google Scholar
• Research which is freely available for redistribution
Submit your manuscript at www.biomedcentral.com/submit
Ranjan et al. BMC Genomics 2012, 13:94http://www.biomedcentral.com/1471-2164/13/94
Page 18 of 18