genome-wide analysis of thiourea-modulated - annals of botany
TRANSCRIPT

Genome-wide analysis of thiourea-modulated salinity stress-responsivetranscripts in seeds of Brassica juncea: identification of signalling and effector
components of stress tolerance
A. K. Srivastava, N. K. Ramaswamy, P. Suprasanna and S. F. D’Souza*
Nuclear Agriculture and Biotechnology Division, Bhabha Atomic Research Centre, Mumbai 400085, India* For correspondence. E-mail [email protected]
Received: 2 April 2010 Returned for revision: 7 June 2010 Accepted: 8 July 2010 Published electronically: 24 August 2010
† Background and Aims Abiotic stresses including salinity are the major constraints to crop production. In thisregard, the use of thiourea (TU) in imparting salinity-stress tolerance to Indian mustard (Brassica juncea) hasbeen demonstrated earlier. To gain an insight into the mechanism of TU action, various molecular and biochemi-cal studies were conducted.† Methods Microarray analysis was performed in seeds subjected to distilled water (control), 1 M NaCl, 1 M
NaCl + 6.5 mM TU and 6.5 mM TU alone for 1 h. Real-time PCR validation of selected genes and biochemicalstudies were conducted under similar treatments at 1 h and 6 h.† Key Results The microarray analysis revealed a differential expression profile of 33 genes in NaCl- and NaCl +TU-treated seeds, most of which are established markers of stress tolerance. The temporal regulation of eightselected genes by real-time PCR indicated their early and co-ordinated induction at 1 h in NaCl + TU only.Besides, NaCl + TU-treated seeds also maintained a higher level of abscisic acid, reduced to oxidized gluta-thione (GSH : GSSG) ratio and activities of catalase, phenylalanine ammonia lyase and glutathione-S-trans-ferases, as compared with that of NaCl treatment. The addition of LaCl3 (a specific calcium-channel blocker)restricted the responses of TU both at molecular and biochemical level suggesting the possible involvement ofa cytosolic calcium burst in the TU-mediated response. The TU-alone treatment was comparable to that of thecontrol; however, it reduced the expression of some transcription factors and heat-shock proteins presumablydue to the stabilization of the corresponding proteins.† Conclusions The TU treatment co-ordinately regulates different signalling and effector mechanisms at an earlystage to alleviate stress even under a high degree of salinity. This also indicates the potential of TU to be used asan effective bioregulator to impart salinity tolerance under field conditions.
Key words: Abscisic acid, calcium signalling, redox state, salinity stress, thiourea, transcriptional profiling.
INTRODUCTION
In the current scenario of increasing interest in sustainableagriculture, soil salinity is a major environmental constraintthat limits the use of land. More than 800 million ha of landthroughout the world are salt-affected (FAO, 2008) whichaccounts for .6 % of the world’s total land area. Besides,out of 1500 million ha of land farmed by dryland agriculture,32 million ha (2 %) are affected by salinity to varying degreesand out of the current 230 million ha of irrigated land, 45million ha (20 %) are salt affected (Munns and Tester,2008). The problem of soil salinity is becoming severe dayby day due to salty rain around the coasts, contaminationfrom the parental rocks and oceanic salts and bad cultivationpractices (Mahajan and Tuteja, 2005). Therefore, efforts areunderway to increase and/or manage the salinity tolerance inplants through the transfer of individual functional geneseither by genetic engineering or plant breeding (Jauhar,2006; Witcombe et al., 2008; Purty et al., 2008; Visaradaet al., 2009). However, these approaches have not been suc-cessful as far as consistency, reliability and visible effects atfield level are concerned. This is mainly because of the multi-genic and complex nature of salinity-stress tolerance (Sairam
and Tyagi, 2004; Yamaguchi and Blumwald, 2005). Anotherviable approach, in this direction, is based on the transfer oftranscription factors such as DREB1A (Kasuga et al., 1999),CBF4 (Haake et al., 2002), OSISAP1 (Mukhopadhyay et al.,2004), NAC (Hu et al., 2006) and AP37 (Oh et al., 2009) toactivate a set of genes involved in salinity/drought-stress toler-ance. However, the limitation of this concept lies in the factthat one transcription factor may regulate several metabolicpathways and one metabolic pathway may need an orchestratedregulation from more than one transcriptional element. Thus,the development of stress-tolerant transgenics using genetransfer approaches needs much more understanding of plantstress-tolerance and gene-regulatory network systems.
Another important factor regulating the key processes ingrowth and development as well as stress tolerance is the cel-lular redox state. The maintenance of the redox homeostasis iscollectively achieved by redox pairs (e.g. GSH/GSSG), antiox-idant systems (catalase and superoxide dismutase, etc.) andother secondary metabolites (flavonoids, alkaloids and caro-tenoids) (Dietz, 2008). In response to any external stimuli,plants modify their redox state and the extent of change isdependent on the nature of the stimulus itself, the dose, andexposure time to the tissue in question (Miller et al., 2009).
# The Author 2010. Published by Oxford University Press on behalf of the Annals of Botany Company. All rights reserved.
For Permissions, please email: [email protected]
Annals of Botany 106: 663–674, 2010
doi:10.1093/aob/mcq163, available online at www.aob.oxfordjournals.org
Dow
nloaded from https://academ
ic.oup.com/aob/article/106/5/663/141784 by guest on 11 D
ecember 2021

On the basis of these facts, we have hypothesized that if theexternal application of any molecule can help the plants tomaintain their redox homeostasis under stress conditions, itmay enhance their stress-tolerance potential. This is entirelya novel concept which is based upon the priming of the exist-ing defence mechanisms and hence avoids any manipulation ofthe genome. In an earlier study, three thiol compounds,namely, thiourea (TU), dithiothreitol and thioglycollic acidwere selected, because of their ability to maintain the redoxstate, to monitor their effect on the performance of wheatand mustard crops under salinity and drought-affected fieldsof Rajasthan (India). The field data indicated that the pre-treatment of seeds and foliar spray of the seedlings at laterstages with all these thiol compounds could increase thestress tolerance and, more importantly, crop productivity; theperformance of TU was found to be the best (Sahu andSingh, 1995; Sahu et al., 2005). Thus, considering theefficiency of TU in alleviating salinity stress and increasingcrop yield, studies were undertaken to investigate themolecular mechanism(s) of TU-mediated stress tolerance.Recent research has also established the positive role ofTU treatment in maintaining the functioning of seed mitochon-dria (Srivastava et al., 2009) and root water homeostasis(Srivastava et al., 2010) in Brassica juncea under a highdegree of salinity stress. In the present study, various molecu-lar and biochemical analyses were conducted at an early timepoint in Brassica juncea seeds to investigate the mechanismsof TU-mediated control of seed germination processes undersalinity stress. As far as is known, no such study, offering prac-tical applications at the field level, has been performed wherean external bioregulatory molecule is used to decipher differ-ent signalling and effector components of salinity-stress toler-ance in plants.
MATERIALS AND METHODS
Plant material: stress induction and thiol treatment
The study was performed on Indian mustard, Brassica juncea(L.) Czern. For microarray analysis, seeds were surface steri-lized with 30 % ethanol for 3 min and washed thoroughlywith distilled water to remove the traces of ethanol. Theseeds were independently subjected to one of four differenttreatments [distilled water (DW); NaCl (1 M); NaCl (1 M) +TU (6.5 mM); or TU (6.5 mM)]; after 1 h samples were takenfor the microarray analysis. The selection of such a highNaCl concentration (1 M) for microarray analysis was basedon preliminary screening of NaCl concentrations rangingfrom 0.3 M to 1 M in the presence/absence of TU, in termsof seed germination ability (data not shown). In an assay,seeds were soaked in either 1 M NaCl or 1 M NaCl + 6.5 mM
TU for 6 h and then allowed to germinate under normal con-ditions for 1 d and 2 d and it was found that seeds soaked inNaCl exhibited a drastic reduction in their germinationability, whereas in the NaCl + TU treatment, a comparativelybetter germination pattern was noticed (Fig. S1 inSupplementary Data, available online). Hence, these concen-trations were selected for the study. However, an early timepoint for microarray analysis (1 h) was chosen to get aninsight into the regulatory gene network that led to differential
seed germination profile in NaCl and NaCl + TU. The selec-tion of time point (1 h) was also supported from a previousstudy which indicated that the TU-modulated gene-expressionpattern becomes detectable as early as 1 h after the stress treat-ment (Srivastava et al., 2009). Nevertheless, for real-time PCRand biochemical analyses, both time points (1 h and 6 h) wereused. For these analyses, surface-sterilized seeds were givenone of five different treatments [DW; NaCl (1 M); NaCl (1M) + TU (6.5 mM); TU (6.5 mM); or NaCl (1 M) + TU(6.5 mM) + LaCl3 (5 mM)].
RNA isolation and quality control
Total RNA was extracted using RNeasy Plant Mini Kit(Qiagen-74903). The integrity and concentration of RNAwas measured using an Agilent 2100 bioanalyser with anRNA 6000 nano assay. The RNA integrity number(Schroeder et al., 2006) was developed using an RIN softwarealgorithm and a value greater than eight was treated as aquality control for the RNA to be subjected to the microarrayanalysis (Fig. S2 in Supplementary Data).
Microarray hybridization and data analysis
Total RNA (100 ng) was used to prepare the cy-3/cy-5-labelled complementary RNA (cRNA), using the Agilentlow RNA input linear amplification kit, following the manufac-turer’s guidelines. The amplification reaction has been opti-mized to be linear and not introduce bias of the abundantmRNA species over the rare mRNA populations (Fig. S3 inSupplementary Data). The labelled cy3-/cy-5 cRNA was puri-fied by using the Agilent cRNA clean-up module. The quantifi-cation of the labelled cRNA was performed using a nanodropspectrophotometer and the profile of amplified RNA waschecked using an Agilent 2100 bioanalyser. An equal amountof labelled cRNA (825 ng) was used for each RNA sample.All hybridizations were performed with a 4X44K arabidopsisarray slide. Hybridization and washing steps were carried outusing an Agilent gene expression hybridization kit. For eachmicroarray experiment, samples were processed in triplicatewith independent dye swap labelling. Separate images (foreach hybridization) were acquired using a DNA microarrayscanner (Agilent Technologies) by simultaneous two-colourscanning at 5- and 10-mm resolution. Image analysis was per-formed using Agilent feature extraction software.
Expression data were evaluated using Agilent data analysissoftware in which the parameters were set as follows: false dis-covery rate, 5 %; data response type, paired data; data in logscale, log2; number of permutations, 1000; imputationengine, K-nearest neighbor imputer. A cut-off value of0.5-fold and a P-value of 0.01 were used to select a subsetof significant genes for further analysis. Gene clustering analy-sis was performed with GeneSpring version 6.1 (SiliconGenetics, San Jose, CA, USA).
Identifying biological functions of differentially expressed genes
Using tools on the TAIR website (www.arabidopsis.org/index.jsp), the differentially expressed genes were categorizedin terms of their biological function. Expected frequencies for
Srivastava et al. — Thiourea–mediated salinity–stress tolerance in Brassica664
Dow
nloaded from https://academ
ic.oup.com/aob/article/106/5/663/141784 by guest on 11 D
ecember 2021

each category were calculated based on the entire database ofannotated arabidopsis genes using Nick’s classification super-viewer tool (Provert and Zhu, 2003).
Primer designing and quantitative real-time PCR for thevalidation of microarray data
For quantitative real-time PCR, 15 genes that demonstrateddifferential expression with respect to NaCl and NaCl + TUtreatments were selected. The gene-specific primer pairs wereselected from the arabidopsis genome-wide real-time PCRprimer pair database (Han and Kim, 2006). All the primersets were tested by real-time PCR on a dilution series ofcDNA (1 : 2; 1 : 4; 1 : 8; 1 : 16; 1 : 32 and 1 : 64) derived froma first-strand cDNA mix, independently from the different treat-ments in triplicate. Primer efficiencies were calculated usingREST-384 version 2 software (http://rest.gene-quantification.info/). Out of 15, only eight primer sets which displayed com-parable amplification efficiencies (1.9–2.1) and generatedsingle, specific PCR products and were used further for all thegene expression analyses. The details of these primers aregiven in Table S1 in Supplementary data. The specificities ofall the primer sets were also confirmed by direct sequencingof their cDNA amplified products (data not shown).
For cDNA synthesis, 10 mg of DNA free total RNA fromdifferent samples were taken and subjected to a reverse tran-scription reaction (RT + ) with oligo dT primer using aSuperScript first-strand cDNA synthesis kit (Invitrogen,Carlsbad, CA, USA), following the manufacturers protocol.Parallel control reactions (RT–; in which the reverse transcrip-tase enzyme was replaced with water) were also conducted forall RNA samples. Both RT+ and RT– samples were com-pared for all the primer sets by real-time quantitative PCR toconfirm that no DNA contamination is present in any of thesamples (data not shown). Real-time PCR was carried outusing the Rotor-Gene 6600 (Corbett Life Science; www.corbettlifescience.com). Reactions were set up by combining10 mL of SyBr green PCR reaction mix (Sigma; S 4320)with 2.5 mL of 1 to 20 diluted cDNA templates, 1.5 mL eachof forward and reverse primer (10 mM each), and 4.5 mL ofPCR grade water (Sigma W1754). For gene expression ana-lyses, the control gene actin and one target gene were analysedper run, and reactions were carried out on 3 biological and 3technical replicates for each sample. The following PCR pro-tocols were followed: 95 8C for 15 min; 40 cycles of 94 8Cfor 20 s, 55 8C for 30 s, and 72 8C for 30 s, sample read; 728C for 10 min; and melting curve analysis. The globalminimum was subtracted for baseline correction. Thethreshold line was adjusted to be above early cycle backgroundfluorescence. Data on the threshold cycle at which the fluor-escent intensity of each sample first increased above back-ground levels were collected, and normalized to actin levels(which showed very little expression variation among differenttreatments). The efficiency-adjusted relative expression ratioswere calculated using REST-384 version 2 software.
Measurement of glutathione content
To estimate reduced and oxidized glutathione (GSH andGSSG), samples (500 mg) were frozen in liquid nitrogen and
homogenized in 0.1 M sodium phosphate-EDTA buffer (pH8.0) containing 25 % meta-phosphoric acid. The level ofGSH and GSSG were determined following the methoddescribed by Hissin and Hilf (1976).
Enzyme assays
Seeds given different treatments were ground to a finepowder in liquid nitrogen and then homogenized in buffersspecific for each enzyme under chilled conditions.Homogenate was squeezed through four layers of coldcheese cloth and centrifuged at 12 000 g for 15 min at 4 8C.The protein content in the supernatant was measured accordingto Lowry et al. (1951). The activities ofglutathione-S-transferase (GST), catalase (CAT) and phenyl-alanine ammonia-lyase (PAL) were assayed following themethods described by Habig and Jacoby (1981), Aebi (1984)and Hahlbrock and Ragg (1975), respectively.
Measurement of abscisic acid (ABA) content
Seed samples (200–300 mg f. wt) from different treatmentswere collected, weighed and immediately frozen in liquidnitrogen, thawed and extracted with distilled water (tissue :water ratio 1 : 20, w/v) for 16 h at 4 8C in the dark. A competi-tive immunoassay-based quantitative determination of theABA content was performed in crude aqueous extracts usingthe Phytodetek ABA test kit, following the proceduredescribed by the manufacturer (Idetek, Sunnyvale, CA, USA).
Statistical analysis
All data were subjected to analysis of variance according tothe model for completely randomized design using an SPSS10.0 program. Differences among treatment means were eval-uated by Duncan’s multiple range test (DMRT) at a 0.05 prob-ability level.
RESULTS
Global analysis of early TU-responsive gene expression in seeds
All the microarray data, which represent the average ratios ofnormalized signals in log2 scale calculated from three indepen-dent replicates (Fig. 1), are available under the accessionnumber of E-MEXP-1903 in EBI microarray database(Mukherjee et al., 2005). In TU-alone-treated seeds, 53genes were down-regulated as compared with that of thecontrol (Table 1). The functional analysis of these genes indi-cated that most of them are either transcription factors/heat-shock proteins (HSP) or associated with responses such ascalcium signalling, protein synthesis/degradation and antioxi-dant machinery. Eight genes, which are associated with thecellular energetics system, were found to be up-regulated inthe TU-alone treatment (Table 2).
In NaCl-stressed seeds, overall 83 down-regulated and 28up-regulated genes were identified (data not shown).Clustering analysis of these 111 differentially expressedgenes resulted in 33 genes being identified whose expressionwas modulated upon TU supplementation to NaCl. These
Srivastava et al. — Thiourea–mediated salinity–stress tolerance in Brassica 665
Dow
nloaded from https://academ
ic.oup.com/aob/article/106/5/663/141784 by guest on 11 D
ecember 2021

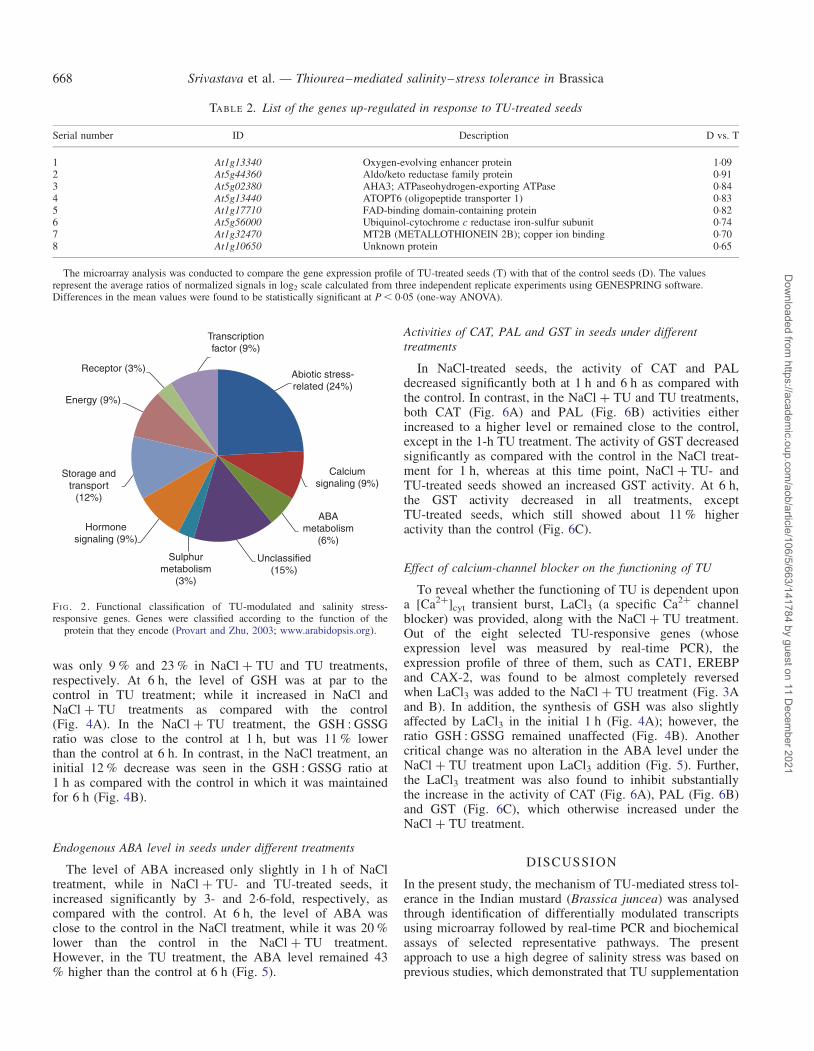
genes were divided into Clusters 1 and 2 (Fig. 2) of 14(Table 3) and 19 (Table 4) genes, respectively, depending ontheir down-regulation or up-regulation in NaCl + TU as com-pared with that of NaCl stress. These 33 TU-modulated andsalinity stress-responsive genes were then functionally classi-fied (Fig. 2). A total of 27 % genes encoded proteins with aputative regulatory function (transcription factors, hormoneand calcium signalling), suggesting a large adjustment in regu-latory networks in response to TU treatment under salinitystress, 6 % genes encoded proteins involved in ABA metab-olism, 9 % were related to the energy production and 12 %of genes were found to be involved in storage and transport.
Quantitative real-time PCR validation of selected genes underdifferent treatments
Quantitative real-time PCR of the eight selectedTU-modulated and salinity-responsive genes was performedto validate the results of microarray (Fig. 3A). In general,the gene-expression pattern obtained under different treat-ments by real-time PCR correlated well with the data of micro-array experiments (as determined by Pearson correlation
coefficients; data not shown). However, the values of log2
ratio obtained by real-time PCR were generally higher thanthose obtained by microarray analysis. This observation, tosome extent, may be attributed to the saturation of fluorescentsignals in the microarray. Out of the eight genes analysed byreal-time PCR, the log2 ratio of CAT1 was not correlatedwith that obtained from the microarray. This could be due tothe differential mRNA splicing that can affect the transcriptlevels detected at different regions of mRNA by two indepen-dent techniques (real-time and microarray).
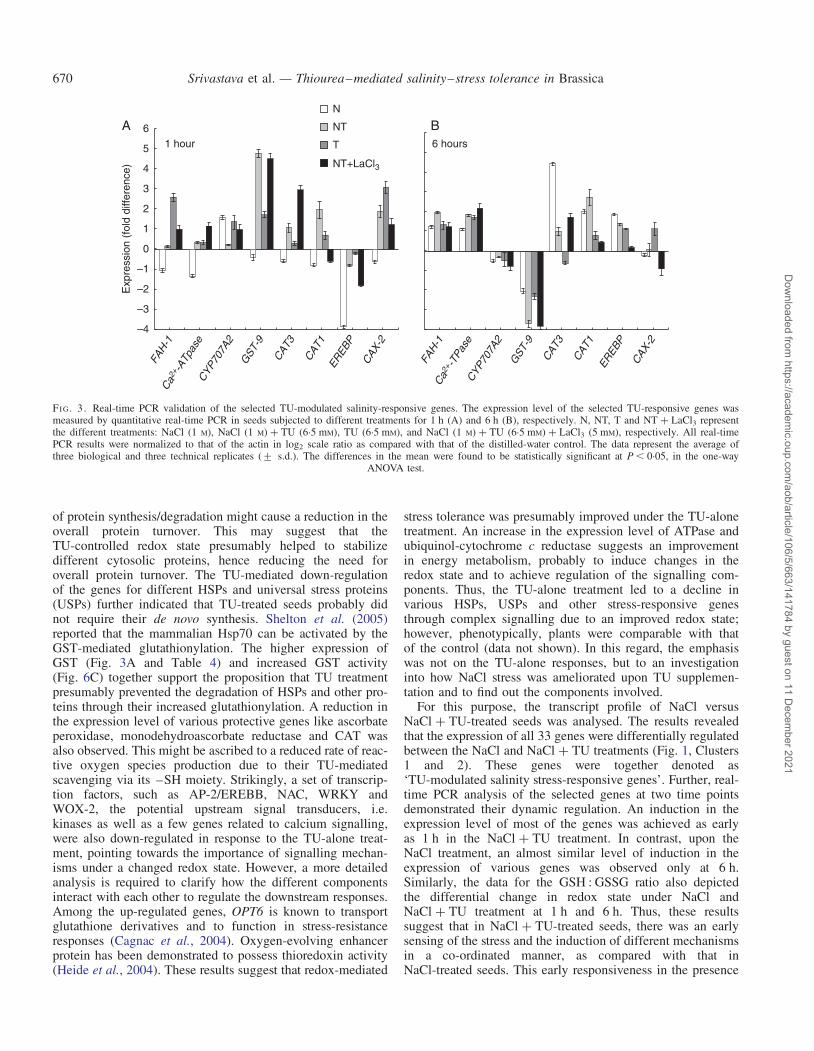
Apart from microarray data validation, real-time PCR analy-sis was also performed to study the temporal regulation of thesame set of genes. The data obtained indicated that the tran-scripts were under dynamic regulation. At an early phase ofimbibition (1 h), the expression level of most of the geneswas higher in NaCl + TU it was lower in NaCl, as comparedwith the control (Fig. 3A). An increase in the expression levelof most of the genes in the NaCl treatment as comparedwith the control was achieved only at 6 h (Fig. 3B). At 6 h,the CYP707A2 and GST-9 were found to be down-regulatedin all the treatments. Such a temporal regulation in theexpression profile was not observed in TU-alone-treated
Cluster 2
DW
(cy
-3)
vs N
(cy
-5)
DW
(cy
-5)
vs N
(cy
-3)
DW
(cy
-3)
vs N
T (
cy-5
)
DW
(cy
-5)
vs N
T (
cy-3
)
DW
(cy
-3)
vs T
(cy
-5)
DW
(cy
-5)
vs T
(cy
-3)
Cluster 1
5·0
4·0
3·0
2·5
2·0
1·5
1·2
1·0
0·9
0·8
0·7
0·6
0·5
0·4
0·3
0·2
0·1
0·0
Trust
Exp
ress
ion
DW
(cy-
3) v
s N
(cy-
5)D
W (c
y-5)
vs
N (c
y-3)
DW
(cy-
3) v
s N
T (c
y-5)
DW
(cy-
5) v
s N
T (c
y-3)
FI G. 1. Microarray analysis in Brassica juncea seeds. An overview of microarray analyses (DW vs. N; DW vs. NT and DW vs. T) is represented. Each exper-iment was performed in triplicate and the average ratios of normalized signals in log2 scale were calculated from three independent replicate experiments usingGENESPRING software. The DW, N, NT and T represent distilled water control, NaCl (1 M), NaCl (1 M) + TU (6.5 mM) and TU (6.5 mM) treatments, respect-ively. Clusters 1 and 2 represent 19 and 14 genes which were down- and up-regulated, respectively, in NaCl but gets modulated under the NaCl + TU treatment.
The attached trust represent the scale of expression fold difference (green and red colours represent the down- and up-regulation, respectively).
Srivastava et al. — Thiourea–mediated salinity–stress tolerance in Brassica666
Dow
nloaded from https://academ
ic.oup.com/aob/article/106/5/663/141784 by guest on 11 D
ecember 2021

seeds. In TU-treated seeds, the expression of all genes waseither at the level of the control or up-regulated at both timepoints except CAT-1, whose expression decreased at 6 h.
Redox state regulation in seeds under different treatments
At 1 h, the level of GSH decreased by 47 % in the NaCltreatment in comparison with the control, while the decline
TABLE 1. List of the genes down-regulated in response to TU-treated seeds
Serial number ID Description D vs. T
Transcription factor, kinases and transporters1 At1g74100 SOT16 (sulfotransferase 16) 23.932 At3g29350 AHP2 (histidine-containing phosphotransmitter-2) 21.443 At5g59820 ZAT12 (responsive to high light) 21.134 At5g53590 Auxin-responsive family protein 21.125 At1g06225 CLE3 (CLAVATA3/ESR-RELATED 3); receptor binding 21.096 At4g17920 Zinc finger (C3HC4-type RING finger) family protein 21.097 At5g61600 Ethylene-responsive element-binding family protein 21.098 At1g23740 Oxidoreductase, zinc-binding dehydrogenase family protein 21.099 At1g72430 Auxin-responsive protein-related 21.0410 At3g49530 Arabidopsis NAC domain containing protein 62; transcription factor 20.9211 At2g19170 SLP3; serine-type peptidase 20.8612 At4g31800 ATWRKY18_WRKY18; transcription factor 20.8613 At5g03720 HSFA3_AT-HSFA3; DNA binding/transcription factor 20.8414 At3g55980 ATSZF1 (salt-inducible zinc finger 1) 20.8315 At3g16210 F-box family protein 20.7716 At4g25950 VATG3 (vacuolar ATP synthase G3) 20.7617 At5g28080 WNK9; kinase/protein kinase 20.7418 At2g27050 EIL1 (ethylene-insensitive3-like 1); transcription factor 20.7319 At2g24840 AGL61 (agamous-like 61); transcription factor 20.6920 At2g23030 SNRK2.9 (SNF1-related protein kinase 2.9) 20.6821 At5g59340 WOX2 (Wuschel-related homeobox 2); transcription factor 20.63Protective genes22 At3g09640 APX2 (ascorbate peroxidase 2) 21.6423 At4g10270 Wound-responsive family protein 21.1624 At1g20620 CAT3 (catalase 3) 21.125 At1g59860 17.6 kDa class I heat-shock protein (HSP17.6A-CI) 21.0426 At1g63940 Monodehydroascorbate reductase 20.9227 At1g69920 ATGSTU12 (glutathione S-transferase TAU 12) 20.7628 At3g13310 DNAJ heat-shock N-terminal domain-containing protein 20.7329 At3g53990 Universal stress protein (USP) family protein 20.7230 At5g59720 HSP18.2 (heat-shock protein 18.2) 20.6631 At2g29500 17.6 kDa class I small heat-shock protein (HSP17.6B-CI) 20.64Protein synthesis/degradation32 At1g73480 Hydrolase, alpha/beta fold family protein 22.2633 At5g14980 Esterase/lipase/thioesterase family protein 21.2734 At5g64660 U-box domain-containing protein 21.235 At2g07715 Ribosomal protein L2, putative 21.0736 At3g18740 60S ribosomal protein L30 (RPL30C) 20.8837 At1g66160 U-box domain-containing protein 20.8638 At4g27140 2S seed storage protein 1/NWMU1-2S albumin 1 20.8439 At3g18080 BGLU44 (B-S GLUCOSIDASE 44) 20.79Calcium signalling-related40 At1g21550 Calcium-binding protein, putative 21.1641 At1g01140 CIPK9 (CBL-INTERACTING PROTEIN KINASE 9) 21.0942 At5g25110 CIPK25 (CBL-INTERACTING PROTEIN KINASE 25) 21.0843 At3g63380 Calcium-transporting ATPase/putative (ACA12) 2144 At2g41410 Calmodulin, putative 20.91Molecular function unknown45 At4g38060 Unknown protein 21.3746 At3g07900 Unknown protein 21.1447 At2g07708 Unknown protein 21.148 At2g07772 Unknown protein 21.149 At1g62840 Unknown protein 21.0150 At1g27330 Unknown protein 21.0151 At3g60990 Unknown protein 20.9952 At1g33055 Unknown protein 20.8753 At5g65300 Unknown protein 20.71
The microarray analysis was conducted to compare the gene expression profile of TU-treated seeds (T) with that of the control seeds (D). The valuesrepresent the average ratios of normalized signals in log2 scale calculated from three independent replicate experiments using GENESPRING software.Differences in the mean values were found to be statistically significant at P , 0.05 (one-way ANOVA).
Srivastava et al. — Thiourea–mediated salinity–stress tolerance in Brassica 667
Dow
nloaded from https://academ
ic.oup.com/aob/article/106/5/663/141784 by guest on 11 D
ecember 2021
was only 9 % and 23 % in NaCl + TU and TU treatments,respectively. At 6 h, the level of GSH was at par to thecontrol in TU treatment; while it increased in NaCl andNaCl + TU treatments as compared with the control(Fig. 4A). In the NaCl + TU treatment, the GSH : GSSGratio was close to the control at 1 h, but was 11 % lowerthan the control at 6 h. In contrast, in the NaCl treatment, aninitial 12 % decrease was seen in the GSH : GSSG ratio at1 h as compared with the control in which it was maintainedfor 6 h (Fig. 4B).
Endogenous ABA level in seeds under different treatments
The level of ABA increased only slightly in 1 h of NaCltreatment, while in NaCl + TU- and TU-treated seeds, itincreased significantly by 3- and 2.6-fold, respectively, ascompared with the control. At 6 h, the level of ABA wasclose to the control in the NaCl treatment, while it was 20 %lower than the control in the NaCl + TU treatment.However, in the TU treatment, the ABA level remained 43% higher than the control at 6 h (Fig. 5).
Activities of CAT, PAL and GST in seeds under differenttreatments
In NaCl-treated seeds, the activity of CAT and PALdecreased significantly both at 1 h and 6 h as compared withthe control. In contrast, in the NaCl + TU and TU treatments,both CAT (Fig. 6A) and PAL (Fig. 6B) activities eitherincreased to a higher level or remained close to the control,except in the 1-h TU treatment. The activity of GST decreasedsignificantly as compared with the control in the NaCl treat-ment for 1 h, whereas at this time point, NaCl + TU- andTU-treated seeds showed an increased GST activity. At 6 h,the GST activity decreased in all treatments, exceptTU-treated seeds, which still showed about 11 % higheractivity than the control (Fig. 6C).
Effect of calcium-channel blocker on the functioning of TU
To reveal whether the functioning of TU is dependent upona [Ca2+]cyt transient burst, LaCl3 (a specific Ca2+ channelblocker) was provided, along with the NaCl + TU treatment.Out of the eight selected TU-responsive genes (whoseexpression level was measured by real-time PCR), theexpression profile of three of them, such as CAT1, EREBPand CAX-2, was found to be almost completely reversedwhen LaCl3 was added to the NaCl + TU treatment (Fig. 3Aand B). In addition, the synthesis of GSH was also slightlyaffected by LaCl3 in the initial 1 h (Fig. 4A); however, theratio GSH : GSSG remained unaffected (Fig. 4B). Anothercritical change was no alteration in the ABA level under theNaCl + TU treatment upon LaCl3 addition (Fig. 5). Further,the LaCl3 treatment was also found to inhibit substantiallythe increase in the activity of CAT (Fig. 6A), PAL (Fig. 6B)and GST (Fig. 6C), which otherwise increased under theNaCl + TU treatment.
DISCUSSION
In the present study, the mechanism of TU-mediated stress tol-erance in the Indian mustard (Brassica juncea) was analysedthrough identification of differentially modulated transcriptsusing microarray followed by real-time PCR and biochemicalassays of selected representative pathways. The presentapproach to use a high degree of salinity stress was based onprevious studies, which demonstrated that TU supplementation
TABLE 2. List of the genes up-regulated in response to TU-treated seeds
Serial number ID Description D vs. T
1 At1g13340 Oxygen-evolving enhancer protein 1.092 At5g44360 Aldo/keto reductase family protein 0.913 At5g02380 AHA3; ATPaseohydrogen-exporting ATPase 0.844 At5g13440 ATOPT6 (oligopeptide transporter 1) 0.835 At1g17710 FAD-binding domain-containing protein 0.826 At5g56000 Ubiquinol-cytochrome c reductase iron-sulfur subunit 0.747 At1g32470 MT2B (METALLOTHIONEIN 2B); copper ion binding 0.708 At1g10650 Unknown protein 0.65
The microarray analysis was conducted to compare the gene expression profile of TU-treated seeds (T) with that of the control seeds (D). The valuesrepresent the average ratios of normalized signals in log2 scale calculated from three independent replicate experiments using GENESPRING software.Differences in the mean values were found to be statistically significant at P , 0.05 (one-way ANOVA).
Transcriptionfactor (9%)
Abiotic stress-related (24%)
Calciumsignaling (9%)
ABAmetabolism
(6%)
Unclassified(15%)
Sulphurmetabolism
(3%)
Hormonesignaling (9%)
Storage andtransport
(12%)
Energy (9%)
Receptor (3%)
FI G. 2. Functional classification of TU-modulated and salinity stress-responsive genes. Genes were classified according to the function of the
protein that they encode (Provart and Zhu, 2003; www.arabidopsis.org).
Srivastava et al. — Thiourea–mediated salinity–stress tolerance in Brassica668
Dow
nloaded from https://academ
ic.oup.com/aob/article/106/5/663/141784 by guest on 11 D
ecember 2021

was able to alleviate the damage even at supra-optimal levels(1 M NaCl) so that the viability of seeds was maintained(Srivastava et al., 2009). Hence, it was intriguing to investigatevarious signalling and effector processes regulated by TUwithin 1 h of treatment that allowed the seeds to maintaintheir viability and tolerate the stress. Preliminary experimentsconducted to evaluate the differential phenotype of the seed-lings under different treatments demonstrated that, firstly, theTU-alone treatment itself did not impose any stress and, sec-ondly, its supplementation to NaCl improved seedlingsvigour as compared with that of the NaCl treatment (Fig. S4in Supplementary Data, available online).
The genome wide transcriptome analysis was performed forthe short duration of 1 h in brassica seeds. As, the arabidopsis
array is an established tool for gene expression analysis ofbrassica species due to their close phylogenetic relationship(Hudson et al., 2007), the Agilent-based Arabidopsis thalianamicroarray platform was used for the transcriptome analysis ofbrassica seeds. The result of the control versus TU showed that53 genes were down-regulated (Table 1), while only eightgenes were up-regulated (Table 2). However, the fact thatthe redox state (measured in terms of the GSH : GSSG ratio)was lower than the control, under similar conditions, couldbe attributed to the decreased synthesis of GSH due to theexogenous supply of a –SH-containing compound, i.e. TU.Therefore, TU-regulated transcripts could be categorized aspotential redox-sensitive genes. The TU-mediated declineobserved in the expression level of genes under the category
TABLE 3. List of the genes up-regulated in NaCl but differentially regulated in NaCl + TU-treated seeds
Serial number ID Annotation Fold D vs. N Fold D vs. NT
1 At3g54050 Fructose-1,6-bisphosphatase, putative 1.97 20.092 At1g04560 AWPM-19-like membrane family protein 1.89 0.143 At5g63290 Coproporphyrinogen oxidase-related 1.8 20.084 At2g36420 Unknown protein 1.78 0.125 At2g15580 Zinc finger (C3HC4-type RING finger) family protein 1.74 20.096 At2g29090 CYP707A2 (cytochrome P450, family 707, subfamily A, polypeptide 2) 1.70 0.237 At5g66940 Dof-type zinc finger domain-containing protein 1.65 20.278 At4g19170 NCED4 (9-cis-epoxycarotenoid dioxygenase) 1.64 20.159 At4g36040 DNAJ heat-shock N-terminal domain-containing protein (J11) 1.58 0.2610 At1g20630 CAT1 (catalase 1); catalase 1.35 0.3711 At1g60690 Aldo/keto reductase family protein 1.3 22.0112 At2g37770 Aldo/keto reductase family protein 1.3 22.0113 At5g64290 DCT/DIT2.1 (dicarboxylate transport) 0.74 0.1914 At4g33550 Lipid transfer protein (LTP) 0.61 20.09
The microarray analysis was conducted to compare the gene expression profile of NaCl + TU- and NaCl-treated seeds (N + T and N, respectively) with thatof the control seeds (D). The values represent the average ratios of normalized signals in log2 scale calculated from three independent replicate experimentsusing GENESPRING software. Differences in the mean values were found to be statistically significant at P , 0.05 (one-way ANOVA).
TABLE 4. List of the genes downregulated in NaCl but differentially regulated in NaCl + TU-treated seeds
Serial number ID Annotation Fold D vs. N Fold D vs. NT
1 At5g61600 Ethylene-responsive element-binding family protein 22.46 0.242 At4g36220 FAH1; ferulate 5-hydroxylase 22.0 0.983 At2g41410 Calmodulin, putative 21.85 1.24 At2g37040 PAL1; phenylalanine ammonia-lyase 21.78 1.135 At5g53590 Auxin-responsive family protein 21.6 1.496 At2g16060 AHB1 (arabidopsis haemoglobin 1) 21.2 1.17 At5g44120 CRA1 (CRUCIFERINA); nutrient reservoir 21.04 0.68 At4g02380 Senescence-associated gene 21 (SAG21) 21.01 1.29 At5g62480 ATGSTU9; glutathione transferase 20.9 2.3010 At1g20620 CAT3 (catalase 3); catalase 20.8 1.3511 At2g06050 OPR3 (OPDA-reductase 3) 20.8 1.312 At4g05010 F-box family protein 20.8 1.0213 AT2G07698 ATP synthase alpha subunit, mitochondrial 21.159 0.5214 At3g13320 CAX2 (cation exchanger 2) 20.7 1.0215 At3g22910 Calcium-transporting ATPase, plasma membrane-type,
putative/Ca(2 + )-ATPase, putative (ACA13)20.7 1.4
16 At3g29350 AHP2 (histidine-containing phosphotransmitter 2) 20.7 1.8517 At3g59970 MTHFR1; methylenetetrahydrofolate reductase 20.70 1.8118 At3g61440 ARATH; (BETA-substituted Ala synthase 3;1) 20.7 0.819 At5g64310 AGP1 (arabinogalactan-protein 1) 20.67 1.63
The microarray analysis was conducted to compare the gene expression profile of NaCl + TU- and NaCl-treated seeds (N + T and N, respectively) with thatof the control seeds (D). The values represent the average ratios of normalized signals in log2 scale calculated from three independent replicate experimentsusing GENESPRING software. Differences in the mean values were found to be statistically significant at P , 0.05 (one-way ANOVA).
Srivastava et al. — Thiourea–mediated salinity–stress tolerance in Brassica 669
Dow
nloaded from https://academ
ic.oup.com/aob/article/106/5/663/141784 by guest on 11 D
ecember 2021
of protein synthesis/degradation might cause a reduction in theoverall protein turnover. This may suggest that theTU-controlled redox state presumably helped to stabilizedifferent cytosolic proteins, hence reducing the need foroverall protein turnover. The TU-mediated down-regulationof the genes for different HSPs and universal stress proteins(USPs) further indicated that TU-treated seeds probably didnot require their de novo synthesis. Shelton et al. (2005)reported that the mammalian Hsp70 can be activated by theGST-mediated glutathionylation. The higher expression ofGST (Fig. 3A and Table 4) and increased GST activity(Fig. 6C) together support the proposition that TU treatmentpresumably prevented the degradation of HSPs and other pro-teins through their increased glutathionylation. A reduction inthe expression level of various protective genes like ascorbateperoxidase, monodehydroascorbate reductase and CAT wasalso observed. This might be ascribed to a reduced rate of reac-tive oxygen species production due to their TU-mediatedscavenging via its –SH moiety. Strikingly, a set of transcrip-tion factors, such as AP-2/EREBB, NAC, WRKY andWOX-2, the potential upstream signal transducers, i.e.kinases as well as a few genes related to calcium signalling,were also down-regulated in response to the TU-alone treat-ment, pointing towards the importance of signalling mechan-isms under a changed redox state. However, a more detailedanalysis is required to clarify how the different componentsinteract with each other to regulate the downstream responses.Among the up-regulated genes, OPT6 is known to transportglutathione derivatives and to function in stress-resistanceresponses (Cagnac et al., 2004). Oxygen-evolving enhancerprotein has been demonstrated to possess thioredoxin activity(Heide et al., 2004). These results suggest that redox-mediated
stress tolerance was presumably improved under the TU-alonetreatment. An increase in the expression level of ATPase andubiquinol-cytochrome c reductase suggests an improvementin energy metabolism, probably to induce changes in theredox state and to achieve regulation of the signalling com-ponents. Thus, the TU-alone treatment led to a decline invarious HSPs, USPs and other stress-responsive genesthrough complex signalling due to an improved redox state;however, phenotypically, plants were comparable with thatof the control (data not shown). In this regard, the emphasiswas not on the TU-alone responses, but to an investigationinto how NaCl stress was ameliorated upon TU supplemen-tation and to find out the components involved.
For this purpose, the transcript profile of NaCl versusNaCl + TU-treated seeds was analysed. The results revealedthat the expression of all 33 genes were differentially regulatedbetween the NaCl and NaCl + TU treatments (Fig. 1, Clusters1 and 2). These genes were together denoted as‘TU-modulated salinity stress-responsive genes’. Further, real-time PCR analysis of the selected genes at two time pointsdemonstrated their dynamic regulation. An induction in theexpression level of most of the genes was achieved as earlyas 1 h in the NaCl + TU treatment. In contrast, upon theNaCl treatment, an almost similar level of induction in theexpression of various genes was observed only at 6 h.Similarly, the data for the GSH : GSSG ratio also depictedthe differential change in redox state under NaCl andNaCl + TU treatment at 1 h and 6 h. Thus, these resultssuggest that in NaCl + TU-treated seeds, there was an earlysensing of the stress and the induction of different mechanismsin a co-ordinated manner, as compared with that inNaCl-treated seeds. This early responsiveness in the presence
N
NT
T
NT+LaCl3
–4
–3
–2
–1
0
1
2
3
4
5
6A B1 hour 6 hours
Exp
ress
ion
(fol
d di
ffere
nce)
FAH
-1C
a2+
-ATp
ase
CYP
707A
2
GST
-9
CAT
3
CAT
1ER
EBP
CAX
-2
FAH
-1C
a2+
-TPa
seC
YP70
7A2
GST
-9
CAT
3
CAT
1ER
EBP
CAX
-2
FI G. 3. Real-time PCR validation of the selected TU-modulated salinity-responsive genes. The expression level of the selected TU-responsive genes wasmeasured by quantitative real-time PCR in seeds subjected to different treatments for 1 h (A) and 6 h (B), respectively. N, NT, T and NT + LaCl3 representthe different treatments: NaCl (1 M), NaCl (1 M) + TU (6.5 mM), TU (6.5 mM), and NaCl (1 M) + TU (6.5 mM) + LaCl3 (5 mM), respectively. All real-timePCR results were normalized to that of the actin in log2 scale ratio as compared with that of the distilled-water control. The data represent the average ofthree biological and three technical replicates (+ s.d.). The differences in the mean were found to be statistically significant at P , 0.05, in the one-way
ANOVA test.
Srivastava et al. — Thiourea–mediated salinity–stress tolerance in Brassica670
Dow
nloaded from https://academ
ic.oup.com/aob/article/106/5/663/141784 by guest on 11 D
ecember 2021

of TU might be responsible for maintaining the ability of seedsto germinate even under a high degree of salinity stress(Srivastava et al., 2009).
In plants, as the salinity stress signal is perceived, the levelof ABA gets enhanced triggering an array of responses includ-ing an increase in cytosolic calcium (Jakab et al., 2005). In thepresent study, the expression of two ABA metabolism genes,such as 9-cis-epoxycarotenoid dioxygenase-4 (NCED4), aregulatory enzyme of ABA biosynthesis (Qin and Zeevaart,1999), and cytochrome P450 sub-family gene (CYP707 A2),a key enzyme of ABA catabolism (Saito et al., 2004), wasmodulated in response to TU treatment. This suggests the
active involvement of ABA in TU-mediated responses. Toconfirm this, time-dependent measurement of the endogenousABA level was performed in seeds under different treatments.A significant increase in the level of ABA, as early as 1 h afterimbibition, in the NaCl + TU as well as the TU treatment, wasobserved, which strengthens the proposition that TU-mediatedeffects are ABA-dependent. With time, the level of ABA wasfound to decrease in all the treatments which presumablyoccurred to facilitate the process of seed germination(Penfield and King, 2009). In response to an increase in thelevel of ABA, other signalling mechanisms are initiated,such as the changes in the calcium signature that help plantsadapt under salinity stress. Calcium signature is a condition-specific phenomenon that is governed by the co-ordinatedfunction of different genes, namely, calmodulin, calcium-transporting ATPase and calcium exchanger (Knight et al.,1997). Interestingly, the level of such genes was found to bemodulated in seeds treated with NaCl + TU (Table 4) or TU(Table 1), which suggests that TU-mediated signallingchanges in the process of stress amelioration probably alsoinvolve modulations in the calcium signature pattern.
There is evidence for the role of ABA in triggering the pro-duction of H2O2 (Xing et al., 2008). In addition, salinity stressitself induces oxidative stress (Borsani et al., 2001). In thiscontext, the role of CATs becomes indispensible for efficientlyscavenging the H2O2 (Willekens et al., 1997). They areencoded by a small multigene family consisting of CAT1,CAT2 and CAT3 (Frugoli et al., 1996). CAT1 is known tobe regulated in an ABA-dependent manner and is mainlyinvolved in regulating the H2O2-dependent signalling; whileCAT3 is regulated by an unknown mechanism and is mainly
a
0
50
100
150
200
250
300
350
400
450
500A
B
Time (h)
GS
H c
once
ntra
tion
(mm
ol g
–1 f.
wt)
0
5
10
15
20
25
30
35
40
45
61
GS
H/G
SS
G r
atio
a
de
b
c
d
d
bbc
d
DW
N
NT
T
NT+LaCl3
FI G. 4. Measurement of GSH and the GSH : GSSG ratio. The level of GSH(A) and the GSH : GSSG ratio (B) were measured in seeds subjected to differ-ent treatments for 1 h and 6 h. DW, N, NT, T and NT + LaCl3 represent thedifferent treatments: distilled water control, NaCl (1 M), NaCl (1 M) + TU(6.5 mM), TU (6.5 mM) and NaCl (1 M) + TU (6.5 mM) + LaCl3 (5 mM),respectively. All the values represent the mean+ s.d. of six technical andthree biological replicates. The differences in the mean were found to be stat-istically significant at P , 0.05, in the one-way ANOVA test. Different lettersindicate significantly different values at a particular duration (DMRT, P ,
0.05).
db
cb
a
c
b
a
d,ed
0
10
20
30
40
50
60
70
80
90
1
Time (h)
6
AB
A (
nmol
g–1
f. w
t)
DW
N
NT
T
NT+LaCl3
FI G. 5. Measurement of the ABA content. The endogenous level of ABA wasmeasured in seeds subjected to different treatments for 1 h and 6 h. DW, N,NT, T and NT + LaCl3 represent the different treatments: distilled watercontrol, NaCl (1 M), NaCl (1 M) + TU (6.5 mM), TU (6.5 mM) and NaCl (1M) + TU (6.5 mM) + LaCl3 (5 mM), respectively. All the values represent themean+ s.d. of six technical and three biological replicates. The differencesin the mean were found to be statistically significant at P , 0.05, in theone-way ANOVA test. Different letters indicate significantly different values
at a particular duration (DMRT, P , 0.05).
Srivastava et al. — Thiourea–mediated salinity–stress tolerance in Brassica 671
Dow
nloaded from https://academ
ic.oup.com/aob/article/106/5/663/141784 by guest on 11 D
ecember 2021

associated with scavenging excess H2O2. As compared withNaCl, early induction observed in the transcript level ofCAT1 and CAT3 (Table 4) as well as in the activity of CAT(Fig. 6A) suggest a change in the early involvement ofCAT-mediated signalling and antioxidant defence in NaCl +TU-treated seeds. Besides, TU treatment also modulated theexpression of genes related to hormonal signalling. In NaCl +TU-treated seeds, the expression level of an auxin responsivegene (Aux/IAA), an AHP family gene (AHP2; a mediater ofcytokinin signalling), OPR-3 (12-oxo-phytodienoic acidreductase; a mediater of jasmonate biosynthesis and signalling)as well as EREB (ethylene-responsive element-binding gene)were up-regulated, whereas in NaCl-treated seeds, all thesegenes were down-regulated. These results imply that TU mayprobably co-ordinately regulate auxin-, cytokinin-, ethylene-and jasmonate-mediated signalling to impart stress toleranceas well as to allow the plants to maintain their normal growth.
In the course of stress management, the phenylpropanoidsignalling pathway also plays an important role in thecomplex but integrated signalling network. PAL catalyses thefirst step of the phenylpropanoid pathway. The NaCl +TU-treated seeds showed an increased expression of one ofthe PAL genes, PAL1 (Anterola and Lewis, 2002) and a hom-ologue of PAL, FAH1 (ferulate 5-hydroxylase; Costa et al.,2003) as well as a higher PAL activity (both at 1 h and 6 h)than that observed under the NaCl treatment. Both molecularand biochemical data, thus, indicate that TU treatment mightlead to an accumulation of major flavonoids, which wouldassist in reducing the extent of damage in NaCl +TU-treated seeds. The salinity stress also leads to the gener-ation of various metabolic by-products that need to be detox-ified in order to maintain the cellular homeostasis. This isachieved via their conjugation with glutathione by the GSTs(Wagnor et al., 2002). In this direction, increased expressionand activity of GSTs, during the early time of 1 h, indicatedthe stimulation of effective detoxification of any stress-inducedby-products, such as lipid peroxides from membrane damage,in the NaCl + TU treatment as compared with the NaCltreatment.
An interesting feature associated with most of theTU-modulated transcripts was that they were either directlyrelated to calcium signalling or were the potential targets ofthe calmodulin/calceneurin B-like proteins (Luan et al.,2002). This suggests that the action of TU might be dependentupon the process of calcium signalling. To confirm this,various molecular and biochemical responses were studied inresponse to addition of LaCl3 (a calcium-channel blocker) toNaCl + TU. The Ca2+-permeable channels are required togenerate the [Ca2+]cyt burst which is necessary for the acti-vation of different cellular responses (Kaplan et al., 2006).When the NaCl + TU treatment was supplemented withLaCl3, the expression profile of a few genes such as CAT-1,EREBP and CAX-2 was reversed as compared with theirexpression in the absence of LaCl3. Besides, theTU-mediated increase in the level of ABA and in the activitiesof various enzymes, such as CAT, PAL and GST, were also notobserved in presence of LaCl3. However, the redox stateremained more or less unaltered. Thus, these findings togetherindicate that the effect of TU might be dependent upon thecytosolic Ca+2 burst per se.
a
0
0·02
0·04
0·06
0·08
0·10
0·12A
B
C
Cat
alas
e ac
tivity
(un
its m
g–1
prot
ein)
a
a
0
0·5
1·0
1·5
2·0
2·5
3·0
3·5
PA
L ac
tivity
(un
its m
g–1
prot
ein)
0·86
0·91
0·96
1·01
1·06
1·11
1·16
61
Time (h)
GS
T (
units
mg–
1 pr
otei
n)
b
c
b
d
b
c
a
a
cd
b
c
ab
c
b
cb
cd
c
d
b
a
d
b
bc cd
a
d
DW
N
NT
T
NT+LaCl3
FI G. 6. Measurement of enzyme activities. The activities of CAT (A), PAL(B) and GST (C) were measured in seeds subjected to different treatmentsfor 1 h and 6 h. DW, N, NT, T and NT + LaCl3 represent the different treat-ments: distilled water control, NaCl (1 M), NaCl (1 M) + TU (6.5 mM), TU(6.5 mM) and NaCl (1 M) + TU (6.5 mM) + LaCl3 (5 mM), respectively. Allthe values represent the mean+ s.d. of six technical and three biological repli-cates. The differences in the mean were found to be statistically significant atP , 0.05, in the one-way ANOVA test. Different letters indicate significantly
different values at a particular duration (DMRT, P , 0.05).
Srivastava et al. — Thiourea–mediated salinity–stress tolerance in Brassica672
Dow
nloaded from https://academ
ic.oup.com/aob/article/106/5/663/141784 by guest on 11 D
ecember 2021

Taken together, the present results imply that upon stressimposition, TU modulated various signalling pathways suchas redox, calcium and ABA, leading to activation of a yet uni-dentified ‘common alarm signal’. This in turn co-ordinatelyregulated different processes to increase the capacity tocombat oxidative stress and to detoxify stress-induced accumu-lation of any by-products which together help the seeds tomaintain their viability even under the high degree of salinitystress. Thus, the application of TU, as a bioregulatory mol-ecule, can augment new approaches/strategies for basic aswell as applied research dealing with crop stress managementand other productivity constraints at the field level.
SUPPLEMENTARY DATA
Supplementary data are available online at www.aob.oxford-journals.org and consist of the following. Fig. S1:Differential germination response of Brassica juncea seedsunder different treatments. Fig. S2: Quality control for RNA.Fig. S3: Scatter plots of dye swap labelling. Fig. S4:Differential growth responses in Brassica juncea seedlingsunder different treatments. Table S1: Details of the primersused for the quantitative real-time PCR.
ACKNOWLEDGEMENTS
Authors would like to thank Dr Sudhakar Srivastava, NuclearAgriculture and Biotechnology Division, for critically readingthe manuscript.
LITERATURE CITED
Aebi H. 1984. Catalase in vitro. Methods in Enzymology 105: 121–26.Anterola AM, Lewis NG. 2002. Trends in lignin modification: a comprehen-
sive analysis of the effects of genetic manipulations/mutations on lignifi-cations and vascular integrity. Phytochemistry 61: 221–294.
Borsani O, Valpuesta V, Botella MA. 2001. Evidence for a role of salicylicacid in the oxidative damage generated by NaCl and osmotic stress inArabidopsis seedlings. Plant Physiology 126: 1024–1030.
Cagnac O, Bourbouloux A, Chakrabarty D, Zhang MY, Delrot S. 2004.AtOPT6 transports glutathione derivatives and is induced by primisul-furon. Plant Physiology 135: 1378–1387.
Costa MA, Collins RE, Anterola AM, Cochrane FC, Davin LB, Lewis NG.2003. An in silico assessment of gene function and organization of thephenylpropanoid pathway metabolic networks in Arabidopsis thalianaand limitations thereof. Phytochemistry 64: 1097–1112.
Dietz KJ. 2008. Redox signal integration: from stimulus to networks andgenes. Physiologia Plantarum 133: 459–468.
FAO. 2008. Land resources, management, planning and use. Available onlineat http://www.fao.org/ag/agl/agll/spush/
Frugoli JA, Zhong HH, Nuccio ML, et al. 1996. Catalase is encoded by amultigene family in Arabidopsis thaliana. Plant Physiology 112:327–336.
Haake V, Cook D, Riechmann JL, Pineda O, Thomashow MF, Zhang JZ.2002. Transcription factor CBF4 is a regulator of drought adaptation inArabidopsis. Plant Physiology 130: 639–648.
Habig WH, Jacoby WB. 1981. Assay for differentiation of glutathioneS-transferases. Methods in Enzymology 77: 398–405.
Hahlbrock K, Ragg H. 1975. Light-induced changes of enzyme activities inparsley cell suspension cultures: effects of inhibitors of RNA and proteinsynthesis. Archives of Biochemistry and Biophysics 166: 41–46.
Han S, Kim D. 2006. AtRTPrimer: database for Arabidopsis genome-widehomogeneous and specific RT-PCR primer-pairs. BMC Bioinformatics7: 179. doi:10.1186/1471-2105-7-179
Heide H, Kalisz HM, Follmann H. 2004. The oxygen evolving enhancerprotein 1 (OEE) of photosystem II in green algae exhibits thioredoxinactivity. Journal of Plant Physiology 161: 139–149.
Hissin PJ, Hilf R. 1976. A fluorometric method for determination of oxidizedand reduced glutathione in tissues. Analytical Biochemistry 74: 214–226.
Hu H, Dai M, Yao J, Xiao B, Li X, Zhang Q, Xiong L. 2006. Overexpressinga NAM, ATAF, and CUC (NAC) transcription factor enhances droughtresistance and salt tolerance in rice. Proceedings of the NationalAcademy of Sciences, USA 103: 12987–12992.
Hudson ME, Bruggink T, Chang SH, et al. 2007. Analysis of geneexpression during Brassica seed germination using a cross-species micro-array platform. The Plant Genome 47: 96–112.
Jakab G, Ton J, Flors V, Zimmerli L, Metraux JP, Mauch-Mani B. 2005.Enhancing Arabidopsis salt and drought stress tolerance by chemicalpriming for its abscisic acid responses. Plant Physiology 139: 267–274.
Jauhar PP. 2006. Modern biotechnology as an integral supplement to conven-tional plant breeding: the prospects and challenges. Crop Science 46:1841–1859.
Kaplan B, Davydov O, Knight H, et al. 2006. Rapid transcriptome changesinduced by cytosolic Ca2+ transients reveal ABRE-related sequences asCa2+-responsive cis elements in Arabidopsis. The Plant Cell 18:2733–2748.
Kasuga M, Liu Q, Miura S, Yamaguchi-Shinozaki K, Shinizaki K. 1999.Improving plant drought, salt and freezing tolerance by gene transfer ofa single stress-inducible transcription factor. Nature Biotechnology 17:287–291.
Knight H, Trewavas AJ, Knight MR. 1997. Calcium signaling inArabidopsis thaliana responding to drought and salinity. The PlantJournal 12: 1067–1078.
Lowry OH, Roenbrough NJ, Farr AL, Randal EJ. 1951. Protein measurementwith the folin phenol reagent. Journal of Biological Chemistry 193: 265–275.
Luan S, Kudla J, Rodriguez-Concepcion M, Yalovsky S, Gruissem W.2002. Calmodulins and calcineurin B-like proteins: calcium sensors forspecific signal response coupling in plants. The Plant cell 14: 389–400.
Mahajan S, Tuteja N. 2005. Cold, salinity and drought stresses: an overview.Archives of Biochemistry and Biophysics 444: 139–158.
Miller G, Suzuki N, Ciftci-Yilmaz S, Mittler R. 2009. Reactive oxygenspecies homeostasis and signaling during drought and salinity stresses.Plant, Cell & Environment 33: 453–467.
Mukherjee G, Abeygunawardena N, Parkinson H, et al. 2005. Plant-basedmicroarray data at the European Bioinformatics Institute: introducingAtMIAMExpress, a submission tool for Arabidopsis gene expressiondata to ArrayExpress. Plant Physiology 139: 632–636.
Mukhopadhyay A, Vij S, Tyagi AK. 2004. Overexpression of a zinc-fingerprotein gene from rice confers tolerance to cold, dehydration, and saltstress in transgenic tobacco. Proceedings of the National Academy ofSciences, USA 101: 6309–6314.
Munns R, Tester M. 2008. Mechanisms of salinity tolerance. Annual Reviewof Plant Biology 59: 651–681.
Oh SJ, Kim YS, Kwon CW, Park HK, Jeong JS, Kim JK. 2009.Overexpression of the transcription factor AP37 in rice improves grainyield under drought conditions. Plant Physiology 150: 1368–1379.
Penfield S, King J. 2009. Towards a systems biology approach to understand-ing seed dormancy and germination. Proceedings of the Royal Society B,Biological Sciences 276: 3561–3569.
Provart N, Zhu T. 2003. A browser-based functional classification super-viewer for Arabidopsis genomics. Currents in Computational MolecularBiology 271–272.
Purty RS, Kumar G, Singla-Pareek SL, Pareek A. 2008. Towards salinitytolerance in Brassica: an overview. Physiology and Molecular Biologyof Plants 14: 39–49.
Qin X, Zeevaart JA. 1999. The 9-cis-epoxycarotenoid cleavage reaction is thekey regulatory step of abscisic acid biosynthesis in water-stressed bean.Proceedings of National Academy of Sciences USA 96: 15354–15361.
Sahu MP, Singh D. 1995. Role of thiourea in improving productivity of wheat(Triticum aestivum L.). Journal of Plant Growth and Regulation 14:169–173.
Sahu MP, Kumawat SM, D’Souza SF, Ramaswamy NK, Singh G. 2005.Sulfydryl bioregulator technology for increasing mustard production.Research Bulletin RAU-BARC 1–52.
Sairam RK, Tyagi A. 2004. Physiology and molecular biology of salinitystress tolerance in plants. Current Science 86: 407–421.
Srivastava et al. — Thiourea–mediated salinity–stress tolerance in Brassica 673
Dow
nloaded from https://academ
ic.oup.com/aob/article/106/5/663/141784 by guest on 11 D
ecember 2021

Saito S, Hirai N, Matsumoto C, et al. 2004. Arabidopsis CYP707As encode(+)-abscisic acid 8′-hydroxylase, a key enzyme in the oxidative catabo-lism of abscisic acid. Plant Physiology 134: 1439–1449.
Schroeder A, Mueller O, Stocker S, et al. 2006. The RIN: an RNA integritynumber for assigning integrity values to RNA measurements. BMCMolecular Biology 7: 3. doi:10.1186/1471-2199-7-3
Shelton MD, Chock PB, Mieyal JJ. 2005. Glutaredoxin: role inreversible protein s-glutathionylation and regulation of redox signal trans-duction and protein translocation. Antioxidant and Redox Signaling 7:348–366.
Srivastava AK, Ramaswamy NK, Mukopadhyaya R, Chiramal Jincy MG,D’Souza SF. 2009. Thiourea modulates the expression and activity profileof mtATPase under salinity stress in Brassica juncea L. Annals of Botany103: 403–410.
Srivastava AK, Suprasanna P, Srivastava S, D’Souza SF. 2010. Thioureamediated regulation in the expression profile of aquaporins and itsimpact on water homeostasis under salinity stress in Brassica juncearoots. Plant Science 178: 517–522.
Visarada KBRS, Meena K, Aruna C, Srujana S, Saikishore N,Seetharama N. 2009. Transgenic breeding: perspectives and prospects.Crop Science 49: 1555–1563.
Wagner U, Edwards R, Dixon DP, Mauch F. 2002. Probing the diversity ofthe Arabidopsis glutathione S-transferase gene family. Plant MolecularBiology 49: 515–532.
Willekens H, Chamnongpol S, Davey M, et al. 1997. Catalase is a sink forH2O2 and is indispensable for stress defence in C3 plants. EMBOJournal 16: 4806–4816.
Witcombe JR, Hollington PA, Howarth CJ, Reader S, Steele KA. 2008.Breeding for abiotic stresses for sustainable agriculture. PhilosophicalTransactions of the Royal Society B 363: 703–716.
Xing Y, Jia W, Zhang J. 2008. AtMKK1 mediates ABA-induced CAT1expression and H2O2 production via AtMPK6-coupled signaling inArabidopsis. The Plant Journal 54: 440–451.
Yamaguchi T, Blumwald E. 2005. Developing salt-tolerant cropplants: challenges and opportunities. Trends in Plant Science 12:1360–1385.
Srivastava et al. — Thiourea–mediated salinity–stress tolerance in Brassica674
Dow
nloaded from https://academ
ic.oup.com/aob/article/106/5/663/141784 by guest on 11 D
ecember 2021