genome analyses of >200,000 individuals identify 58 loci
TRANSCRIPT
ARTICLE
Genome Analyses of >200,000 Individuals Identify58 Loci for Chronic Inflammation and HighlightPathways that Link Inflammation and Complex Disorders
Symen Ligthart,1 Ahmad Vaez,2,3 Urmo Vosa,4,5 Maria G. Stathopoulou,6 Paul S. de Vries,1,7
Bram P. Prins,8 Peter J. Van der Most,2 Toshiko Tanaka,9 Elnaz Naderi,2,10 Lynda M. Rose,11 Ying Wu,12
Robert Karlsson,13 Maja Barbalic,14 Honghuang Lin,15 Rene Pool,16,17 Gu Zhu,18 Aurelien Mace,19,20,21
Carlo Sidore,22 Stella Trompet,23,24 Massimo Mangino,25,26 Maria Sabater-Lleal,27,28 John P. Kemp,29,30
Ali Abbasi,2,31,32 Tim Kacprowski,33,34 Niek Verweij,35 Albert V. Smith,36,37 Tao Huang,38,39
(Author list continued on next page)
C-reactive protein (CRP) is a sensitive biomarker of chronic low-grade inflammation and is associated with multiple complex diseases.
The genetic determinants of chronic inflammation remain largely unknown, and the causal role of CRP in several clinical outcomes is
debated. We performed two genome-wide association studies (GWASs), on HapMap and 1000 Genomes imputed data, of circulating
amounts of CRP by using data from 88 studies comprising 204,402 European individuals. Additionally, we performed in silico functional
analyses and Mendelian randomization analyses with several clinical outcomes. The GWAS meta-analyses of CRP revealed 58 distinct
genetic loci (p < 5 3 10�8). After adjustment for body mass index in the regression analysis, the associations at all except three loci re-
mained. The lead variants at the distinct loci explained up to 7.0% of the variance in circulating amounts of CRP. We identified 66 gene
sets that were organized in two substantially correlated clusters, one mainly composed of immune pathways and the other characterized
by metabolic pathways in the liver. Mendelian randomization analyses revealed a causal protective effect of CRP on schizophrenia and a
risk-increasing effect on bipolar disorder. Our findings provide further insights into the biology of inflammation and could lead to in-
terventions for treating inflammation and its clinical consequences.
Introduction
Inflammation plays a key role in the development of com-
plex diseases, such as cardiovascular disease,1 type 2 dia-
1Department of Epidemiology, Erasmus University Medical Center, Rotterdam 3
ningen, University Medical Center Groningen, Groningen 9700 RB, the Neth
ences, Isfahan 81746-73461, Iran; 4Department of Genetics, University of Gr
Netherlands; 5Estonian Genome Center, Institute of Genomics, University o
54000Nancy, France; 7HumanGenetics Center, Department of Epidemiology, H
versity of Texas Health Science Center at Houston, Houston, TX 77030, USA; 8
CB10 1SA, UK; 9Translational Gerontology Branch, National Institute on Aging
sity of Groningen, University Medical Center Groningen, Groningen 9713 GZ,
Hospital, Boston, MA 02215, USA; 12Department of Genetics, University of No
miology and Biostatistics, Karolinska Institutet, Stockholm 17177, Sweden; 14U
Medicine, Boston University School of Medicine, Boston, MA 02118, USA; 16D
versiteit, Amsterdam 1081 BT, the Netherlands; 17Amsterdam Public Health r
Netherlands; 18QIMR Berghofer Medical Research Institute, Brisbane, QLD 40
sanne, Lausanne 1010, Switzerland; 20Swiss Institute of Bioinformatics, Lausan
sity Hospital of Lausanne, Lausanne 1010, Switzerland; 22Istituto di Ricerca Gen23Department of Cardiology, Leiden University Medical Center, Leiden 2300
University Medical Center, Leiden 2333 ZA, the Netherlands; 25Department o
SE1 7EH, UK; 26NIHR Biomedical Research Centre at Guy’s and St. Thomas’ Fo
eases, Institut d’Investigacio Biomedica Sant Pau, Barcelona 08025, Spain; 28Ca
Medicine, Karolinska Institutet, Stockholm 17176, Sweden; 29University of Q
QLD 4102, Australia; 30MRC Integrative Epidemiology Unit, Bristol Medical S
Medicine, University of Groningen, University Medical Center Groningen, Gr
of Cambridge School of Medicine, Institute of Metabolic Science, Cambridge33Department of Functional Genomics, Interfaculty Institute for Genetics and
sity Greifswald, Greifswald 17475, Germany; 34German Centre for Cardio35University of Groningen, University Medical Center Groningen, Departmen
sociation, Kopavogur 201, Iceland; 37Faculty of Medicine, University of Icelan
School of Public Health, Peking University, Beijing 100191, China; 39Departm
02115, USA; 40Institute of Epidemiology II, Research Unit of Molecular Epidem
ronmental Health, Neuherberg 85764, Germany; 41German Center for Diabe
The American
� 2018 American Society of Human Genetics.
betes,2 Alzheimer disease,3 and schizophrenia.4 C-reactive
protein (CRP) is a sensitive marker of chronic low-grade
inflammation,5 and elevated serum amounts of CRP have
been associated with a wide range of diseases.6–8
000 CA, the Netherlands; 2Department of Epidemiology, University of Gro-
erlands; 3Department of Bioinformatics, Isfahan University of Medical Sci-
oningen, University Medical Center Groningen, Groningen 9700 RB, the
f Tartu, Tartu 51010, Estonia; 6Universite de Lorraine, INSERM, IGE-PCV,
umanGenetics, and Environmental Sciences, School of Public Health, Uni-
Department of Human Genetics, Wellcome Trust Sanger Institute, Hinxton
, Baltimore, MD 21224, USA; 10Department of Radiation Oncology, Univer-
the Netherlands; 11Division of Preventive Medicine, Brigham andWomen’s
rth Carolina, Chapel Hill, NC 27599, USA; 13Department of Medical Epide-
niversity of Split School of Medicine, Split 21000, Croatia; 15Department of
epartment of Biological Psychology, Netherlands Twin Register, Vrije Uni-
esearch institute, VU University Medical Center, Amsterdam 1081 BT, the
06, Australia; 19Department of Computational Biology, University of Lau-
ne 1015, Switzerland; 21Institute of Social and Preventive Medicine, Univer-
etica e Biomedica, Consiglio Nazionale delle Ricerche, Sardinia 08045, Italy;
RC, the Netherlands; 24Department of Gerontology and Geriatrics, Leiden
f Twin Research & Genetic Epidemiology, King’s College London, London
undation Trust, London SE1 9RT, UK; 27Unit of Genomics of Complex Dis-
rdiovascular Medicine Unit, Department of Medicine, Center for Molecular
ueensland Diamantina Institute, Translational Research Institute, Brisbane,
chool, University of Bristol, Bristol BS8 2BN, UK; 31Department of Internal
oningen 9713 GZ, the Netherlands; 32MRC Epidemiology Unit, University
Biomedical Campus, Addenbrooke’s Hospital, Cambridge CB2 0QQ, UK;
Functional Genomics, University Medicine and Ernst-Moritz-Arndt Univer-
vascular Research, Partner Site Greifswald, Greifswald 17475, Germany;
t of Cardiology, Groningen 9713 AV, the Netherlands; 36Icelandic Heart As-
d, Reykjavik 101, Iceland; 38Department of Epidemiology and Biostatistics,
ent of Nutrition, Harvard T.H. Chan School of Public Health, Boston, MA
iology, Helmholtz Zentrum Munchen, German Research Center for Envi-
tes Research, Partner Site Munich, Munich 85764, Germany; 42Division of
(Affiliations continued on next page)
Journal of Human Genetics 103, 691–706, November 1, 2018 691
Carola Marzi,40,41 Mary F. Feitosa,42 Kurt K. Lohman,43 Marcus E. Kleber,44 Yuri Milaneschi,45
Christian Mueller,46,47,48 Mahmudul Huq,2 Efthymia Vlachopoulou,49 Leo-Pekka Lyytikainen,50,51
Christopher Oldmeadow,52,53 Joris Deelen,54,55 Markus Perola,56 Jing Hua Zhao,57 Bjarke Feenstra,58
LifeLines Cohort Study,2 Marzyeh Amini,2 CHARGE Inflammation Working Group, Jari Lahti,59,60,61
Katharina E. Schraut,62 Myriam Fornage,63 Bhoom Suktitipat,64 Wei-Min Chen,65 Xiaohui Li,66
Teresa Nutile,67 Giovanni Malerba,68 Jian’an Luan,57 Tom Bak,69 Nicholas Schork,70,71
Fabiola Del Greco M.,72 Elisabeth Thiering,73,74 Anubha Mahajan,75 Riccardo E. Marioni,76,77
Evelin Mihailov,5 Joel Eriksson,78 Ayse Bilge Ozel,79 Weihua Zhang,80,81 Maria Nethander,82
Yu-Ching Cheng,83 Stella Aslibekyan,84 Wei Ang,85 Ilaria Gandin,86 Loıc Yengo,87,88 Laura Portas,89
Charles Kooperberg,90 Edith Hofer,91,92 Kumar B. Rajan,93 Claudia Schurmann,94,95Wouter den Hollander,96
Tarunveer S. Ahluwalia,97,98 Jing Zhao,99 Harmen H.M. Draisma,16,17,100 Ian Ford,101 Nicholas Timpson,30
Alexander Teumer,102 Hongyan Huang,103 Simone Wahl,40,41 YongMei Liu,43 Jie Huang,104 Hae-Won Uh,105
Frank Geller,58 Peter K. Joshi,62 Lisa R. Yanek,106 Elisabetta Trabetti,68 Benjamin Lehne,80 Diego Vozzi,107
Marie Verbanck,87 Ginevra Biino,108 Yasaman Saba,109 Ingrid Meulenbelt,96 Jeff R. O’Connell,83
Markku Laakso,110 Franco Giulianini,11 Patrik K.E. Magnusson,13 Christie M. Ballantyne,111,112
Jouke Jan Hottenga,16 GrantW. Montgomery,18 Fernando Rivadineira,113 Rico Rueedi,19,20 Maristella Steri,22
Karl-Heinz Herzig,114,115,116 David J. Stott,117 Cristina Menni,25 Mattias Franberg,28,118
Beate St. Pourcain,30,119 Stephan B. Felix,34,120 Tune H. Pers,58,98 Stephan J.L. Bakker,31 Peter Kraft,103
Statistical Genomics, Department of Genetics, Washington University School of Medicine, St. Louis, MO 63108-2212, USA; 43Department of Epidemiology
and Prevention, Public Health Sciences, Wake Forest University Health Sciences, Winston-Salem, NC 27157, USA; 44Vth Department of Medicine, Medical
Faculty Mannheim, Heidelberg University, Mannheim 68167, Germany; 45Department of Psychiatry, Amsterdam Neuroscience and Amsterdam Public
Health Research Institute, Amsterdam University Medical Center/GGZ inGeest Research & Innovation, Amsterdam 1081 HJ, the Netherlands;46Department of General and Interventional Cardiology, University Heart Center Hamburg, Hamburg 20246, Germany; 47Institute of Medical Biometry
and Statistics, University Medical Center Schleswig-Holstein, Campus Luebeck, Lubeck 23562, Germany; 48German Center for Cardiovascular Research,
Partner Site RhineMain, 55131 Mainz, Germany; 49Transplantation Laboratory, Medicum, University of Helsinki, Helsinki 00014, Finland; 50Department
of Clinical Chemistry, Fimlab Laboratories, Tampere 33014, Finland; 51Department of Clinical Chemistry, Finnish Cardiovascular Research Center - Tam-
pere, Faculty of Medicine and Life Sciences, University of Tampere, Tampere 33520, Finland; 52Hunter Medical Research Institute, New Lambon Heights,
NSW 2305, Australia; 53Centre for Clinical Epidemiology & Biostatistics, Faculty of Health and Medicine, University of Newcastle, Callaghan, NSW 2308,
Australia; 54Molecular Epidemiology, Leiden University Medical Center, Leiden 2333 ZC, the Netherlands; 55Max Planck Institute for Biology of Ageing,
Cologne 50931, Germany; 56National Institute for Health and Welfare, Helsinki 00271, Finland; 57MRC Epidemiology Unit, University of Cambridge
School of Clinical Medicine, Institute of Metabolic Science, Cambridge CB2 0QQ, UK; 58Department of Epidemiology Research, Statens Serum Institut,
Copenhagen 2300, Denmark; 59Helsinki Collegium for Advanced Studies, University of Helsinki, Helsinki 00014, Finland; 60Department of Psychology
and Logopedics, Faculty of Medicine, University of Helsinki, Helsinki 00014, Finland; 61Folkhalsan Research Centre, Helsinki 00250, Finland; 62Centre
for Global Health Research, Usher Institute of Population Health Sciences and Informatics, University of Edinburgh, Teviot Place, Edinburgh EH16
4UX, UK; 63Human Genetics Center, School of Public Health and Brown Foundation Institute of Molecular Medicine, University of Texas Health Science
Center at Houston, Houston, TX 77030, USA; 64Department of Biochemistry, Faculty of Medicine Siriraj Hospital, Mahidol University, Bangkok 10700,
Thailand; 65Center for Public Health Genomics, University of Virginia, Charlottesville, VA 22908, USA; 66Institute for Translational Genomics and Popu-
lation Sciences, Department of Pediatrics, Los Angeles Biomedical Research Institute at Harbor-UCLAMedical Center, Torrance, CA 90502, USA; 67Institute
of Genetics and Biophysics ‘‘A. Buzzati-Traverso,’’ Consiglio Nazionale delle Ricerche, Napoli 80131, Italy; 68Department of Neurosciences, Biomedicine
and Movement Sciences, University of Verona, Verona 37134, Italy; 69Interdisciplinary Center Psychopathology and Emotion regulation, University Med-
ical Center Groningen, University of Groningen, Groningen 9700 RB, the Netherlands; 70Human Biology, J. Craig Venter Institute, La Jolla, CA 92037, USA;71Quantitative Medicine, Translational Genomics Research Institute, Phoenix, AZ 85004, USA; 72Institute for Biomedicine, Eurac Research, Affiliated Insti-
tute of the University of Lubeck, Bolzano 39100, Italy; 73Institute of Epidemiology, Helmholtz Zentrum Munchen – German Research Centre for Environ-
mental Health, Neuherberg 85764, Germany; 74Ludwig Maximilian University of Munich, Dr. von Hauner Children’s Hospital, Munich 80337, Germany;75Wellcome Trust Centre for Human Genetics, University of Oxford, Oxford OX3 7BN, UK; 76Centre for Cognitive Ageing and Cognitive Epidemiology,
University of Edinburgh, Edinburgh EH8 9JZ, UK; 77Centre for Genomic and Experimental Medicine, Institute of Genetics and Molecular Medicine, Uni-
versity of Edinburgh, Edinburgh EH4 2XU, UK; 78Department of Internal Medicine and Clinical Nutrition, University of Gothenburg, Gothenburg 41345,
Sweden; 79Department of Human Genetics, University of Michigan, Ann Arbor, MI 48109-5618, USA; 80Department of Epidemiology and Biostatistics, Im-
perial College London, London W2 1PG, UK; 81Department of Cardiology, Ealing Hospital, Middlesex UB1 3HW, UK; 82Bioinformatics Core Facility, Sahl-
grenska Academy, University of Gothenburg, Gothenburg 413 90, Sweden; 83Division of Endocrinology, Diabetes and Nutrition, Department of Medicine,
University of Maryland School of Medicine, Baltimore, MD 21201, USA; 84Department of Epidemiology, University of Alabama at Birmingham, Birming-
ham, AL 35294-0022, USA; 85Medical School, University ofWestern Australia, Perth,WA 6009, Australia; 86AREA Science Park, Trieste 34149, Italy; 87Centre
National de la Recherche Scientifique UMR 8199, University of Lille, Institut Pasteur de Lille, European Genomic Institute for Diabetes, FR 3508, 59000
Lille, France; 88Program in Complex Trait Genomics, Institute for Molecular Bioscience, University of Queensland, St. Lucia, Brisbane, QLD 4072, Australia;89Support OU, Institute of Genetic and Biomedic Research, Consiglio Nazionale delle Ricerche, Sassari 7100, Italy; 90Fred Hutchinson Cancer Research Cen-
ter, Public Health Sciences Division, Mail Stop M3-A410, 1100 Fairview Ave. N., Seattle, WA, USA; 91Clinical Division of Neurogeriatrics, Department of
Neurology, Medical University Graz, Graz 8036, Austria; 92Institute of Medical Informatics, Statistics and Documentation, Medical University Graz,
Graz 8036, Austria; 93Department of Internal Medicine, Rush University Medical Center, Chicago, IL 60612, USA; 94Charles Bronfman Institute for Person-
alized Medicine, Icahn School of Medicine at Mount Sinai, New York, NY 10029, USA; 95Genetics of Obesity and Related Metabolic Traits Program, Icahn
School of Medicine at Mount Sinai, New York, NY 10029, USA; 96Department of Medical Statistics and Bio-informatics, Section Molecular Epidemiology,
Leiden University Medical Center, Leiden 2333 ZC, the Netherlands; 97Steno Diabetes Center Copenhagen, Gentofte 2820, Denmark; 98Novo Nordisk
Foundation Centre for Basic Metabolic Research, Section of Metabolic Genetics, Faculty of Health and Medical Sciences, University of Copenhagen, Co-
penhagen 2100, Denmark; 99Center for Integrative Genomics, School of Biology, Georgia Institute of Technology, Atlanta, GA 30332, USA;
(Affiliations continued on next page)
(Author list continued on next page)
692 The American Journal of Human Genetics 103, 691–706, November 1, 2018
Annette Peters,121 Dhananjay Vaidya,106 Graciela Delgado,44 Johannes H. Smit,45 Vera Großmann,122
Juha Sinisalo,123 Ilkka Seppala,50,51 Stephen R. Williams,124 Elizabeth G. Holliday,52,53 Matthijs Moed,54
Claudia Langenberg,57 Katri Raikkonen,60 Jingzhong Ding,125 Harry Campbell,62 Michele M. Sale,65
Yii-Der I. Chen,66 Alan L. James,126,127 Daniela Ruggiero,67,128 Nicole Soranzo,129 Catharina A. Hartman,69
Erin N. Smith,130 Gerald S. Berenson,131 Christian Fuchsberger,72 Dena Hernandez,132 Carla M.T. Tiesler,73,74
Vilmantas Giedraitis,133 David Liewald,76 Krista Fischer,5 Dan Mellstrom,78 Anders Larsson,134
Yunmei Wang,135 William R. Scott,80 Matthias Lorentzon,78,136 John Beilby,137,138 Kathleen A. Ryan,83
Craig E. Pennell,85 Dragana Vuckovic,139 Beverly Balkau,140 Maria Pina Concas,107 Reinhold Schmidt,91
Carlos F. Mendes de Leon,141 Erwin P. Bottinger,94,142 Margreet Kloppenburg,143,144 Lavinia Paternoster,30
Michael Boehnke,145 A.W. Musk,126,146 Gonneke Willemsen,16 David M. Evans,29,30 Pamela A.F. Madden,147
Mika Kahonen,148,149 Zoltan Kutalik,20,21 Magdalena Zoledziewska,22 Ville Karhunen,150
Stephen B. Kritchevsky,151 Naveed Sattar,152 Genevieve Lachance,25 Robert Clarke,153 Tamara B. Harris,154
Olli T. Raitakari,155,156 John R. Attia,52,53,157 Diana van Heemst,24 Eero Kajantie,158,159,160 Rossella Sorice,67
Giovanni Gambaro,161 Robert A. Scott,57 Andrew A. Hicks,72 Luigi Ferrucci,9 Marie Standl,73
Cecilia M. Lindgren,75,162,163 John M. Starr,76,164 Magnus Karlsson,165 Lars Lind,134 Jun Z. Li,79
John C. Chambers,80,81,166,167,168 Trevor A. Mori,85 Eco J.C.N. de Geus,16,17 Andrew C. Heath,147
Nicholas G. Martin,18 Juha Auvinen,150,169 Brendan M. Buckley,170 Anton J.M. de Craen,24,231
Melanie Waldenberger,40,171 Konstantin Strauch,172,173 Thomas Meitinger,174,175,176 Rodney J. Scott,52,177
Mark McEvoy,52,53 Marian Beekman,54 Cristina Bombieri,68 Paul M. Ridker,11,178 Karen L. Mohlke,12
100Neuroscience Campus Amsterdam, Amsterdam 1081 HV, the Netherlands; 101Robertson Centre for Biostatistics, University of Glasgow, Glasgow G12
8QQ, UK; 102Department SHIP-KEF, Institute for Community Medicine, University Medicine Greifswald, Greifswald 17475, Germany; 103Program in Ge-
netic Epidemiology and Statistical Genetics, Harvard T.H. Chan School of Public Health, Boston, MA 02115, USA; 104Boston VA Research Institute, Inc.,
Boston, MA 02130, USA; 105Medical Statistics and Bioinformatics, Leiden University Medical Center, Leiden 2333 ZC, the Netherlands; 106GeneSTAR
Research Center, Department of Medicine, Johns Hopkins University School of Medicine, Baltimore, MD 21287, USA; 107Institute for Maternal and Child
Health, IRCCS ‘‘Burlo Garofolo,’’ Trieste 34140, Italy; 108Institute of Molecular Genetics, Consiglio Nazionale delle Ricerche, Pavia 27100, Italy; 109Gottfried
Schatz Research Center, Institute for Molecular Biology and Biochemistry, 8010 Graz, Austria; 110Institute of Clinical Medicine, Internal Medicine, Univer-
sity of Eastern Finland and Kuopio University Hospital, Kuopio 70210, Finland; 111Department of Medicine, Baylor College of Medicine, Houston, TX
77030, USA; 112Methodist DeBakey Heart and Vascular Center, Houston, TX 77030, USA; 113Department of Internal Medicine, Erasmus University Medical
Center, Rotterdam 3015 CN, the Netherlands; 114Department of Physiology, Institute of Biomedicine, University of Oulu, Medical Research Center Oulu
and Oulu University Hospital, Oulu 90014, Finland; 115Biocenter Oulu, University of Oulu, Oulu 90220, Finland; 116Department of Gastroenterology and
Metabolism, Poznan University of Medical Sciences, Poznan 60-512, Poland; 117Institute of Cardiovascular andMedical Sciences, Faculty of Medicine, Uni-
versity of Glasgow, Glasgow G12 8QQ, UK; 118Department of Numerical Analysis and Computer Science, Stockholm University, Stockholm 100 44,
Sweden; 119Donders Institute, Radboud University, Nijmegen 6525 XD, the Netherlands; 120Department for Internal Medicine B, University Medicine
Greifswald, Greifswald 17475, Germany; 121Institute of Epidemiology II, Helmholtz Zentrum Munchen, German Research Center for Environmental
Health, Neuherber 85764, Germany; 122Center for Thrombosis and Hemostasis, University Medical Center of the Johannes Gutenberg University Mainz,
Mainz 55131, Germany; 123Heart and Lung Center, Helsinki University Hospital and Helsinki University, Helsinki 00029, Finland; 124Department of
Neurology, University of Virginia, Charlottesville, VA 22908, USA; 125Department of Internal Medicine/Geriatrics, Wake Forest University Health Sciences,
Winston-Salem, NC 27157, USA; 126Busselton Population Medical Research Institute, Sir Charles Gairdner Hospital, Nedlands, WA 6009, Australia;127Department of Pulmonary Physiology and Sleep Medicine, Sir Charles Gairdner Hospital, Nedlands, WA 6009, Australia; 128IRCCS Neuromed, Pozzilli
(IS) 86077, Italy; 129Sanger Institute, Wellcome Trust Genome Campus, Hinxton CB10 1SA, UK; 130Department of Pediatrics and Rady Children’s Hospital,
School of Medicine, University of California, San Diego, La Jolla, CA 92037, USA; 131Center for Cardiovascular Health, Tulane University, New Orleans, LA
70112, USA; 132Laboratory of Neurogenetics, National Institute on Aging, Bethesda, MD 20892, USA; 133Department of Public Health and Caring Sciences,
Molecular Geriatrics, Uppsala University, Uppsala 752 37, Sweden; 134Department of Medical Sciences, Uppsala University, Uppsala 751 41, Sweden;135Department of Medicine, Case Cardiovascular Research Institute, Case Western Reserve University, Harrington Heart & Vascular Institute, University
Hospitals, Cleveland, OH 44106, USA; 136Geriatric Medicine, Sahlgrenska University Hospital, Molndal 431 80, Sweden; 137PathWest Laboratory Medicine
WA, Nedlands, WA 6009, Australia; 138School of Biomedical Sciences, University of Western Australia, Crawley, Perth, WA 6009, Australia; 139Medical Sci-
ences, Surgical and Health Department, University of Trieste, Trieste 34137, Italy; 140INSERM U1018, Centre de Recherche en Epidemiologie et Sante des
Populations, Team 5 (EpReC, Renal, and Cardiovascular Epidemiology), Universite de Versailles Saint-Quentin-en-Yvelines, Universite Paris-Saclay, Villejuif
94807, France; 141Department of Epidemiology, School of Public Health, University of Michigan, Ann Arbor, MI 48109, USA; 142Department of Pharma-
cology and Systems Therapeutics, Icahn School of Medicine at Mount Sinai, New York, NY 10029, USA; 143Department of Rheumatology, Leiden University
Medical Center, Leiden 2300 RC, the Netherlands; 144Department of Clinical Epidemiology, Leiden University Medical Center, Leiden 2333 ZC, the
Netherlands; 145Department of Biostatistics and Center for Statistical Genetics, University of Michigan, Ann Arbor, MI 48109, USA; 146Department of Res-
piratory Medicine, Sir Charles Gairdner Hospital, Nedlands, WA 6009, Australia; 147Department of Psychiatry, Washington University School of Medicine,
4560 Clayton Ave., Suite 1000, St. Louis, MO 63110, USA; 148Department of Clinical Physiology, Tampere University Hospital, Tampere 33520, Finland;149Department of Clinical Physiology, Finnish Cardiovascular Research Center - Tampere, Faculty of Medicine and Life Sciences, University of Tampere,
Tampere 33520, Finland; 150Center for Life Course Health Research, Faculty of Medicine, University of Oulu, 90014 Oulun yliopisto, Finland;151Gerontology and Geriatric Medicine, Sticht Center on Aging and Rehabilitation, Wake Forest University Health Sciences, Winston-Salem, NC 27157,
USA; 152BHF Glasgow Cardiovascular Research Centre, Faculty of Medicine, Glasgow G12 8TA, UK; 153Clinical Trial Service Unit, Nuffield Department
of Population Health, University of Oxford, Oxford OX3 7LF, UK; 154Laboratory of Epidemiology and Population Sciences, National Institute on Aging,
Intramural Research Program, National Institutes of Health, Bethesda, MD 20892, USA; 155Department of Clinical Physiology and Nuclear Medicine, Turku
University Hospital, Turku 20520, Finland; 156Research Centre of Applied and Preventive Cardiovascular Medicine, University of Turku, Turku 20520,
Finland; 157John Hunter Hospital, New Lambton Heights, NWS 2305, Australia; 158Chronic Disease Prevention Unit, National Institute for Health and
(Affiliations continued on next page)
(Author list continued on next page)
The American Journal of Human Genetics 103, 691–706, November 1, 2018 693
Nancy L. Pedersen,13 Alanna C. Morrison,7 Dorret I. Boomsma,16 John B. Whitfield,18 David P. Strachan,179
Albert Hofman,1 Peter Vollenweider,180 Francesco Cucca,22 Marjo-Riitta Jarvelin,115,150,169,181,182
J. Wouter Jukema,23,183,184 Tim D. Spector,25 Anders Hamsten,28 Tanja Zeller,46,48 Andre G. Uitterlinden,1,113
Matthias Nauck,34,185 Vilmundur Gudnason,36,37 Lu Qi,39,186 Harald Grallert,40,41 Ingrid B. Borecki,187
Jerome I. Rotter,188 Winfried Marz,44,189,190 Philipp S. Wild,48,122,191 Marja-Liisa Lokki,49 Michael Boyle,157
Veikko Salomaa,56 Mads Melbye,58,192,193 Johan G. Eriksson,56,61,194 James F. Wilson,62,195
Brenda W.J.H. Penninx,45 Diane M. Becker,106 Bradford B. Worrall,196 Greg Gibson,99 Ronald M. Krauss,197
Marina Ciullo,67,128 Gianluigi Zaza,198 Nicholas J. Wareham,57 Albertine J. Oldehinkel,69 Lyle J. Palmer,199
Sarah S. Murray,200 Peter P. Pramstaller,72,201,202 Stefania Bandinelli,203 Joachim Heinrich,73,204
Erik Ingelsson,205,206,207 Ian J. Deary,76,208 Reedik Magi,5 Liesbeth Vandenput,78 Pim van der Harst,35
Karl C. Desch,209 Jaspal S. Kooner,81,166,168,210 Claes Ohlsson,78 Caroline Hayward,195 Terho Lehtimaki,50,51
Alan R. Shuldiner,83 Donna K. Arnett,211 Lawrence J. Beilin,85 Antonietta Robino,107 Philippe Froguel,87,212
Mario Pirastu,89 Tine Jess,213 Wolfgang Koenig,171,214,215 Ruth J.F. Loos,94,95,216 Denis A. Evans,93
Helena Schmidt,217,218 George Davey Smith,30 P. Eline Slagboom,54 Gudny Eiriksdottir,36
Andrew P. Morris,75,219 Bruce M. Psaty,220,221,222,223 Russell P. Tracy,224 Ilja M. Nolte,2 Eric Boerwinkle,225,226
Welfare, Helsinki 00014, Finland; 159Hospital for Children and Adolescents, Helsinki University Central Hospital and University of Helsinki, Helsinki
00290, Finland; 160Department of Obstetrics and Gynaecology, MRC Oulu, Oulu University Hospital and University of Oulu, Oulu 90014, Finland;161Division of Nephrology andDialysis, Columbus-Gemelli University Hospital, Universita Cattolica del Sacro Cuore, Roma 168, Italy; 162Big Data Institute,
Li Ka Shing Centre for Health Information and Discovery, University of Oxford, Oxford OX3 7FZ, UK; 163Program in Medical and Population Genetics,
Broad Institute, Cambridge, MA 02142, USA; 164Alzheimer’s Scotland Dementia Research Centre, University of Edinburgh, Edinburgh EH8 9JZ, UK;165Department of Clinical Sciences and Orthopaedic Surgery, Lund University, Malmo 20502, Sweden; 166Imperial College Healthcare NHS Trust, London
W12 0HS, UK; 167Lee Kong Chian School of Medicine, Nanyang Technological University, Singapore 308232, Singapore; 168MRC-PHE Centre for Environ-
ment and Health, Imperial College London, London W2 1PG, UK; 169Unit of Primary Health Care, Oulu University Hospital, Oulu 90220, Finland;170Department of Epidemiology and Public Health, University College Cork, Cork T12 K8AF, Ireland; 171German Center for Cardiovascular Research, Part-
ner Site Munich Heart Alliance, 80636 Munich, Germany; 172Institute of Genetic Epidemiology, Helmholtz Zentrum Munchen, German Research Center
for Environmental Health, Neuherberg 85764, Germany; 173Genetic Epidemiology, Institute of Medical Informatics, Biometry, and Epidemiology, Faculty
of Medicine, Ludwig Maximilian University of Munich, Neuherberg 85764, Germany; 174Institute of Human Genetics, Technische Universitat Munchen,
Munich 85764, Germany; 175Institute of Human Genetics, Helmholtz Zentrum Munchen, Neuherberg 85764, Germany; 176Munich Cluster for Systems
Neurology (SyNergy), Munich 81377, Germany; 177Information-Based Medicine Stream, Hunter Medical Research Institute, New Lambton Heights,
NSW 2305, Australia; 178Harvard Medical School, Boston, MA 02115, USA; 179Population Health Research Institute, St. George’s, University of London,
London SW17 0RE, UK; 180Department of Internal Medicine, Centre Hospitalier Universitaire Vaudois, Lausanne 1011, Switzerland; 181Department of
Epidemiology and Biostatistics, MRC-PHE Centre for Environment & Health, School of Public Health, Imperial College London, London W2 1PG, UK;182Department of Life Sciences, College of Health and Life Sciences, Brunel University London, Kingston Lane, Uxbridge, Middlesex UB8 3PH, UK;183Durrer Center for Cardiogenetic Research, Amsterdam 3501 DG, the Netherlands; 184Interuniversity Cardiology Institute of the Netherlands, Utrecht
3511 EP, the Netherlands; 185Institute for Clinical Chemistry and Laboratory Medicine, University Medicine Greifswald, Greifswald 17475, Germany;186Department of Epidemiology, Tulane University School of Public Health and Tropical Medicine, New Orleans, LA 70112, USA; 187Analytical Genetics
Group, Regeneron Genetics Center, Regeneron Pharmaceuticals, Inc., Tarrytown, NY 10591, USA; 188Institute for Translational Genomics and Population
Sciences, Departments of Pediatrics and Medicine, Los Angeles Biomedical Research Institute at Harbor-UCLA Medical Center, Torrance, CA 90502, USA;189Synlab Academy, Synlab Holding Deutschland GmbH, Mannheim 68161, Germany; 190Clinical Institute of Medical and Chemical Laboratory Diagnos-
tics, Medical University of Graz, Graz 8036, Austria; 191Preventive Cardiology and PreventiveMedicine, Center for Cardiology, UniversityMedical Center of
the Johannes Gutenberg-University Mainz, Mainz 55131, Germany; 192Department of Clinical Medicine, University of Copenhagen, Copenhagen 2300,
Denmark; 193Department of Medicine, Stanford University School of Medicine, Stanford, CA 94305, USA; 194Department of General Practice and Primary
Health Care, University of Helsinki and Helsinki University Hospital, Helsinki 00014, Finland; 195MRC Human Genetics Unit, Institute for Genetics and
Molecular Medicine, University of Edinburgh, Western General Hospital, Edinburgh EH4 2XU, UK; 196Departments of Neurology and Public Health Sci-
ences, University of Virginia Charlottesville, Charlottesville, VA 22908-0394, USA; 197Children’s Hospital Oakland Research Institute, Oakland, CA
94609, USA; 198Renal Unit, Department of Medicine, Verona University Hospital, Verona 37126, Italy; 199School of Public Health, University of Adelaide,
Adelaide, SA 5000, Australia; 200Department of Pathology, University of California, San Diego, San Diego, CA 92121, USA; 201General Central Hospital,
Department of Neurology, Bolzano 39100, Italy; 202Department of Neurology, University of Lubeck, Lubeck 23538, Germany; 203Geriatric Unit, Azienda
Sanitaria Firenze, Florence 50122, Italy; 204Institute and Clinic for Occupational, Social and Environmental Medicine, University Hospital, LMU Munich,
Comprehensive Pneumology Center Munich, Member DZL, German Center for Lung Research, 81377 Munich, Germany; 205Department of Medical Sci-
ences, Molecular Epidemiology and Science for Life Laboratory, Uppsala University, Uppsala 751 41, Sweden; 206Department of Medicine, Division of Car-
diovascular Medicine, Stanford University School of Medicine, Stanford, CA 94305, USA; 207Stanford Cardiovascular Institute, Stanford University, Stan-
ford, CA 94305, USA; 208Department of Psychology, University of Edinburgh, Edinburgh EH8 9JZ, UK; 209Department of Pediatrics and Communicable
Diseases, University of Michigan, Ann Arbor, MI 48109, USA; 210National Heart and Lung Institute, Imperial College London, London W12 0NN, UK;211University of Kentucky, College of Public Health, Lexington, KY 40508, USA; 212Department of Genomics of Common Disease, School of Public Health,
Imperial College London, London SW7 2AZ, UK; 213Center for Clinical Research and Prevention, Bispebjerg and Frederiksberg Hospital, Frederiksberg 2200,
Denmark; 214Department of Internal Medicine II-Cardiology, University of Ulm Medical Center, 80801 Ulm, Germany; 215Deutsches Herzzentrum Mun-
chen, Technische Universitat Munchen, 80636 Munich, Germany; 216Mindich Child Health and Development Institute, Icahn School of Medicine at
Mount Sinai, New York, NY 10029-6542, USA; 217Department of Neurology, Medical University Graz, Graz 8010, Austria; 218Institute of Molecular Biology
and Biochemistry, Centre for Molecular Medicine, Medical University of Graz, Graz 8010, Austria; 219Department of Biostatistics, University of Liverpool,
Liverpool L69 3GL, UK; 220Cardiovascular Health Research Unit, Department of Medicine, University of Washington, Seattle, WA 98101, USA;221Department of Epidemiology, University of Washington, Seattle, WA 98101, USA; 222Department of Health Services, University of Washington, Seattle,
WA 98195-7660, USA; 223Kaiser Permanente Washington Health Research Institute, Seattle, WA 98101, USA; 224Department of Pathology, University of
Vermont, Colchester, VT 05405, USA; 225Human Genetics Center, School of Public Health, University of Texas Health Science Center at Houston, Houston,
(Author list continued on next page)
(Affiliations continued on next page)
694 The American Journal of Human Genetics 103, 691–706, November 1, 2018
Sophie Visvikis-Siest,6 Alex P. Reiner,221 Myron Gross,227 Joshua C. Bis,220 Lude Franke,4 Oscar H. Franco,1,228
Emelia J. Benjamin,15,229 Daniel I. Chasman,11,178 Josee Dupuis,229,230 Harold Snieder,2
Abbas Dehghan,1,181,* and Behrooz Z. Alizadeh2,*
Unraveling the genetics of inflammation could provide
further insights into the underlying biology of inflamma-
tion and could identify therapeutic targets for attenuating
inflammation.
The genetic determinants of CRP have only been partly
characterized. In 2011, our group published a HapMap-
based genome-wide association study (GWAS) meta-anal-
ysis including a discovery panel of up to 65,000 individuals
and found 18 loci that were associated with amounts of
CRP.9 Increasing GWAS sample size and denser mapping
of the genome with further advanced imputation panels
could help to identify further genes associated with the
phenotypes of interest.10,11 Furthermore, by using genetic
instrumental variables (i.e., a genetic score), Mendelian
randomization (MR) allows investigation of the potential
causal effect of an exposure on clinical outcomes and could
help to elucidate the causal pathways that link the expo-
sure with the outcome.12 The causal role of CRP in the
development of diseases is still controversial,13 and the
causal pathways that link inflammation to complex disor-
ders are only partly understood.
Weapplied two large-scaleGWASsoncirculatory amounts
ofCRPbyusingHapMapand1000Genomes (1KG) imputed
data to identify genetic determinants of chronic inflamma-
tion. Because bodymass index (BMI) is amajor determinant
of CRP amounts, we additionally conducted a GWAS
adjusted for BMI to identify associated loci independent of
BMI. To identify any sex differences in genetic determinants
of chronic inflammation, we further conducted GWASs in
men and women separately. We applied in silico functional
analyses on the identified loci to obtain better insights
into the biological processes potentially regulating chronic
inflammation. Finally, we conducted MR analyses to pro-
vide an improved understanding of the causal relation be-
tween CRP and several related clinical outcomes.
Material and Methods
GWAS for Circulating Amounts of CRPWe conducted a meta-analysis of GWASs including individuals of
Europeanancestrywithin theCohorts forHeart andAgingResearch
in Genomic Epidemiology (CHARGE) Inflammation Working
Group (CIWG).14 All participating studies were approved by an
institutional review board (see details in the Supplemental Data).
The CIWG invited cohorts for participation in the HapMap GWAS
meta-analysis of CRP amounts in 2012. In 2014, in light of our
assessment that showed complementary values of HapMap and
TX 77030, USA; 226Human Genome Sequencing Center, Baylor College of Med
ogy, University of Minnesota, Minneapolis, MN 55455, USA; 228Institute of S229National Heart, Lung, and Blood Institute’s Framingham Heart Study, Fram
School of Public Health, Boston, MA 02118, USA231Deceased
*Correspondence: [email protected] (A.D.), [email protected] (B.
https://doi.org/10.1016/j.ajhg.2018.09.009.
The American
1KG imputed GWASs,10 we invited studies to participate in the
1KG GWAS meta-analysis. The 1KG GWAS could help to identify
loci that were not covered in the HapMap GWAS and fine-map
loci found in the HapMap GWAS. Cohorts were allowed to partici-
pate in either the HapMap or 1KGGWAS or both. Here, we present
a meta-analysis of both HapMap (204,402 individuals from 78
studies) and1KG (148,164 individuals from49 studies) imputed-ge-
notype GWASs. All participating cohorts implemented a pre-speci-
fied study plan comprising study design, data quality check, data
analysis, and data sharing. Wemeasured serum CRP inmg/L by us-
ing standard laboratory techniques (Supplemental Data) and trans-
formed the values by natural log. Individuals with auto-immune
diseases, individuals taking immune-modulating agents (if this in-
formation was available), and individuals with CRP amounts 4 SD
or more away from the mean were excluded from all analyses. The
characteristics of the participants are presented in Table S1. We
filtered individuals and genetic variants on the basis of study-spe-
cific quality-control criteria (Table S2). At each individual study
site, we tested genetic variants for association with amounts of
CRP by using an additive linear regression model adjusted for age,
sex, and population substructure and accounting for relatedness,
if relevant. Before meta-analysis, we filtered variants on the basis
of imputationquality at anR2 index>0.4.Toavoid type I error infla-
tion, we corrected study-specific GWASs for genomic inflation. For
the HapMap study, we conducted fixed-effect meta-analyses for
each genetic variant by using the inverse-variance-weighted
(IVW)method implemented inGWAMA15 andperformed a second
genomic control on the meta-analysis level. For the 1KG imputed
GWAS, we used METAL16 to perform a fixed-effect meta-analysis.
We removed variants that were available in only<50% of the sam-
ples. The HapMap meta-analysis included 2,437,193 variants, and
the 1KG GWAS included 10,019,203 variants. We considered asso-
ciations with p < 5 3 10�8 to be genome-wide significant. We
used a stringent distance criterion—aminimum of 500 kb between
two significant variants—to identify distinct loci. In each locus, the
variant with the smallest p value was called the lead variant.
Additionally, we performed sex-stratified analyses among HapMap
imputed studies, and we tested for heterogeneity between sex-spe-
cific effect estimates as described previously17 by using the false-dis-
covery rate (FDR) of Benjamini-Hochberg to assess significance of
the p value for sex difference (<0.05). We conducted BMI-adjusted
analyses in the 1KG meta-analysis to determine the role of BMI in
mediating the genetic associations with CRP and to increase power
to detect associations not mediated by BMI.
LD Score RegressionBecause population stratification is a major concern in GWASs and
can lead to false-positive associations, we applied linkage disequi-
librium (LD) score regression (LDSC) to distinguish whether the
inflation of test statistics observed in the CRP GWAS was due to
the polygenic architecture of CRP or reflected confounding bias
icine, Houston, TX 77030, USA; 227Department of Lab Medicine and Pathol-
ocial and Preventive Medicine, University of Bern, 3012 Bern, Switzerland;
ingham, MA 01702, USA; 230Department of Biostatistics, Boston University
Z.A.)
Journal of Human Genetics 103, 691–706, November 1, 2018 695
due to cryptic relatedness or population stratification. The LD score
measures collective genetic variation acquired from all genetic var-
iants in LD with the index tagging (causal) variant.18 A higher LD
score of an index variant implicates more nearby genetic variants
in high LD with the index variant, which makes it more likely
that the index variant tags causal variant(s). More genetic variants
in LD with the index genetic variant (i.e., a higher LD score due to
polygenicity) could yield higher (i.e., inflated) test statistics. In
contrast, higher test statistics caused by cryptic population stratifi-
cation will not be related to the LD score. LDSC analysis performs
regression of the summary statistics from the GWASmeta-analysis
(c2 statistics from the GWAS) on the LD scores across the genome.
An LDSC intercept that equals 1 suggests no confounding bias,
whereas an inflated intercept (larger than 1) suggests contribution
of confounding due to relatedness to the test statistics.We used the
LDHubweb interface to performLDSC.19Wefilteredvariants to the
subset ofHapMap3 variants and excluded variantswith duplicated
rs numbers, ambiguous variants, minor allele frequency (MAF) <
0.01, and reported sample size < 66.7% of the total sample size.
We used the default European LD score file based on the European
1KG reference panel.
Furthermore, we applied cross-trait LDSC to estimate genetic
correlation of chronic inflammation (by using the HapMap
GWAS meta-analysis) with other phenotypes by using published
GWAS summary statistics.20 In brief, the cross-product of
two GWAS test statistics is calculated at each genetic variant,
and this cross-product is regressed on the LD score. The slope of
the regression is used for estimating the genetic covariance be-
tween two phenotypes.
Identification of Additional Distinct Variants in
Associated LociTo identify additional distinct variants in the associated loci, we
performed joint approximate conditional analysis with the 1KG
meta-analysis summary statistics and the LD matrix derived
from the first cohort of the Rotterdam Study (RS-I) (n ¼ 5,974).
We used the Genome-wide Complex Trait Analysis (GCTA) tool,
which performs a genome-wide stepwise procedure to identify var-
iants according to their distinct association with CRP (i.e., condi-
tional p).21,22 We only used variants with an imputation quality of
R2 > 0.8 in the reference set (RS-I). This approximate conditional
analysis could reveal different lead signals in a locus where multi-
ple associated variants were in the final joint association model.
We tested the distinct variants identified in CRP jointly for an as-
sociation with CRP by using individual-level data from the second
and third cohorts of the Rotterdam Study (RS-II and RS-III, totaling
5,024 subjects) and the Women’s Genome Health Study (WGHS)
of 16,299 individuals.
Proportion of CRP Variance ExplainedWe estimated the variance explained in serum amounts of CRP by
using the formula (23 MAF(1 �MAF)b2)/var(CRP), where b is the
estimated effect of the individual variants on CRP23 and var(CRP)
is the estimated variance in natural-log-transformed CRP in the
RS-I cohort. We calculated the variance explained for four combi-
nations of associated variants: (1) the lead variant at just the CRP
locus, (2) the distinct variants derived from the 1KG joint condi-
tional analysis at the CRP locus, (3) all lead variants in the distinct
loci, and (4) all lead variants in the distinct loci and, when appli-
cable, the distinct variants derived from the approximate joint
conditional analysis at associated loci.
696 The American Journal of Human Genetics 103, 691–706, Novem
Pathway Analysis and Gene ExpressionWe used Data-Driven Expression-Prioritized Integration for Com-
plex Traits24 (DEPICT v.1 rel173 beta) to systematically prioritize
the most likely causal genes, highlight the pathways enriched
with these genes, and identify tissues and cell types in which genes
from associated loci are highly expressed. DEPICT requires sum-
mary statistics from the GWAS meta-analysis. First, we filtered
genome-wide-associated variants from both GWAS meta-analyses
by MAF > 0.01 and selected variants with a low correlation with
other variants according to PLINK (v.1.90) by using a clumping dis-
tance of 500 kb between variants and/or index of LD r2 threshold<
0.1. The settings for the analysis involved the usage of 1KG pilot
phase data25 (phase 1 integrated release v.3; unrelated CEU [Utah
residents with ancestry from northern and western Europe], GBR
[British in England and Scotland], and TSI [Toscani in Italia] indi-
viduals;November 23, 2010)with an r2>0.5 LD threshold for locus
definition, 10,000 permutations for bias correction, and 500 repe-
titions for FDR calculation. To summarize and visualize the results,
we calculated pairwise Pearson correlation coefficients between all
gene-specific Z scores for every pair of reconstituted DEPICT gene
sets.Weused Affinity PropagationClustering (apcluster command;
APCluster R package26) to identify clusters and representative ex-
amples of the clusters and used Cytoscape v.3.2.1 to visualize the
results. The DEPICT results of the pathway and gene prioritization
are summarized as a heatmap (R v.2.3.3; pheatmap v.1.0.8 pack-
age27). The gene-specific Z score describes the likelihood that a
given gene is part of the corresponding Gene Ontology (GO)
term, KEGG pathway, REACTOME pathway, Mouse Phenotype,
or protein-protein interaction network.
Also, we performed Multi-marker Analysis of GenoMic Annota-
tion (MAGMA).28 MAGMA performs gene and gene-set analysis
and requires the association results of all variants; therefore, we
chose the larger HapMap GWAS for MAGMA. We used the Func-
tional Mapping and Annotation (FUMA)29 tool to perform
MAGMA and applied standard settings for running MAGMA.
To prioritize the most likely trait-relevant gene for each GWAS
locus, we ran colocalization analysis with the ‘‘coloc’’ R package
v.3.130 separately for the HapMap and 1KG GWASs. We used pub-
licly available genome-wide expression quantitative trait locus
(eQTL) data from 5,311 whole-blood samples31 and from the
Genome Tissue Expression (GTEx) V6p portal, which incorporates
eQTL data from 44 post-mortem tissues.32 The coloc package uses
approximate Bayes factors to estimate the posterior probability
that GWAS and eQTL effects share a single causal variant. All sig-
nificant cis-eGenes or cis-eProbes (q < 0.05 in GTEx; lowest cis-
eQTL FDR < 0.05 in Westra et al.31) were extracted 5 1 Mb from
the lead SNP of each locus. The HapMap SNP positions were con-
verted to hg19 positions (UCSC Genome Browser) with the lift-
Over command from the rtracklayer v.1.38.3 package. We used
the SNPs present in both the GWAS and eQTL datasets. For the
HapMap GWAS, the 1KG GWAS, and the GTEx eQTL datasets,
we performed the test by using association b, standard error of b,
and MAF. For the data from Westra et al.,31 we used association
p value, MAF, and sample size and included only the subset of
cis-eQTLs that are publicly available (up to a significance FDR <
0.5). We used default priors supplied by the coloc package (P1 ¼1 3 10�4, P2 ¼ 1 3 10�4, and P12 ¼ 1 3 10�5; prior probabilities
for association in the GWAS datasets, the eQTL datasets, and
both). Full MAF data were not available for the eQTL datasets, so
we used the GIANT 1KG p1v3 EUR reference panel instead. We
visualized the results as a heatmap by using the pheatmap
v.1.0.8 R package.27
ber 1, 2018
Mendelian RandomizationTo assess the effect of CRP on complex disorders, we performed a
two-sample MR study on nine clinical outcomes—Alzheimer dis-
ease (AD), bipolar disorder (BD), coronary artery disease (CAD),
Crohn disease (CD), inflammatory bowel disease (IBD), rheuma-
toid arthritis (RA), schizophrenia, and diastolic blood pressure
(DBP), and systolic blood pressure (SBP)—to which CRP showed
a potentially causal association at a p < 0.1 in a previous MR
study.13 We used the effect estimates of the 48 lead SNPs found
to be associated with CRP in the HapMap GWAS and the effect es-
timates of the four SNPs that were additionally found to be associ-
ated with CRP in the 1KG GWAS in a multiple-instrument
approach for theMR analyses (n¼ 52 SNPs). Additionally, we sepa-
rately studied the effect of rs2794520 at the CRP locus to minimize
the probability of introducing horizontal pleiotropy.We tested the
statistical significance of the association between the instrument
and CRP with the following formula:
F ¼ R2ðn� 1� kÞð1� R2Þ3 k
R2 is the CRP variance explained by the genetic instrument
(0.014 for the rs2794520 SNP and 0.065 for the 52-SNP score), n
is the number of individuals included in the CRP GWAS, and k
is the number of variants included in the genetic score. The F sta-
tistic was 273 for the 52-SNP score and 2,902 for the rs2794520
SNP, indicating that both instruments were strong.
For the clinical outcomes, we used summary statistics from the
most recent meta-analysis of GWASs. For DBP and SBP, we used
data from the UK Biobank. The details of the outcome studies are
summarized in Table S12.We implemented four differentmethods
of MR analyses: the IVW method, MR-Egger, weighted median
(WM), and penalized weighted median (PWM). We used the Two-
SampleMR package in R for the MR analyses.33 Further, we applied
the Bonferroni method to correct for multiple testing (0.05/9 phe-
notypes ¼ 5.6 3 10�3). When the Q statistic of the IVW analyses
provided evidence for heterogeneity, the WM estimates were used
for significance. The MR methods are described briefly below.
Inverse-Variance Weighted
The IVWmethod obtains the causal estimate by regressing the SNP
associationswith the outcome on the SNP associations with the risk
factor; the intercept is set to 0, andweights are the inverse variances
(IVs)of theSNPassociationswith theoutcome.Witha single genetic
variant, the estimate is the ratio of coefficients bY/bX, and the stan-
dard error is the first term of the Dmethod approximation bYse/bX.
When all CRP SNPs are valid IVs, the IVWestimates converge to the
true causal effect.Whenoneormore invalid IVsarepresent (i.e., one
SNP has an effect on an outcome through a different pathway than
CRP), the IVWestimate deviates from the true causal effect.
MR-Egger
We used MR-Egger to account for potential unbalanced pleiotropy
in the multiple-variant instrument.34 When unbalanced pleiot-
ropy is present, an alternative effect (positive or negative) is pre-
sent between the SNP and the outcome, and it could bias the
estimate of the causal association. TheMR-Egger method is similar
to the IVW analysis but does not force the intercept to pass
through the origin. The slope of the MR-Egger regression provides
the estimate of the causal association betweenCRP and the clinical
outcome. An MR-Egger intercept that is significantly different
from 0 suggests directional pleiotropic effects that could bias un-
corrected estimates of the causal effect. MR-Egger regression de-
pends on the InSIDE (instrument strength independent of direct
effect) assumption, which states that the strengths of the effect
The American
of the SNP on the outcome are uncorrelated with the direct pleio-
tropic effect of the SNP on the outcome.
Weighted Median and Penalized Weighted Median
Weapplied themedian-basedmethod toprovide robust estimates of
causal association even in the presence of horizontal pleiotropy
when up to 50% of the information contributed by the genetic var-
iants is invalid.35 In PWM analysis, the effect of each variant is
weightedbya factor that corresponds to theQstatistics (heterogene-
ity test) of the SNP; thismeans thatmostvariantswill notbe affected
by this correction, but the causal effect of the outlying variants,
which are most likely to be invalid IVs, will be down-weighted.
We displayed the individual SNP estimates of causal effect and
corresponding 95% confidence intervals (CIs) in a forest plot. To
assess whether one of the variants used in the genetic score had
disproportionate effects, we performed ‘‘leave-one-out’’ analyses,
where one SNP at a time is removed from the score. We depicted
the relationship between the SNP effect on CRP and the SNP effect
on the clinical outcomes in a scatterplot and plotted the individ-
ual SNP effect against the inverse of their standard error in a funnel
plot. When unbalanced pleiotropy is absent, the causal-effect esti-
mates of the individual should center around the meta-analysis
estimate in the funnel plot.
We used the proportion of CRP variance explained by the ge-
netic instruments (0.014 for the rs2794520 SNP and 0.065 for
the 52-SNP score) to perform power calculations for each outcome
by using the online tool mRnd.36 We calculated the power to
detect a relative 5%, 10%, 15%, and 20% difference in outcome
risk. For example, a 10% difference refers to an odds ratio (OR)
of at least 0.90 or 1.10 in outcome risk (Table S13).
Results
HapMap GWAS Meta-analysis for Amounts of CRP
The HapMap meta-analysis identified 3,977 genome-wide-
significant variants at p < 5 3 10�8 (quantile-quantile
[Q-Q] plot, Figure S1; Manhattan plot, Figure S2), which
mapped to 48 distinct loci (Table 1; Table S3). Of the
previously reported 18 variants for CRP, 16 remained
associated. Compared with the variants in the previous
GWAS, the rs6901250 variant at the GPRC6A locus
(p ¼ 0.09) and the rs4705952 variants at the IRF1 locus
(p ¼ 2.7 3 10�3) were not significant. The b estimates
for natural-log-transformed CRP for each of the associated
loci ranged from 0.020 to 0.229. We observed the
strongest association for rs2794520 at CRP (b ¼ 0.182 in
the natural-log-transformed CRP [mg/L] per copy incre-
ment in the coded allele; p ¼ 4.17 3 10�523), followed by
rs4420638 at APOC1 and APOE (b ¼ 0.229, p ¼ 1.23 3
10�305). As in previous GWAS meta-analysis, the lead
variant within interleukin-6 receptor (IL6R) was rs4129267
(b ¼ 0.088; p ¼ 1.2 3 10�129). We identified rs1880241
upstream of IL6 (b ¼ 0.028; p ¼ 8.4 3 10�14), related to
the interleukin-6 pathway. In addition to the previously
described interleukin-1 signaling, the IL1RN-IL1F10 locus
(interleukin-1 receptor antagonist and interleukin-1 family
member 10), we found rs9284725 within interleukin-1 re-
ceptor 1 (IL1R1; b ¼ 0.02; p ¼ 7.3 3 10�11; Table 1).
Compared with the overall meta-analysis including both
sexes, the sex-specific meta-analyses did not identify
Journal of Human Genetics 103, 691–706, November 1, 2018 697
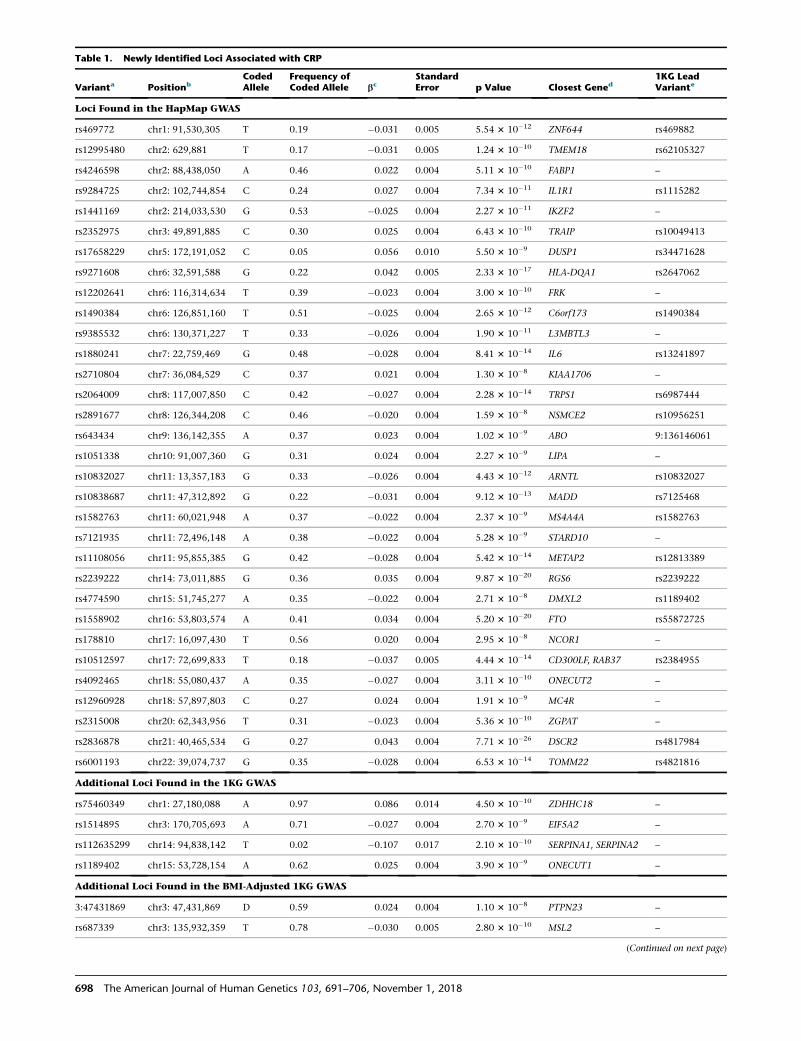
Table 1. Newly Identified Loci Associated with CRP
Varianta PositionbCodedAllele
Frequency ofCoded Allele bc
StandardError p Value Closest Gened
1KG LeadVariante
Loci Found in the HapMap GWAS
rs469772 chr1: 91,530,305 T 0.19 �0.031 0.005 5.54 3 10�12 ZNF644 rs469882
rs12995480 chr2: 629,881 T 0.17 �0.031 0.005 1.24 3 10�10 TMEM18 rs62105327
rs4246598 chr2: 88,438,050 A 0.46 0.022 0.004 5.11 3 10�10 FABP1 –
rs9284725 chr2: 102,744,854 C 0.24 0.027 0.004 7.34 3 10�11 IL1R1 rs1115282
rs1441169 chr2: 214,033,530 G 0.53 �0.025 0.004 2.27 3 10�11 IKZF2 –
rs2352975 chr3: 49,891,885 C 0.30 0.025 0.004 6.43 3 10�10 TRAIP rs10049413
rs17658229 chr5: 172,191,052 C 0.05 0.056 0.010 5.50 3 10�9 DUSP1 rs34471628
rs9271608 chr6: 32,591,588 G 0.22 0.042 0.005 2.33 3 10�17 HLA-DQA1 rs2647062
rs12202641 chr6: 116,314,634 T 0.39 �0.023 0.004 3.00 3 10�10 FRK –
rs1490384 chr6: 126,851,160 T 0.51 �0.025 0.004 2.65 3 10�12 C6orf173 rs1490384
rs9385532 chr6: 130,371,227 T 0.33 �0.026 0.004 1.90 3 10�11 L3MBTL3 –
rs1880241 chr7: 22,759,469 G 0.48 �0.028 0.004 8.41 3 10�14 IL6 rs13241897
rs2710804 chr7: 36,084,529 C 0.37 0.021 0.004 1.30 3 10�8 KIAA1706 –
rs2064009 chr8: 117,007,850 C 0.42 �0.027 0.004 2.28 3 10�14 TRPS1 rs6987444
rs2891677 chr8: 126,344,208 C 0.46 �0.020 0.004 1.59 3 10�8 NSMCE2 rs10956251
rs643434 chr9: 136,142,355 A 0.37 0.023 0.004 1.02 3 10�9 ABO 9:136146061
rs1051338 chr10: 91,007,360 G 0.31 0.024 0.004 2.27 3 10�9 LIPA –
rs10832027 chr11: 13,357,183 G 0.33 �0.026 0.004 4.43 3 10�12 ARNTL rs10832027
rs10838687 chr11: 47,312,892 G 0.22 �0.031 0.004 9.12 3 10�13 MADD rs7125468
rs1582763 chr11: 60,021,948 A 0.37 �0.022 0.004 2.37 3 10�9 MS4A4A rs1582763
rs7121935 chr11: 72,496,148 A 0.38 �0.022 0.004 5.28 3 10�9 STARD10 –
rs11108056 chr11: 95,855,385 G 0.42 �0.028 0.004 5.42 3 10�14 METAP2 rs12813389
rs2239222 chr14: 73,011,885 G 0.36 0.035 0.004 9.87 3 10�20 RGS6 rs2239222
rs4774590 chr15: 51,745,277 A 0.35 �0.022 0.004 2.71 3 10�8 DMXL2 rs1189402
rs1558902 chr16: 53,803,574 A 0.41 0.034 0.004 5.20 3 10�20 FTO rs55872725
rs178810 chr17: 16,097,430 T 0.56 0.020 0.004 2.95 3 10�8 NCOR1 –
rs10512597 chr17: 72,699,833 T 0.18 �0.037 0.005 4.44 3 10�14 CD300LF, RAB37 rs2384955
rs4092465 chr18: 55,080,437 A 0.35 �0.027 0.004 3.11 3 10�10 ONECUT2 –
rs12960928 chr18: 57,897,803 C 0.27 0.024 0.004 1.91 3 10�9 MC4R –
rs2315008 chr20: 62,343,956 T 0.31 �0.023 0.004 5.36 3 10�10 ZGPAT –
rs2836878 chr21: 40,465,534 G 0.27 0.043 0.004 7.71 3 10�26 DSCR2 rs4817984
rs6001193 chr22: 39,074,737 G 0.35 �0.028 0.004 6.53 3 10�14 TOMM22 rs4821816
Additional Loci Found in the 1KG GWAS
rs75460349 chr1: 27,180,088 A 0.97 0.086 0.014 4.50 3 10�10 ZDHHC18 –
rs1514895 chr3: 170,705,693 A 0.71 �0.027 0.004 2.70 3 10�9 EIF5A2 –
rs112635299 chr14: 94,838,142 T 0.02 �0.107 0.017 2.10 3 10�10 SERPINA1, SERPINA2 –
rs1189402 chr15: 53,728,154 A 0.62 0.025 0.004 3.90 3 10�9 ONECUT1 –
Additional Loci Found in the BMI-Adjusted 1KG GWAS
3:47431869 chr3: 47,431,869 D 0.59 0.024 0.004 1.10 3 10�8 PTPN23 –
rs687339 chr3: 135,932,359 T 0.78 �0.030 0.005 2.80 3 10�10 MSL2 –
(Continued on next page)
698 The American Journal of Human Genetics 103, 691–706, November 1, 2018
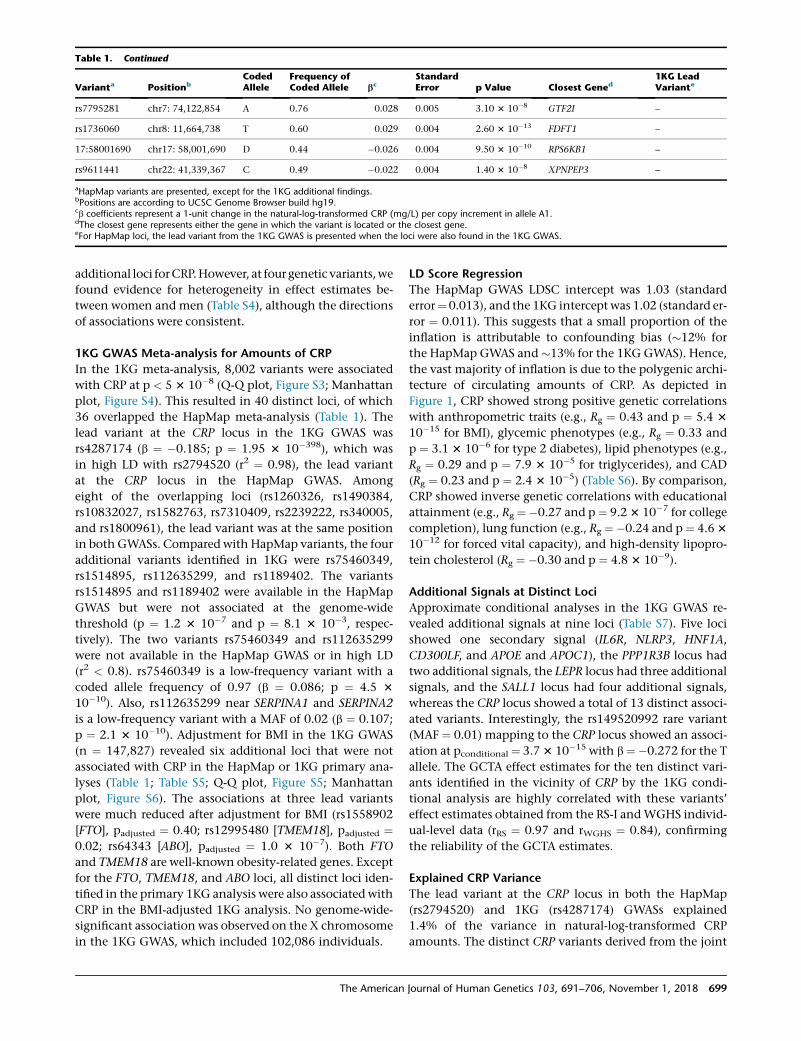
Table 1. Continued
Varianta PositionbCodedAllele
Frequency ofCoded Allele bc
StandardError p Value Closest Gened
1KG LeadVariante
rs7795281 chr7: 74,122,854 A 0.76 0.028 0.005 3.10 3 10�8 GTF2I –
rs1736060 chr8: 11,664,738 T 0.60 0.029 0.004 2.60 3 10�13 FDFT1 –
17:58001690 chr17: 58,001,690 D 0.44 �0.026 0.004 9.50 3 10�10 RPS6KB1 –
rs9611441 chr22: 41,339,367 C 0.49 �0.022 0.004 1.40 3 10�8 XPNPEP3 –
aHapMap variants are presented, except for the 1KG additional findings.bPositions are according to UCSC Genome Browser build hg19.cb coefficients represent a 1-unit change in the natural-log-transformed CRP (mg/L) per copy increment in allele A1.dThe closest gene represents either the gene in which the variant is located or the closest gene.eFor HapMap loci, the lead variant from the 1KG GWAS is presented when the loci were also found in the 1KG GWAS.
additional loci forCRP.However, at four genetic variants,we
found evidence for heterogeneity in effect estimates be-
tween women and men (Table S4), although the directions
of associations were consistent.
1KG GWAS Meta-analysis for Amounts of CRP
In the 1KG meta-analysis, 8,002 variants were associated
with CRP at p < 5 3 10�8 (Q-Q plot, Figure S3; Manhattan
plot, Figure S4). This resulted in 40 distinct loci, of which
36 overlapped the HapMap meta-analysis (Table 1). The
lead variant at the CRP locus in the 1KG GWAS was
rs4287174 (b ¼ �0.185; p ¼ 1.95 3 10�398), which was
in high LD with rs2794520 (r2 ¼ 0.98), the lead variant
at the CRP locus in the HapMap GWAS. Among
eight of the overlapping loci (rs1260326, rs1490384,
rs10832027, rs1582763, rs7310409, rs2239222, rs340005,
and rs1800961), the lead variant was at the same position
in both GWASs. Compared with HapMap variants, the four
additional variants identified in 1KG were rs75460349,
rs1514895, rs112635299, and rs1189402. The variants
rs1514895 and rs1189402 were available in the HapMap
GWAS but were not associated at the genome-wide
threshold (p ¼ 1.2 3 10�7 and p ¼ 8.1 3 10�3, respec-
tively). The two variants rs75460349 and rs112635299
were not available in the HapMap GWAS or in high LD
(r2 < 0.8). rs75460349 is a low-frequency variant with a
coded allele frequency of 0.97 (b ¼ 0.086; p ¼ 4.5 3
10�10). Also, rs112635299 near SERPINA1 and SERPINA2
is a low-frequency variant with a MAF of 0.02 (b ¼ 0.107;
p ¼ 2.1 3 10�10). Adjustment for BMI in the 1KG GWAS
(n ¼ 147,827) revealed six additional loci that were not
associated with CRP in the HapMap or 1KG primary ana-
lyses (Table 1; Table S5; Q-Q plot, Figure S5; Manhattan
plot, Figure S6). The associations at three lead variants
were much reduced after adjustment for BMI (rs1558902
[FTO], padjusted ¼ 0.40; rs12995480 [TMEM18], padjusted ¼0.02; rs64343 [ABO], padjusted ¼ 1.0 3 10�7). Both FTO
and TMEM18 are well-known obesity-related genes. Except
for the FTO, TMEM18, and ABO loci, all distinct loci iden-
tified in the primary 1KG analysis were also associated with
CRP in the BMI-adjusted 1KG analysis. No genome-wide-
significant association was observed on the X chromosome
in the 1KG GWAS, which included 102,086 individuals.
The American
LD Score Regression
The HapMap GWAS LDSC intercept was 1.03 (standard
error¼ 0.013), and the 1KG intercept was 1.02 (standard er-
ror ¼ 0.011). This suggests that a small proportion of the
inflation is attributable to confounding bias (�12% for
the HapMap GWAS and �13% for the 1KG GWAS). Hence,
the vast majority of inflation is due to the polygenic archi-
tecture of circulating amounts of CRP. As depicted in
Figure 1, CRP showed strong positive genetic correlations
with anthropometric traits (e.g., Rg ¼ 0.43 and p ¼ 5.4 3
10�15 for BMI), glycemic phenotypes (e.g., Rg ¼ 0.33 and
p ¼ 3.1 3 10�6 for type 2 diabetes), lipid phenotypes (e.g.,
Rg ¼ 0.29 and p ¼ 7.9 3 10�5 for triglycerides), and CAD
(Rg ¼ 0.23 and p ¼ 2.4 3 10�5) (Table S6). By comparison,
CRP showed inverse genetic correlations with educational
attainment (e.g., Rg ¼�0.27 and p ¼ 9.23 10�7 for college
completion), lung function (e.g., Rg ¼�0.24 and p¼ 4.63
10�12 for forced vital capacity), and high-density lipopro-
tein cholesterol (Rg ¼ �0.30 and p ¼ 4.8 3 10�9).
Additional Signals at Distinct Loci
Approximate conditional analyses in the 1KG GWAS re-
vealed additional signals at nine loci (Table S7). Five loci
showed one secondary signal (IL6R, NLRP3, HNF1A,
CD300LF, and APOE and APOC1), the PPP1R3B locus had
two additional signals, the LEPR locus had three additional
signals, and the SALL1 locus had four additional signals,
whereas the CRP locus showed a total of 13 distinct associ-
ated variants. Interestingly, the rs149520992 rare variant
(MAF ¼ 0.01) mapping to the CRP locus showed an associ-
ation at pconditional ¼ 3.73 10�15 with b ¼�0.272 for the T
allele. The GCTA effect estimates for the ten distinct vari-
ants identified in the vicinity of CRP by the 1KG condi-
tional analysis are highly correlated with these variants’
effect estimates obtained from the RS-I andWGHS individ-
ual-level data (rRS ¼ 0.97 and rWGHS ¼ 0.84), confirming
the reliability of the GCTA estimates.
Explained CRP Variance
The lead variant at the CRP locus in both the HapMap
(rs2794520) and 1KG (rs4287174) GWASs explained
1.4% of the variance in natural-log-transformed CRP
amounts. The distinct CRP variants derived from the joint
Journal of Human Genetics 103, 691–706, November 1, 2018 699

Figure 1. Genome-wide Genetic Correlation between Serum Amounts of CRP and Different Phenotypes and Clinical DiseasesThe genetic correlation and its standard error are estimated by LDSC analysis. Abbreviations are as follows: ADHD, attention deficit andhyperactivity disorder; FEV1, forced expiratory volume in 1 s; FVC, forced vital capacity; HOMA-B, homeostatic model assessment b cellfunction; HOMA-IR, homeostatic model assessment insulin resistance; and HbA1C, hemoglobin A1c.
conditional analysis in the 1KG GWAS explained 4.3% of
the variance. The lead variants at all distinct loci together
explained 6.2% of the CRP variance in the HapMap
GWAS and 6.5% in the 1KG GWAS. When we added the
distinct variants derived from the conditional analysis at
associated loci, the variance explained by all associated
loci was 11.0% in the 1KG GWAS.
Functional Annotation
We applied DEPICT and MAGMA analyses for functional
annotation and biological interpretation of the findings.
The DEPICT analysis included 9,497 genome-wide-signifi-
cant variants covering 283 genes and prioritized 55 candi-
dategenesacross29regions (FDR<0.05;TableS8).Theprior-
itized genes included IL6R, which mapped to the 1q21.3
locus (represented by rs4129267), and APCS, whichmapped
to the 1q32.2 locus. Investigating 10,968 reconstituted gene
sets for enrichment, DEPICT highlighted 583 (5.3%) gene
sets to be significantly enriched among CRP-associated loci
at FDR< 0.05 (Table S9). Using further clustering, we identi-
fied 66 groups of gene sets that substantially correlated and
clustered in twosets, onemainlycomposedof immunepath-
ways and the other enriched with metabolic pathways
(Figure 2). In Figure 3, we present the prioritized genes and
themost significant gene sets.We found synovial fluid, liver
tissue, andmonocytes to be enrichedwith expression of the
prioritized genes (FDR< 0.05).We appliedMAGMAanalysis
to theHapMapGWAS, identifyingfivesignificantlyenriched
gene sets (Bonferroni-corrected p< 0.05; Table S10). Results
included consequences of EGF induction, positive regula-
tion of gene expression, and the interleukin-6 signaling
pathway, in line with the most strongly prioritized gene
from DEPICT gene prioritization. MAGMA analysis priori-
tized liver as a sole enriched tissue (p ¼ 0.048).
700 The American Journal of Human Genetics 103, 691–706, Novem
To prioritize the most likely trait-relevant gene for each
GWAS locus, we interrogated the GWAS data with cis-
eQTL data identified from 44 post-mortem tissues and a
large whole-blood eQTL meta-analysis by using colocaliza-
tion analysis (Table S11). Figure S7 presents the GWAS loci
that colocalize with cis-eQTLs with the corresponding tis-
sue, the colocalizing gene, and the posterior probability
that one shared underlying variant drives both associations.
Out of the 58 lead gSNPs, 25 SNPs (43%) showed evidence
of colocalization with one or more local eQTL effects (pos-
terior probability > 0.9). For example, the rs2293476 locus
colocalized with several cis-eQTL effects for PABC4 and
pseudogenes OXCT2P1, RP11-69E11.4, and RP11-69E11.8.
The rs10925027 locus colocalized with the cis-eQTL effect
for NLRP3 exclusively in the highly powered blood meta-
analysis. Out of 25 loci, nine loci had only one colocalizing
gene. Altogether, gSNP-associated cis-eQTL effects were pre-
sent in up to 14 different tissues, of which whole blood,
esophagus mucosa, skin, and tibial nerve were the most
frequent.
Mendelian Randomization Analyses
We observed a protective effect of genetically determined
variance in CRP with schizophrenia with an IVW OR of
the 52-SNP score of 0.89 (95% CI ¼ 0.81–0.97; p ¼ 6.6 3
10�3; Tables S14 and S15; Figure S8–S11). The MR-Egger
intercept was compatible with no unbalanced pleiotropy
(p ¼ 0.48). The estimate of the rs2794520 variant was
comparable to the 52-SNP score estimate (OR ¼ 0.89;
95% CI ¼ 0.84–0.94; p ¼ 0.046). The WM and PWM esti-
mates were comparable to the IVW estimate (ORWM ¼0.89 and PWM ¼ 5.1 3 10�3; ORPWM ¼ 0.89 and PPWM ¼4.4 3 10�3). The ‘‘leave-one-out’’ analysis provided
evidence that no single variant was driving the IVW
ber 1, 2018
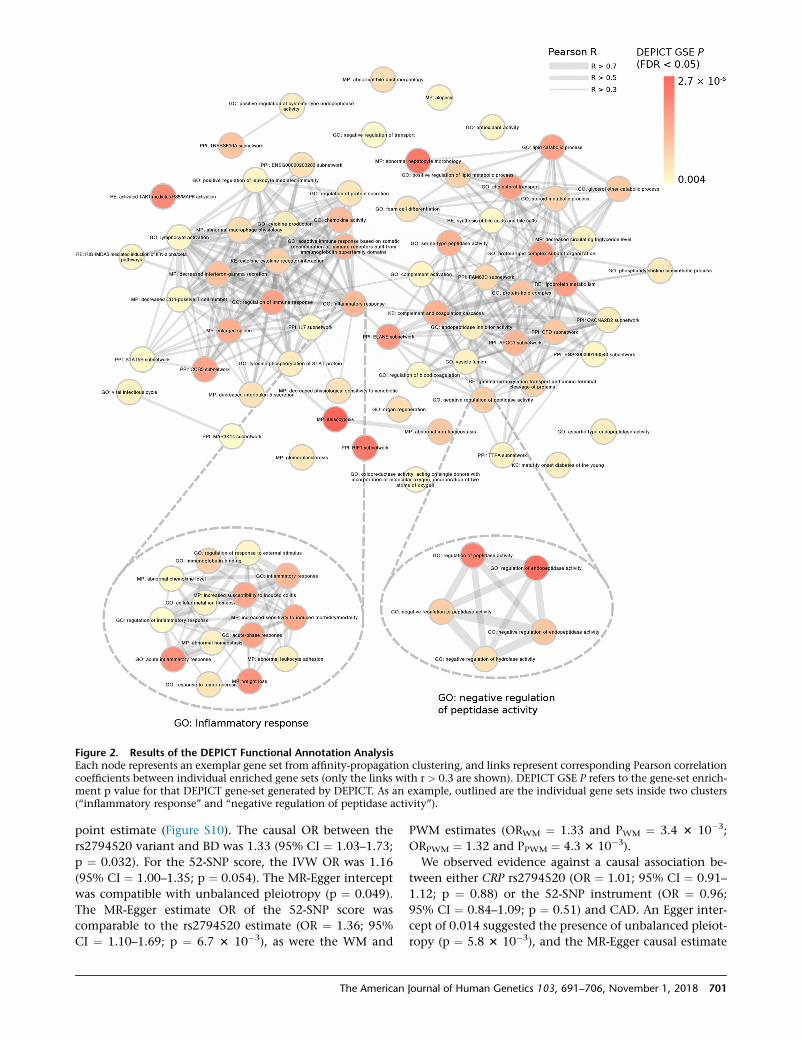
Figure 2. Results of the DEPICT Functional Annotation AnalysisEach node represents an exemplar gene set from affinity-propagation clustering, and links represent corresponding Pearson correlationcoefficients between individual enriched gene sets (only the links with r > 0.3 are shown). DEPICT GSE P refers to the gene-set enrich-ment p value for that DEPICT gene-set generated by DEPICT. As an example, outlined are the individual gene sets inside two clusters(‘‘inflammatory response’’ and ‘‘negative regulation of peptidase activity’’).
point estimate (Figure S10). The causal OR between the
rs2794520 variant and BD was 1.33 (95% CI ¼ 1.03–1.73;
p ¼ 0.032). For the 52-SNP score, the IVW OR was 1.16
(95% CI ¼ 1.00–1.35; p ¼ 0.054). The MR-Egger intercept
was compatible with unbalanced pleiotropy (p ¼ 0.049).
The MR-Egger estimate OR of the 52-SNP score was
comparable to the rs2794520 estimate (OR ¼ 1.36; 95%
CI ¼ 1.10–1.69; p ¼ 6.7 3 10�3), as were the WM and
The American
PWM estimates (ORWM ¼ 1.33 and PWM ¼ 3.4 3 10�3;
ORPWM ¼ 1.32 and PPWM ¼ 4.3 3 10�3).
We observed evidence against a causal association be-
tween either CRP rs2794520 (OR ¼ 1.01; 95% CI ¼ 0.91–
1.12; p ¼ 0.88) or the 52-SNP instrument (OR ¼ 0.96;
95% CI ¼ 0.84–1.09; p ¼ 0.51) and CAD. An Egger inter-
cept of 0.014 suggested the presence of unbalanced pleiot-
ropy (p ¼ 5.8 3 10�3), and the MR-Egger causal estimate
Journal of Human Genetics 103, 691–706, November 1, 2018 701
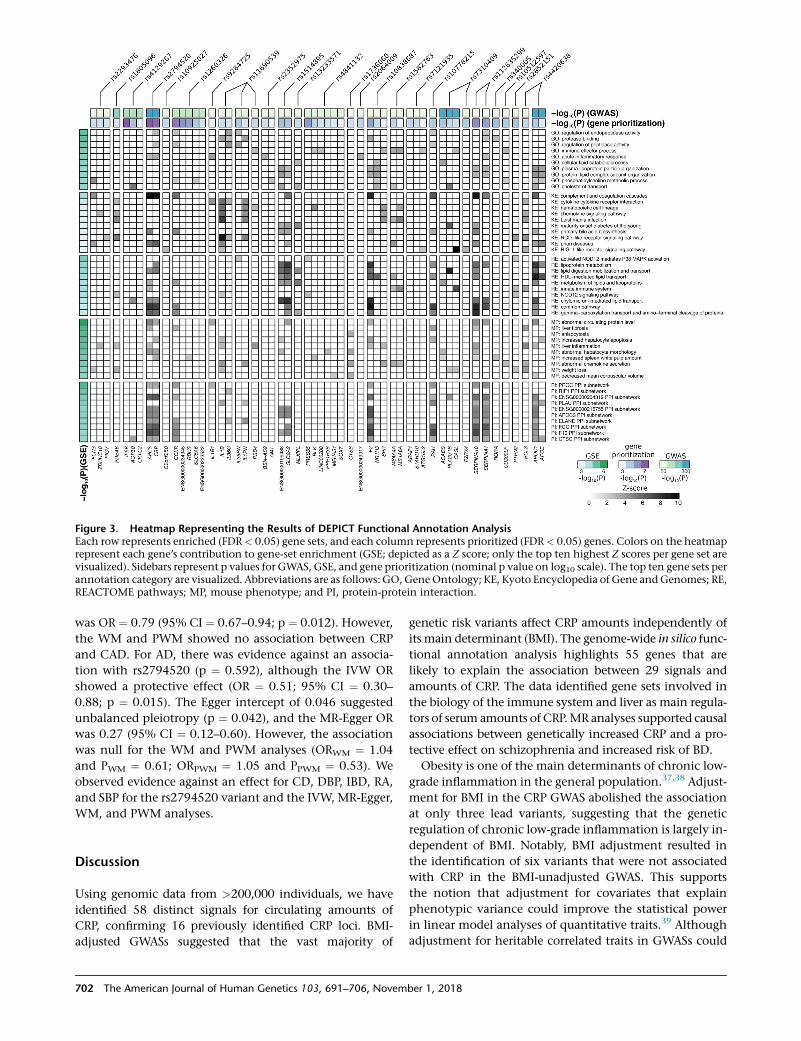
Figure 3. Heatmap Representing the Results of DEPICT Functional Annotation AnalysisEach row represents enriched (FDR< 0.05) gene sets, and each column represents prioritized (FDR< 0.05) genes. Colors on the heatmaprepresent each gene’s contribution to gene-set enrichment (GSE; depicted as a Z score; only the top ten highest Z scores per gene set arevisualized). Sidebars represent p values for GWAS, GSE, and gene prioritization (nominal p value on log10 scale). The top ten gene sets perannotation category are visualized. Abbreviations are as follows: GO, GeneOntology; KE, Kyoto Encyclopedia of Gene andGenomes; RE,REACTOME pathways; MP, mouse phenotype; and PI, protein-protein interaction.
was OR ¼ 0.79 (95% CI ¼ 0.67–0.94; p ¼ 0.012). However,
the WM and PWM showed no association between CRP
and CAD. For AD, there was evidence against an associa-
tion with rs2794520 (p ¼ 0.592), although the IVW OR
showed a protective effect (OR ¼ 0.51; 95% CI ¼ 0.30–
0.88; p ¼ 0.015). The Egger intercept of 0.046 suggested
unbalanced pleiotropy (p ¼ 0.042), and the MR-Egger OR
was 0.27 (95% CI ¼ 0.12–0.60). However, the association
was null for the WM and PWM analyses (ORWM ¼ 1.04
and PWM ¼ 0.61; ORPWM ¼ 1.05 and PPWM ¼ 0.53). We
observed evidence against an effect for CD, DBP, IBD, RA,
and SBP for the rs2794520 variant and the IVW, MR-Egger,
WM, and PWM analyses.
Discussion
Using genomic data from >200,000 individuals, we have
identified 58 distinct signals for circulating amounts of
CRP, confirming 16 previously identified CRP loci. BMI-
adjusted GWASs suggested that the vast majority of
702 The American Journal of Human Genetics 103, 691–706, Novem
genetic risk variants affect CRP amounts independently of
its main determinant (BMI). The genome-wide in silico func-
tional annotation analysis highlights 55 genes that are
likely to explain the association between 29 signals and
amounts of CRP. The data identified gene sets involved in
the biology of the immune system and liver as main regula-
tors of serum amounts of CRP.MR analyses supported causal
associations between genetically increased CRP and a pro-
tective effect on schizophrenia and increased risk of BD.
Obesity is one of the main determinants of chronic low-
grade inflammation in the general population.37,38 Adjust-
ment for BMI in the CRP GWAS abolished the association
at only three lead variants, suggesting that the genetic
regulation of chronic low-grade inflammation is largely in-
dependent of BMI. Notably, BMI adjustment resulted in
the identification of six variants that were not associated
with CRP in the BMI-unadjusted GWAS. This supports
the notion that adjustment for covariates that explain
phenotypic variance could improve the statistical power
in linear model analyses of quantitative traits.39 Although
adjustment for heritable correlated traits in GWASs could
ber 1, 2018
bias effect estimates (collider bias),40 there is consistent ev-
idence in the literature that BMI has a causal direct effect
on CRP amounts,41 and therefore, collider bias in CRP
GWASs adjusted for BMI is less likely.
The sex-stratified analyses revealed significant heteroge-
neity in effect estimates between men and women at only
four lead variants, which represent fewer than 10% of all
CRP loci. Even among these four loci, the effect directions
were similar; thus, the heterogeneity was limited to effect
sizes. The data suggest that the difference between men
andwomen in amounts of CRP is less likely to be explained
by genetic factors. Furthermore, two signals identified in
the former HapMap GWAS of CRP amounts were not sig-
nificant in the current HapMap GWAS. The effect esti-
mates in the current analyses were too small to identify
with our sample size.
The top variant at the CRP locus in both the HapMap
and 1KG GWASs explained 1.4% of the variance in circu-
lating amounts of CRP. The approximate conditional anal-
ysis resulted in 13 variants jointly associated within the
CRP locus in the 1KG GWAS. With respect to locus defini-
tion, we used a more conservative distance criterion than
other GWASs, which often use 5500 kb surrounding the
GWAS peak.42 Here, we used the criterion that the mini-
mum distance between the boundaries of loci is 500 kb.
In order to identify further variants associated with
amounts of CRP, we performed approximate conditional
analyses, which resulted in multiple putative additional
variants also inside and near genes that were not identified
in the primary GWAS. As an example, the CRP locus
spanned >2 Mb according to our criterion. Approximate
conditional analysis revealed that two variants, namely
rs3027012 near DARC and rs56288844 near FCER1A,
both downstream of CRP, were associated with CRP
amounts. Furthermore, upstream of CRP, we identified a
variant near FCGR2A (immunoglobulin G Fc receptor II).
These results show that for a given lead variant, potentially
multiple causal loci—here DARC, FCER1A, and FCGRA2
alongside CRP—contribute to chronic low-grade inflam-
mation and variation in circulating amounts of CRP.
DEPICT analysis provided further evidence that the
genes annotated to the associated CRP variants mainly
cluster in the immune and liver biological systems.
Notably, the gene set ‘‘inflammatory response,’’ which cap-
tures both immune response and liver metabolism, was the
main connector network between the two networks. This
is in line with the observation that CRP is mainly produced
by liver cells in response to inflammatory cytokines during
acute and chronic inflammation.43 Interestingly, the anal-
ysis highlighted iron homeostasis as an enriched gene set.
In agreement, the conditional analysis highlighted a
distinct genetic association at the hemochromatosis gene
HFE, encoding a transmembrane protein of the major his-
tocompatibility complex (MHC) class I family. Previous
studies have shown that iron metabolism plays a pivotal
role in inflammation.44,45 However, genetic pleiotropy
could highlight co-regulated pathway-analysis networks
The American
that do not cause inflammation per se. It is also important
to note that the results of DEPICT analyses apply to recon-
stituted gene sets that might sometimes have slightly
different overlaying biological themes than the original
gene-set annotation.
The MR analyses validate previous evidence that
genetically elevated CRP is protective for the risk of schizo-
phrenia,13,46 although observational data suggest a posi-
tive association between CRP and risk of schizophrenia.47
For BD, we observed a positive causal effect, which is in
line with previous MR and observational studies.13,48
Although the causal underlying mechanisms remain to
be elucidated, a hypothesis for the schizophrenia observa-
tion might be the immune response to infections early in
life. Amounts of acute-phase response proteins in dry
blood spots collected at birth are lower for individuals
with non-affective psychosis, which includes schizo-
phrenia, than for control individuals, suggesting a weaker
immune response at birth.49 Also, neonates who have been
exposed to a maternal infection and have low amounts of
acute-phase response proteins have a higher risk of
schizophrenia.50 Altogether, the evidence suggests that a
deficient immune response could contribute to chronic
infection in children and the development of schizo-
phrenia. For AD and CAD, the Egger intercept showed ev-
idence of unbalanced pleiotropy, and the Egger estimate
showed a protective effect of CRP on the risk of AD and
CAD. However, for both outcomes, the effects of the WM
and PWM analyses, as well as analyses using the single
rs2794520 variant (which is least likely to be affected by
pleiotropy), were null. The MR-Egger estimate relies on
the InSIDE assumption, which states that the strength of
the association between the genetic variants and CRP is in-
dependent of the strength of the direct pleiotropic effects
of the genetic variants on the outcome. This assumption
can be violated when the genetic variants are associated
with a confounder of the CRP-outcome association. Such
a scenario can occur when the genetic variants are associ-
ated with an exposure that is causally upstream of the
exposure under study. In the context of the association
between CRP and either AD or CAD, this could be
lipids or glycemic phenotypes. Several genetic variants
used in the 52-SNP instrument are associated with meta-
bolic phenotypes that might affect amounts of CRP. In
agreement, the WM and PWM, in which the InSIDE
assumption is relaxed, and the single-variant analysis
showed no association. Furthermore, the observation
that CRP is not causally related to CAD in the MR analyses
is comparable to the findings of previous published
studies.51 Power calculation showed that we had 100%
power to detect a 10% difference in CAD risk, so the prob-
ability of a false-negative finding is small. Also, CRP is
associated with future CAD in observational studies, and
randomized trials have shown a beneficial effect of
lowering inflammation with the use of statins52 and cana-
kinumab53 on CAD risk, but this effect is unlikely to be
attributable to CRP.
Journal of Human Genetics 103, 691–706, November 1, 2018 703
The strengths of our study are the use of a very large sam-
ple size for CRP and the use of both HapMap and 1KG
imputed data. Furthermore, we conducted sex-specific
and BMI-adjusted analyses to study the effect of sex and
body mass on the associations between genetic variants
and CRP. To maximize power and to efficiently use the
data, we meta-analyzed all available samples in a discovery
setting without replication. The consistent association of
the variants in >50 studies at a strict Bonferroni-corrected
threshold provide confidence that our findings represent
true associations.We used both HapMap and 1KG imputed
data to identify genetic variants for circulating amounts of
CRP. At the start of the project, more studies had HapMap
imputed data available. Hence, the sample size and thus po-
wer in theHapMapGWASwas higher than that in the 1KG.
Also, HapMap could have identified variants that were not
identified by the 1KG GWAS.54 Nevertheless, 1KG offers
better coverage of uncommon variants and includes indels,
which are not included in the HapMap reference panel.
Including both reference panels, we used all available sam-
ples and maximized the possibility of identifying both
common and uncommon genetic variants for CRP.
However, we note limitations to our study. GWASs
merely identify loci associated with complex phenotypes,
and the identification of causal genes remains challenging.
We included only individuals of European ancestry;
the generalizability of our findings to other races and eth-
nicities is uncertain. In addition, although our analyses
provide support for causal associations, we acknowledge
that we might not have identified the causal variants,
and we might not have eliminated residual confounding.
The colocalization analyses provide evidence for colocali-
zation of CRP GWAS signals and eQTLs; however, they
do not provide evidence that the GWAS signal functions
on CRP through gene expression. We further note that
the method assumes identical LD structure from the
GWAS and eQTL datasets. Given that non-European sam-
ples make up �14% of the full dataset, this assumption
might be violated for some tissues. Last, we meta-analyzed
all available samples in one meta-analysis and did not
replicate our findings in an independent sample. There-
fore, our findings might need replication.
In conclusion, we performed a large GWASmeta-analysis
to identify genetic loci associated with circulating amounts
of CRP, a sensitive marker of chronic low-grade inflamma-
tion, and found support for a causal relationship between
CRP and decreased risk of schizophrenia and increased
risk of BD. Given that inflammation is implicated in the
pathogenesis of multiple complex diseases, our insights
into the biology of inflammation could contribute to
future therapies and interventions.
Accession Numbers
All GWAS data reported in this paper are publicly available. Please
email [email protected] to get more information on how to
gain access and download the data.
704 The American Journal of Human Genetics 103, 691–706, Novem
Supplemental Data
Supplemental Data include 11 figures, 15 tables, and study-specific
descriptives and acknowledgments and can be found with this
article online at https://doi.org/10.1016/j.ajhg.2018.09.009.
Consortia
The members of the LifeLines Cohort Study are Behrooz Z. Aliza-
deh, H. Marike Boezen, Lude Franke, Pim van der Harst, Gerjan
Navis, Marianne Rots, Harold Snieder, Morris Swertz, Bruce H.R.
Wolffenbuttel, and Cisca Wijmenga.
The members of the CHARGE Inflammation Working Group are
Emelia Benjamin, Daniel I. Chasman, Abbas Dehghan, Tarunveer
Singh Ahluwalia, James Meigs, Russell Tracy, Behrooz Z. Alizadeh,
Symen Ligthart, Josh Bis, Gudny Eiriksdottir, Nathan Pankratz,
Myron Gross, Alex Rainer, Harold Snieder, James G. Wilson, Bruce
M. Psaty, Josee Dupuis, Bram Prins, Urmo Vaso, Maria Stathopou-
lou, Lude Franke, Terho Lehtimaki, Wolfgang Koenig, Yalda
Jamshidi, Sophie Siest, Ali Abbasi, Andre G. Uitterlinden, Moham-
madreza Abdollahi, Renate Schnabel, Ursula M. Schick, Ilja M.
Nolte, Aldi Kraja, Yi-Hsiang Hsu, Daniel S. Tylee, Alyson Zwicker,
Rudolf Uher, George Davey-Smith, Alanna C. Morrison, Andrew
Hicks, CorneliaM. van Duijn, CavinWard-Caviness, Eric Boerwin-
kle, J. Rotter, Ken Rice, Leslie Lange, Markus Perola, Eco de Geus,
Andrew P.Morris, Kari Matti Makela, David Stacey, Johan Eriksson,
Tim M. Frayling, and Eline P. Slagboom.
Acknowledgments
Study-specific acknowledgments and funding information are
provided in the Supplemental Data.
Declaration of interests
O.H.F. works at ErasmusAGE, a center for aging research across the
life course funded by Nestle Nutrition (Nestec Ltd.), Metagenics
Inc., and AXA. Nestec Ltd., Metagenics Inc., and AXA had no
role in the design or conduct of the study; collection, manage-
ment, analysis, or interpretation of the data; or preparation, re-
view or approval of the manuscript. Bruce M. Psaty serves on the
data and safety monitoring board of a clinical trial funded by
Zoll LifeCor and on the steering committee of the Yale Open
Data Access Project, funded by Johnson & Johnson.
Received: May 16, 2018
Accepted: September 20, 2018
Published: November 1, 2018
Web Resources
DEPICT, https://data.broadinstitute.org/mpg/depict/
GCTA, http://cnsgenomics.com/software/gcta/
GIANT 1KG p1v3 EUR reference panel, http://csg.sph.umich.edu/
abecasis/mach/download/1000G.2012-03-14.html
GTEx Portal, https://www.gtexportal.org/
GWAMA, https://www.geenivaramu.ee/en/tools/gwama
LD Hub, http://ldsc.broadinstitute.org/ldhub/
METAL, https://genome.sph.umich.edu/wiki/METAL_
Documentation
mRnd power calculations for Mendelian randomization, http://
cnsgenomics.com/shiny/mRnd/
ber 1, 2018

References
1. Libby, P. (2012). Inflammation in atherosclerosis. Arterioscler.
Thromb. Vasc. Biol. 32, 2045–2051.
2. Pickup, J.C. (2004). Inflammation and activated innate immu-
nity in the pathogenesis of type 2 diabetes. Diabetes Care 27,
813–823.
3. Akiyama, H., Barger, S., Barnum, S., Bradt, B., Bauer, J., Cole,
G.M., Cooper, N.R., Eikelenboom, P., Emmerling, M., Fiebich,
B.L., et al. (2000). Inflammation and Alzheimer’s disease. Neu-
robiol. Aging 21, 383–421.
4. Khandaker, G.M., Cousins, L., Deakin, J., Lennox, B.R.,
Yolken, R., and Jones, P.B. (2015). Inflammation and immu-
nity in schizophrenia: Implications for pathophysiology and
treatment. Lancet Psychiatry 2, 258–270.
5. Pepys,M.B. (1995). Theacutephase response andC-reactivepro-
tein. In Oxford Textbook of Medicine, D.A. Warrell, T.M. Cox,
and J.D. Firth, eds. (Oxford University Press), pp. 1527–1533.
6. Danesh, J., Wheeler, J.G., Hirschfield, G.M., Eda, S., Eiriksdot-
tir, G., Rumley, A., Lowe, G.D., Pepys, M.B., and Gudnason, V.
(2004). C-reactive protein and other circulating markers of
inflammation in the prediction of coronary heart disease.
N. Engl. J. Med. 350, 1387–1397.
7. Dehghan, A., Kardys, I., de Maat, M.P., Uitterlinden, A.G., Sij-
brands, E.J., Bootsma, A.H., Stijnen, T., Hofman, A., Schram,
M.T., andWitteman, J.C. (2007). Genetic variation, C-reactive
protein levels, and incidenceof diabetes.Diabetes56, 872–878.
8. Wium-Andersen, M.K., Ørsted, D.D., and Nordestgaard, B.G.
(2014). Elevated C-reactive protein associated with late- and
very-late-onset schizophrenia in the general population:
A prospective study. Schizophr. Bull. 40, 1117–1127.
9. Dehghan, A., Dupuis, J., Barbalic, M., Bis, J.C., Eiriksdottir, G.,
Lu, C., Pellikka, N., Wallaschofski, H., Kettunen, J., Henne-
man, P., et al. (2011). Meta-analysis of genome-wide associa-
tion studies in >80 000 subjects identifies multiple loci for
C-reactive protein levels. Circulation 123, 731–738.
10. de Vries, P.S., Sabater-Lleal, M., Chasman, D.I., Trompet, S.,
Ahluwalia, T.S., Teumer, A., Kleber, M.E., Chen, M.H., Wang,
J.J., Attia, J.R., et al. (2017). Comparison of HapMap and
1000 Genomes reference panels in a large-scale genome-
wide association study. PLoS ONE 12, e0167742.
11. Visscher, P.M., Wray, N.R., Zhang, Q., Sklar, P., McCarthy,
M.I., Brown, M.A., and Yang, J. (2017). 10 years of GWAS
discovery: Biology, function, and translation. Am. J. Hum.
Genet. 101, 5–22.
12. Lawlor, D.A., Harbord, R.M., Sterne, J.A., Timpson, N., and Da-
vey Smith, G. (2008). Mendelian randomization: Using genes
as instruments for making causal inferences in epidemiology.
Stat. Med. 27, 1133–1163.
13. Prins, B.P.,Abbasi,A.,Wong,A.,Vaez,A.,Nolte, I., Franceschini,
N., Stuart, P.E., Guterriez Achury, J., Mistry, V., Bradfield, J.P.,
et al.; PAGE Consortium; International Stroke Genetics Con-
sortium; Systemic Sclerosis consortium; Treat OA consortium;
DIAGRAM Consortium; CARDIoGRAMplusC4D Consortium;
ALS consortium; International Parkinson’s Disease Genomics
Consortium; Autism Spectrum Disorder Working Group of
the Psychiatric Genomics Consortium; CKDGen consortium;
GERAD1 Consortium; International Consortium for Blood
Pressure; Schizophrenia Working Group of the Psychiatric Ge-
nomics Consortium; and Inflammation Working Group of
the CHARGE Consortium (2016). Investigating the causal rela-
tionship of C-reactive protein with 32 complex somatic and
The American
psychiatric outcomes: A large-scale cross-consortium Mende-
lian randomization study. PLoS Med. 13, e1001976.
14. Psaty, B.M., O’Donnell, C.J., Gudnason, V., Lunetta, K.L.,
Folsom, A.R., Rotter, J.I., Uitterlinden, A.G., Harris, T.B.,Witte-
man, J.C.M., Boerwinkle, E.; and CHARGE Consortium
(2009). Cohorts for Heart and Aging Research in Genomic
Epidemiology (CHARGE) Consortium: Design of prospective
meta-analyses of genome-wide association studies from 5 co-
horts. Circ Cardiovasc Genet 2, 73–80.
15. Magi,R., andMorris,A.P. (2010).GWAMA:Software forgenome-
wide association meta-analysis. BMC Bioinformatics 11, 288.
16. Willer, C.J., Li, Y., and Abecasis, G.R. (2010). METAL: Fast and
efficient meta-analysis of genomewide association scans. Bio-
informatics 26, 2190–2191.
17. Randall, J.C., Winkler, T.W., Kutalik, Z., Berndt, S.I., Jackson,
A.U., Monda, K.L., Kilpelainen, T.O., Esko, T., Magi, R., Li, S.,
et al.; DIAGRAM Consortium; and MAGIC Investigators
(2013). Sex-stratified genome-wide association studies includ-
ing 270,000 individuals show sexual dimorphism in genetic
loci for anthropometric traits. PLoS Genet. 9, e1003500.
18. Bulik-Sullivan, B.K., Loh, P.-R., Finucane, H.K., Ripke, S., Yang,
J., Patterson, N., Daly, M.J., Price, A.L., Neale, B.M.; and
Schizophrenia Working Group of the Psychiatric Genomics
Consortium (2015). LD Score regression distinguishes con-
founding from polygenicity in genome-wide association
studies. Nat. Genet. 47, 291–295.
19. Zheng, J., Erzurumluoglu, A.M., Elsworth, B.L., Kemp, J.P.,
Howe, L., Haycock, P.C., Hemani, G., Tansey, K., Laurin, C.,
Pourcain, B.S., et al.; Early Genetics and Lifecourse Epidemi-
ology (EAGLE) Eczema Consortium (2017). LDHub: A central-
ized database and web interface to perform LD score regres-
sion that maximizes the potential of summary level GWAS
data for SNP heritability and genetic correlation analysis. Bio-
informatics 33, 272–279.
20. Bulik-Sullivan, B., Finucane, H.K., Anttila, V., Gusev, A., Day,
F.R., Loh, P.R., Duncan, L., Perry, J.R., Patterson, N., Robinson,
E.B., et al.; ReproGen Consortium; Psychiatric Genomics Con-
sortium; and Genetic Consortium for Anorexia Nervosa of the
Wellcome Trust Case Control Consortium3 (2015). An atlas of
genetic correlations across human diseases and traits. Nat.
Genet. 47, 1236–1241.
21. Yang, J., Lee, S.H., Goddard, M.E., and Visscher, P.M. (2011).
GCTA: A tool for genome-wide complex trait analysis. Am. J.
Hum. Genet. 88, 76–82.
22. Yang, J., Ferreira, T., Morris, A.P., Medland, S.E., Madden, P.A.,
Heath, A.C.,Martin, N.G., Montgomery, G.W.,Weedon,M.N.,
Loos, R.J., et al.; Genetic Investigation of ANthropometric
Traits (GIANT) Consortium; and DIAbetes Genetics Replica-
tion AndMeta-analysis (DIAGRAM) Consortium (2012). Con-
ditional and joint multiple-SNP analysis of GWAS summary
statistics identifies additional variants influencing complex
traits. Nat. Genet. 44, 369–375, S1–S3.
23. Park, J.-H., Wacholder, S., Gail, M.H., Peters, U., Jacobs, K.B.,
Chanock, S.J., and Chatterjee, N. (2010). Estimation of effect
size distribution from genome-wide association studies and
implications for future discoveries. Nat. Genet. 42, 570–575.
24. Pers, T.H., Karjalainen, J.M., Chan, Y., Westra, H.J., Wood,
A.R., Yang, J., Lui, J.C., Vedantam, S., Gustafsson, S., Esko,
T., et al.; Genetic Investigation of ANthropometric Traits
(GIANT) Consortium (2015). Biological interpretation of
genome-wide association studies using predicted gene func-
tions. Nat. Commun. 6, 5890.
Journal of Human Genetics 103, 691–706, November 1, 2018 705
25. Abecasis, G.R., Auton, A., Brooks, L.D., DePristo, M.A., Dur-
bin, R.M., Handsaker, R.E., Kang, H.M., Marth, G.T., McVean,
G.A.; and 1000 Genomes Project Consortium (2012). An inte-
grated map of genetic variation from 1,092 human genomes.
Nature 491, 56–65.
26. Bodenhofer, U., Kothmeier, A., and Hochreiter, S. (2011).
APCluster: An R package for affinity propagation clustering.
Bioinformatics 27, 2463–2464.
27. Kolde, R. (2012). Pheatmap: pretty heatmaps. R package
version 61.
28. de Leeuw, C.A., Mooij, J.M., Heskes, T., and Posthuma, D.
(2015). MAGMA: Generalized gene-set analysis of GWAS
data. PLoS Comput. Biol. 11, e1004219.
29. Watanabe, K., Taskesen, E., van Bochoven, A., and Posthuma,
D. (2017). Functional mapping and annotation of genetic as-
sociations with FUMA. Nat. Commun. 8, 1826.
30. Giambartolomei, C., Vukcevic, D., Schadt, E.E., Franke, L.,
Hingorani, A.D., Wallace, C., and Plagnol, V. (2014).
Bayesian test for colocalisation between pairs of genetic as-
sociation studies using summary statistics. PLoS Genet. 10,
e1004383.
31. Westra, H.J., Peters, M.J., Esko, T., Yaghootkar, H., Schurmann,
C., Kettunen, J., Christiansen, M.W., Fairfax, B.P., Schramm,
K., Powell, J.E., et al. (2013). Systematic identification of trans
eQTLs as putative drivers of known disease associations. Nat.
Genet. 45, 1238–1243.
32. GTEx Consortium (2015). Human genomics. The Genotype-
Tissue Expression (GTEx) pilot analysis: Multitissue gene regu-
lation in humans. Science 348, 648–660.
33. Hemani, G., Zheng, J., Elsworth, B.,Wade, K.H., Haberland, V.,
Baird, D., Laurin, C., Burgess, S., Bowden, J., Langdon, R., et al.
(2018). The MR-Base platform supports systematic causal
inference across the human phenome. eLife 7, e34408.
34. Bowden, J., Davey Smith, G., and Burgess, S. (2015). Mende-
lian randomization with invalid instruments: effect estima-
tion and bias detection through Egger regression. Int. J. Epide-
miol. 44, 512–525.
35. Bowden, J., Davey Smith, G., Haycock, P.C., and Burgess, S.
(2016). Consistent estimation in Mendelian randomization
with some invalid instruments using a weighted median esti-
mator. Genet. Epidemiol. 40, 304–314.
36. Brion, M.-J.A., Shakhbazov, K., and Visscher, P.M. (2013).
Calculating statistical power in Mendelian randomization
studies. Int. J. Epidemiol. 42, 1497–1501.
37. Visser, M., Bouter, L.M., McQuillan, G.M., Wener, M.H., and
Harris, T.B. (1999). Elevated C-reactive protein levels in over-
weight and obese adults. JAMA 282, 2131–2135.
38. Wellen, K.E., and Hotamisligil, G.S. (2003). Obesity-induced
inflammatory changes in adipose tissue. J. Clin. Invest. 112,
1785–1788.
39. Robinson, L.D., and Jewell, N.P. (1991). Some surprising re-
sults about covariate adjustment in logistic regressionmodels.
Int. Stat. Rev. 59, 227–240.
40. Aschard, H., Vilhjalmsson, B.J., Joshi, A.D., Price, A.L., and
Kraft, P. (2015). Adjusting for heritable covariates can bias ef-
fect estimates in genome-wide association studies. Am. J.
Hum. Genet. 96, 329–339.
41. Timpson, N.J., Nordestgaard, B.G., Harbord, R.M., Zacho, J.,
Frayling, T.M., Tybjærg-Hansen, A., and Smith, G.D. (2011).
C-reactive protein levels and body mass index: Elucidating di-
rection of causation through reciprocal Mendelian randomi-
zation. Int. J. Obes. 35, 300–308.
706 The American Journal of Human Genetics 103, 691–706, Novem
42. Locke, A.E., Kahali, B., Berndt, S.I., Justice, A.E., Pers, T.H., Day,
F.R., Powell, C., Vedantam, S., Buchkovich, M.L., Yang, J.,
et al.; LifeLines Cohort Study; ADIPOGen Consortium; AGEN-
BMI Working Group; CARDIOGRAMplusC4D Consortium;
CKDGen Consortium; GLGC; ICBP; MAGIC Investigators;
MuTHER Consortium; MIGen Consortium; PAGE Consortium;
ReproGen Consortium; GENIE Consortium; and International
Endogene Consortium (2015). Genetic studies of bodymass in-
dex yield new insights for obesity biology. Nature 518, 197–206.
43. Moshage, H.J., Roelofs, H.M.J., van Pelt, J.F., Hazenberg,
B.P.C., van Leeuwen, M.A., Limburg, P.C., Aarden, L.A., and
Yap, S.H. (1988). The effect of interleukin-1, interleukin-6
and its interrelationship on the synthesis of serum amyloid
A and C-reactive protein in primary cultures of adult human
hepatocytes. Biochem. Biophys. Res. Commun. 155, 112–117.
44. Ganz, T., and Nemeth, E. (2015). Iron homeostasis in host
defence and inflammation. Nat. Rev. Immunol. 15, 500–510.
45. Alizadeh,B.Z.,Njajou,O.T.,Hazes, J.M.,Hofman,A., Slagboom,
P.E., Pols, H.A., and van Duijn, C.M. (2007). The H63D variant
in the HFE gene predisposes to arthralgia, chondrocalcinosis
and osteoarthritis. Ann. Rheum. Dis. 66, 1436–1442.
46. Hartwig, F.P., Borges, M.C., Horta, B.L., Bowden, J., and Davey
Smith, G. (2017). Inflammatory Biomarkers and Risk of
Schizophrenia: A 2-Sample Mendelian Randomization Study.
JAMA Psychiatry 74, 1226–1233.
47. Fernandes, B.S., Steiner, J., Bernstein, H.-G., Dodd, S., Pasco,
J.A., Dean, O.M., Nardin, P., Goncalves, C.-A., and Berk, M.
(2016). C-reactive protein is increased in schizophrenia but
is not altered by antipsychotics: Meta-analysis and implica-
tions. Mol. Psychiatry 21, 554–564.
48. Fernandes, B.S., Steiner, J.,Molendijk,M.L., Dodd, S., Nardin, P.,
Goncalves, C.-A., Jacka, F., Kohler, C.A., Karmakar, C., Carvalho,
A.F., and Berk, M. (2016). C-reactive protein concentrations
across the mood spectrum in bipolar disorder: A systematic re-
view andmeta-analysis. Lancet Psychiatry 3, 1147–1156.
49. Gardner, R.M., Dalman, C., Wicks, S., Lee, B.K., and Karlsson,
H. (2013). Neonatal levels of acute phase proteins and later
risk of non-affective psychosis. Transl. Psychiatry 3, e228.
50. Blomstrom, A., Gardner, R.M., Dalman, C., Yolken, R.H., and
Karlsson, H. (2015). Influence of maternal infections on
neonatal acutephaseproteins and their interaction in thedevel-
opment of non-affective psychosis. Transl. Psychiatry 5, e502.
51. Elliott, P., Chambers, J.C., Zhang,W.,Clarke, R.,Hopewell, J.C.,
Peden, J.F., Erdmann, J., Braund, P., Engert, J.C., Bennett, D.,
et al. (2009). Genetic Loci associated with C-reactive protein
levels and risk of coronary heart disease. JAMA 302, 37–48.
52. Ridker, P.M., Danielson, E., Fonseca, F.A., Genest, J., Gotto,
A.M., Jr., Kastelein, J.J., Koenig, W., Libby, P., Lorenzatti, A.J.,
MacFadyen, J.G., et al.; JUPITER Study Group (2008). Rosuvas-
tatin to prevent vascular events in men and women with
elevated C-reactive protein. N. Engl. J. Med. 359, 2195–2207.
53. Ridker, P.M., Everett, B.M., Thuren, T., MacFadyen, J.G.,
Chang, W.H., Ballantyne, C., Fonseca, F., Nicolau, J., Koenig,
W., Anker, S.D., et al.; CANTOS Trial Group (2017). Antiin-
flammatory therapy with canakinumab for atherosclerotic
disease. N. Engl. J. Med. 377, 1119–1131.
54. Wood, A.R., Perry, J.R., Tanaka, T., Hernandez, D.G., Zheng, H.-
F., Melzer, D., Gibbs, J.R., Nalls, M.A., Weedon, M.N., Spector,
T.D., et al. (2013). Imputation of variants from the 1000 Ge-
nomes Project modestly improves known associations and
can identify low-frequencyvariant-phenotype associations un-
detected by HapMap based imputation. PLoS ONE 8, e64343.
ber 1, 2018