big data and outlier loci: a cautionary tale with genome-scale phylogenetic data
TRANSCRIPT

Big data and outlier loci: A cautionary tale with genome-scale phylogenetic dataLyndon M. Coghill1, Vinson Doyle1, Van Wishingrad2, Robert C. Thomson2 & Jeremy M. Brown1
1.0 1.0?
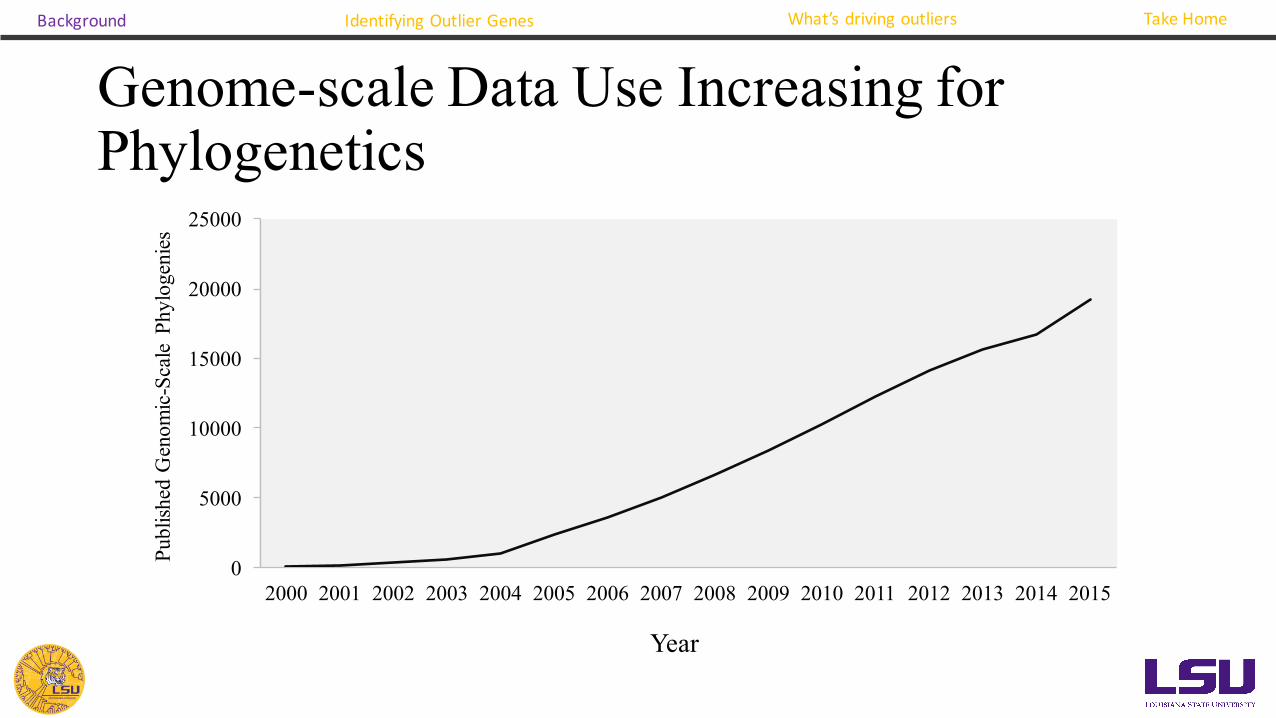
Genome-scale Data Use Increasing for Phylogenetics
0
5000
10000
15000
20000
25000
2000 2001 2002 2003 2004 2005 2006 2007 2008 2009 2010 2011 2012 2013 2014 2015
Publ
ished
Gen
omic
-Sca
lePh
ylog
enie
s
Year
Background Identifying Outlier Genes What’s driving outliers Take Home
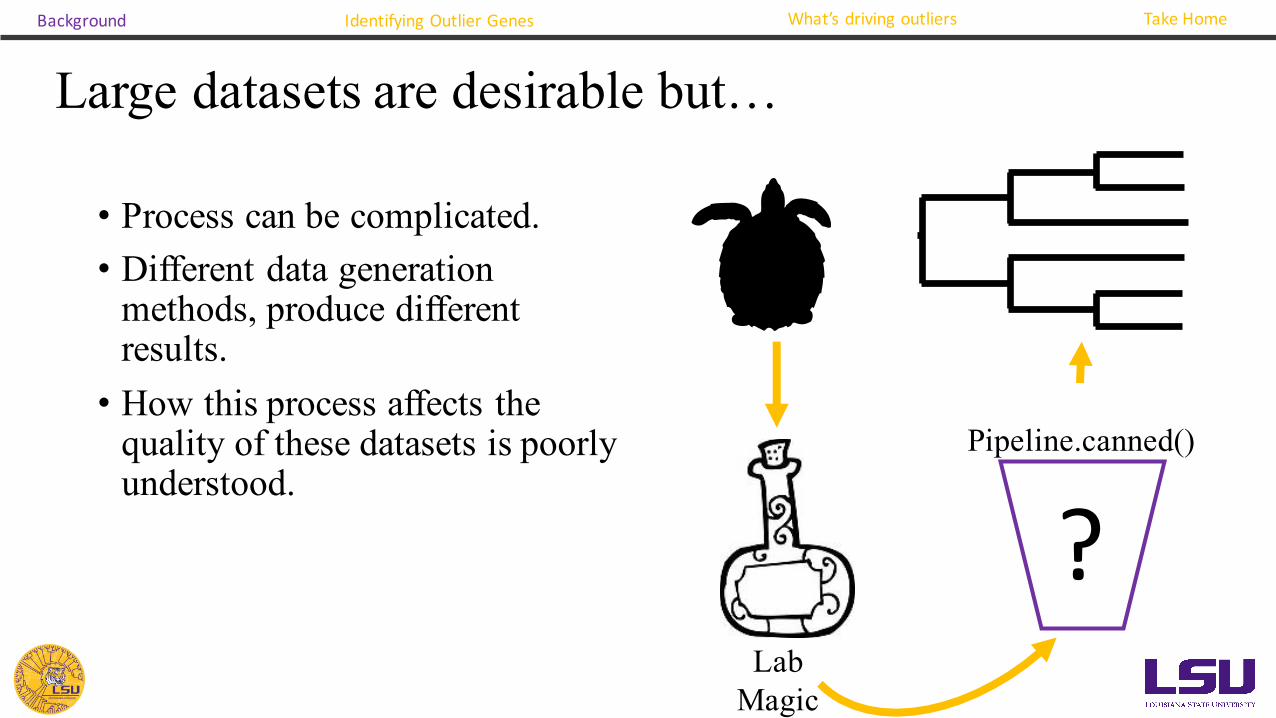
Large datasets are desirable but…
• Process can be complicated.• Different data generation
methods, produce different results.• How this process affects the
quality of these datasets is poorly understood.
Background Identifying Outlier Genes What’s driving outliers Take Home
?Lab
Magic
Pipeline.canned()
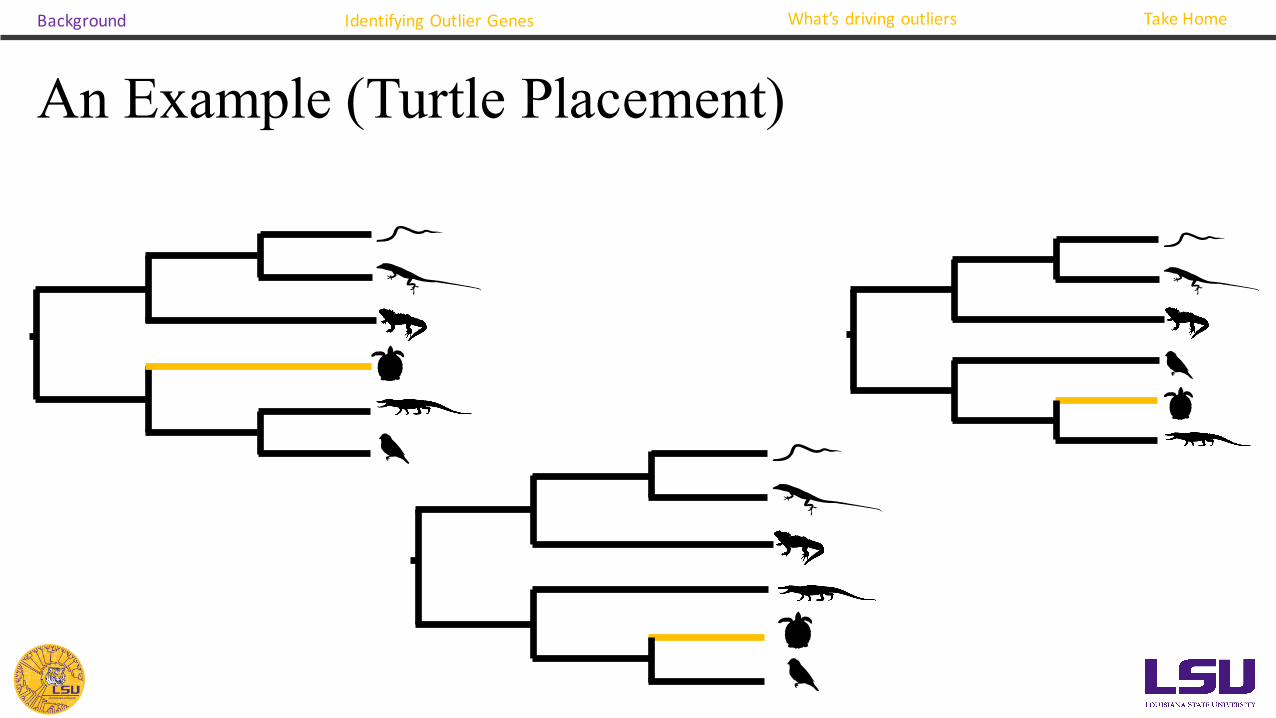
An Example (Turtle Placement)Background Identifying Outlier Genes What’s driving outliers Take Home
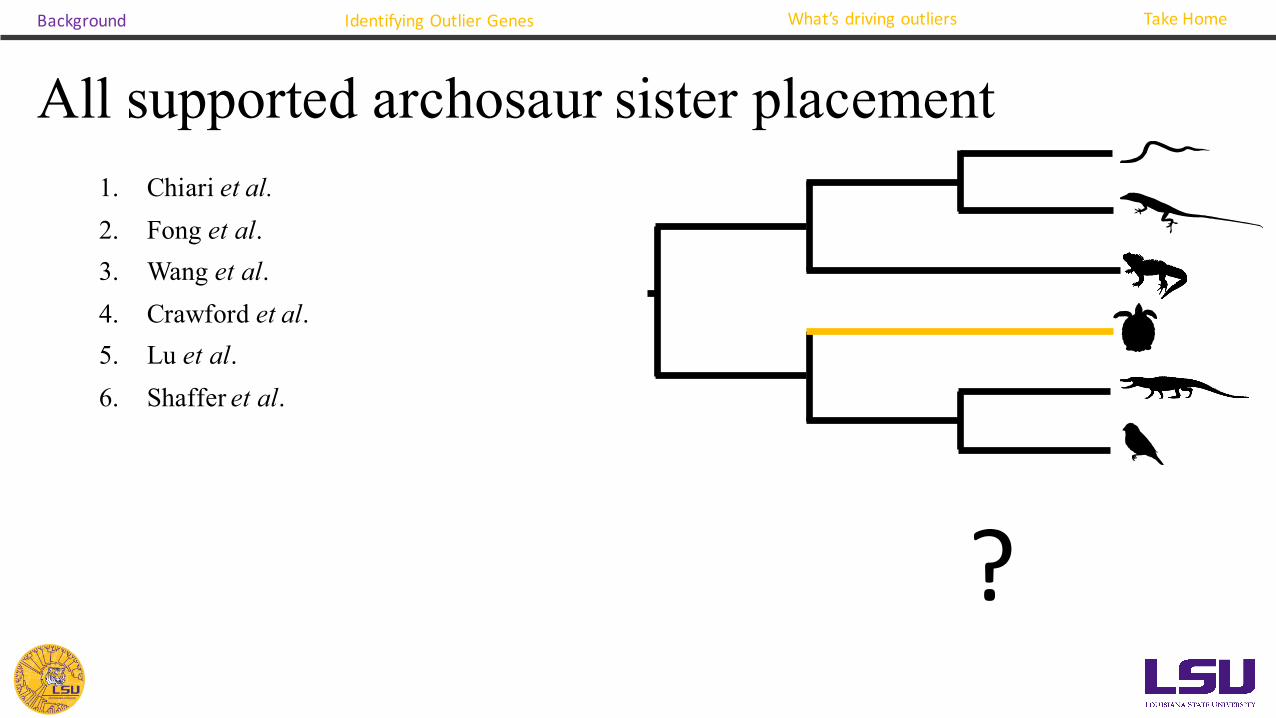
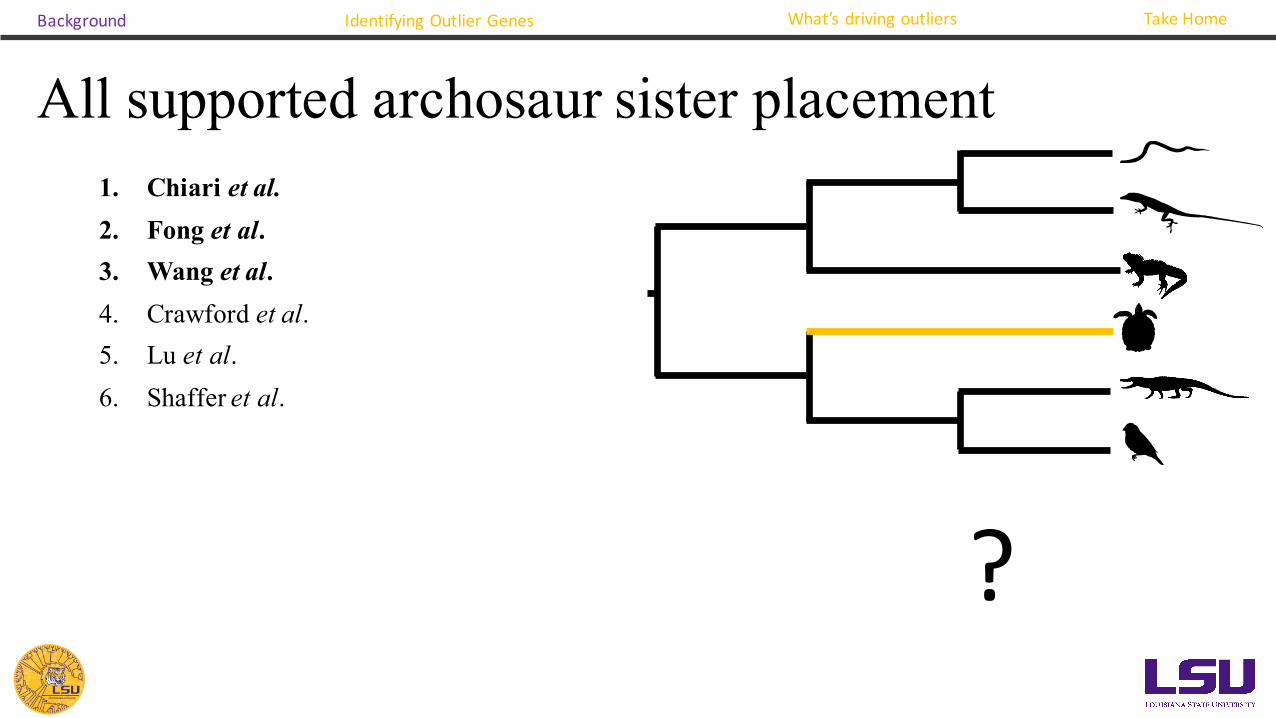
1. Chiari et al.2. Fong et al.3. Wang et al.4. Crawford et al. 5. Lu et al.6. Shaffer et al.
All supported archosaur sister placementBackground Identifying Outlier Genes What’s driving outliers Take Home
?
1. Chiari et al.2. Fong et al.3. Wang et al.4. Crawford et al. 5. Lu et al.6. Shaffer et al.
All supported archosaur sister placementBackground Identifying Outlier Genes What’s driving outliers Take Home
?

Bayes Factors as branch specific support
• Alternative measure of support for topological relationships.• Ratio of marginal
likelihoods between two hypotheses.
𝑩𝒂𝒚𝒆𝒔 𝑭𝒂𝒄𝒕𝒐𝒓 = 𝑷 𝑫𝒂𝒕𝒂 𝑯𝒚𝒑𝒐𝒕𝒉𝒆𝒔𝒊𝒔𝟏)𝑷 𝑫𝒂𝒕𝒂 𝑯𝒚𝒑𝒐𝒕𝒉𝒆𝒔𝒊𝒔𝟐)
Background Identifying Outlier Genes What’s driving outliers Take Home
H1: Bi-‐partition is present H2: Bi-‐partition is absent:

• Calculated 2 marginal likelihoods to
examine turtle placement.
• 1: Constrained turtle placement to a
single position in the tree.
• 2. Considered all other hypothesized
positions for turtles.
Bayes Factors (Turtle Placement)
Archosaur S
ister Placement
All O
ther Placements
Background Identifying Outlier Genes What’s driving outliers Take Home
Background Identifying Outlier Genes What’s driving outliers Take Home
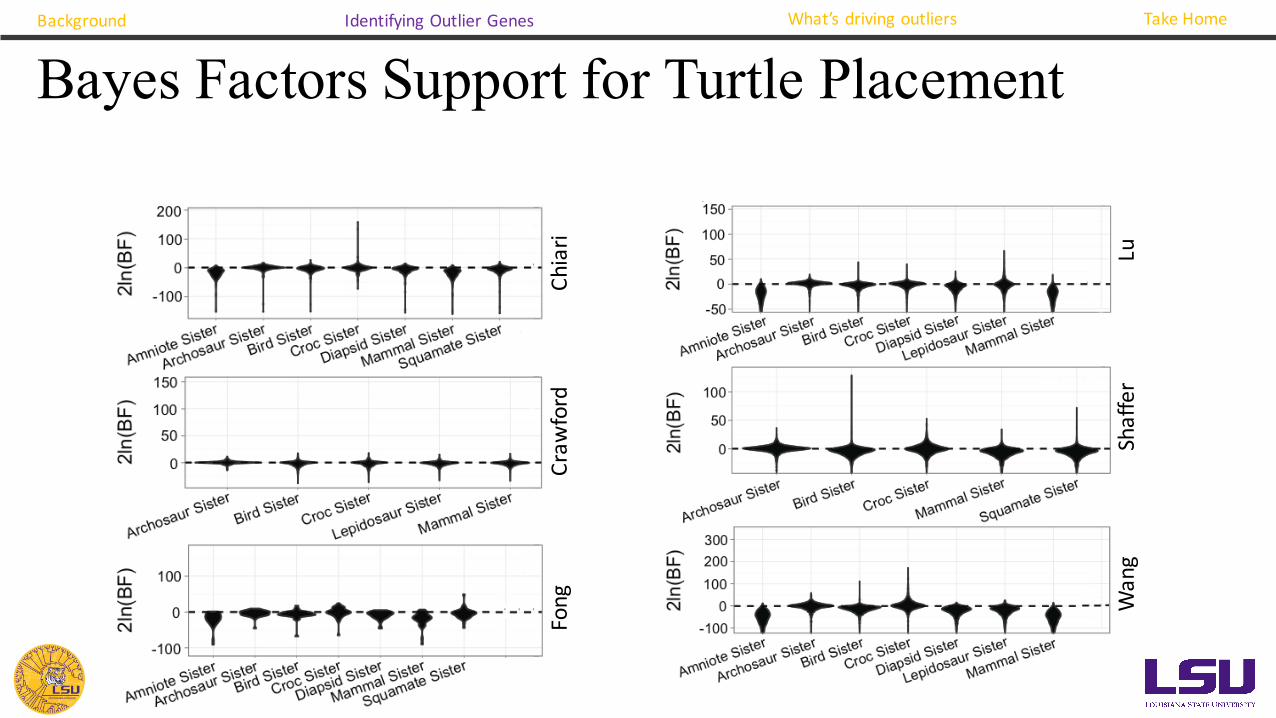
Bayes Factors Support for Turtle Placement
Chiari
Craw
ford
Fong
Shaffer
LuWang
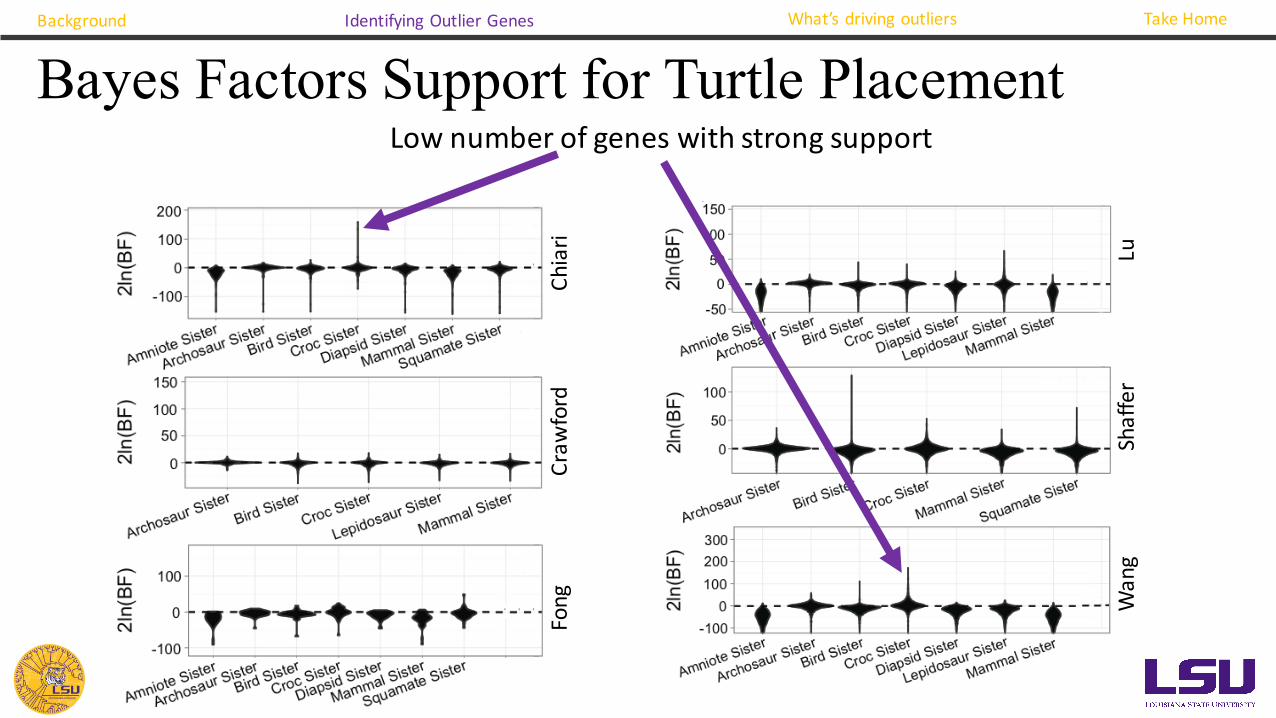
Bayes Factors Support for Turtle PlacementBackground Identifying Outlier Genes What’s driving outliers Take Home
Low number of genes with strong support
Chiari
Craw
ford
Fong
Shaffer
LuWang

Background Identifying Outlier Genes What’s driving outliers Take Home
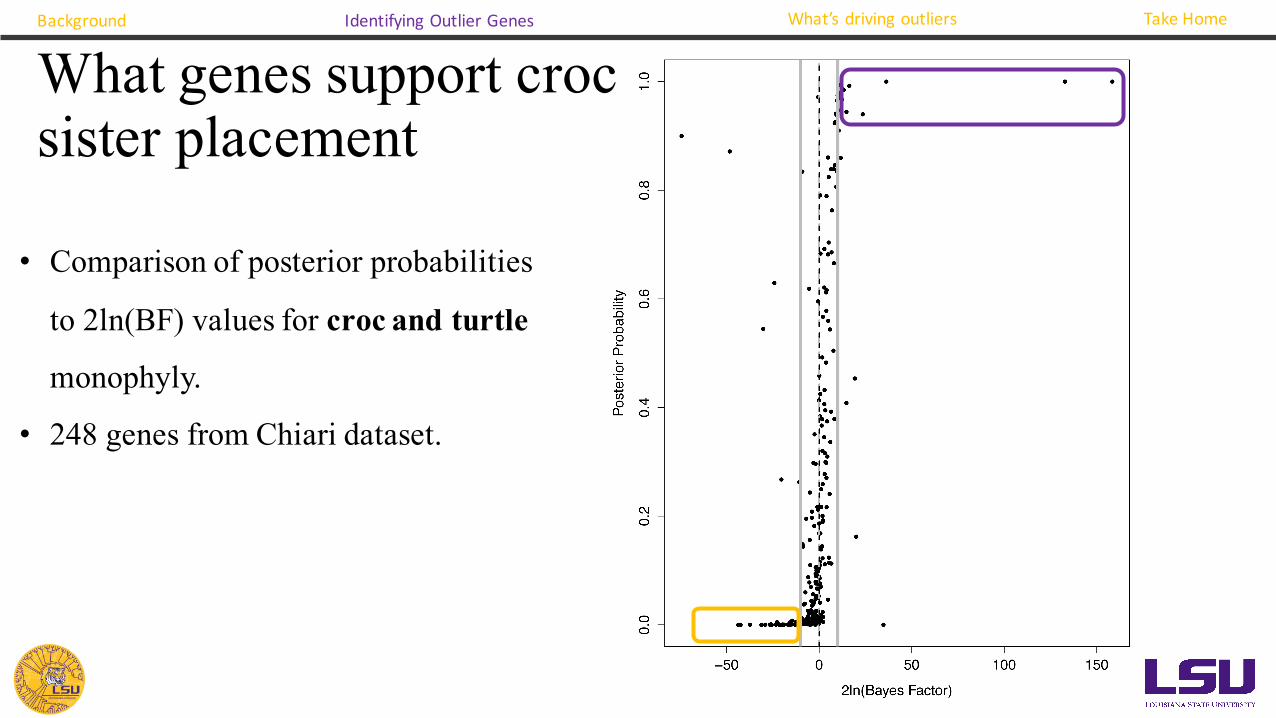
What genes support croc sister placement
• Comparison of posterior probabilities
to 2ln(BF) values for croc and turtle
monophyly.
• 248 genes from Chiari dataset.

• Comparison of posterior probabilities
to 2ln(BF) values for croc and turtle
monophyly.
• 248 genes from Chiari dataset.
Background Identifying Outlier Genes What’s driving outliers Take Home
What genes support croc sister placement
Background Identifying Outlier Genes What’s driving outliers Take Home
What genes support croc sister placement
• Comparison of posterior probabilities
to 2ln(BF) values for croc and turtle
monophyly.
• 248 genes from Chiari dataset.
Background Identifying Outlier Genes What’s driving outliers Take Home
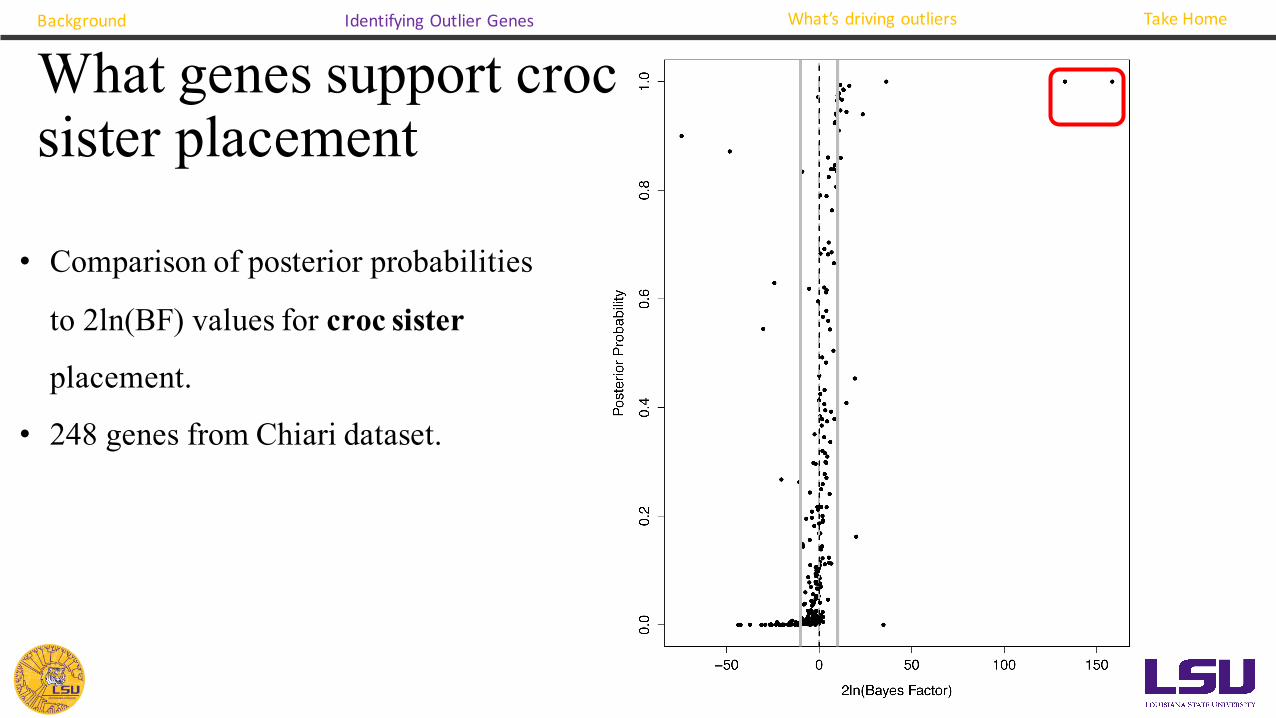
What genes support croc sister placement
• Comparison of posterior probabilities
to 2ln(BF) values for croc sister
placement.
• 248 genes from Chiari dataset.
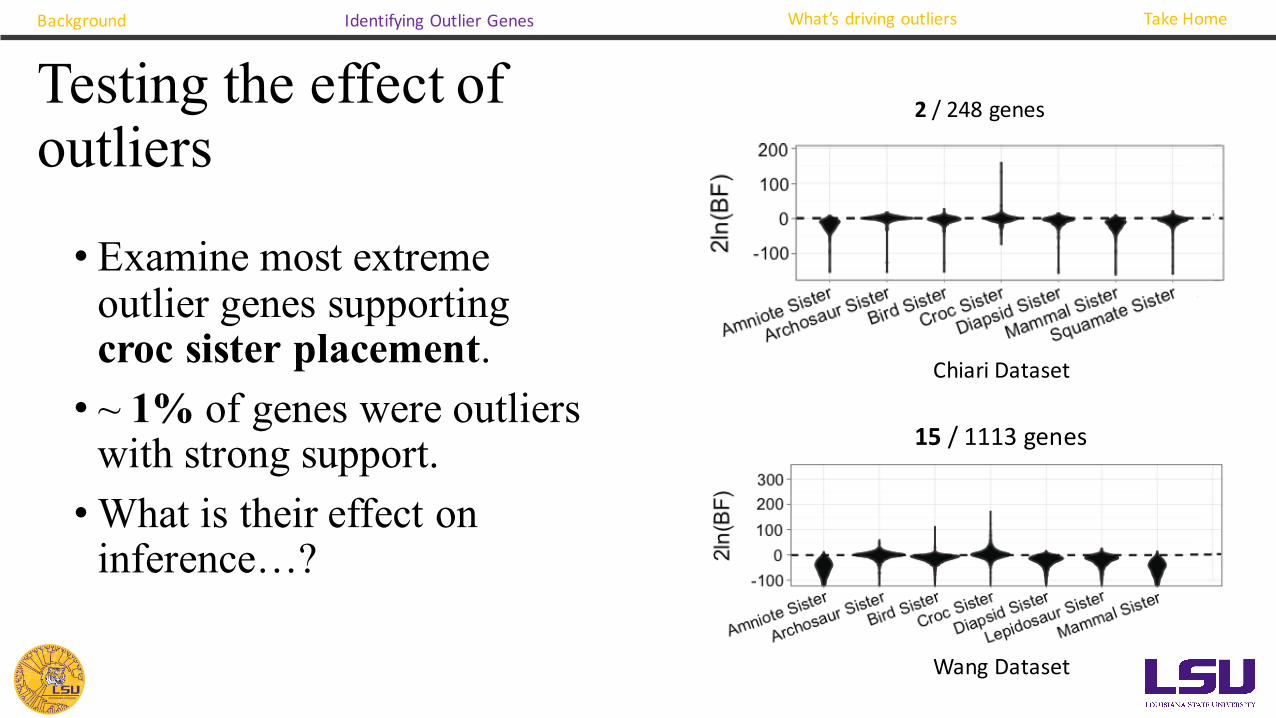
• Examine most extreme outlier genes supporting croc sister placement.• ~ 1% of genes were outliers
with strong support.•What is their effect on
inference…?
15 / 1113 genes
2 / 248 genes
Background Identifying Outlier Genes What’s driving outliers Take Home
Testing the effect of outliers
Wang Dataset
Chiari Dataset
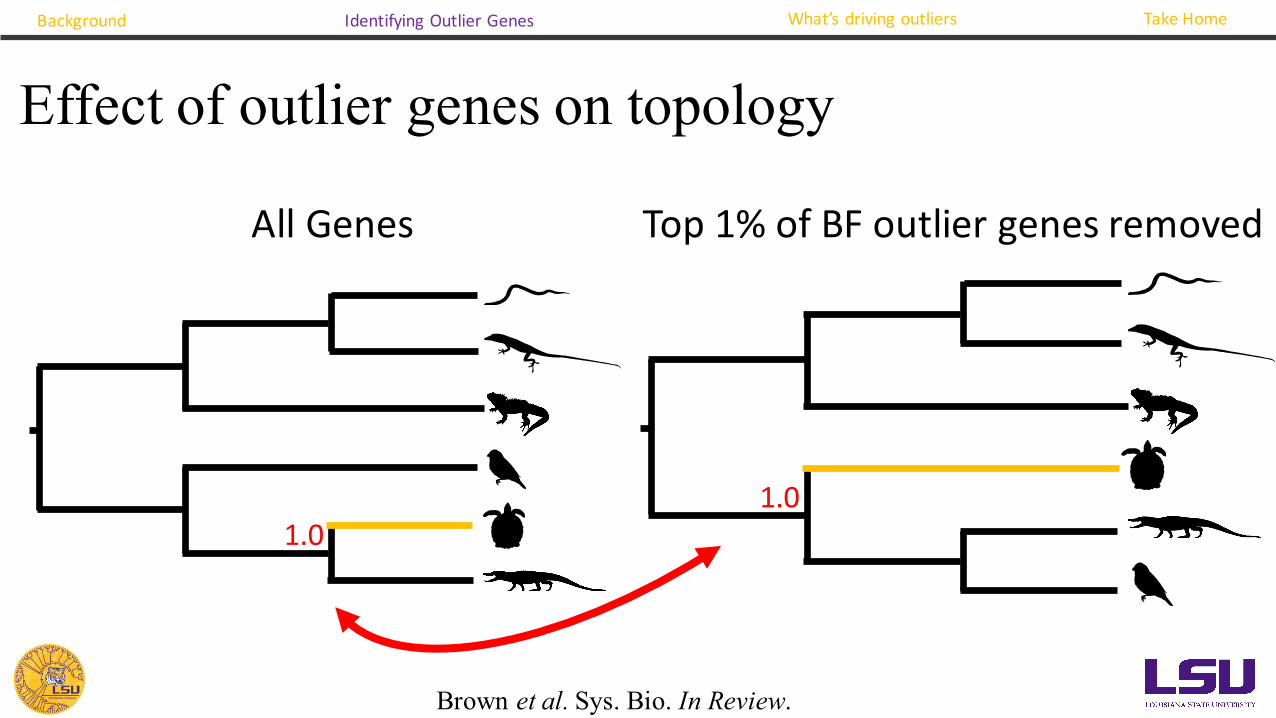
All Genes Top 1% of BF outlier genes removed
Background Identifying Outlier Genes What’s driving outliers Take Home
1.01.0
Effect of outlier genes on topology
Brown et al. Sys. Bio. In Review.
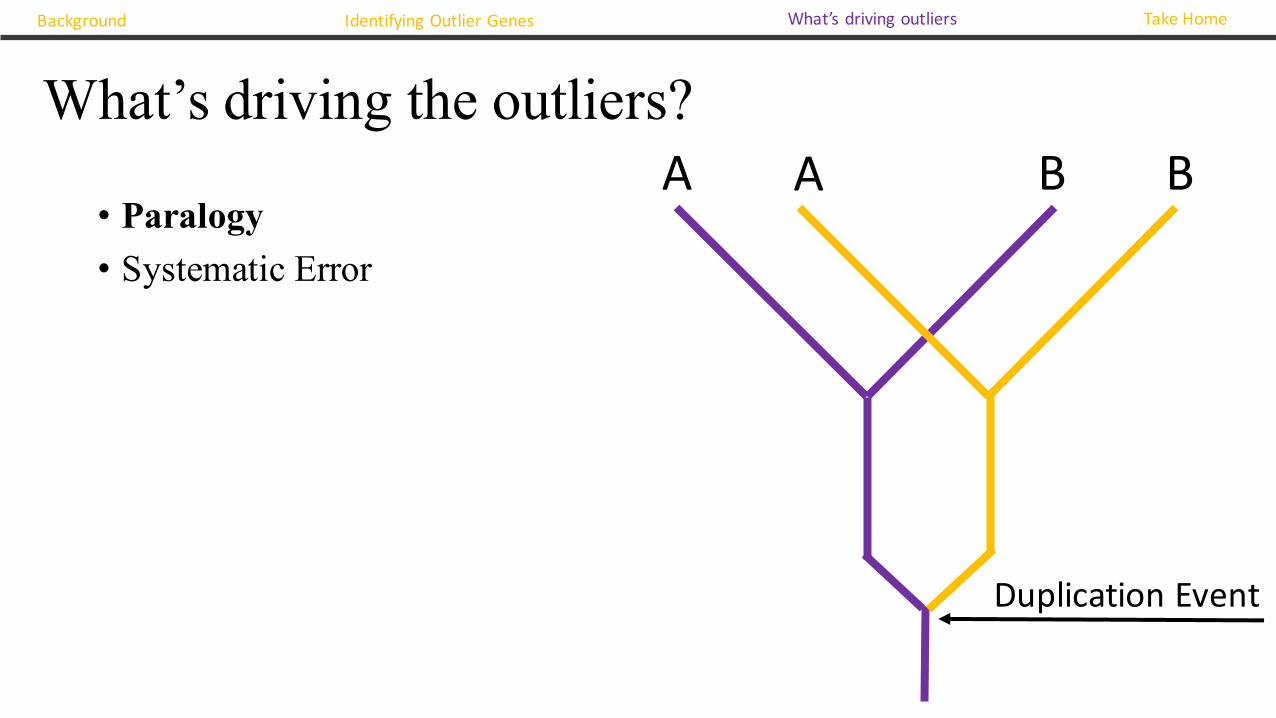
• Paralogy• Systematic Error
What’s driving the outliers? A A B B
Duplication Event
Background Identifying Outlier Genes What’s driving outliers Take Home

Evidence of Paralogy• BLAST genes against closest
genome.• Pull hits > 70% (~ 2 – 3)• Hits non-contiguous.• Concatenate hits.• Infer new tree..
+
Original Sequence
Hit 1 Hit 2 Hit 3
Hit Contig
Background Identifying Outlier Genes What’s driving outliers Take Home
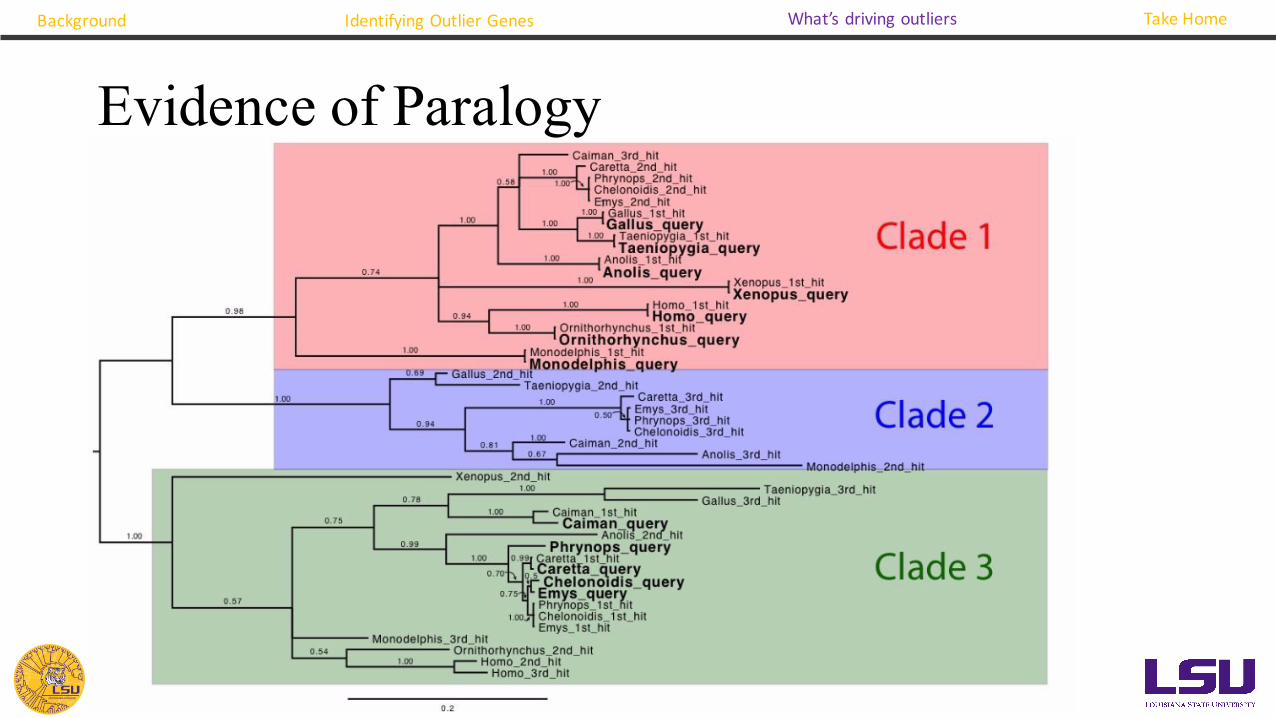
Evidence of Paralogy
Background Identifying Outlier Genes What’s driving outliers Take Home
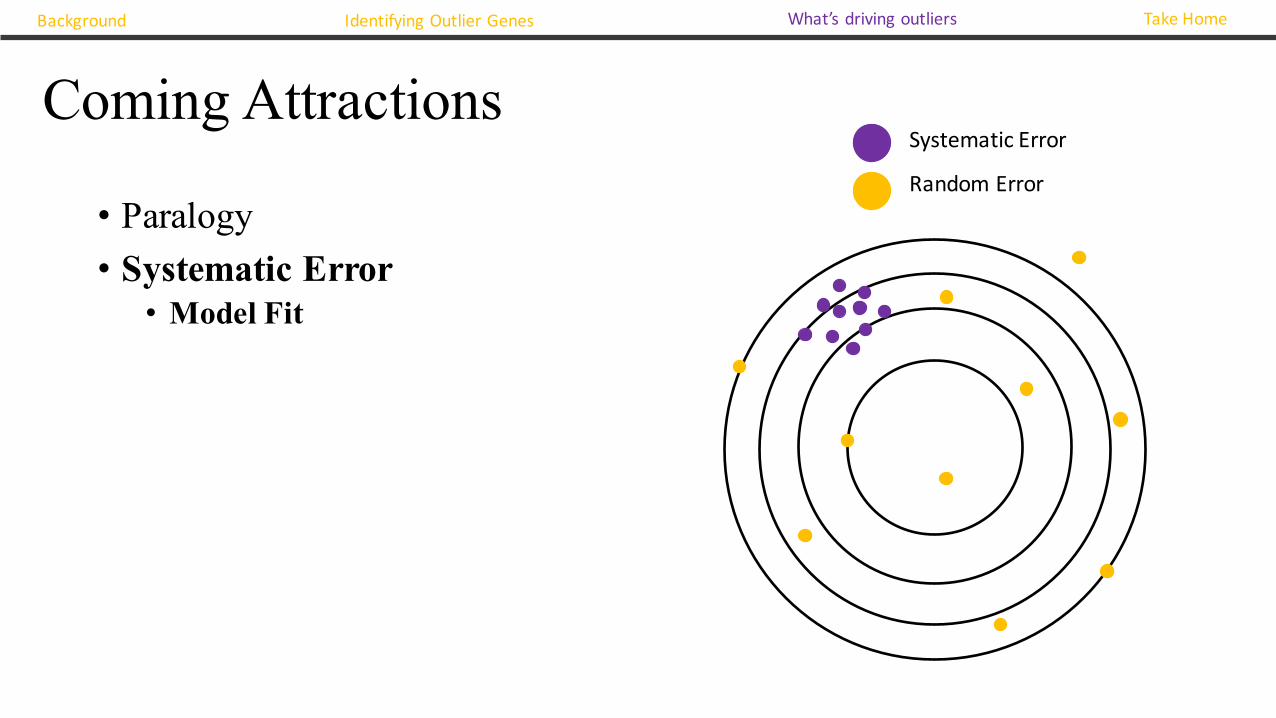
• Paralogy• Systematic Error• Model Fit
Coming AttractionsSystematic Error
Random Error
Background Identifying Outlier Genes What’s driving outliers Take Home
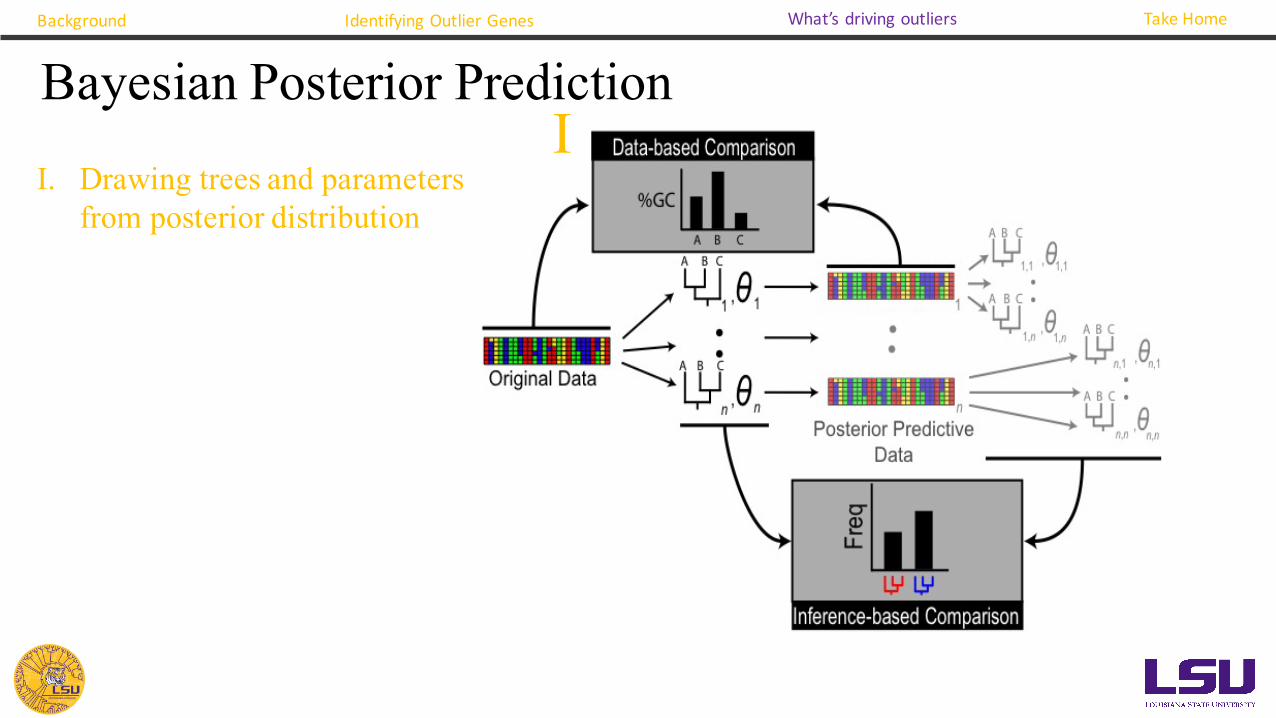
Bayesian Posterior Prediction
I. Drawing trees and parameters from posterior distribution
Background Identifying Outlier Genes What’s driving outliers Take Home
I
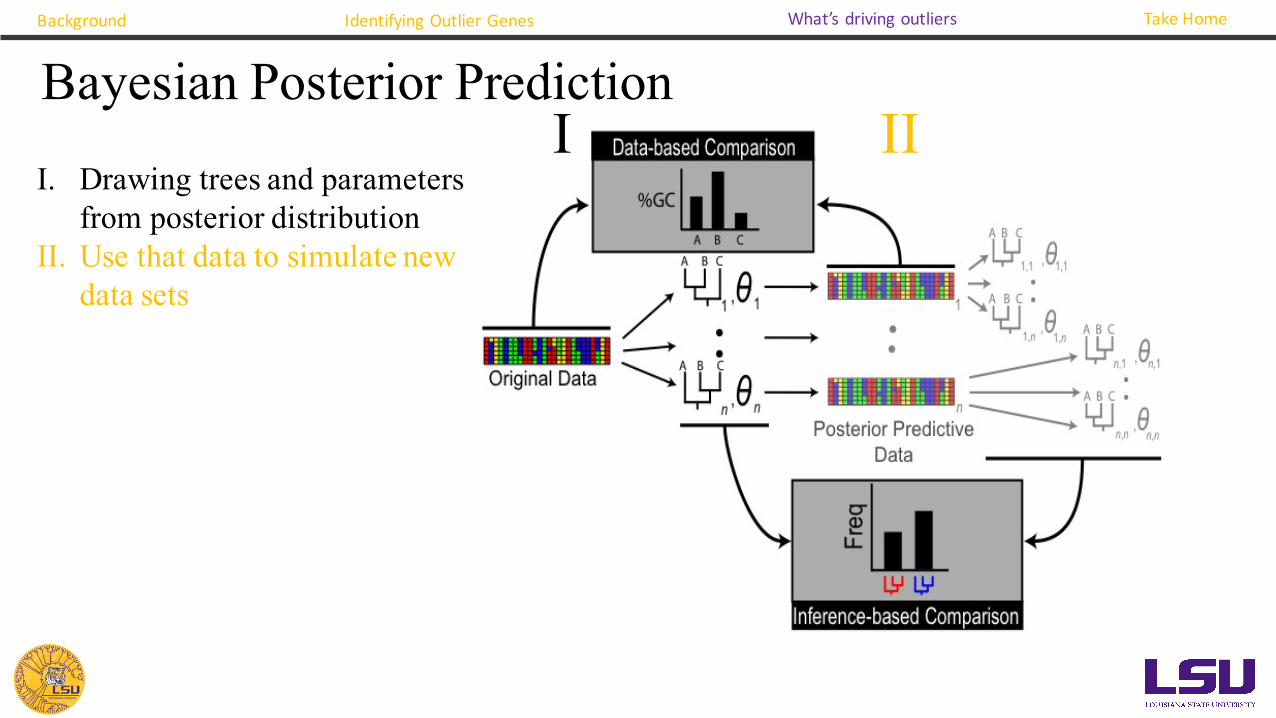
IIBayesian Posterior Prediction
I. Drawing trees and parameters from posterior distribution
II. Use that data to simulate new data sets
Background Identifying Outlier Genes What’s driving outliers Take Home
I

II IIIBayesian Posterior Prediction
I. Drawing trees and parameters from posterior distribution
II. Use that data to simulate new data sets
III.Summarize each dataset using a test statistic
Background Identifying Outlier Genes What’s driving outliers Take Home
I
II III
IV
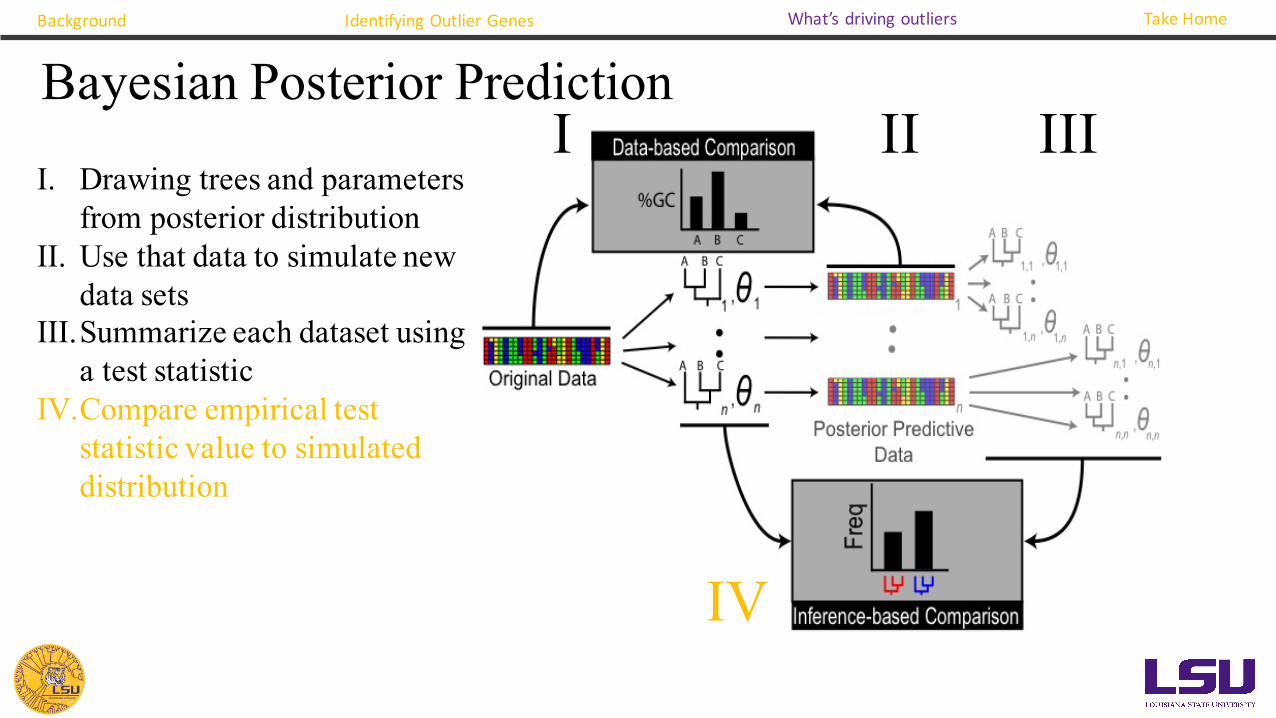
Bayesian Posterior Prediction
I. Drawing trees and parameters from posterior distribution
II. Use that data to simulate new data sets
III.Summarize each dataset using a test statistic
IV.Compare empirical test statistic value to simulated distribution
Background Identifying Outlier Genes What’s driving outliers Take Home
I
Take Home• Support can be misleading when using genomic-scale data.• Standard support values hide a lot of variation in underlying data. • Some loci have outlying extreme support values.• Caution: • Outlier loci included in joint analyses can have huge influence.• Small differences in analytical choices can have huge influence on results.
• Using Bayes Factors as a measure of support can help identify some of this hidden variation.
Background Identifying Outlier Genes What’s driving outliers Take Home

Acknowledgements
Brown LabGuifang Zhou
Genevieve MountDavid Morris
DEB-1355071DEB-1354506DBI-1356796