genetic variation in eight chinese cattle breeds - biomed central
TRANSCRIPT

Original article
Genetic variation in eight Chinese cattlebreeds based on the analysisof microsatellite markers
Weibin SUN1, Hong CHEN1,2*, Chuzhao LEI
1, Xueqin LEI3,
Yinghan ZHANG1
1College of Animal Science and Technology, Northwest A&F University, Shaanxi KeyLaboratory of Molecular Biology for Agriculture, Yangling, Shaanxi 712100, China2Institute of Cellular and Molecular Biology, Xuzhou Normal University, Xuzhou,
Jiangsu 221116, China3Henan Sci-tech University, Luoyang, Henan 471000, China
(Received 16 December 2007; accepted 16 May 2008)
Abstract – Genetic variability and genetic relationships were investigated among eightChinese cattle breeds using 12 microsatellite markers. Three hundred and fifty-two alleleswere detected and the average number of alleles per locus ranged from 8.33±1.67 in theJiaxian breed to 21.33±5.60 in the Qinchuan breed with a mean value of 13.91. The totalnumber of alleles per microsatellite ranged from 21 (INRA005, HEL1) to 40 (HEL13), with amean of 29.33 per locus. The fixation indices at the 12 loci in the eight breeds were very lowwith a mean of 0.006. A principal components analysis and the construction of a neighbor-joining tree showed that these eight Chinese cattle breeds cluster into three groups i.e. theYanbianandChineseHolstein, theNanyangandJiaxian, and the four remainingbreeds.Thisclustering agrees with the origin and geographical distributions of these Chinese breeds.
Chinese cattle breed / microsatellite DNA / genetic variability / genetic relationship
1. INTRODUCTION
Since the 1980s, the Chinese beef industry has expanded considerably andthis progress has been accompanied by the introduction of several foreign spe-cialized beef breeds, especially from Europe. European breeds are often used assire lines for crossbreeding with Chinese indigenous cattle breeds. Such breed-ing schemes have contributed in improving individual weight gain and beefcarcass weight of Chinese breeds [27], which only account for two-thirds ofthe world average level and about one half of that in developed countries, suchas Canada, Australia, and USA. However, such crossbreeding with foreign
*Corresponding author: [email protected]
Genet. Sel. Evol. 40 (2008) 681–692� INRA, EDP Sciences, 2008DOI: 10.1051/gse:2008027
Available online at:www.gse-journal.org
Article published by EDP Sciences

breeds also results in consistent and rapid loss of genetic diversity by dilution ofthe autochthonous genetic makeup.
The existence of genetic polymorphism or diversity in a population is thebasis of genetic improvement by selection and needs to be accurately estimated[23]. In the past decades, animal genetic diversity has been assessed according tovarious criteria including phenotypic, biochemical, and molecular parameters.With the development of molecular biology techniques, nucleotide variationsin DNA sequences can be detected directly such as microsatellite markers iden-tified in all eukaryotic species investigated so far [3,18]. Microsatellite markershave become the mainstay of genetic linkage mapping and quantitative trait lociidentification for economic traits and they have also been used to address ques-tions concerning the genetic diversity and the genetic relationships in speciessuch as cattle [11]. However, in cattle, most of these studies have focused onEuropean breeds and little information is available on the genetic diversity ofChinese indigenous cattle breeds. The purpose of the present study was to eval-uate the genetic diversity of eight cattle breeds in China based on microsatellitemarkers and to estimate the genetic relationships among these eight breeds.
2. MATERIALS AND METHODS
2.1. Sample collection for DNA analysis
Three hundred and thirty animals from eight Chinese indigenous cattle breedsi.e.Qinchuan (QC,120),Nanyang (NY,30), Jiaxian (JX, 30),Luxi (LX,30),Bohai(BH, 30), Jinnan (JN, 30), Chinese Holstein (CH, 30), andYanbian (YB, 30) wereanalyzed. Blood and tissue samples were collected from various geographicallocations (Fig. 1), because these breeds are distributed over fiveChinese provinces(Jilin, Shandong, Shaanxi, Shanxi, andHenan). Economically, themost importantcattle breeds in China are the Qinchuan, Jinnan, Nanyang, Luxi, and Yanbianbreeds since they represent 90% of the retail beef market share in China.
2.2. DNA extraction and PCR amplification
DNAwas extracted using standard SDS lysis, proteinase K digestion, phenol/chloroform extraction, and ethanol precipitation [19]. DNA samples were resus-pended in TE buffer (10 mmolÆL�1 Tris-HCl, 1 mmolÆL�1 EDTA, pH = 8) andstored at �20 �C.
Twelve bovine microsatellite markers were selected from the CaDBasedatabase on Genetic Diversity in Cattle (http://www.projects.roslin.ac.uk/cdiv/markers.html) and the USDA Cattle Genome Mapping Project (http://www.marc.usda.gov/genome/cattle/cattle.html).
682 W. Sun et al.

Polymerase chain reactions (PCR) were performed in 12 lL reaction mix-tures using the Biometra TGradient Thermal Cycler (Germany). Each reactionmixture contained 1.0 lL (final concentration 0.5 UÆlL�1) of Ex TaqTM,DNA polymerase (TaKaRa Biotechnology Co., Ltd., Japan), 1.2 lL of10 X PCR buffer, 1.5 lL of MgCl2 (25 mmolÆL�1), 0.75 lL of dNTPs(2.5 mmolÆL�1), 1.0 lL of primers (10 lmolÆL�1), 2.0 lL of template DNA(50 ngÆlL�1), and 4.55 lL of sterile H2O. The following PCR conditions wereused: initial denaturation at 95 �C for 2 min, followed by 35 cycles of 30 s at94 �C (denaturation), 30 s at the optimal temperature for each primer pair(annealing), and 45 s at 72 �C (elongation), and a final extension stepat 72 �C for 10 min. The reaction mixtures were stored at 4 �C. After thePCR amplification, 3–4 lL of PCR product was loaded onto an 8% polyacryl-amide non-denaturing gel with pBR322 DNA/MspI as the molecular sizemarker. After electrophoresis (3–4 h at 120 V), the gels were stained with silver
Figure 1. Geographic localizations of the eight cattle breeds analyzed in this study.YB: Yanbian, BH: Bohai, JN: Jinnan, LX: Luxi, QC: Qinchuan, CH: ChineseHolstein, JX: Jiaxian, NY: Nanyang.
Microsatellite analysis in Chinese cattle breeds 683
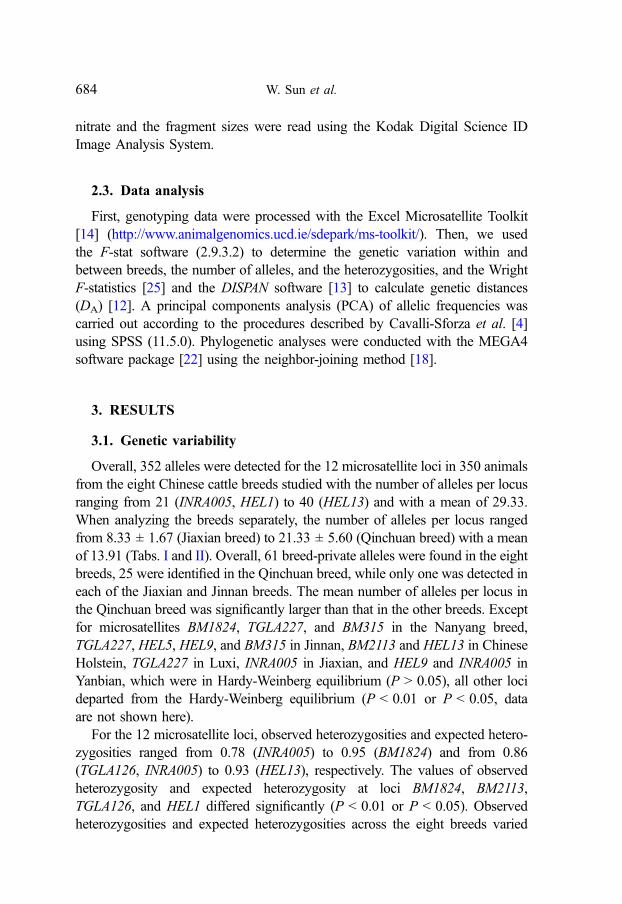
nitrate and the fragment sizes were read using the Kodak Digital Science IDImage Analysis System.
2.3. Data analysis
First, genotyping data were processed with the Excel Microsatellite Toolkit[14] (http://www.animalgenomics.ucd.ie/sdepark/ms-toolkit/). Then, we usedthe F-stat software (2.9.3.2) to determine the genetic variation within andbetween breeds, the number of alleles, and the heterozygosities, and the WrightF-statistics [25] and the DISPAN software [13] to calculate genetic distances(DA) [12]. A principal components analysis (PCA) of allelic frequencies wascarried out according to the procedures described by Cavalli-Sforza et al. [4]using SPSS (11.5.0). Phylogenetic analyses were conducted with the MEGA4software package [22] using the neighbor-joining method [18].
3. RESULTS
3.1. Genetic variability
Overall, 352 alleles were detected for the 12 microsatellite loci in 350 animalsfrom the eight Chinese cattle breeds studied with the number of alleles per locusranging from 21 (INRA005, HEL1) to 40 (HEL13) and with a mean of 29.33.When analyzing the breeds separately, the number of alleles per locus rangedfrom 8.33 ± 1.67 (Jiaxian breed) to 21.33 ± 5.60 (Qinchuan breed) with a meanof 13.91 (Tabs. I and II). Overall, 61 breed-private alleles were found in the eightbreeds, 25 were identified in the Qinchuan breed, while only one was detected ineach of the Jiaxian and Jinnan breeds. The mean number of alleles per locus inthe Qinchuan breed was significantly larger than that in the other breeds. Exceptfor microsatellites BM1824, TGLA227, and BM315 in the Nanyang breed,TGLA227, HEL5, HEL9, and BM315 in Jinnan, BM2113 and HEL13 in ChineseHolstein, TGLA227 in Luxi, INRA005 in Jiaxian, and HEL9 and INRA005 inYanbian, which were in Hardy-Weinberg equilibrium (P > 0.05), all other locideparted from the Hardy-Weinberg equilibrium (P < 0.01 or P < 0.05, dataare not shown here).
For the 12 microsatellite loci, observed heterozygosities and expected hetero-zygosities ranged from 0.78 (INRA005) to 0.95 (BM1824) and from 0.86(TGLA126, INRA005) to 0.93 (HEL13), respectively. The values of observedheterozygosity and expected heterozygosity at loci BM1824, BM2113,TGLA126, and HEL1 differed significantly (P < 0.01 or P < 0.05). Observedheterozygosities and expected heterozygosities across the eight breeds varied
684 W. Sun et al.

Table I. Number of microsatellite alleles observed (N), range of allele sizes, observed heterozygosities (HO), expected heterozygosities(HS), PIC, allelic richness, and fixation indices at each locus.
Locus Number ofalleles (N)
Sizes ofalleles (bp)
HO HS PIC Allelicrichness
Fixation indices
FIS FIT FST
BM1824 28 171–247 0.95a 0.89b 0.87 7.40 �0.06 �0.02 0.04BM2113 31 124–170 0.98A 0.91B 0.88 7.87 �0.07 �0.04 0.03CSSM66 36 175–247 0.91 0.90 0.86 7.50 �0.01 0.03 0.03ETH152 28 179–235 0.85 0.90 0.86 7.81 0.06** 0.10 0.04TGLA126 22 113–149 0.92a 0.86b 0.86 6.71 �0.06 �0.02 0.04TGLA227 31 67–125 0.94 0.90 0.86 7.67 �0.05* �0.002 0.05INRA005 21 135–177 0.78 0.86 0.82 6.17 0.10 0.14 0.04HEL1 21 101–145 0.94A 0.89B 0.85 6.83 �0.06 �0.03 0.02HEL5 31 119–205 0.73 0.91 0.87 7.70 0.20 0.23 0.04HEL9 33 141–193 0.94 0.91 0.88 7.88 �0.03 0.00 0.03HEL13 40 142–228 0.87 0.93 0.89 8.27 0.07** 0.09 0.02BM315 30 102–174 0.91 0.92 0.88 8.08 0.01** 0.04 0.03Total 352 – – – – – – – –Mean 29.33 – 0.89 0.90 0.87 – 0.008 0.04 0.04
Notes: HO, HS marked with different letters were significantly different to each other (a,b: P < 0.05, A,B: P < 0.01); FIS values marked with** or * were significantly different from zero (**P < 0.01, *P < 0.05).
Microsatellite
analysisin
Chinese
cattlebreeds
685

from 0.81 (Qinchuan breed) to 0.95 (Luxi breed) and from 0.86 (Jiaxian breed)to 0.93 (Jinnan breed), respectively. FIS values of the Qinchuan and Yanbianbreeds were significantly different from 0 (P < 0.01 or P < 0.05). Allelic rich-ness (mean number of alleles per locus) in the eight populations ranged from6.17 (INRA005) to 8.27 (HEL13), with a mean of 7.49. FIS values at lociETH152, TGLA227, HEL13, and BM315 differed significantly from 0(P < 0.0l or P < 0.05). In all the eight breeds, FIS values were very low, withnegative values in Jiaxian, Luxi, and Bohai breeds and positive values inQinchuan, Nanyang, Jinnan, Chinese Holstein, and Yangbian breeds. The meansof FIS, FIT, and FST at the 12 microsatellite loci and in the eight breeds were0.01, 0.04, and 0.04, which indicate that 4% of the genetic variability dependson the breed and 96% on the individual’s genotype. Average polymorphisminformation content (PIC) values for the 12 loci ranged from 0.82 (INRA005)to 0.89 (HEL13) and all these loci appeared to be highly informative (PIC > 0.5)in the eight breeds.
3.2. Breed relationships and genetic distances
A PCAwas performed for allelic frequencies using the breed as the only fac-tor to summarize breed relationships (Fig. 2). The percentages of varianceexplained by the first three components were 41.63%, 13.98%, and 11.25%,respectively. According to the principal component matrix (not shown here),
Table II. Mean number of alleles per locus (NA), expected and observedheterozygosities (HS and HO), PIC, breed-private allele numbers, and FIS observedfrom the 12 microsatellites in eight Chinese cattle breeds.
Breeds NA HS HO PIC Privateallelenumber
FIS
Qinchuan 21.33 0.81 0.91 0.90 25 0.09**
Nanyang 13.08 0.89 0.90 0.87 14 0.01Jiaxian 8.33 0.87 0.86 0.80 1 �0.02Luxi 14.67 0.95 0.91 0.88 5 �0.05Bohai 13.92 0.92 0.89 0.86 2 �0.03Jinnan 13.67 0.92 0.93 0.87 1 0.003Chinese Holstein 12.58 0.86 0.89 0.85 4 0.04Yanbian 13.67 0.90 0.91 0.88 9 0.01*
Total – – – – 61 –Mean – 0.81 0.90 0.87 7.63 0.006
Note: FIS values marked with ** or * were significantly different from zero (**P < 0.01,*P < 0.05).
686 W. Sun et al.

the first principal components of the eight breeds were all positive, the secondprincipal components were negative for the Yanbian, Chinese Holstein, andBohai breeds and positive for the others, the third principal components werepositive for the Qinchuan, Luxi, and Jinnan breeds and negative for the others.Thus, these eight cattle breeds can be roughly divided into three groups:Yanbian, Chinese Holstein, and Bohai breeds in one group, Qinchuan, Luxi,and Jinnan breeds in the second group, and Jiaxian and Nanyang breeds inthe third group.
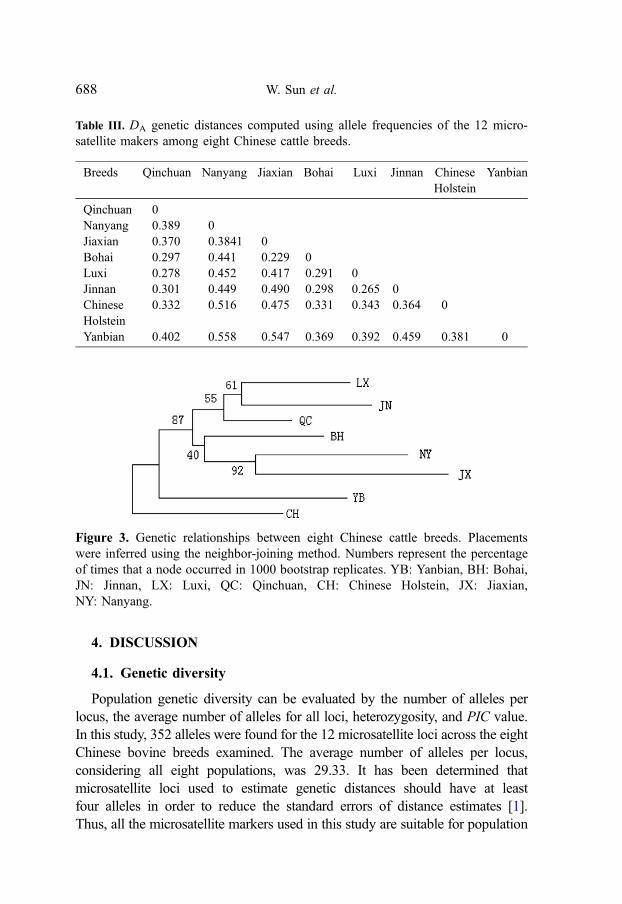
Allele frequencies were used to generate the DA genetic distance for each pairof cattle breeds (Tab. III). The DA genetic distances ranged from 0.229 (betweenBohai and Jiaxian breeds) to 0.56 (between Yanbian and Nanyang breeds).These DA genetic distances were used to construct a neighbor-joining tree(Fig. 3) revealing the clustering of the eight populations into three groups:(1) Yanbian and Chinese Holstein breeds; (2) Qinchuan, Luxi, and Jinnanbreeds; and (3) Nanyang, Jiaxian, and Bohai breeds.
Figure 2. Three-dimensional plot of PAC1, PAC2 vs. PAC3 based on allelefrequencies of 12 microsatellite markers in eight breeds. YB: Yanbian (0.403, 0.716,and 0.136); CH: Chinese Holstein (0.559, 0.538, and 0.010); BH: Bohai (0.747,0.126, and 0.020); QC: Qinchuan (0.803, �0.116, and �0.166); LX: Luxi (0.694,�0.118, and �0.269); JN: Jinnan (0.656, �0.224, and �0.541); NY: Nanyang (0.588,�0.443, and 0.425); and JX: Jiaxian (0.629, �0.161, and 0.554).
Microsatellite analysis in Chinese cattle breeds 687
4. DISCUSSION
4.1. Genetic diversity
Population genetic diversity can be evaluated by the number of alleles perlocus, the average number of alleles for all loci, heterozygosity, and PIC value.In this study, 352 alleles were found for the 12 microsatellite loci across the eightChinese bovine breeds examined. The average number of alleles per locus,considering all eight populations, was 29.33. It has been determined thatmicrosatellite loci used to estimate genetic distances should have at leastfour alleles in order to reduce the standard errors of distance estimates [1].Thus, all the microsatellite markers used in this study are suitable for population
Figure 3. Genetic relationships between eight Chinese cattle breeds. Placementswere inferred using the neighbor-joining method. Numbers represent the percentageof times that a node occurred in 1000 bootstrap replicates. YB: Yanbian, BH: Bohai,JN: Jinnan, LX: Luxi, QC: Qinchuan, CH: Chinese Holstein, JX: Jiaxian,NY: Nanyang.
Table III. DA genetic distances computed using allele frequencies of the 12 micro-satellite makers among eight Chinese cattle breeds.
Breeds Qinchuan Nanyang Jiaxian Bohai Luxi Jinnan ChineseHolstein
Yanbian
Qinchuan 0Nanyang 0.389 0Jiaxian 0.370 0.3841 0Bohai 0.297 0.441 0.229 0Luxi 0.278 0.452 0.417 0.291 0Jinnan 0.301 0.449 0.490 0.298 0.265 0ChineseHolstein
0.332 0.516 0.475 0.331 0.343 0.364 0
Yanbian 0.402 0.558 0.547 0.369 0.392 0.459 0.381 0
688 W. Sun et al.
genetic diversity analyses. Sixty-one breed-private alleles were identified overthe eight Chinese bovine breeds with 25 present in the Qinchuan breed and onlyone in each of the Jiaxian and Jinnan breeds. The fact that in this study a highernumber of alleles and breed-private alleles were found at each locus in theQinchuan breed can be explained by its larger population size. The larger a pop-ulation is, the more alleles with low frequencies can be detected [26].
Takezaki et al. [21] have suggested that for markers to be useful to measuregenetic variation, they should have an average heterozygosity higher than 0.3 inthe population. Marker heterozygosities in the eight populations of this studyrange between 0.73 and 0.98 and thus it was considered that they wereappropriate.
PIC is an indicator of the degree of informativeness of a marker. According tothe criteria of Botstein et al. [2], all 12 microsatellite loci included in this studyare highly informative (PIC > 0.5) and thus will be useful to evaluate thegenetic diversity in Chinese bovine breeds. The mean PIC content in the eightstudied populations was between 0.85 and 0.90, the Chinese Holstein breedshowing the lowest value and the Qinchuan breed the highest. The low PICof Chinese Holstein may be due to the high selection pressure applied in thisbreed for 100 years [16].
Since the early 19th century, when the concept of a breed grew in currency,many European bovine breeds have become genetically isolated and inmost casestheir origins can be traced to a small pool of founder individuals. This is also thecase for Chinese Holstein cattle, which have experienced a similar breeding prac-tice. Thus, not only the narrow genetic background of this breed but also theinbreeding and the higher selection pressure, have contributed to the loss ofgenetic variation, which is revealed by reduced allele numbers and lower PIC val-ues [20]. Meanwhile, breeding strategies for Chinese native bovine breeds havechanged over time [5], but no extensive breeding program for a specialized selec-tion has been undertaken during a sufficiently long period. Thus, these breeds stillpossess an abundant genetic polymorphism at most loci, and indeed the 12 micro-satellite loci analyzed in the eight breeds, here, are highly polymorphic.
4.2. Relationships and origin of Chinese bovine breeds
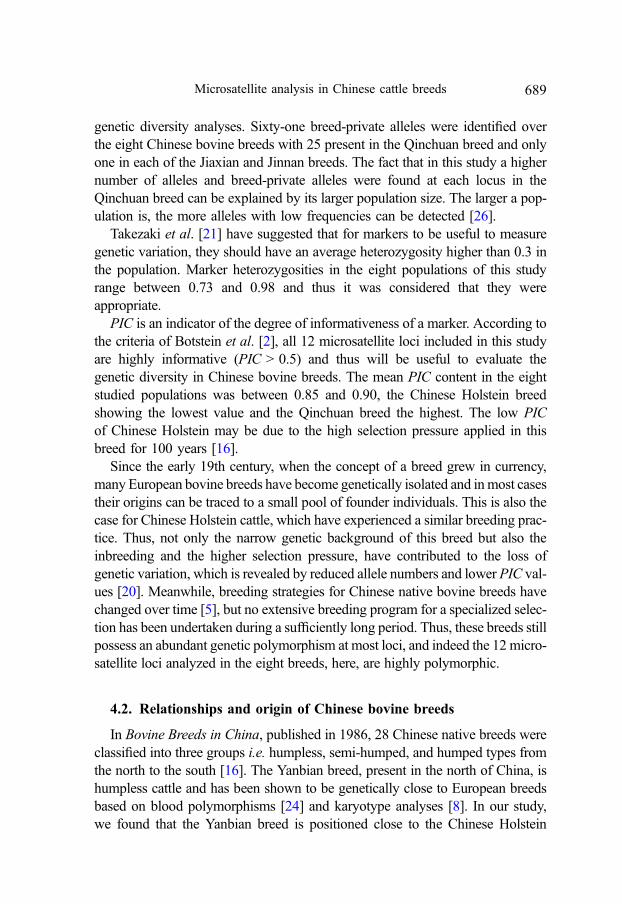
In Bovine Breeds in China, published in 1986, 28 Chinese native breeds wereclassified into three groups i.e. humpless, semi-humped, and humped types fromthe north to the south [16]. The Yanbian breed, present in the north of China, ishumpless cattle and has been shown to be genetically close to European breedsbased on blood polymorphisms [24] and karyotype analyses [8]. In our study,we found that the Yanbian breed is positioned close to the Chinese Holstein
Microsatellite analysis in Chinese cattle breeds 689

breed both by PCA and construction of a phylogenetic tree with DA distances(Figs. 2 and 3). The Nanyang breed is obviously humped cattle and has azebu-like Y chromosome [8] and could be phylogenetically close to zebus,but mtDNA sequencing analyses have indicated that the Nanyang breedpossesses maternal origins from both Bos taurus and Bos indicus [9]. Qinchuan,Jinnan, Luxi, Bohai, and Jiaxian are semi-hump breeds and they are all distrib-uted in central China and have complex Y chromosomal types [8] and mtDNAhaplotypes [9]. It has been shown that these breeds result from crossbreedingbetween northern breeds (B. taurus) and southern breeds (B. indicus) [7,10]clustered together. In this study, the largest DA distance was found between theYanbian and Nanyang breeds (0.558), which is consistent with their geographicallocalization (Fig. 1). The Bohai breed is the only Chinese bovine breed, whichhas a black coat and thus it differs from other Chinese bovine breeds, whichare yellow or red. The Bohai breed is positioned close to the Yanbian breed asshown by PCA and by their geographic distributions, but in the phylogenetic tree,it is found close to the Nanyang and Jiaxian breeds (Fig. 3).
Genetic and archeological evidence supports at least two domesticationevents for cattle from different wild progenitors. The aurochs types B. taurus,also termed taurine cattle, are postulated to have originated in the Near Eastand Africa, while B. indicus, or zebu, have arisen in India and Africa [10].
The earliest domestic cattle known in North China were the progenies of theLonghorn of B. taurus from Western Europe, which were distinguished frombachryseros and Bos primigenius taurus, and appeared with the introgressionof Mongolian into the huge and extensive area to the north of China [6,7,15].These breeds gradually adapted to the local environmental conditions andexpanded southward but the Qinling Mountains and the temperature andweather conditions constituted natural barriers to their expansion. Meanwhile,the humped zebu inhabited the areas of the Yangtze and Zhujiang valleys andmight have originated from the Bibos genus, such as the zebu, Bos bateng,and even Bos gaurus, which were also the progenitors of the zebu in South-eastern Asia [6,7,17]. The cattle breeds localized in the central parts ofChina and detouring the Qinling Mountains are situated at a cross-point and thusthe analysis of their origin, domestication, and migration is much morecomplicated.
ACKNOWLEDGEMENTS
We thank Ms Helene Hayes for her kind help in editing the language and alsothank the detailed comments and advice from the reviewers. We are also gratefulto Dr. Minqiang Wang (Yantai University, China) and Mr. Xiaohong Lan
690 W. Sun et al.

(the Director of Shaanxi Qinchuan Cattle Farm, China) for their generous help insample collection. This work was supported by the National Natural ScienceFoundation of China (30471238, 30070551), the National High TechnologyResearch and Development Program of China (863 Program) (No.2006AA10Z197), National Key Technology R&D Program (No.2006BAD01A10-5), Innovative Foundation of Outstanding Talent from HenanProvince (No. 0521001900), Sustaining Program for Topnotch Persons ofNorthwest A&F University (No. 01140101), Natural Science Foundation ofXuzhou Normal University (No. 2003XY234), and Program for New CenturyExcellent Talents in University of 2007 (NCET).
REFERENCES
[1] Barker J.S.F., A global protocol for determining genetic distances amongdomestic livestock breeds, in: Proceedings of the 5th World Congress onGenetics Applied to Livestock Production, Guelph and Ontario, Canada, 1994,pp. 501–508.
[2] Botstein D., White R.L., Skolnick M., Davis R.W., Construction of a geneticlinkage map in human using restriction fragment length polymorphisms, Am. J.Hum. Genet. 32 (1980) 314–331.
[3] Bradley D.G., Loftus R.T., Cunningham P., MacHugh D.E., Genetics anddomestic cattle origins, Evol. Anthropol. 6 (1998) 79–86.
[4] Cavalli-Sforza L.L., Menozzi P., Piazza A., The history and geography of humangenes, Princeton University Press, Princeton, NJ, 1994.
[5] ChenH., Strategies of selection and breeding for the beef performance inQinchuancattle, J. Yellow Cattle Sci. 2 (2002) 1–4 (in Chinese with English abstract).
[6] Chen Y.C., Cao H.H., Diversity of Chinese yellow cattle breeds and theirconservation, Chin. Biodivers. 9 (2001) 275–283 (inChinesewith English abstract).
[7] Chen Y.C., Wang Y.Y., Cao H.H., Zhang Y., Characteristics of Chinese yellowcattle ecospecies and their course of utilization, China Agriculture Press,Beijing, China, 1990 (in Chinese).
[8] Lei C., Chen H., Hu S., Study on the Y chromosome polymorphisms andorigination and classification of Chinese cattle breeds, Acta Agriculturae Borealioccidentalis Sinica 4 (2000) 43–47 (in Chinese with English abstract).
[9] Lei C.Z., Chen H., Zhang H.C., Cai X., Liu R.Y., Luo L.Y., Wang C.F., ZhangW., Ge Q.L., Zhang R.F., Lan X.Y., Sun W.B., Origin and phylogeographicalstructure of Chinese cattle, Anim. Genet. 37 (2006) 579–582.
[10] Loftus R.T., MacHugh D.E., Bradley D.G., Sharp P.M., Cunningham E.P.,Evidence for two independent domestications of cattle, Proc. Natl. Acad. Sci.USA 91 (1994) 2757–2761.
[11] McHugh D.E., Loftus R.T., Bradley D.G., Sharp M., Cunningham E.P.,Microsatellite DNA variation within and among European cattle breeds, Proc.R. Soc. Lond. Ser. B 256 (1994) 25–31.
Microsatellite analysis in Chinese cattle breeds 691

[12] Nei M., Tajima F., Tateno Y., Accuracy of estimated phylogenetic trees frommolecular data, J. Mol. Evol. 19 (1983) 153–170.
[13] Ota T., DISPAN: genetic distance and phylogenetic analysis, Penn. StateUniversity, University Park, PA, 1993.
[14] Park S.D.E., Trypanotolerance in West African cattle and the population geneticeffects of selection, Ph.D. thesis, University of Dublin, 2001.
[15] Payne W.J.A., Tropical cattle: origins, breeds and breeding policy, BlackwellScience, Oxford, 1995.
[16] Qiu H., Qing Z.R., Chen Y.C., Wang A.D., Bovine breeds in China, ShanghaiScientific and Technical Press, Shanghai, China, 1988 (in Chinese).
[17] Ron M., Blanc Y., Band M., Ezra E., Weller J.I., Misidentification rate in Israelidairy cattle population and its implications for genetic improvement, J. DairySci. 79 (1996) 676–681.
[18] Saitou N., Nei M., The neighbor-joining method: a new method forreconstructing phylogenetic trees, Mol. Biol. Evol. 4 (1987) 406–425.
[19] Sambrook J., Russell D.W., Molecular cloning: a laboratory manual, 2nd edn.,Cold Spring Harbor Laboratory Press, Beijing, 1992.
[20] Shan X., Zhang Y., Ning L.I., Effects of several microsatellite DNA loci on milkproduction in dairy cattle, Acta Genet. Sinica 5 (2002) 430–433 (in Chinese withEnglish abstract).
[21] Takezaki N., Nei M., Genetic distances and reconstruction of phylogenetic treefrom microsatellite DNA, Genetics 144 (1996) 389–399.
[22] Tamura K., Dudley J., Nei M., Kumar S., MEGA4: molecular evolutionarygenetics analysis (MEGA) software version 4.0, Mol. Biol. Evol. 24 (2007)1596–1599.
[23] Tautz D., Notes on the definition and nomenclature of tandemly repetitive DNAsequences, in: Pena S.D.J., Chakraborty R., Epplen J.T., Jeffreys A.J. (Eds.),DNA Fingerprint: State of the Science, Birkauser Verlag, Basel, 1993, p. 21.
[24] Wang Y., Cao H., Pang Z., Study on the blood polymorphisms of Chineseyellow cattle breeds and their genetic relationships, in: Ecological Character-istics and Utilization Directions, China Agriculture Press, Beijing, 1990 (inChinese with English abstract).
[25] Weir B.S., Cockerham C.C., Estimating F statistics for the analysis of populationstructure, Evolution 38 (1984) 1358–1370.
[26] Yan L., Zhang D., Effects of sample size on various genetic diversity measuresin population genetic study with microsatellite DNA markers, Acta Zool. Sinica2 (2004) 279–290 (in Chinese with English abstract).
[27] Zhang Y., Several problems on the structure of Chinese animal production andbeef industry, J. Yellow Cattle 2 (2003) 4–8 (in Chinese with English abstract).
692 W. Sun et al.