genetic diversity of fusarium solani isolates from black ... papers/jtas vol. 37 (3)...
TRANSCRIPT
Pertanika J. Trop. Agric. Sci. 37 (3): 363 - 374 (2014)
ISSN: 1511-3701 © Universiti Putra Malaysia Press
TROPICAL AGRICULTURAL SCIENCEJournal homepage: http://www.pertanika.upm.edu.my/
Article history:Received: 26 August 2013Accepted: 29 May 2014
ARTICLE INFO
E-mail addresses: [email protected] (Shahnazi, S.), [email protected] (Meon, S.), [email protected] (Vadamalai, G.), [email protected] (Yazdani, D.), [email protected] (Shabanimofrad, M.)* Corresponding author
Genetic Diversity of Fusarium solani Isolates from Black Pepper (Piper nigrum L.) in Malaysia by ISSR marker
Shahnazi, S.1, Meon, S.1,2*, Vadamalai, G.1,2, Yazdani, D.3 and Shabanimofrad, M.4
1Institute of Tropical Agriculture, Universiti Putra Malaysia, 43400 Serdang, Selangor, Malaysia2Department of Plant Protection, Faculty of Agriculture, Universiti Putra Malaysia, 43400 Serdang, Selangor, Malaysia3Pharmacognosy and Pharmaceutic Department of Medicinal Plants Research Center, Institute of Medicinal Plants-ACECR, Karaj, Iran 4Department of Crop Science, Faculty of Agriculture, Universiti Putra Malaysia, 43400 Serdang, Selangor, Malaysia
ABSTRACT
For effective management and control of yellowing disease, inter-simple sequence repeat (ISSR) markers were employed to investigate genetic diversity among 34 isolates of Fusarium solani, which had been isolated from major growing areas of black pepper in Malaysia. Over 15 primers, with fragment sizes ranging from 200 bp to 3600 bp, and a total of 253 amplified loci were amplified in all 34 isolates, with an average of 17 bands per primer; among which 248 (98.02 %) were polymorphic. High genetic diversity at species level was revealed (Nei’s gene diversity h = 0.2671 and Shannon information index I = 0.4134, respectively). Sarikei population was found to have a higher degree of polymorphism compared to other populations. The dendrogram generated from UPGMA cluster analysis categorized the 34 F. solani isolates into two major clusters based on Jaccard’s similarity coefficients. Cluster I contained a unique isolate. Cluster II contained 33 isolates which were split into two different subclusters. Results showed that the clusters were not related to geographic origins. Meanwhile, ISSR fingerprinting generated highly polymorphic markers that could be used to study genetic characterization of F. solani and to clarify phylogenic relationships, as well as useful for efficient management of yellowing
disease and finding breeding programmes to find cultivars of black pepper that are resistant to F. solani.
Keywords: Fusarium solani, Genetic diversity, Inter-
simple sequence repeat (ISSR), Piper nigrum L.

Shahnazi, S., Meon, S., Vadamalai, G., Yazdani, D. and Shabanimofrad, M.
364 Pertanika J. Trop. Agric. Sci. 37 (3) 363 - 374 (2014)
INTRODUCTION
One of the most recognized spices in the world is black pepper (Piper nigrum L.; Family: Piperaceae). Black pepper is a perennial climbing vine grown for its berries and it is extensively used as spice in traditional medicine. Malaysia is one of the major producers and exporters of pepper (Ravindran, 2000). The productivity of black pepper is slowly declining (Krishnamoorthy & Parthasarathy, 2010), while crop losses caused by diseases are a major production limitation in Malaysia and other pepper-producing countries (Kueh & Sim, 1992; Sarma et al., 1992).
The most serious diseases of black pepper are ones caused by fungal pathogens and plant parasitic nematodes (Bong & Saad, 1986; Ramana & Eapen, 2000; Thankamani et al., 2008). One of the most important diseases of black pepper is yellowing disease, which is also known as slow decline (Kueh et al., 1993; Sitepu & Mustika, 2000). Fusarium solani was identified as the causal agent of this particular disease (Hamada et al., 1988). It is important to note that Fusarium infection in black pepper plantation has been reported to reduce the economic life of the plantation from 20 to 6-8 years and the productivity per plant from 3.0 to 1.5 kg (Anandaraj, 2000).
Genetic characterization of plant pathogens variants established in an area is required for effective management and to increase crop yield. The Fusarium wilt disease can be managed by the use of resistant cultivars (Jalali & Chand, 1992). Plant pathogens are continuously mutating
and changing, resulting in new strains and new challenges to growers (Koike et al., 2000). Development of a molecular marker technique to differentiate highly virulent and nonpathogenic isolates is important in managing the Fusarium disease in a variety of crops (Belabid et al., 2004). Disease management is difficult due to the presence of several pathogen types. For any one crop, the grower must deal with a variety of fungi, bacteria, viruses and nematodes. Hence, an increase in the genetic diversity of the crop host rotation is an important management step that incorporates ecological considerations (Koike et al., 2000).
The choice of a molecular marker technique for genetic diversity assay is dependent upon its reproducibility and simplicity (Bornet & Branchard, 2001). The most common used PCR-based DNA marker systems are random amplified polymorphic DNA (RAPD), amplified fragment length polymorphism (AFLP) and simple sequence repeats (SSRs) (Pradeep Reddy et al., 2002). The main limitations of these techniques include low reproducibility of RAPD, high cost of AFLP and the need to know the flanking sequences to develop specific SSR primers. ISSR is a technique that overcomes most of these limitations (Zietkiewicz et al., 1994; Pradeep Reddy et al., 2002).
A new molecular marker method called ISSR has been available since 1994 (Zietkiewicz et al., 1994). ISSR is a technique which involves the use of microsatellite sequences as primers in a PCR to generate multilocus markers (Pradeep

Genetic Diversity of Fusarium solani Isolates from Black Pepper (Piper nigrum L.) in Malaysia by ISSR marker
365Pertanika J. Trop. Agric. Sci. 37 (3): 363 - 374 (2014)
Reddy et al., 2002). ISSRs are known to be abundant, very reproducible and highly polymorphic tandem repeat motifs composed of 1 to 7 nucleotides (Bornet et al., 2004).
PCR analysis using ISSR primers has been acknowledged as a valuable technique in studies concerning genetic diversity, phylogenies and evolutionary biology (Pradeep Reddy et al., 2002). The information about genetic diversity within a species is helpful to come up with proper management programmes (Frankham, 1995). Distinct genetic differentiation within the same races can be assumed as an environmental factor affecting pathogen properties (Weller, 1988).
The aim of the present study was to examine the genetic diversity of F. solani populations obtained from black pepper fields in Malaysia and to assess the phylogenic relationships of F. solani isolates using ISSR markers to managing yellowing disease in black pepper in future studies.
MATERIALS AND METHODS
Fungal Isolates
For the purpose of this study, the roots of black pepper plants with yellowing disease symptoms and rhizosphere soils were collected from major growing areas in Sarawak (Sibu and Sarikei) and Johor (Kulai). Based on their morphological characteristics and molecular techniques (DNA sequencing of the ITS regions), 34 Fusarium solani isolates were obtained. The isolates of this species were used for ISSR fingerprinting.
DNA Extraction
Genomic DNA of F. solani isolates was extracted using CTAB method (Doyle & Doyle, 1990) and DNA concentration was determined using NanoDrop ND-1000 spectrophotometer (Thermo Fisher Scientific, Inc., USA) by computing UV absorbance at 260/280-nm ratio. The isolated genomic DNA was diluted to 50 ng/mL and stored at -20ºC for ISSR amplification.
PCR Amplification
A total of 20 primers were initially screened for PCR amplification and 15 primers that produced clear and reproducible banding patterns were chosen for final analysis. The ISSR markers were amplified using 15 primers (First Base Laboratories Sdn. Bhd., Malaysia), unanchored and anchored on 5’ or 3’- ends with di- or tri-nucleotide repeats in the ISSR analysis (Table 1). The PCR amplification was carried out in 20 µl reaction mixtures containing 2 µl of 10x PCR buffer (100 mM Tris-Hcl [pH 8.3], 500 mM KCl, 20 mM MgCl2), 2 µl of dNTP mixture (2.5 mM each), 0.4 µl of Taq (5 U/µl) (iNtRON Biotechnology, Inc., Seoul, Korea), 1 µl of ISSR primer (10 µM) and 1 µl of diluted genomic DNA.
The PCR amplifications were performed in Biometra Tpersonal Thermocycler. This involved an initial step at 94ºC for 5 min, followed by 40 cycles of denaturing at 94ºC for 1 min, annealing at primer specific temperature (Table 1) for 45 seconds and extension at 72 ºC for 2 min, followed by a final extension step for 7 min. The

Shahnazi, S., Meon, S., Vadamalai, G., Yazdani, D. and Shabanimofrad, M.
366 Pertanika J. Trop. Agric. Sci. 37 (3) 363 - 374 (2014)
amplification products were separated via electrophoresis on 1.4% agarose gel with 1x TBE buffer at 110 Vcm-1 for 2.5 hours by electrophoresis. The 1000 plus DNA ladder (iNtRON Biotechnology, Inc., Seoul, Korea) was used as a DNA marker for electrophoresis. To prepare ethidium bromide solution, 0.01 g ethidium bromide was dissolved in 1 ml distilled water and 50 μl of this stock was added to 500 ml distilled water. The gels were stained with ethidium
bromide and the bands were visualized and photographed under UV light using a gel documentation imaging system (Bio-Rad, USA).
Data Analysis
Amplified bands from each primer were scored as present (1) or absent (0). Only the bands which had been amplified consistently were considered. Fragments of the same molecular weight were considered as the
TABLE 1 Primers, amplification conditions and polymorphism of ISSR markers
ISSR primer type
Sequence (5’-3’)
Annealing temperature (ºC)
G + C content (%)
NABa NPBb PPBc (%)
PCR product size range (bpd)
UBC 807 (AG)8T 51 47.1 10 10 100 300-1200
UBC 808 (AG)8C 49 52.9 19 19 100 250-1700
UBC 809 (AG)8G 52 52.9 12 11 91.67 250-1500
UBC 810 (GA)8T 48 47.1 20 20 100 300-3200
UBC 811 (GA)8C 51 52.9 22 22 100 250-2400
UBC 818 (CA)8G 49 52.9 16 15 93.75 250-2200
UBC 825 (AC)8T 50 47.1 8 7 87.50 550-2400
UBC 835 (AG)8YC 55 52.8 20 19 95 200-2200
UBC 841 (GA)8YC 49 52.8 24 23 95.83 200-2100
UBC 855 (AC)8YT 50 47.2 22 22 100 250-2500
UBC 856 (AC)8YA 54 47.2 19 19 100 250-3200
UBC 858 (TG)8RT 53 47.2 8 8 100 400-3000
UBC 864 (ATG)6 52 33.3 12 12 100 400-1800
UBC 885 BHB(GA)7 53 51 27 27 100 200-3600
UBC 886 VDV(CT)7 49 51 14 14 100 250-2200a NAB: number of amplified bands; b NPB: number of polymorphic bands; c PPB: percentage of polymorphic bands; d bp: base pair. Note: R= (A,G)= Purine, Y= (C,T)= Pyrimidine, B= (C,G,T) (i.e. not A), D= (A,G,T) (i.e. not C), H= (A,C,T) (i.e. not G), V= (A,C,G) (i.e. not T)
Genetic Diversity of Fusarium solani Isolates from Black Pepper (Piper nigrum L.) in Malaysia by ISSR marker
367Pertanika J. Trop. Agric. Sci. 37 (3): 363 - 374 (2014)
same locus. The data were used to calculate the number of bands produced by each primer and the percentage of polymorphic loci.
To study the genetic relationships among the isolates, a pair-wise similarity matrix was generated using Jaccard’s similarity coefficient. Cluster analysis was performed to develop a dendrogram. The dendrogram was constructed using an unweighted paired group method of cluster analysis using arithmetic averages algorithm (UPGMA) of NTSYS-pc Version 2.1, a numerical taxonomy and multivariate analysis software package (Rohlf, 2000).
The binary data matrix was input into POPGENE 32 version 1.31 (Yeh et al., 1999), assuming HardyeWeinberg equilibrium. Meanwhile, the POPGENE software was used to calculate genetic similarity coefficient and Nei’s unbiased genetic distance among the populations. The percentage of polymorphism band (PPB), Nei’s gene diversity (h), Shannon’s information index (I), observed number of alleles per locus (na) and effective number of alleles per locus (ne) were calculated to estimate the genetic variation.
RESULTS
ISSR polymorphism
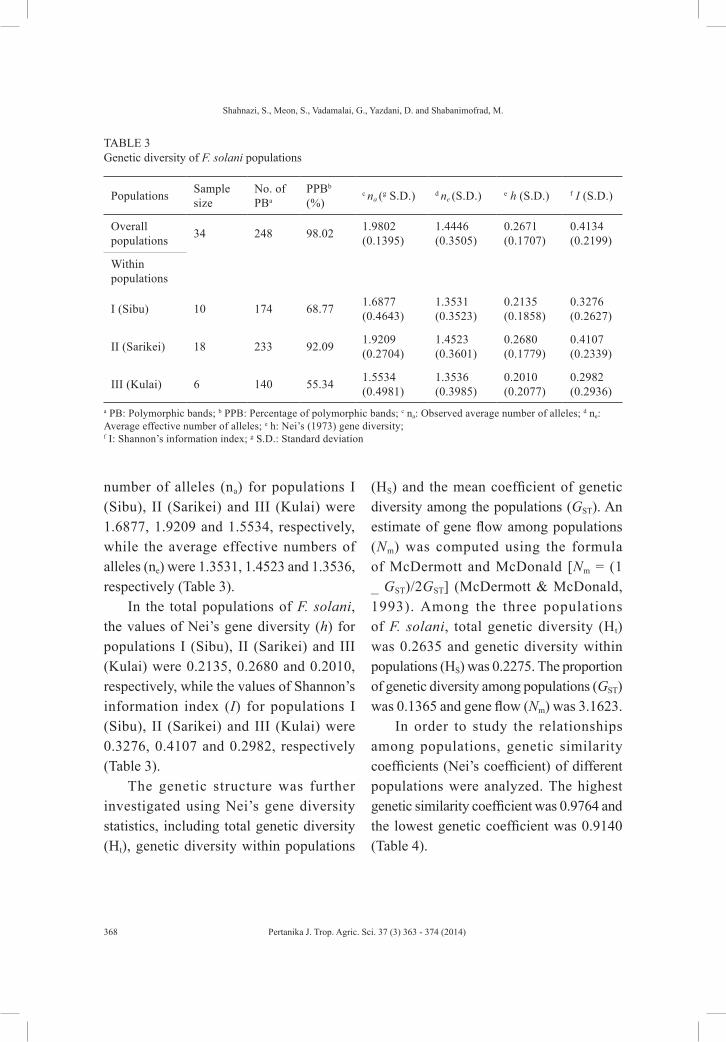
Three populations of F. solani were studied for genetic diversity based on locations and geographical distributions (Table 2). Over the 15 primers, the fragment size obtained from F. solani isolates ranged from 200 bp to 3600 bp and a total of 253 amplified bands (loci) were generated, with an average of 17 bands per primer. The number of amplified bands per primer ranged from a maximum of 27 discrete bands in BHB(GA)7 to a minimum of 8 in (AC)8T and (TG)8RT (Table 1). The number of polymorphic bands was 248 while the percentage of polymorphism was 98.02% among 34 individual isolates (Table 3). The average number of polymorphic bands per primer was 16.5. It is important to note that BHB(GA)7 produced the greatest number of polymorphism (Table 1).
Genetic Diversity
Among the populations of F. solani, the percentage of the polymorphic bands for populations I (Sibu), II (Sarikei) and III (Kulai) were 68.77, 92.09 and 55.34%, respectively (Table 3). The observed average
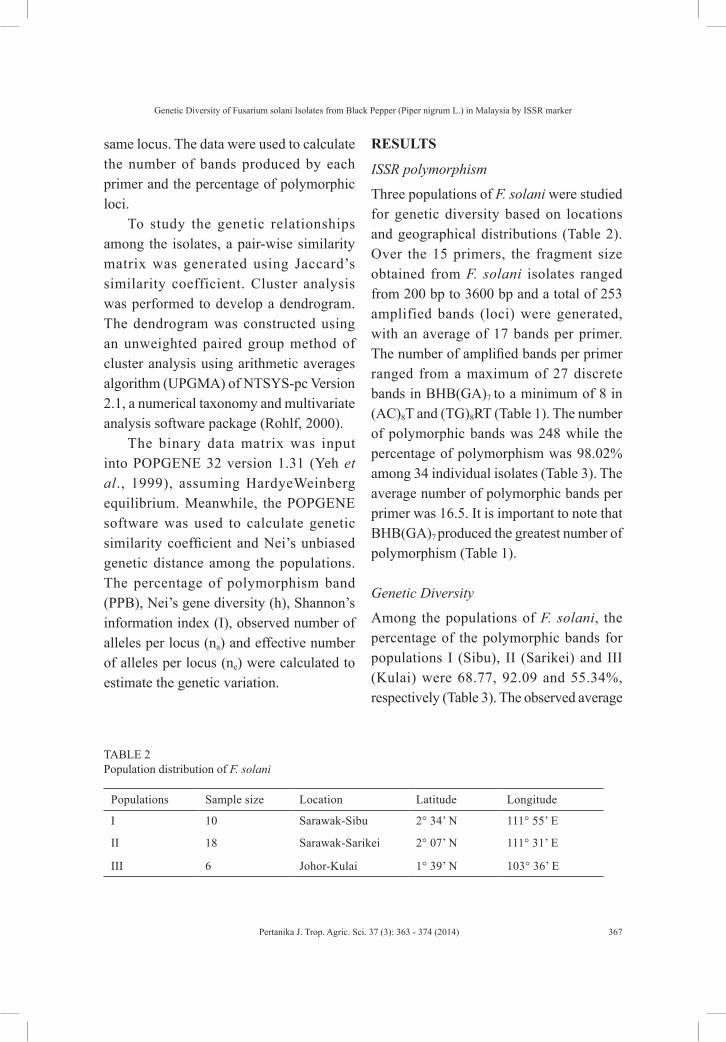
TABLE 2 Population distribution of F. solani
Populations Sample size Location Latitude Longitude
I 10 Sarawak-Sibu 2° 34’ N 111° 55’ E
II 18 Sarawak-Sarikei 2° 07’ N 111° 31’ E
III 6 Johor-Kulai 1° 39’ N 103° 36’ E
Shahnazi, S., Meon, S., Vadamalai, G., Yazdani, D. and Shabanimofrad, M.
368 Pertanika J. Trop. Agric. Sci. 37 (3) 363 - 374 (2014)
number of alleles (na) for populations I (Sibu), II (Sarikei) and III (Kulai) were 1.6877, 1.9209 and 1.5534, respectively, while the average effective numbers of alleles (ne) were 1.3531, 1.4523 and 1.3536, respectively (Table 3).
In the total populations of F. solani, the values of Nei’s gene diversity (h) for populations I (Sibu), II (Sarikei) and III (Kulai) were 0.2135, 0.2680 and 0.2010, respectively, while the values of Shannon’s information index (I) for populations I (Sibu), II (Sarikei) and III (Kulai) were 0.3276, 0.4107 and 0.2982, respectively (Table 3).
The genetic structure was further investigated using Nei’s gene diversity statistics, including total genetic diversity (Ht), genetic diversity within populations
(HS) and the mean coefficient of genetic diversity among the populations (GST). An estimate of gene flow among populations (Nm) was computed using the formula of McDermott and McDonald [Nm = (1 _ GST)/2GST] (McDermott & McDonald, 1993). Among the three populations of F. solani, total genetic diversity (Ht) was 0.2635 and genetic diversity within populations (HS) was 0.2275. The proportion of genetic diversity among populations (GST) was 0.1365 and gene flow (Nm) was 3.1623.
In order to study the relationships among populations, genetic similarity coefficients (Nei’s coefficient) of different populations were analyzed. The highest genetic similarity coefficient was 0.9764 and the lowest genetic coefficient was 0.9140 (Table 4).
TABLE 3 Genetic diversity of F. solani populations
Populations Sample size
No. of PBa
PPBb (%)
c na (g S.D.) d ne (S.D.) e h (S.D.) f I (S.D.)
Overall populations 34 248 98.02 1.9802
(0.1395)1.4446 (0.3505)
0.2671 (0.1707)
0.4134 (0.2199)
Within populations
I (Sibu) 10 174 68.77 1.6877 (0.4643)
1.3531 (0.3523)
0.2135 (0.1858)
0.3276 (0.2627)
II (Sarikei) 18 233 92.09 1.9209 (0.2704)
1.4523 (0.3601)
0.2680 (0.1779)
0.4107 (0.2339)
III (Kulai) 6 140 55.34 1.5534 (0.4981)
1.3536 (0.3985)
0.2010 (0.2077)
0.2982 (0.2936)
a PB: Polymorphic bands; b PPB: Percentage of polymorphic bands; c na: Observed average number of alleles; d ne: Average effective number of alleles; e h: Nei’s (1973) gene diversity; f I: Shannon’s information index; g S.D.: Standard deviation
Genetic Diversity of Fusarium solani Isolates from Black Pepper (Piper nigrum L.) in Malaysia by ISSR marker
369Pertanika J. Trop. Agric. Sci. 37 (3): 363 - 374 (2014)
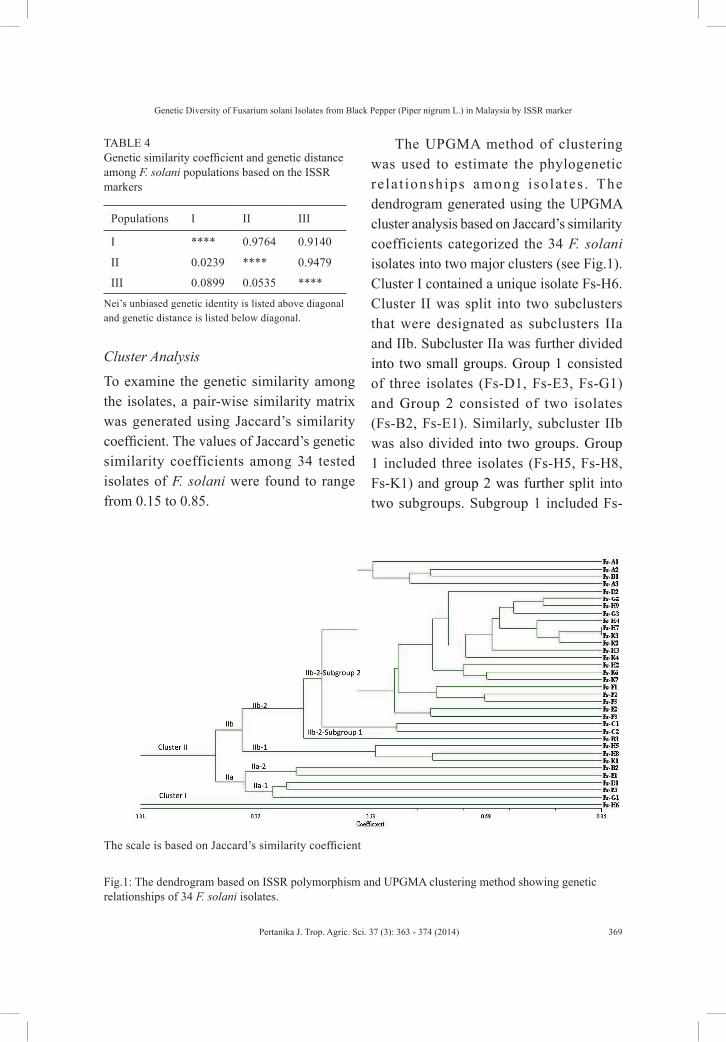
TABLE 4 Genetic similarity coefficient and genetic distance among F. solani populations based on the ISSR markers
Populations I II III
I **** 0.9764 0.9140
II 0.0239 **** 0.9479
III 0.0899 0.0535 ****
Nei’s unbiased genetic identity is listed above diagonal and genetic distance is listed below diagonal.
Cluster Analysis
To examine the genetic similarity among the isolates, a pair-wise similarity matrix was generated using Jaccard’s similarity coefficient. The values of Jaccard’s genetic similarity coefficients among 34 tested isolates of F. solani were found to range from 0.15 to 0.85.
The UPGMA method of clustering was used to estimate the phylogenetic re la t ionships among isola tes . The dendrogram generated using the UPGMA cluster analysis based on Jaccard’s similarity coefficients categorized the 34 F. solani isolates into two major clusters (see Fig.1). Cluster I contained a unique isolate Fs-H6. Cluster II was split into two subclusters that were designated as subclusters IIa and IIb. Subcluster IIa was further divided into two small groups. Group 1 consisted of three isolates (Fs-D1, Fs-E3, Fs-G1) and Group 2 consisted of two isolates (Fs-B2, Fs-E1). Similarly, subcluster IIb was also divided into two groups. Group 1 included three isolates (Fs-H5, Fs-H8, Fs-K1) and group 2 was further split into two subgroups. Subgroup 1 included Fs-
Fig.1: The dendrogram based on ISSR polymorphism and UPGMA clustering method showing genetic relationships of 34 F. solani isolates.
The scale is based on Jaccard’s similarity coefficient

Shahnazi, S., Meon, S., Vadamalai, G., Yazdani, D. and Shabanimofrad, M.
370 Pertanika J. Trop. Agric. Sci. 37 (3) 363 - 374 (2014)
B3 isolate and subgroup 2 included the remaining 24 F. solani isolates. Similarity index was calculated at 21% between the two major clusters. The isolates in cluster II showed 31.6% similarity. The isolates in subcluster IIa showed 35.6% similarity and the isolates in subcluster IIb exhibited 34.9% of similarity (Fig.1).
DISCUSSION
Fusarium disease is difficult to control because the pathogen has survived in infected soil for many years (Haware et al., 1996). Due to the variability of genetic structure, one of the useful methods to control Fusarium wilt is the development of resistant cultivars and the races of pathogen (Nene & Haware, 1980). Successful management is largely dependent upon a complete knowledge of the species, including levels and structure of genetic variation (Jin & Li, 2007).
In this study, the ISSR technique has been demonstrated as applicable to evaluation of genetic diversity among the F. solani isolates. First, a great number of primers (20 primers) were assayed with (AG), (GA), (AC), (CA), (TG), (CT), (ATG) repeats in order to select suitable polymorphic ISSR markers for the study. Five primers [(GC)9YR, (AT)9YR, (CT)8RG, (CA)8RT and (GA)8YT] failed to produce any amplification patterns. In this study, the optimum annealing temperature for the ISSR markers varied from 48º to 55ºC, and the ISSR markers gave constant and reproducible bands across separate PCR runs. Regardless of the relatively small
sample sizes, 248 polymorphic ISSR loci were sufficient enough to detect the variation and to differentiate F. solani populations with different geographical origins.
The UPGMA cluster analysis of Jaccard’s similarity coefficients generated a dendrogram which categorized the 34 F. solani isolates into two major clusters. Cluster I contained a unique isolate that showed a unique banding pattern and was distinct from other isolates. Cluster II contained 33 isolates that were further split into two subclusters. The low similarity index value (21%) between the two clusters showed the high genetic variability among the isolates. The relatively low value of the similarity index was mainly due to isolate Fs-H6. This isolate was clearly distinct from the rest of F. solani isolates based on morphological characteristics. The dendrogram indicated that the clusters were not related to geographic origins.
Many studies revealed that there is a clear association between population characteristics and the environments in which they occur (Zhao et al., 2007). The genetic relationships between the populations in a species do not often accord with their geographical distance, especially for the species with large distribution area. Other factors including mutation, reproduction mode, gene flow, geographic range of populations, number of populations studied, sample size of populations and type of markers used can influence the patterns of genetic variability among and within the populations (Ma et al., 2008). Lack of genetic diversity decreases the ability of a
Genetic Diversity of Fusarium solani Isolates from Black Pepper (Piper nigrum L.) in Malaysia by ISSR marker
371Pertanika J. Trop. Agric. Sci. 37 (3): 363 - 374 (2014)
particular species to survive environmental changes (Cao et al., 2006).
The genetic diversity of F. solani was high at both the species and population levels. It is similar to the genetic diversity of some other Fusarium species revealed by the ISSR markers as reported by Nagarajan et al. (2004), Mishra et al. (2006) and Dinolfo et al. (2010). Among the three populations of F. solani, Population II (Sarikei) showed the maximum variation (92.09%), while population III (Kulai) showed the minimum variation (55.34%). The present study found the PPB value of 92.09% in population II, indicating that the population tested had a higher degree of polymorphism compared to other populations, while population III had the lowest genetic diversity levels. Based on Nei’s coefficient, the highest genetic similarity coefficient was between Sibu population and Sarikei population, whereas the lowest genetic coefficient was revealed between Sibu population and Kulai population. Based on Jaccard’s coefficients, the lowest similarity coefficient (0.15) was found between Fs-H6 and Fs-F2 isolates, whereas the greatest extent of similarity coefficient (0.85) was shown between Fs-K3 and Fs-H7 isolates.
Among the overall populations of F. solani, the observed average number of alleles (na) and the average effective number of alleles (ne) were 1.9802 and 1.4446, respectively. The analysis of the ISSR markers using different approaches (Nei’s gene diversity and Shannon’s information measure) demonstrated similar interpretations of the genetic structure of the
populations of F. solani. Similarly, Nei’s gene diversity and Shannon’s information index also revealed high genetic variation at species level of F. solani (0.2671 and 0.4134, respectively), with an average of 0.2275 and 0.3452, respectively. Genetic variation at species level was found to be generally higher than at the population level.
Meanwhi l e , gene f low a ffec t s genetic diversity level among and within populations. In population genetics, a value of gene flow (Nm) < 1.0 and a value of gene differentiation (Gst) > 0.25 are regarded as significant population differentiation (Slatkin, 1987).
The low coefficient of genetic diversity (GST) and the high gene flow (Nm) among the overall populations influenced the emergence and evolutionary development of F. solani (GST =0.1365, Nm =3.1623). This result is supported by Mishra et al. (2006). The result suggests that frequent gene flow and low coefficient of genetic diversity are predominant evolutionary forces determining the evolution and development of this particular fungus in Malaysia.
The distribution of genetic diversity among the F. solani isolates taken from major growing areas of black pepper in Malaysia was examined and a high level of variability was observed among the isolates by ISSR. Genetic characterization of F. solani is essential for an efficient management of yellowing disease through the use of resistant cultivars in black pepper growing areas.
Shahnazi, S., Meon, S., Vadamalai, G., Yazdani, D. and Shabanimofrad, M.
372 Pertanika J. Trop. Agric. Sci. 37 (3) 363 - 374 (2014)
CONCLUSION
The results of this study have proven the suitability and reliability of ISSR-PCR fingerprinting as a useful tool for population structure studies and discrimination among individual fungal isolates. ISSR is a reliable technique for genetic analysis of Fusarium solani and clarify phylogenic relationships in order to establish breeding programmes. In more specific, the ISSR fingerprinting generated highly polymorphic markers for F. solani and it is useful molecular markers for further genetic diversity studies. This method could be helpful for breeders to find cultivars of black pepper that are resistant to F. solani.
ACKNOWLEDGEMENTS
The authors acknowledged the financial support by Universiti Putra Malaysia. The authors would also like to thank Ali Ranjbarfard and Dr. Mazmi Ahmad for their invaluable suggestions.
REFERENCESAnandaraj, M. (2000). Diseases of black pepper.
In P. N. Ravindran (Ed.), Black Pepper, Piper nigrum. (pp. 239-252). Volume 13 of the book series Medicinal and Aromatic Plants-Industrial Profiles. Amsterdam, The Netherlands: Harwood Academic Publisher.
Belabid, L., Baum, M., Fortas, Z., Bouznad, Z., & Eujayl, I. (2004). Pathogenic and genetic characterization of algerian isolates of Fusarium oxysporum f. sp. lentis by RAPD and AFLP analysis. African Journal of Biotechnology, 3(1), 25-31.
Bong C. F. J., & Saad M. S. (1986). Pepper (Piper nigrum L.) in Malaysia. Universiti Pertanian Malaysia Cawangan Sarawak.
Bornet, B., & Branchard, M. (2001). Nonanchored inter simple sequence repeat (ISSR) markers: Reproducible and specific tools for genome fingerprinting. Plant Molecular Biology Reporter, 19(3), 209-215.
Bornet, B., Antoine, E., Bardouil, M., & Baut, C. M. (2004). ISSR as new markers for genetic characterization and evaluation of relationships among phytoplankton. Journal of Applied Phycology, 16(4), 285-290.
Cao, P. J., Yao, Q. F., Ding, B. Y., Zeng, H. Y., Zhong, Y. X., Fu, C. X., & Jin, X. F. (2006). Genetic diversity of Sinojackia dolichocarpa (Styracaceae), a species endangered and endemic to China, detected by inter-simple sequence repeat (ISSR). Biochemical Systematics and Ecology, 34, 231- 239.
Dinolfo, M. I., Stenglein, S. A., Moreno, M. V., Nicholson, P., Jennings, P., & Salerno, G. L. (2010). ISSR markers detect high genetic variation among Fusarium poae isolates from Argentina and England. European Journal of Plant Pathology, 127, 483-491.
Doyle, J. J., & Doyle, J. L. (1990). Isolation of plant DNA from fresh tissue. Focus, 12, 13-15.
Frankham, R. (1995). Conservation genetics. Annual Review of Genetics, 29, 305-327.
Hamada, M., Uchida, T., & Tsuda, M. (1988). Ascospore dispersion of the causal agent of Nectria blight of Piper nigrum. Annals of the Phytopathologicial Society of Japan, 54, 303-308.
Haware, M. P., Nene, Y. L., & Natarajan, M. (1996). Survival of Fusarium oxysporum f. sp. ciceri in soil absence of chickpea. Phytopathologia Mediterranea, 35, 9-12.
Genetic Diversity of Fusarium solani Isolates from Black Pepper (Piper nigrum L.) in Malaysia by ISSR marker
373Pertanika J. Trop. Agric. Sci. 37 (3): 363 - 374 (2014)
Jalali, B. L., & Chand, H. (1992). Chickpea wilt. In U.S. Singh, A.N. Mukhopadhayay, J. Kumar & H.S. Chaube (Eds.), Diseases of cereals and pulses (pp. 420-444). Plant diseases of International Importance, 1Prentice Hall, Englewood Cliffs, NJ.
Jin, Z., & Li, J. (2007). Genetic differentiation in endangered Heptacodium miconioides Rehd. based on ISSR polymorphism and implications for its conservation. Forest Ecology and Management, 245, 130–136.
Koike, S. T., Gaskell, M., Fouche, C., Smith, R., & Mitchell, J. (2000). Plant disease management for organic crops. Retrieved from http://anrcatalog. ucdavis.edu/pdf/7252.pdf
Krishnamoorthy, B., & Parthasarathy, V. A. (2010). Improvement of black pepper. CAB Reviews: Perspectives in Agriculture, Veterinary Science, Nutrition and Natural Resources, 5(3), 1-12
Kueh, T. K., & Sim, S. L. (1992). Important pepper diseases in Sarawak, Malaysia. In P. Wahid, D. Sitepu, S. Deciyanto & U. Superman (Eds.), The International workshop on black pepper diseases (pp. 101-117). Bandar Lampung, Indonesia, Institute for spice and medicinal crops, Bogor, Indonesia.
Kueh, T. K., Gumbek, M., Wong, T. H., & Chin, S. P. (1993). A field guide to diseases, pests and nutritional disorders of black pepper in Sarawak. Agricultural research centre Semongok, Department of Agriculture Kuching. Lee Ming Press Company, Sarawak, Malaysia.
Ma, X., Zhang, X. Q., Zhou, Y. H., Bai, S. Q., & Liu, W. (2008). Assessing genetic diversity of Elymus sibiricus (Poaceae: Triticeae) populations from Qinghai-Tibet Plateau by ISSR markers. Biochemical Systematics and Ecology, 36, 514–522.
McDermott, J. M., & McDonald, B. A. (1993). Gene flow in plant pathosystems. Annual Review of Phytopathology, 31, 353-373.
Mishra, P. K., Tewari, J. P., Clear, R. M., & Turkington, T. K. (2006). Genetic diversity and recombination within populations of Fusarium pseudograminearum from western Canada. International Microbiology, 9, 65-68.
Nagarajan, G., Nam, M.H., Song, J. Y., Yoo, S. J., & Kim, H. G. (2004). Genetic Variation in Fusarium oxysporum f. sp. fragariae populations based on RAPD and rDNA RFLP analyses. Journal of Plant Pathology, 20(4), 264-270.
Nene, Y. L., & Haware, M. P. (1980). Screening chickpea for resistance to wilt. Plant Disease, 64, 379-380.
Pradeep Reddy, M., Sarla, N., & Siddiq, E.A. (2002). Inter Simple Sequence Repeat (ISSR) polymorphism and its application in plant breeding. Euphytica, 128, 9-17.
Ramana, K. V., & Eapen, S. J. (2000). Nematode induced diseases of black pepper. In P.N. Ravindran (Eds.), Black Pepper, Piper nigrum. (pp. 269-296). Volume 13 of the book series Medicinal and Aromatic Plants- Industrial Profiles. Amsterdam, the Netherlands: Harwood Academic Publishers.
Ravindran, P. N. (2000). Introduction. In P. N. Ravindran (Eds.), Black Pepper, Piper nigrum. (pp. 1-12). Volume 13 of the book series Medicinal and Aromatic Plants- Industrial Profiles. Amsterdam, the Netherlands: Harwood Academic Publishers.
Rohlf, F. J. (2000). NTSYS-PC: Numerical taxonomy and multivariate analysis system version 2.1. Stony Brook, New York: State University of New York.
Sarma, Y. R., Anandaraj, M., & Ramana, K. V. (1992). Present status of black pepper diseases in India and their management. In P. Wahid, D. Sitepu, S. Deciyanto & U. Superman (Eds.), The International workshop on black pepper diseases (pp. 67-78). Bandar Lampung, Indonesia, Institute for spice and medicinal crops, Bogor, Indonesia.
Shahnazi, S., Meon, S., Vadamalai, G., Yazdani, D. and Shabanimofrad, M.
374 Pertanika J. Trop. Agric. Sci. 37 (3) 363 - 374 (2014)
Sitepu, D., & Mustika, I. (2000). Diseases of black pepper and their management in Indonesia. In P. N. Ravindran (Eds.), Black Pepper, Piper nigrum. (pp. 297-305). Volume 13 of the book series Medicinal and Aromatic Plants-Industrial Profiles. Amsterdam, the Netherlands: Harwood Academic Publishers.
Slatkin, M. (1987). Gene flow and the geographic structure of natural populations. Science, 236, 787-792.
Thankamani, C. K., Srinivasan V., Dinesh, R., Santhosh J. E., & Rajeev, P. (2008). Black pepper. Indian Institute of Spices Research. Retrieved from http://www.spices .res.in/package/ pepper.pdf
Weller, D. M. (1988). Biological control of soilborne plant pathogens in the rhizosphere with bacteria. Annual Review of Phytopathology, 26, 379-407.
Yeh, F. C., Yang, R. C., & Boyle, T. (1999). Microsoft Window-based Freeware for Population Genetic Analysis (POPGENE), Version 1.31. Retrieved from ftp://ftp.microsoft.-com/softlib/mslfiles/ hpgl.exe.
Zhao, W., Wang, Y., Chen, T., Jia, G., Wang, X., Qi, J., Pang, Y., Wang, S., Li, Z., Huang, Y., Pan, Y., & Yang, Y.H. (2007). Genetic structure of mulberry from different ecotypes revealed by ISSRs in China: An implication for conservation of local mulberry varieties. Scientia Horticulturae, 115, 47–55.
Zietkiewicz, E., Rafalski, A., & Labuda, D. (1994). Genome fingerprinting by simple sequence repeat (SSR)-anchored polymerase chain reaction amplification. Genomics, 20(2), 176-183.