genetic diversity and nutritional content of sorghum ... 160315.pdf · balance of farmer selection...
TRANSCRIPT

Genetic Diversity and Nutritional Content of Sorghum [Sorghum bicolor
(L.) Moench] Accessions from Southern Africa
Tiny Mpho Motlhaodi Faculty of Landscape Architecture, Horticulture and Crop Production Science
Department of Plant Breeding
Alnarp
Doctoral Thesis
Swedish University of Agricultural Sciences
Alnarp 2016

Acta Universitatis Agriculturae Sueciae
2016:2
ISSN 1652-6880
ISBN (print version) 978-91-576-8506-3
ISBN (electronic version) 978-91-576-8507-0
© 2015 Tiny Motlhaodi, Alnarp
Print: SLU Service/Repro, Alnarp 2016
Cover: An impression of sorghum grain diversity in Southern Africa
(photo: Ann-Sofie Fält)

Genetic Diversity and Nutritional Content of Sorghum [Sorghum bicolor (L.) Moench] Accessions from Southern Africa.
Abstract
Sorghum [Sorghum bicolor (L.) Moench] is an important cereal crop in semi-
arid regions of the world especially in Africa, South Asia and China. It is an
important food and fodder crop in the semi-arid tropics (SAT) of Africa, where
it is used for making different kinds of food. In Southern Africa, it serves as a
principal source of energy, protein, vitamins and mineral nutrients for the people
in the region. The aim of this study was to characterise sorghum landrace
accessions from Southern Africa in order to generate information that could help
design appropriate breeding and conservation strategies in the region. Both agro-
morphological and DNA markers were used to study the genetic diversity of
accessions from five countries in the region. Nutritional diversity in terms of
protein and mineral contents was also characterised.
A significant level of genetic variation was observed among 30 sorghum
accessions from different agro-ecological regions in Botswana (70% among
accessions and 30% within accessions), when genetic diversity was assessed
using microsatellite (SSR) markers. The analysis of genetic diversity in 22
sorghum accessions from five countries (Botswana, Namibia, Swaziland,
Zambia and Zimbabwe) of Southern Africa, revealed a significant variation in
both agro-morphological traits and SSR markers. There were significant
differences for protein and mineral content among 23 sorghum accessions from
Southern Africa in terms of nutritional composition (protein and minerals). The
patterns of genetic diversity and relationships observed in this research provide
insights for genetic resource conservation and utilization of sorghum germplasm
in Southern African. The protein and mineral content variation found among the
sorghum accessions could also be exploited in sorghum improvement programs
in the region.
Keywords: accessions, breeding, diversity, microsatellites, morphology,
nutrition, sorghum
Author’s address: Tiny Motlhaodi, SLU, Department of Plant Breeding,
P.O. Box 101, 230 53 Alnarp, Sweden
E-mail: [email protected] or [email protected]

Dedication
To my children: Bakang, Thuto and Thebe Moses Jr.
Jesus Christ is the same yesterday, today and forever. Hebrews 13:8

Contents
List of Publications 7
Abbreviations 9
1 Introduction 11 1.1 Taxonomy of the genus Sorghum 11 1.2 Agro-ecology of sorghum 12 1.3 Sorghum cultivation and utilization 13 1.4 Nutritional status of sorghum 15 1.5 World sorghum production 15 1.6 Breeding and conservation of sorghum 16 1.7 Genetic diversity and characterization 17
2 Aim and objectives 21
3 Materials and methods 23 3.1 Plant material 23 3.2 Field experiments 23 3.3 Agro-morphological characterization 23 3.4 Nutritional analysis 24
3.4.1 Protein content determination 24 3.4.2 Mineral content determination 24
3.5 DNA extraction 24 3.6 SSR PCR reaction 25 3.7 Data scoring and analysis 25
3.7.1 Genetic diversity analysis 25 3.7.2 Agro-morphological data analysis 26 3.7.3 Mineral nutrient and protein content analyses 26
4 Summary of results and discussions 27 4.1 Molecular genetic diversity in Sorghum bicolor (L.) Moench accessions
(Papers I & II) 27 4.2 Genetic structure and relationships among sorghum accessions 27 4.3 Agro-morphological diversity in sorghum accessions 31
4.3.1 Qualitative characters 32 4.3.2 Quantitative characters 32
4.4 Nutritional content variation in accessions 34

4.4.1 Nutrient variation in sorghum accessions 34 4.4.2 Correlation among nutrients 34 4.4.3 Genotype x environment (G×E) interaction and heritability 35
5 Conclusions and future prospects 37 5.1 Conclusions 37 5.2 Future prospects 37
References 39
Acknowledgements 46

7
List of Publications
This thesis is based on the work contained in the following papers, referred to
by Roman numerals in the text:
I Tiny Motlhaodi, Mulatu Geleta, Stephen Chite, Moneim Fatih, Rodomiro
Ortiz, Tomas Bryngelsson (2014). Genetic diversity in ex-situ conserved
sorghum accessions of Botswana as estimated by microsatellite markers.
Australian Journal of Crop Science 8, 35-43.
II Tiny Motlhaodi, Mulatu Geleta, Stephen Chite, Moneim Fatih, Rodomiro
Ortiz, Tomas Bryngelsson (2015). Genetic diversity in sorghum germplasm
from Southern Africa as revealed by microsatellite markers and agro-
morphological traits (in press).
III Tiny Motlhaodi, Tomas Bryngelsson, Stephen Chite, Moneim Fatih,
Rodomiro Ortiz, Mulatu Geleta (2015). Nutritional diversity in sorghum
accessions from Southern Africa as revealed by protein content and mineral
composition (submitted).

8
The contribution of Tiny Motlhaodi to the papers included in this thesis was as
follows:
I Planned, carried out all experimental work, analysed data and wrote the
manuscript in cooperation with co-authors
II Planned, sourced germplasm, carried out field and laboratory experimental
work, analysed data and wrote the manuscript in cooperation with co-
authors
III Planned, carried out field experiments, evaluated and analysed data, wrote
manuscript in cooperation with co-authors

9
Abbreviations
DNA
dNTP
EDTA
NARS
NPGRCs
PCA
PCoA
PCR
SADC
SPGRC
SSR
UPGMA
Deoxyribonucleic acid
Deoxynucleotide triphosphates
Ethylenediaminetetraacetic acid
National Agricultural Research Systems
National Plant Genetic Resources Centres
Principal component analysis
Principal coordinate analysis
Polymerase chain reaction
Southern African Development Community
SADC Plant Genetic Resources Centre
Simple sequence repeats
Unweighted pair group method with arithmetic mean

10

11
1 Introduction
Sorghum (Sorghum bicolor (L.) Moench) belongs to the genus Sorghum, tribe
Andropogoneae, of the Poaceae family (Clayton & Renvoize, 1986). The species
S. bicolor includes all cultivated sorghums as well as a group of semi wild and
wild plants regarded as weeds (Mutegi et al., 2011). Based on the morphological
features of the inflorescence, grain and glumes, cultivated sorghum has been
classified into five races: bicolor, caudatum, durra, guinea and kafir (Harlan &
De Wet, 1972). Very high levels of diversity exist among and within the races
(House, 1985).
The diversity in sorghum ensued mainly by practicing disruptive selection
and isolation, recombination in the extremely varied habitats and movement of
people carrying one or more cultivars of the species (Doggett et al., 1970). A
balance of farmer selection for cultivated traits and natural selection for wild
characteristics has generated improved sorghum types, wild types and
intermediate types (Doggett et al., 1970). Sorghum is predominantly self-
pollinating, with only 6% of the plants outcrossing. Hybrids are produced using
a cytoplasmic male sterility system that prevents selfing (House, 1985).
1.1 Taxonomy of the genus Sorghum
Sorghum taxonomy has been variously described since Linnaeus’s first
description in 1753. Snowdon followed in 1936 (Snowden, 1936), whose work
was tremendous and remains useful to scientists today, and then De Wet in 1970
also described the various groups of sorghum as well as their distribution.
Presently, 25 species of sorghum are recognized, and these are classified into
five sections: Stiposorghum, Parasorghum, Eu-sorghum, Heterosorghum and
Chaetosorghum. Under the section Eu-sorghum, three species are recognized: S.
halepense (L.) Pers. occurring in India, S. propinquum (Kunth) Hitchc found in
Southeast Asia and S. bicolor (L.) Moench, which originated in Africa (De Wet,
1978). S. bicolor (L.) Moench (2n=20), includes all annual and domesticated
types found in Africa, India and Asia.
S. bicolor is divided into five basic races: bicolor, guinea, caudatum, kafir
and durra as illustrated in figure 1. Harlan and De Wet (1972) described the races
based on the morphological features of the inflorescence, grain and glumes. The

12
race bicolor has its grain elongated, with glumes clasping the grain, which may
be completely covered or exposed. This race is mostly grown west of the Rift
valley and also on a minor scale almost everywhere in Africa. Guinea is
primarily West African with a secondary centre in Malawi and Tanzania. The
grain is flattened dorso-ventrally, twisting at maturity 90 degrees between
glumes that are nearly as long as or longer than the grain.
The caudatum grain is asymmetrical, with glumes half the length of the grain
or less. This race is most abundant in east Nigeria, Sudan and Uganda. Kafir is
mostly a race of east and Southern Africa. It has symmetrical grain, with glumes
of variable length clasping the grain. Durra is dominant in Ethiopia and
westward across the continent, covering the driest parts near the Sahara. Its grain
is rounded and the glumes are very wide (House, 1985).
Figure 1. Morphological diversity in the sorghum accessions studied, illustrating the five sorghum
races: A-Guinea; B-Caudatum; C-Durra; D-Kafir; E-Bicolor. (Photo: T. Motlhaodi)
1.2 Agro-ecology of sorghum
Sorghum is a short day plant but a wide genetic variation exists for its adaptation
to a wide range of photoperiod and temperature conditions (Craufurd et al.,
1999). It requires a deep, well-drained fertile soil, fairly stable rainfall and a
warm, frost-free period to grow well. A wide range of soil conditions can be
tolerated, but growth on sandy soils is usually poor, unless heavy textured
subsoil is present. A pH of between 5.5 and 8.5 is acceptable. Sorghum tolerates
water logging better than maize.
Sorghum is a warm season crop, requiring high temperature for good
germination and growth. Temperature ranges for germination are 7 to 10°C, but
if there is sufficient moisture, germination occurs well at a soil temperature of
15°C or higher. After germination, temperatures of 27 to 30°C are required for
optimum growth development. A temperature of as low as 21°C can however
A B C D E

13
have a dramatic effect on growth and yield (Vanderlip & Reeves, 1972). If
temperatures are exceptionally high, grain yields can be reduced. Temperatures
below zero can result in death of the plants, especially if plants are older than 3
weeks. Sorghum is mainly a rainfed crop of lowland, semi-arid areas of the
tropics (Craufurd et al., 1999). It requires an annual rainfall of 400 to800 mm,
which should be well distributed over the cropping season (Ng'uni et al., 2011).
1.3 Sorghum cultivation and utilization
Sorghum is usually cultivated as a field crop and has been, for centuries, one of
the most important staple foods for millions of people in the semiarid tropics of
Africa and Asia (Ali et al., 2011). In most of these areas, sorghum remains the
principal source of energy, proteins, vitamins and minerals. Presently, it is a
staple food for more than 500 million people in more than 30 countries (Kumar
et al., 2011). This is probably because it can be cultivated in harsh environments
where other crops such as maize and wheat cannot grow (Ali et al., 2009).
Cultivation in these areas is usually done without the application of fertilizers or
other inputs (FAO, 1995). Sorghum can also tolerate cultivation on a wide range
of soils and grows well on heavy vertisols commonly found in the tropics, where
its tolerance to waterlogging is often required (Paterson et al., 2009). It is equally
suited to light sandy soils found in the dry areas. It can therefore produce grain
on soils where many other crops would fail (FAO, 1995).
Sorghum has several uses. It is used for food, fodder and alcoholic beverages.
Its stalks can also be used for fencing, firewood or for making brooms. The fibres
can be used commercially to make wallboards and biodegradable packaging
material (Delserone, 2007) and even solvents or dye can be extracted from the
plant. A more recent use is as a source of ethanol and by-products from the
ethanol production are also finding a place in the market (Delserone, 2007).
Variation in grain colour, shape and size as well as stalk thickness juiciness,
sugar content and colour often influence the use of the crop. The white, large
grains with corneous endosperm are usually preferred for human consumption.
Nutritive value is increased if the endosperm is yellow with carotene and
xanthophyll (Ng'uni et al., 2012). The red varieties are preferred for making
beer, especially in Africa where this sorghum-derived drink is very popular
during traditional celebrations. The tall sweet varieties are usually used to make
silage and hay for livestock feed. Those with succulent, sweet stalks and small
heads and grains are preferred for chewing as with sugar cane. The white grained

14
varieties are usually soft and vulnerable to attack by birds during the dough stage
of maturity, while the darker varieties are not (Ng'uni et al., 2012).
Sorghum is used for human nutrition all over the world (Carter et al., 1989).
More than half of all sorghum produced in the world is used for human
consumption. For subsistence farmers in arid, less developed regions of the
world such as Africa, Central America and South Asia, it is the major food crop.
The grain is used to make flour, porridge, couscous and molasses food
supplement. In many parts of Africa, sorghum is used for making porridge, flat
breads or the grains can be cooked as whole decorticated grain, more like rice.
The nutritive value of sorghum based food is usually enhanced through its
combination with locally grown edible oil crops such as sunflower, sesame and
nigerseed in countries such as Ethiopia (Geleta et al., 2002).
In the southern United States, sorghum syrup is used as a sweet condiment
(like maple syrup) usually for biscuits, corn bread, pancakes, hot cereals or
baked beans (Delserone, 2007). As an Arab cuisine, the milled grain is often
cooked to make couscous, porridges, soups and cakes. In Central America,
sorghum flour is sometimes used to make tortillas and especially in El Salvador
where there is a shortage of corn. Sorghum can also be popped in the same
manner as popcorn, although the popped kernels are smaller than popcorn.
Sorghum has come into increasing use for homemade and commercial breads
and cereals for gluten-free diets since 2000 (Delserone, 2007)
Sorghum can also be used for making alcoholic beverages. In China it is the
most important ingredient for the production of distilled beverages such as
maotai and kaoliang. In the United States sorghum can also be used as a main
ingredient in production of gluten-free beer. This particular beer is aimed at
those with celiac disease and its low carbohydrate content makes it popular
among health-minded drinkers. African sorghum beer is a brownish pink
beverage with a fruity, sour taste. The beer is not filtered so its appearance is
cloudy and yeasty, and may contain bits of grain. This beer is a popular drink in
Africa for traditional reasons (Van der Walt, 1956).
Sorghum is also considered to be a significant crop for animal feeds. Plants
in the field can be used as pasture after harvesting the grain, where cattle and
sheep can graze (Carter et al., 1989). In most African countries this is a common
practice and sometimes the stover can be cut and fed to livestock. Sorghum straw
(stem fibre) can be made into very good wallboard for building houses. It can
also be used to make biodegradable packaging; this kind of packaging does not
accumulate static electricity so it is being used for packaging sensitive electronic
equipment. In some countries the stems can be used for fencing, sweeping broom
and for cooking fuel. For industrial purpose it is used for making ethanol and
dye can be extracted from the plant to colour leather (Delserone, 2007). Sorghum

15
is also an important component in poultry feed and good progress has been made
in the manufacturing of dog food, as well as pigeon and ostrich food (Delserone,
2007).
1.4 Nutritional status of sorghum
Sorghum is a principal source of energy, proteins, vitamins and minerals for
people in the semi-arid tropics (Duodu et al., 2003). It is a good energy source
because it is about 70% starch. Proteins are the main constituents of sorghum
after starch, making up to 12% dry weight of sorghum grain (Ng'uni et al., 2012).
The essential amino acid profile of sorghum protein differs (3-12% range)
between varieties, soil and growing conditions (FAO, 1995). The digestibility of
sorghum protein has also been found to vary between varieties, ranging from 30
to 70%. Sorghum’s nutritional profile includes several minerals, though
unevenly distributed and more concentrated in the germ and seed coat. Sorghum
is a good source of the β-complex vitamins and some varieties contain B-
carotene which can be converted to vitamin A by the human body. Some fat-
soluble vitamins like D, E and K have also been detected, though not in sufficient
amount (FAO, 1995).
1.5 World sorghum production
Cultivated sorghum is grown on about 42 million ha worldwide with an average
production of 54 million t annually. About 90% of world sorghum is grown in
developing countries, where it is a dietary staple food for more than 500 million
people. It is estimated that 80% of the crop is produced by subsistence farmers,
who often use local landraces that provide low but stable yields under marginal
conditions; therefore it plays a vital role for farmers in dry areas where little else
can grow (FAO, 2013). The five largest producers of sorghum in the world are
the United States, India, Nigeria, Sudan and Ethiopia. USA usually leads total
sorghum production and trade-off the crop due to very high yields, but India
leads on acreage (FAO, 2013).
World sorghum production and area under cultivation have recorded mixed
trends over the last five decades. Production expanded from 40 million tons at
the beginning of the 1960s to 76 million t in the mid-1980s. However, by 1990
it had fallen to 58 million t. In Africa, production generally increased from 15
million t in the 1960s to 22 million t in 2010 (Fig. 2). The area under production
worldwide also declined slightly during this period. The reduction in production
was largely due to a decline in sorghum production in the USA and China.

16
Figure 2. Sorghum production trend over the past five decades (FAO, 2013)
Production increased and in 2007/2008 it stood at 64.5 million tons
worldwide. This increase could have been due to the increase in production area
in countries like Brazil, Mali, Mexico, Niger, Sudan and Tanzania at the end of
the 20th century (FAO, 2013).
In sub-Saharan Africa, the production data on sorghum can be considered as
only the best estimates that are available as production data from small
subsistence farms are difficult to obtain for countries. In many of the developing
countries throughout the semi-arid tropics, inadequate infrastructure and lack of
skilled manpower have contributed to the lack of information (FAO, 2013).
1.6 Breeding and conservation of sorghum
Breeding efforts on sorghum are largely conducted at the International Crops
Research Institute for the Semi-Arid Tropics (ICRISAT, Patancheru, India) and
have been going on since this Institute was established in 1972. These efforts
have been necessary because sorghum is threatened by both biotic and abiotic
productivity-limiting constraints sorghum growing regions (Reddy et al., 2004).
The main aim of the breeding programs at ICRISAT has therefore been to
improve the productivity of the crop. From the 1980s to the 2000s, there was a

17
gradual shift in their breeding strategy from initial wide adaptability to specific
adaptations and trait-based breeding for threshold traits (Reddy et al., 2004).
In Southern Africa, ICRISAT, together with regional governments
established a Sorghum and Millet Improvement Programme (SMIP) in the early
1980s. Through this regional effort, enhanced germplasm was acquired from
different sources and these were used with local collections to form the
foundation of national breeding programmes (Chisi, 2010). Important breeding
objectives for sorghum in the region have been towards increasing productivity
of the crop and host plant resistance to pathogens and pests, and lately grain
quality and drought adaptation (Chisi, 2010).
Breeding efforts are generally limited in Southern Africa (Mujaju, 2009), and
sorghum is not an exception. Several sorghum cultivars have, however, been
developed by local farmers throughout the region by systematic and gradual
selection in their fields, both temporally and spatially. Some improved varieties
have also been developed by breeders in the region, mostly by National
Agricultural Research Systems (NARS) of different countries. The various
NARS have directed their breeding research priorities towards increasing grain
yield, excluding genetically low yielding landraces, developing resistant
varieties to drought, the parasitic weed Striga, other pathogens and pests.
1.7 Genetic diversity and characterization
Genetic diversity within cultivated plant species is precious genetic resources
that allows an increase in crop productivity and product quality as well as the
development of varieties resistant to pests and pathogens (Geleta & Ortiz, 2013).
Characterization of plant species using agro-morphological markers is the
classical way of assessing genetic diversity for its use in plant breeding (Mujaju,
2011), especially in Southern Africa where resources for molecular
characterization are limited. Doggett (1988) assets that in most crops, analyses
of morphological traits that inherit according to Mendelian genetic principles
were the earliest methods for estimating genetic diversity. The synthesis and
categorization of morphological data into presumably genetic similarity groups
is most useful when none is known about the population structure in a collection
(Marshall & Brown, 1975). Different studies have been done in which
phenotypic diversity index of morphological traits was used to measure genetic
relationships in sorghum (Bucheyeki et al., 2009; Habindavyi, 2009; Geleta et
al., 2005; Abdi et al., 2002; Ayana & Bekele, 1999).
Characterization based only on morphological markers is usually not
adequate to evaluate genetic diversity of plant genetic resources. This is because
18
they are highly influenced by environmental conditions, and different genes may
contribute towards the expression of one morphological trait. Therefore, there is
a need to complement them with molecular markers.
Molecular markers are basically nucleotide sequences corresponding to a
physical position in a genome, and their polymorphisms between accessions
allow the pattern of inheritance to be easily traced (Schulman, 2007). Their use
for the genetic analysis and manipulation of important agronomic traits has
become an increasingly useful tool in crop improvement and understanding of
genetically complex quantitative traits. The availability of these markers for
genetic diversity assessment is a quick way that breeders can use to select
suitable genotypes for breeding (Lekgari & Dweikat, 2014). They have the
potential to enhance the efficiency of plant breeding programs through a number
of ways; DNA fingerprinting of elite genetic stocks, assessment of genetic
diversity, increasing the efficiency of selection for difficult traits, and to make
environment-neutral selection possible are some of them (Patil et al., 2010).
PCR-based markers are widely used in fingerprinting because of their high level
of polymorphism (Warburton et al., 2008) as well as their ease of detection
(Sharon et al., 1997).
Molecular tools, especially those employing DNA markers, have proven to
be a robust and cost effective technology for the assessment of sorghum genetic
diversity (Ng'uni et al., 2011; Yang et al., 1996; Deu et al., 1994). Their use as
a tool to assess relatedness in cultivated and between cultivated and wild
sorghum have been successfully demonstrated (Ritter et al., 2007; Menz et al.,
2004; Tao et al., 1993).
Several types of molecular markers that are used for sorghum diversity
assessments became available, and they vary in their complexity, reliability, as
well as information generating capacity. The earliest DNA marker system,
known as Restriction Fragment Length Polymorphism (RFLP), proved to be
very useful, but their development and utilization is laborious, time consuming,
expensive and not suitable for high-throughput automation. For these reasons,
PCR-based markers such as Random Amplified Polymorphic DNA (RAPD),
Amplified Fragment Length Polymorphism (AFLP), Simple Sequence Repeats
(SSR), Sequence Tagged Sites (STS), Single Nucleotide Polymorphism (SNPs)
and their derivatives have become popular for molecular diversity research
(Billot et al., 2013). They provide useful information for breeders about genetic
relationships between individuals (Mujaju, 2009). For sorghum, there have been
a considerable number of studies designed to assess genetic diversity and
phylogenetic relationships among sorghum cultivars. This research have used
both isozyme and DNA based methods, for assessing cultivars from both
developing and developed countries (Ramu et al., 2013).

19
Out of the PCR based markers, simple sequence repeats (SSR) markers -also
called microsatellites- quickly became the DNA markers of choice for plant and
animal genomes because of the small quantity of genomic DNA required for
their analysis and their suitability for automation and high-throughput platforms
(Gutierrez et al., 2005; Hearne et al., 1992). SSRs are tandem repeats of di-, tri-
, tetra-, penta- or hexa- nucleotide units in the DNA of plants and animals. They
are abundantly distributed throughout the nuclear genomes of all studied plant
species, which make them useful both for genetic mapping and for diversity
studies (Ghebru et al., 2002).
To date, a good number of microsatellite markers have been developed for
sorghum that allows a very high rate of (and low cost) sorghum genotype
assessment (Djè et al., 2000; Smith et al., 2000; Dean et al., 1999). Several
sorghum diversity studies involving SSR markers alone (Mutegi et al., 2011;
Ng'uni et al., 2011; Thudi & Fakrudin, 2011; Ali et al., 2008; Casa et al., 2005;
Ghebru et al., 2002; Djè et al., 2000) or in combination with other markers
(Lekgari & Dweikat, 2014; Zhan et al., 2012; Geleta et al., 2006; Uptmoor et
al., 2003) have been undertaken. These studies have demonstrated that
substantial genetic diversity exists between and among accessions both in the
African gene banks as well as in the world sorghum collections, and that this
diversity requires attention in terms of germplasm conservation. Poor
correspondence between observed genetic structure and geographic origin is
prevalent in most of the studies done in Africa (Mutegi et al., 2011).
Lower genetic variation have been reported within than among accessions
from recent SSR-based research involving sorghum accessions from Somalia
(Manzelli et al., 2007), from Zambia (Ng'uni et al., 2011) and from Southern
Africa (Ng'uni et al., 2012). This observation is probably due to the
predominantly selfing nature of the sorghum. Breeding systems of plant species
are reported to have a significant impact on population variability with self-
pollinating species being the least diverse and exhibiting higher between
population than within population variation (Nybom & Bartish, 2000). The low
levels of genetic variation among self-pollinated plant species is attributed to
limited movement of genes through pollen, which also leads to greater
differentiation among populations (Hamrick, 1983).
Ng'uni et al. (2012) reported clustering of sorghum accessions according to
geographic origin of germplasm, when using SSR markers on sorghum
accessions from Malawi, Tanzania and Zambia. However, Uptmoor et al. (2003)
observed that accessions were not clustered according to their country of origin
when using a combination of RFLP, RAPD and SSR markers on sorghum
accessions from Botswana, Lesotho, South Africa, Zambia and Zimbabwe. Lack
of clustering pattern of sorghum populations according to region or country of

20
origin could be attributed to out-crossing and seed movement across regions
(Ayana et al., 2000).
The various SSR studies have also demonstrated that these markers are highly
polymorphic even among closely related sorghum cultivars, which demonstrates
that they are highly informative (Uptmoor et al., 2003).

21
2 Aim and objectives
The main aim of this thesis was to study the phenotypic and genotypic diversity
of sorghum [Sorghum bicolor (L.) Moench] accessions from Southern Africa.
The specific objectives were to:
1. Characterize genetic diversity among sorghum accessions from Southern
Africa based on morphological traits
2. Assess patterns of genetic diversity revealed by microsatellite markers in
order to identify genetic variation that is useful for sorghum genetic resources
conservation and utilization in Southern Africa
3. Evaluate genetic relationships of sorghum accessions from different agro-
ecological regions in Botswana
4. Determine the variation in protein and mineral contents among sorghum
landrace accessions from Southern Africa
5. Identify locally adapted sorghum landraces that have high nutrients content
for breeding and conservation programmes.

22

23
3 Materials and methods
3.1 Plant material
All sorghum germplasm used in this study were accessions provided by national
gene banks of five countries in the Southern African Development Community
(SADC) region.
Forty-seven Sorghum bicolor accessions were used for both the genetic
diversity and nutritional diversity studies. Of these, thirty accessions obtained
from the national gene bank of Botswana were used to analyse genetic diversity
of sorghum accessions from Botswana (paper I). Twenty-two sorghum
accessions from Botswana, Namibia, Swaziland, Zambia and Zimbabwe were
used for the agro-morphological and SSR-based genetic diversity study (Paper
II). Twenty-three accessions from Botswana, Namibia, Swaziland, Zambia and
Zimbabwe were used for protein and mineral nutrient content analysis (Paper
III).
3.2 Field experiments
The field experiment was conducted during the 2013-2014 growing season
(December to July) at the Department of Agricultural Research at two research
stations in Botswana, namely, Sebele (24°34'25"S and 25°58'00"E) and
Pandamatenga (18°16'00"S and 25°39'00"E). The average minimum/maximum
temperatures during the crop growing period at the two stations were 10/40°C
and 12/42 °C, respectively, with an annual total rainfall of 281 and 558 mm. The
soil types are sandy clay loam at Sebele and clay at Pandamatenga. The
experimental design was randomised complete block design with two replicates.
Each accession was planted in a separate plot, with rows of 5 m per accession.
The distances were 1m between plots, 0.5m between rows and 0.25m between
plants. No fertilizers were applied. Experimental measurement details are
described in papers II and III.
3.3 Agro-morphological characterization
Agro-morphological data for 16 traits (10 qualitative and 6 quantitative) were
recorded from 10 randomly chosen individual plants per accession in each
replicate, based on the International Board for Plant Genetic Resources sorghum
descriptors (ICRISAT, 1993). Ten qualitative traits recorded included waxy
bloom, leaf midrib colour, stalk juiciness, juice flavour, awns, inflorescence
compactness and shape, shattering, glume colour, grain covering and grain

24
colour. Quantitative characters recorded were plant height, days to flowering,
inflorescence length, inflorescence width, 100 seed weight and grain yield. All
agro-morphological traits used in the study are described in Paper II.
3.4 Nutritional analysis
3.4.1 Protein content determination
Sorghum kernels were ground to a fine powder with a Kinematica A10 Grinder
(Switzerland). Sorghum flour samples were then freeze dried to constant weight
and around 100 mg was weighed into tin capsules prior to total nitrogen analysis.
An aliquot was burnt in an elemental analyzer (Vario max CN analyzer from
Elementar) at 900°C. Passage of the produced gasses over special absorbent
columns eliminated CO2 and H2O. Nitrogen content was measured by passing
the remaining gasses through a column with a thermal conductivity detector at
the end. Glutamic acid (C5H9NO4; C: 40.81% N: 9.52%) was used as standard
reference. A protein factor of 6.25, equivalent to 0.16 g of nitrogen per gram of
protein, was used to estimate protein content in sorghum, as recommended by
Merril and Watt (1973).
3.4.2 Mineral content determination
Approximately 0.5 g of sorghum flour was packed in a Teflon capsule and placed
in a microwave oven (MARS 5 from CEM with a regulated pressure and
temperature, which were kept at 375 psi and 185°C, respectively). Each sample
was digested in 10 ml solution (7 ml of concentrated nitric acid and 3 ml of
water), which was then diluted with water up to 50 ml before analysis. The
samples were analysed for mineral content at the Instrumental Chemistry
Laboratory (Department of Biology, Lund University, Sweden) using
Inductively Coupled Plasma Atomic Emission Spectrometry (ICP-AES; Perkin-
Elmer, OPTIMA 8300). Atomic spectrometry standards from Perkin-Elmer,
SPEX, Accu Standard and Merck were used for this analysis. The mineral
content was recorded in microgram of mineral per gram of flour (µg/g).
3.5 DNA extraction
Seeds were planted in seedling trays and grown in the greenhouse at 25°C for
approximately 10 days. Leaves (approximately 6 cm in length) were sampled
into 2 ml Eppendorf tubes and frozen in liquid nitrogen, then freeze dried and
maintained on silica gel at -80°C (Paper I) until they were milled using a Retsch
MM400 shaker (Hann, Germany). For the second study (Paper II), leaf samples
25
for DNA analysis were collected from 10 plants grown in the field for
approximately 2 weeks. The samples were kept on silica gel in small plastic bags
to keep them dry until they were milled. DNA was separately extracted from
leaves of 12 individual plants per accession using a modified cetyl trimethyl
ammonium bromide (CTAB) protocol, as described in Bekele et al. (2007) for
the first and second study.
3.6 SSR PCR reaction
For the genetic diversity analyses of Botswana sorghum accessions (Paper I),
the screening of SSR primers for amplification, optimization of PCR conditions
and detection of polymorphism lead to the selection of ten SSR primer pairs.
Similarly, eleven primer pairs were selected for the diversity analysis of
sorghum accessions from Southern Africa (Paper II). The selected primers and
their amplification conditions were provided in Papers I and II.
The forward primers of each pair of selected primers were 5’-labeled with
either HEX, 6-FAM, VIC or NED fluorescent dyes. The reverse primers were
PIG-tailed with “GCTTCT” to avoid a non-template addition of a single
nucleotide by Taq DNA polymerase to the PCR product, as previously described
in Ballard et al. (2002). Reactions lacking DNA were included as negative
controls. PCR reactions were prepared in 96-well thin wall PCR plates and
amplifications were run in Gene Amp® PCR System 9700 (Applied Biosystems
Inc., USA) at conditions optimized for each pair of primers. The PCR programs
used are detailed in Papers I and II.
The PCR products were then multiplexed into panels. Different panels
contained PCR products from different loci. PCR products labelled with the
same fluorescent dye but multiplexed in the same panel had a size difference of
at least 100 base pairs to avoid overlapping. Multiplexed PCR products were
then analysed using ABI 3730 capillary DNA sequencer (Applied Biosystems)
at University of Copenhagen, Denmark. The size standard ROX 58-352 was
used as a molecular size marker.
3.7 Data scoring and analysis
3.7.1 Genetic diversity analysis
GeneMarker 2.4.0 (Softgenetics) was used for peak identification and fragment
sizing. Allelic data for a particular locus was recorded as fragment size at a co-
dominant locus and the genotype of each individual at each locus was recorded.
When a PCR product was not obtained, data for the specific loci and samples
were treated as missing values.

26
Genetic diversity parameters for each locus were estimated using POPGENE
version 1.31 (Yeh et al., 1999). Arlequin version 3.0 (Excoffier et al., 2005) was
used for the analysis of population genetic structure. For the analysis of
molecular variance (AMOVA), sorghum accessions were grouped according to
their ecological region, their race and the ethnicity of the local populations
inhabiting the sites where the accessions were originally collected. Sorghum
accessions were also grouped according to donor country. Cluster analysis and
bootstrapping were performed with the FreeTree Freeware program (Pavlicek et
al., 1999) based on Nei’s standard genetic distance (Nei & Li, 1979). TreeView
1.6.6 program (Page, 1996) was used to view the trees.
3.7.2 Agro-morphological data analysis
Analysis of variance (ANOVA) was performed on agro-morphological
quantitative data using Minitab (version 17.0) statistical package. Details of
analysis of both qualitative and quantitative data are provided in Paper II.
3.7.3 Mineral nutrient and protein content analyses
Minitab (version 17.0) was used for analysis of both protein and mineral
nutrients. The data was subjected to analysis of variance (ANOVA). Tukey’s
test was carried out for pairwise comparisons of means. Pearson’s correlation
test was carried out to assess the association between pairs of nutrients.
27
4 Summary of results and discussions
4.1 Molecular genetic diversity in Sorghum bicolor (L.) Moench accessions (Papers I & II)
Characterization of genetic diversity in crop germplasm is essential for rational
utilization and conservation of genetic resources (Geleta & Ortiz, 2013; Thudi
& Fakrudin, 2011). The 10 microsatellite markers used in the genetic diversity
study for Botswana sorghum accessions revealed significant genetic variation
among accessions, indicating the importance of microsatellites for
characterizing genetic diversity among closely related individuals (Ng'uni et al.,
2011; Uptmoor et al., 2003). Genetic diversity analysis within the 30 sorghum
accessions from Botswana revealed considerable amount of genetic diversity.
The ten microsatellite loci used in the study revealed a total of 53 alleles, with 7
of the 30 accessions having accession specific rare alleles. The total number of
alleles recorded in our study was lower than previously reported by other authors
(Thudi & Fakrudin, 2011; Deu et al., 2008; Folkertsma et al., 2005; Ghebru et
al., 2002). These studies, however, assessed a higher number of accessions from
different geographic areas. Comparable results to our study were obtained by
Ng'uni et al. (2011).
A total of 11 SSR loci were used in the analysis of genetic diversity of sorghum
accessions from five countries in Southern Africa. The loci were polymorphic
and among them revealed a total of 70 alleles across all accessions, with 2 to 15
alleles per locus. This result suggests that a high genetic diversity exists in
Southern African sorghum germplasm.
4.2 Genetic structure and relationships among sorghum accessions
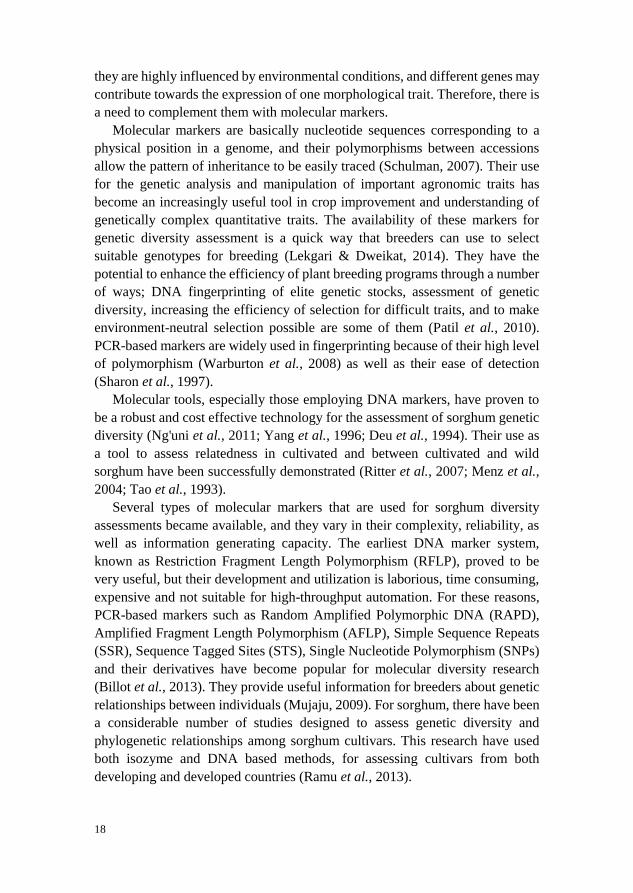
Analysis of molecular variance (AMOVA) of the SSR data for 30 sorghum
accessions from Botswana revealed significant differentiation among accessions
(P < 0.001; Table 1). Genetic differentiation among accessions accounted for
70% of the total variation while the within accession variation accounted for the
remaining 30%. AMOVA, however, revealed no significant variation among
groups of sorghum accessions grouped according to agro-ecological zones, or
ethnicity of the local populations of the collection sites of the accessions
(Bakwena, Bakgatla, Barolong, Bangwato, Batawana and Bakalaka) and when
the grouping was done according to races of the accessions (Bicolor, Durra,
Guinea, Kafir). AMOVA from microsatellite data for the sorghum accessions
from Southern Africa revealed significant differentiation among individual

28
plants, among accessions and among countries (P < 0.001; Table 1). Genetic
differentiation among accessions accounted for 66.9% of the total variation
while the within accession variation accounted for 23.6%. When accessions
were grouped according to donor country, variation among groups accounted for
9.5%, and the remaining 5% variation was observed between individual plants
within accessions.
The unweighted pair group method with arithmetic mean (UPGMA)-based
cluster analysis did not group the sorghum accessions from Botswana according
to racial classification, ethnicity or agro-ecological regions (Figure 3). A similar
observation was made by Djè et al. (2000). They found a scattering of accessions
belonging to the same race or geographical region when a matrix plot of
individual sorghum accessions based on RST distances. Several other studies
have reported weak differentiation among accessions according to geographic
region (Uptmoor et al., 2003; Ayana et al., 2000). This observation could be
attributed to the practice of seed exchange through traditional and commercial
seed systems.
Farmers usually exchange seeds in order to access new cultivars with
desirable traits. In Botswana, as also common in other sub-Saharan African
countries, farmers exchange traditional crops like sorghum following collective
socio-cultural and traditional activities that involve relationships between
friends and relatives (Deu et al., 2008). Ng'uni et al. (2011) however, reported
that cluster analysis on Zambian sorghum accessions grouped them according to
their geographic regions of origin, with 12.4% variation between regions. This
finding was similar to that reported by Ghebru et al. (2002) for a collection of
Eritrean and world sorghums, and this could be attributed to the fact that the
accessions were sampled from a wider geographic region.
A pattern of genetic relationships where accessions from the same geographic
region were genetically similar, as in Ng'uni et al. (2011), could be attributed to
the existence of seed exchange patterns of such landraces between relatives or
friends in the communities within that locality. A landrace, which constitute an
accession, is the outcome of a continuous and dynamic development process
involving maintenance and adaptation of germplasm to the environment and
specific local needs by a community. Farmers often exchange seeds of landraces
with other farmers within a locality (Ng'uni et al., 2011)
29
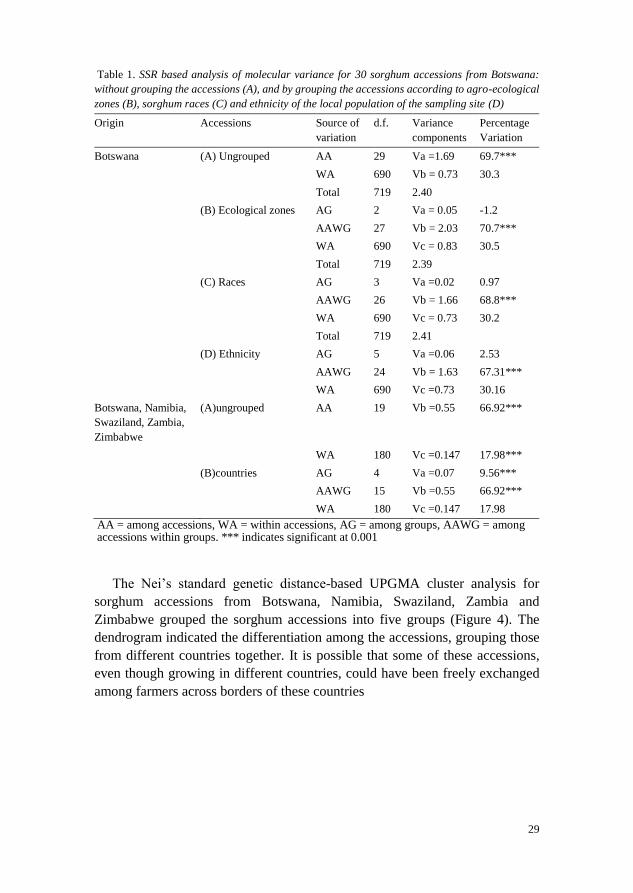
Table 1. SSR based analysis of molecular variance for 30 sorghum accessions from Botswana:
without grouping the accessions (A), and by grouping the accessions according to agro-ecological
zones (B), sorghum races (C) and ethnicity of the local population of the sampling site (D)
Origin Accessions Source of
variation d.f. Variance
components Percentage
Variation
Botswana (A) Ungrouped AA 29 Va =1.69 69.7*** WA 690 Vb = 0.73 30.3 Total 719 2.40 (B) Ecological zones AG 2 Va = 0.05 -1.2 AAWG 27 Vb = 2.03 70.7*** WA 690 Vc = 0.83 30.5 Total 719 2.39 (C) Races AG 3 Va =0.02 0.97 AAWG 26 Vb = 1.66 68.8*** WA 690 Vc = 0.73 30.2 Total 719 2.41 (D) Ethnicity AG 5 Va =0.06 2.53 AAWG 24 Vb = 1.63 67.31*** WA 690 Vc =0.73 30.16 Botswana, Namibia,
Swaziland, Zambia,
Zimbabwe
(A)ungrouped AA 19 Vb =0.55 66.92***
WA 180 Vc =0.147 17.98***
(B)countries AG 4 Va =0.07 9.56***
AAWG 15 Vb =0.55 66.92***
WA 180 Vc =0.147 17.98
AA = among accessions, WA = within accessions, AG = among groups, AAWG = among accessions within groups. *** indicates significant at 0.001
The Nei’s standard genetic distance-based UPGMA cluster analysis for
sorghum accessions from Botswana, Namibia, Swaziland, Zambia and
Zimbabwe grouped the sorghum accessions into five groups (Figure 4). The
dendrogram indicated the differentiation among the accessions, grouping those
from different countries together. It is possible that some of these accessions,
even though growing in different countries, could have been freely exchanged
among farmers across borders of these countries

30
Figure 3. UPGMA dendrogram showing the clustering pattern of 30 sorghum accessions from
Botswana based on Nei’s standard genetic distance. Bootsrap values generated from 1000
resampling in the FreeTree program are shown between branches

31
4.3 Agro-morphological diversity in sorghum accessions
The variation among the 22 sorghum accessions studied was demonstrated by
morphological traits. The high level of variation exhibited by both qualitative
and quantitative traits indicates the potential of these accessions for sorghum
breeding. The variation could be a valuable source for sorghum improvement
programs in the five countries and the SADC region at large. Other studies
Figure 4. SSR based UPGMA dendrogram generated using Nei’s standard genetic distance for
20 sorghum accessions. Bootsrap value generated from 1000 resampling using the FreeTree
program is shown for the first branch. Letters before accession numbers represent the
accession donor countries: B= Botswana, N= Namibia, S= Swaziland, ZMB= Zambia, ZIM=
Zimbabwe.
Figure 4.
100
V
IV
III
II
I

32
(Gerrano et al., 2014; Geleta et al., 2005) have also observed genetic variation
among sorghum germplasm that could be useful for improvement programs.
Traits such as 100 seed weight, inflorescence length and width, had positive
effects on grain yield hence can easily be selected together when planning
breeding programs.
4.3.1 Qualitative characters
A majority of the accessions (about 91%) had white leaf midrib colour and had
non-juicy stalks. Only two accessions, B2219 from Botswana and ZMB3947
from Zambia, exhibited juicy stalks and dull green leaf midrib colour. A few (3)
of the accessions were mostly bloomy, while the remaining 19 accessions had
only slightly present to medium waxy bloom. Significant variation (P < 0.05)
among accessions was noted for inflorescence compactness and shape.
Thirteen (59%) of the accessions had 75% grain covering, three accessions
had 25% grain covering, 2 had 50% covering, 3 had glumes longer than grain
and only one had its grains fully covered. Glume colour was skewed towards
sienna (10 accessions), followed by black (5), then white (3), red (2), mahogany
(1) and grey (1). Only five of the accessions had awns while the rest did not have
awns. Twenty of the 22 recorded very low to low shattering, one was
intermediate (B2273) and only one recorded high shattering (N406). Grain
colour was skewed, with red dominating (13), 7 were whione (ZIM1317) had
yellow grain and one (B2219) had buff coloured grain.
4.3.2 Quantitative characters
The ANOVA of the quantitative morphological traits revealed a significant
variation for 5 of the 6 traits. Days to flowering among accessions was
significantly different (P < 0.05). Accessions B2219, B2225 B2250, B2300 and
ZIM1704 were early maturing, while late accessions included N53, N218, N406,
ZIM1522, ZMB3947 and ZMB6986 were the latest.
Correlation coefficients of six pairs of the quantitative traits (Table 2) showed
a significant positive correlation between yield and inflorescence length (r =
0.611); inflorescence width (r = 0.897), and 100 seed weight (r = 0,620).
Correlation between inflorescence width and days to flowering was also
significant (r = 0.593). Significant negative correlation was recorded between
100 seed weight and plant height (r = -0.410) as well as 100 seed weight and
days to flowering (r = -0.430).

33
Table 2. Correlation coefficients of quantitative morphological traits used to characterize sorghum
accessions from Southern Africa.
Traits Height DTF Infl. length Infl. width 100SW Yield
Height 1.00 0.212 0.455* 0.164 -0.410* 0.334
DTF 1.00 -0.025 0.593* -0.430* 0.356
Infl. length 1.00 0.254 -0.336 0.115
Infl. width 1.00 -0.170 0.897**
100 SW 1.00 0.620*
Yield 1.00
** indicates correlation is significant at 0.01 while * is for correlation is significant at 0.05 level
Based on morphological traits, accession B2219 from Botswana was the most
distinct, and it grouped totally separately from the other accessions. This could
be due to its sweet and juicy stalk, as well as its buff coloured grain. This
accession is a non-grain or sweet type of sorghum belonging to the bicolor race
and in Southern Africa its stalk is normally used for chewing whereas the grain
is not palatable as food. It has been reported that bicolor types of sorghum have
more primitive morphological characters (Harlan & De Wet, 1972) and are
associated with a wide geographic distribution (Djè et al., 2000)..
Three accessions N53, N218, B2250 had similar phenotypic traits and had
the most compact and short inflorescence with curved peduncle typical of durra
type sorghums, with the grain covered up to 75% by the glumes. They also had
other phenotypic traits in common as they were among the few that had awns,
were least shattering, had red grains and were of short stature. In the molecular
analysis, these three accessions had three common alleles at three different loci,
which were not found in the other accessions. These durra types of sorghum are
not very common in Southern Africa and could have been introduced from other
African locations. Two accessions had morphological traits typical of guinea
types, 7 showed characteristics of caudatum and 7 displayed kafir type
characteristics. Caudatum, guinea and kafir type sorghums are the most common
in Southern Africa and evolved from other African sorghums (Doggett, 1988).
With microsatellite analysis, these had the least number of rare alleles when
compared to the other accessions. This is consistent with previous research
showing an absence of rare alleles in southern equatorial accessions (Deu et al.,
2006), with kafir sorghums displaying little genetic differentiation (Doggett,
1988) and being mostly restricted to Southern Africa (Djè et al., 2000).

34
4.4 Nutritional content variation in accessions
4.4.1 Nutrient variation in sorghum accessions
A significant variation was revealed among the sorghum accessions studied
for grain protein and mineral nutrient content. Genetic factors played a major
role for the variation between accessions, such as differences in the sorghum
accessions’ ability to absorb nutrients from the soil under prevailing
environmental conditions. The accessions could also have different levels of
requirements for these mineral elements, which could also be solely genetic.
Hence, genetic background of sorghum genotypes is a very important factor
determining nutrient contents. Appropriate cultivar choice for enhancing
nutrient composition in sorghum genotypes is possible considering the reported
variation.
Protein, Fe, Mg, Mn, Na and P were significantly different between the two
sites while Ca, K and Zn were not. This suggests that environmental factors may
have low effects the content for Ca, K and Zn. Hence, selection for breeding
material can be done on different sites. For those nutrients with significant
differences between sites, the effect of cultivation site should be considered
when selecting cultivars for breeding. However, additional data from various
sites (environments) should be analysed before a strong conclusion can be made
regarding the effect of environment on these nutrients.
The significant variation obtained for grain protein and mineral content
among accessions is encouraging for selecting potential accessions for genetic
improvement. It has been emphasized that sorghum parents with more diversity
among themselves are expected to exhibit a higher amount of heterotic
expression and a broad spectrum of variability in segregating generations
(Sabharwal et al., 1995). Fe content reported in this study was lower than those
reported by other authors (Ng'uni et al., 2012; Shegro et al., 2012; Kumar &
Kumar, 2009), probably because of the different laboratory methods used in the
different studies. However, protein and mineral nutrient content range reported
in this study was similar to those reported by FAO (1995). Mn and P contents
were similar to those obtained by Pontieri et al. (2014) and Shegro et al. (2012),
who however reported higher contents of Ca, K, Mg and Fe.
4.4.2 Correlation among nutrients
Pearson’s correlation coefficients among mineral elements and protein are
given in Table 3. A significant positive correlation was obtained between
different mineral nutrients. This has implications for the possibility to combine
selection for correlated nutrients in a single agronomic background. However, it

35
has to be determined whether breeding for high concentration of one nutrient
correlated to the other in such a manner increases the concentration of the other
and vice-versa. Similar to the present study, significant positive correlation
between Fe and Zn have previously been reported in sorghum (Ng'uni et al.,
2012; Shegro et al., 2012; Kayodé et al., 2006; Reddy et al., 2005), wheat (Velu
et al., 2011) and in rice (Zhang et al., 2004). Significant positive correlations
were also observed between Ca and K, Fe and Mn and P as well as between Mg
and P and P and Zn. Protein recorded a significant positive correlation with Mg
and P.
Table 3. Pearson’s correlation coefficients showing pair-wise association among eight mineral
elements and protein in sorghum accessions from five countries in Southern Africa.
Protein Ca Fe K Mg Mn Na P
Ca -0.092
Fe 0.200 0.085
K -0.028 0.799*** 0.129
Mg 0.440* 0.203 0.327 0.227
Mn -0.132 0.163 0.508** -0.101 0.682
Na -0.052 0.444* 0.278 0.255 0.160 -0.275
P 0.512** 0.226 0.473* 0.449* 0.857*** 0.640** 0.217
Zn 0.275 0115 0.673** 0.045 0.655** 0.585** 0.043 0.524**
***significant at P = 0.001; **0.01; * 0.05.
4.4.3 Genotype x environment (G×E) interaction and heritability
Ca, Fe K, Mg, Mn and P recorded high G×E, ranging between 20 and 29%.
Protein had the lowest G×E effect (2.6%). Na and Zn also recorded low values
for G×E at 18% each (Table 4).
Table 4. Relative variance explained by genotype (accession), environment (site), and genotype by
environment (G×E) interaction on nutrient content of 23 sorghum accessions from five countries
in Southern Africa.
Relative variance (%)
Source Protein Ca Fe K Mg Mn Na P Zn
Accession
(genotype, G)
54.2 57.5 50,4 61.8 57.1 25.4 25.4 59.5 63.0
Site (environment,
E)
1.9 0 14.9 0 9.8 37.8 10.1 11.0 1.0
G×E 2.6 20.1 21.5 25.1 21.2 28.9 17.7 24.9 17.9
Residual (Error) 17.7 21.4 12.0 9.0 10.2 7.7 41.8 4.4 16.6

36
Low G×E interaction and variation of genotypes for mineral nutrient
concentration in the sorghum grain suggest that breeding for enhanced
concentrations of the nutrients could be done across environments. The nutrient
contents did not vary much across locations, hence their concentrations in the
sorghum grains were stable. This was also reflected in quite high values for
broad-sense heritability of grain nutrients (Table 5).
Broad-sense heritability (H2) of the mineral elements and protein was
estimated from the analysis of variance following Nyquist and Baker (1991).
The formula used was H2 = VG/VP (Table 5).
Table 5. Variance components and broad sense heritability for protein and mineral nutrient content
in 23 sorghum accessions from Southern Africa.
Variance
component
Nutrients
Protein Ca Fe K Mg Mn Na P Zn
VG 1.79 3307 64.4 248193 50045 48.7 20.3 308650 45
VGE 0.86 1157 27.4 100837 18551 55.5 14.2 129247 12.8
VR 0.29 616.8 7.7 18041 4460 7.4 16.7 11501 6.3
VP 2.3 4039 80 303122 60435 78.2 31.6 376148 53
VGE/VG 0.48 0.35 0.43 0.41 0.37 1.14 0.70 0.42 0.28
H2 0.78 0.82 0.80 0.82 0.83 0.62 0.64 0.82 0.85
H2 = broad sense heritability, VG = genotypic variance, VGE = genotype x
environment variance, VR = residual variance, VP = phenotypic variance
The ratio between the G×E variance components to the genotypic variance
component gives an insight about the magnitude of the genotype-environment
interaction (Gomez-Becerra et al., 2010; Peterson et al., 1986). In this study, low
G×E interaction and low VGE/VG ratios indicate that there are no specific
adaptation patterns for the accessions studied, so when breeding for higher
nutrient content of these minerals in sorghum, any of the locations may be used
for cultivation.
37
5 Conclusions and future prospects
5.1 Conclusions
Southern African sorghums contain significant and valuable genetic diversity as
indicated by the observed number of alleles and the presence of rare and unique
alleles in most of the accessions.
The pattern of genetic diversity revealed with both agro-morphological
markers and microsatellites in Southern African sorghums may offer new
opportunities to relate that diversity to the diversity structure for important
agronomic traits such as grain nutrient quality and mineral content
characteristics.
The patterns of genetic relationships observed in this study should provide
more detailed insights for genetic resource conservation and utilization of
sorghum germplasm in the SADC region.
The sorghum accessions from Botswana, Namibia, Swaziland, Zambia and
Zimbabwe exhibited significant variation in grain protein, calcium, iron,
magnesium, potassium and zinc contents. These results suggest that there is
considerable variability for essential nutrients in the sorghum landrace
accessions.
Correlation analysis of protein and mineral nutrients has indicated that it is
possible for simultaneous improvement of different nutrient, assuming there is
no penalty in the agronomic traits when combined with these minerals.
The study on nutritional contents variation has shown that identification of
sorghum germplasm for breeding for improvement of mineral nutrients and
protein is promising.
The observed low G×E interaction in this study indicate that there are no
specific adaptation patterns for the accessions studied, so when breeding for
higher nutrient contents, different sites can be used for cultivation.
5.2 Future prospects
Since the accessions studied actually constitute farmers’ varieties, those that
exhibited good levels of genetic diversity should be given priority in
conservation strategies.
Some of the SSR loci used in this study may be significantly linked to
important agronomic traits, so further characterization at both phenotypic and
molecular levels is crucial. Quantitative trait loci (QTL) mapping that explain

38
the variation in the traits considered in the present study can contribute to more
effective sorghum breeding and improvement.
In sorghum breeding, it is necessary to identify germplasm that breeders can
use to improve not only yield, but essential nutrients needed for human nutrition.
This is necessary to overcome malnutrition existing in world rural populations.
Accessions exhibiting a relatively high nutrient content in this study could be
used to improve farmers’ varieties with preferred agronomic traits such as early
maturity, grain colour and yield.

39
References
Abdi, A., Bekele, E., Asfaw, Z. & Teshome, A. (2002). Patterns of morphological
variation of sorghum (Sorghum bicolor (L.) Moench) landraces in
qualitative characters in North Shewa and South Welo, Ethiopia. Hereditas,
137(3), pp. 161-172.
Ali, M., Jabran, K., Awan, S., Abbas, A., Ehsanullah, Zulkiffal, M., Acet, T., Farooq,
J. & Rehman, A. (2011). Morpho-physiological diversity and its
implications for improving drought tolerance in grain sorghum at different
growth stages. Australian Journal of Crop Science, 5(3), pp. 311-320.
Ali, M.A., Shahid, N., Amjad, A., Waseem, S. & Khawar, J. (2009). Genetic
diversity and assessment of drought tolerant sorghum landraces based on
morph-physiological traits at different growth stages. Plant Omics, 2(5),
pp. 214-227.
Ali, M.L., Rajewski, J.F., Baenziger, P.S., Gill, K.S., Eskridge, K.M. & Dweikat, I.
(2008). Assessment of genetic diversity and relationship among a collection
of US sweet sorghum germplasm by SSR markers. Molecular Breeding,
21(4), pp. 497-509.
Ayana, A. & Bekele, E. (1999). Multivariate analysis of morphological variation in
sorghum (Sorghum bicolor (L.) Moench) germplasm from Ethiopia and
Eritrea. Genetic Resources and Crop Evolution, 46(3), pp. 273-284.
Ayana, A., Bryngelsson, T. & Bekele, E. (2000). Genetic variation of Ethiopian and
Eritrean sorghum (Sorghum bicolor (L.) Moench) germplasm assessed by
random amplified polymorphic DNA (RAPD). Genetic Resources and
Crop Evolution, 47(5), pp. 471-482.
Ballard, L., Adams, P., Bao, Y., Bartley, D., Bintzler, D., Kasch, L., Petukhova, L.
& Rosato, C. (2002). Strategies for genotyping: effectiveness of tailing
primers to increase accuracy in short tandem repeat determinations. Journal
of biomolecular techniques: JBT, 13(1), p. 20.
Bekele, E., Geleta, M., Dagne, K., Jones, A.L., Barnes, I., Bradman, N. & Thomas,
M.G. (2007). Molecular phylogeny of genus Guizotia (Asteraceae) using
DNA sequences derived from ITS. Genetic Resources and Crop Evolution,
54(7), pp. 1419-1427.
Billot, C., Ramu, P., Bouchet, S., Chantereau, J., Deu, M., Gardes, L., Noyer, J.-L.,
Rami, J.-F., Rivallan, R., Li, Y., Lu, P., Wang, T., Folkertsma, R.T.,
Arnaud, E., Upadhyaya, H.D., Glaszmann, J.-C. & Hash, C.T. (2013).
Massive Sorghum Collection Genotyped with SSR Markers to Enhance
Use of Global Genetic Resources. PLoS ONE, 8(4), p. e59714.
Bucheyeki, T.L., Gwanama, C., Mgonja, M., Chisi, M., Folkertsma, R. & Mutegi,
R. (2009). Genetic variability characterisation of Tanzania sorghum
landraces based on simple sequence repeats (SSRs) molecular and
morphological markers. African Crop Science Journal, 17(2).
Carter, P., Hicks, D., Oplinger, E., Doll, J., Bundy, L., Schuler, R. & Holmes, B.
(1989). Grain sorghum (milo). Alternative field crops Manual. United

40
States of America: Purdue University, Centre for New Crops and Plant
Products.
Casa, A., Mitchell, S., Hamblin, M., Sun, H., Bowers, J., Paterson, A., Aquadro, C.
& Kresovich, S. (2005). Diversity and selection in sorghum: simultaneous
analyses using simple sequence repeats. Theoretical and Applied Genetics,
111(1), pp. 23-30.
Chisi, M. (2010). Sorghum Breeding Programme. United States Of America:
University of Nebraska Lincoln.
Clayton, W.D. & Renvoize, S.A. (1986). Genera graminum. Grasses of the World.
Kew bulletin additional series, 13.
Craufurd, P., Mahalakshmi, V., Bidinger, F., Mukuru, S., Chantereau, J., Omanga,
P., Qi, A., Roberts, E., Ellis, R. & Summerfield, R. (1999). Adaptation of
sorghum: characterisation of genotypic flowering responses to temperature
and photoperiod. Theoretical and Applied Genetics, 99(5), pp. 900-911.
De Wet, J. (1978). Systematics and evolution of Sorghum sect. Sorghum
(Gramineae). American Journal of Botany, pp. 477-484.
Dean, R., Dahlberg, J., Hopkins, M., Mitchell, S. & Kresovich, S. (1999). Genetic
redundancy and diversity among ‘Orange’accessions in the US national
sorghum collection as assessed with simple sequence repeat (SSR) markers.
Crop science, 39(4), pp. 1215-1221.
Delserone, L.M. (2007). Sorghum. Journal of Agricultural & Food Information,
8(1), pp. 9-14.
Deu, M., Gonzalez-de-Leon, D., Glaszmann, J.-C., Degremont, I., Chantereau, J.,
Lanaud, C. & Hamon, P. (1994). RFLP diversity in cultivated sorghum in
relation to racial differentiation. Theoretical and Applied Genetics, 88(6-
7), pp. 838-844.
Deu, M., Rattunde, F. & Chantereau, J. (2006). A global view of genetic diversity in
cultivated sorghums using a core collection. Genome, 49(2), pp. 168-180.
Deu, M., Sagnard, F., Chantereau, J., Calatayud, C., Hérault, D., Mariac, C., Pham,
J.L., Vigouroux, Y., Kapran, I., Traore, P.S., Mamadou, A., Gerard, B.,
Ndjeunga, J. & Bezançon, G. (2008). Niger-wide assessment of in situ
sorghum genetic diversity with microsatellite markers. Theoretical and
Applied Genetics, 116(7), pp. 903-913.
Djè, Y., Heuertz, M., Lefebvre, C. & Vekemans, X. (2000). Assessment of genetic
diversity within and among germplasm accessions in cultivated sorghum
using microsatellite markers. Theoretical and Applied Genetics, 100(6), pp.
918-925.
Doggett, H. (1988). Sorghum. 2nd. ed. London, UK: Longman Scientific and
Technical.
Doggett, H., Starks, K. & Eberhart, S. (1970). Breeding for resistance to the sorghum
shoot fly. Crop science, 10(5), pp. 528-531.
Duodu, K., Taylor, J., Belton, P. & Hamaker, B. (2003). Factors affecting sorghum
protein digestibility. Journal of Cereal Science, 38(2), pp. 117-131.
Excoffier, L., Laval, G. & Schneider, S. (2005). Arlequin (version 3.0): an integrated
software package for population genetics data analysis. Evolutionary
bioinformatics online, 1, p. 47.
41
FAO (1995). Sorghum and millets in human nutrition. FAO Food and Nutrition
Series. pp. 16-19.
FAO (2013). Food and agriculture organization of the United Nations[2015-11-26].
Folkertsma, R.T., Rattunde, H.F., Chandra, S., Raju, G.S. & Hash, C.T. (2005). The
pattern of genetic diversity of Guinea-race Sorghum bicolor (L.) Moench
landraces as revealed with SSR markers. Theoretical and Applied Genetics,
111(3), pp. 399-409.
Geleta, L., Labuschagne, M. & Viljoen, C. (2005). Genetic variability in pepper
(Capsicum annuum L.) estimated by morphological data and amplified
fragment length polymorphism markers. Biodiversity & Conservation,
14(10), pp. 2361-2375.
Geleta, M., Asfaw, Z., Bekele, E. & Teshome, A. (2002). Edible oil crops and their
integration with the major cereals in North Shewa and South Welo, Central
Highlands of Ethiopia: an ethnobotanical perspective. Hereditas, 137, pp.
29-40.
Geleta, M. & Ortiz, R. (2013). The importance of Guizotia abyssinica (niger) for
sustainable food security in Ethiopia. Genetic Resources and Crop
Evolution, 60(5), pp. 1763-1770.
Geleta, N., Labuschagne, M.T. & Viljoen, C.D. (2006). Genetic diversity analysis in
sorghum germplasm as estimated by AFLP, SSR and morpho-agronomical
markers. Biodiversity & Conservation, 15(10), pp. 3251-3265.
Gerrano, A.S., Labuschagne, M.T., van Biljon, A. & Shargie, N.G. (2014). Genetic
diversity assessment in sorghum accessions using qualitative
morphological and amplified fragment length polymorphism markers.
Scientia Agricola, 71, pp. 394-401.
Ghebru, B., Schmidt, R. & Bennetzen, J. (2002). Genetic diversity of Eritrean
sorghum landraces assessed with simple sequence repeat (SSR) markers.
Theoretical and Applied Genetics, 105(2-3), pp. 229-236.
Gomez-Becerra, H.F., Yazici, A., Ozturk, L., Budak, H., Peleg, Z., Morgounov, A.,
Fahima, T., Saranga, Y. & Cakmak, I. (2010). Genetic variation and
environmental stability of grain mineral nutrient concentrations in Triticum
dicoccoides under five environments. Euphytica, 171(1), pp. 39-52.
Gutierrez, M., Patto, M.V., Huguet, T., Cubero, J., Moreno, M. & Torres, A. (2005).
Cross-species amplification of Medicago truncatula microsatellites across
three major pulse crops. Theoretical and Applied Genetics, 110(7), pp.
1210-1217.
Habindavyi, E. (2009). Morphological characterisation of sorghum (Sorghum
bicolor) diversity in Burundi. Diss. Uppsala, Sweden: Swedish University
Of Agricultural Sciences.
Hamrick, J.L. (1983). The distribution of genetic variation within and among natural
plant populations. BIOL. CONSERV. SER., pp. 335-348.
Harlan, J. & De Wet, J. (1972). A simplified classification of cultivated sorghum.
Crop science, 12(2), pp. 172-176.
Hearne, C.M., Ghosh, S. & Todd, J.A. (1992). Microsatellites for linkage analysis
of genetic traits. Trends in Genetics, 8(8), pp. 288-294.

42
House, L.R. (1985). A guide to sorghum breeding. 2nd. ed. Patancheru, India:
International Crops Research Institute for the Semi-Arid Tropics. Available
from: https://books.google.se/books.
ICRISAT, I. (1993). Descriptors for Sorghum (Sorghum bicolor (L.) Moench).
IBPGR, Rome, Italy.
Kayodé, A.P., Linnemann, A.R., Hounhouigan, J.D., Nout, M.J. & van Boekel, M.A.
(2006). Genetic and environmental impact on iron, zinc, and phytate in food
sorghum grown in Benin. Journal of agricultural and food chemistry,
54(1), pp. 256-262.
Kumar, A., Reddy, B.V.S., Sharma, H.C., Hash, C.T., Srinivasa Rao, P., Ramaiah,
B. & Sanjana Reddy, P. (2011). Recent Advances in Sorghum Genetic
Enhancement Research at ICRISAT. American Journal of Plant Sciences,
02(2011///), pp. 589-600.
Kumar, M.M. & Kumar, K.M.H. (2009). Estimation of genetic variability among
sorghum genotypes using SSR markers. Mysore Journal of Agricultural
Sciences, 43(4), pp. 744-748.
Lekgari, A. & Dweikat, I. (2014). Assessment of Genetic Variability of 142 Sweet
Sorghum Germplasm of Diverse Origin with Molecular and Morphological
Markers. Open Journal of Ecology, 4(07), pp. 371-393.
Manzelli, M., Pileri, L., Lacerenza, N., Benedettelli, S. & Vecchio, V. (2007).
Genetic diversity assessment in Somali sorghum (Sorghum bicolor (L.)
Moench) accessions using microsatellite markers. Biodiversity and
conservation, 16(6), pp. 1715-1730.
Marshall, D. & Brown, A. (1975). Optimum sampling strategies in genetic
conservation. Crop genetic resources for today and tomorrow, pp. 53-80.
Menz, M.A., Klein, R.R., Unruh, N.C., Rooney, W.L., Klein, P.E. & Mullet, J.E.
(2004). Genetic Diversity of Public Inbreds of Sorghum Determined by
Mapped AFLP and SSR Markers. Crop Sci., 44(4), pp. 1236-1244.
Merril, A. & Watt, B. (1973). Energy value of Foods, basis and derivation
(Agriculture handbook, No. 74. USA: United States Department of
Agriculture.
Mujaju, C. (2009). Diversity of landraces and wild forms of watermelon (Citrullus
lanatus) in southern Africa. Alnarp, Sweden: Swedish University of
Agricultural Sciences.
Mujaju, C. (2011). Diversity of landraces and wild forms of watermelon (Citrullus
lanatus). Diss. Alnarp, Sweden: Swedish University of Agricultural
Sciences.
Mutegi, E., Sagnard, F., Semagn, K., Deu, M., Muraya, M., Kanyenji, B., De
Villiers, S., Kiambi, D., Herselman, L. & Labuschagne, M. (2011). Genetic
structure and relationships within and between cultivated and wild sorghum
(Sorghum bicolor (L.) Moench) in Kenya as revealed by microsatellite
markers. Theoretical and Applied Genetics, 122(5), pp. 989-1004.
Nei, M. & Li, W.-H. (1979). Mathematical model for studying genetic variation in
terms of restriction endonucleases. Proceedings of the National Academy
of Sciences, 76(10), pp. 5269-5273.

43
Ng'uni, D., Geleta, M. & Bryngelsson, T. (2011). Genetic diversity in sorghum
(Sorghum bicolor (L.) Moench) accessions of Zambia as revealed by simple
sequence repeats (SSR). Hereditas, 148(2), pp. 52-62.
Ng'uni, D., Geleta, M., Hofvander, P., Fatih, M. & Bryngelsson, T. (2012).
Comparative genetic diversity and nutritional quality variation among some
important southern African sorghum accessions [Sorghum bicolor (L.)
Moench]. Australian Journal of Crop Science, 6(1), pp. 56-64.
Nybom, H. & Bartish, I.V. (2000). Effects of life history traits and sampling
strategies on genetic diversity estimates obtained with RAPD markers in
plants. Perspectives in plant ecology, evolution and systematics, 3(2), pp.
93-114.
Nyquist, W.E. & Baker, R. (1991). Estimation of heritability and prediction of
selection response in plant populations. Critical reviews in plant sciences,
10(3), pp. 235-322.
Page, R. (1996). TREEVIEW, tree drawing software for Apple Macintosh and
Microsoft Windows. (Version: 1.6.6) [Computer Program]. Glasgow,
Scotland, UK: Division of Environmental and Evolutionary Biology,
Instituteo Biomedical and Life Sciences, University of Glasgow. .
Paterson, A., Bowers, J., Bruggmann, R., Dubchak, I., Grimwood, J., Gundlach, H.,
Haberer, G., Hellsten, U., Mitros, T. & Poliakov, A. (2009). The Sorghum
bicolor genome and the diversification of grasses. Nature, 457, pp. 551 -
556.
Patil, A., Fakrudin, B., Narayana, Y., Bhat, R., Koti, R. & Salimath, P. (2010).
Molecular mapping of gene based markers in sorghum. Karnataka Journal
of Agricultural Sciences, 23(5), pp. 681-686.
Pavlicek, A., Hrda, S. & Flegr, J. (1999). Free-Tree--freeware program for
construction of phylogenetic trees on the basis of distance data and
bootstrap/jackknife analysis of the tree robustness. Application in the
RAPD analysis of genus Frenkelia. Folia Biol (Praha), 45(3), pp. 97-99.
Peterson, C., Johnson, V. & Mattern, P. (1986). Influence of cultivar and
environment on mineral and protein concentrations of wheat flour, bran, &
grain. Cereal Chem, 63, pp. 183-186.
Pontieri, P., Troisi, J., Fiore, R.d., Maro, A.d., Bean, S.R., Tuinstra, M.R., Roemer,
E., Boffa, A., Giudice, A.d., Pizzolante, G., Alifano, P. & Giudice, L.d.
(2014). Mineral contents in grains of seven food-grade sorghum hybrids
grown in a Mediterranean environment. Australian Journal of Crop
Science, 8(11), pp. 1550-1559.
Ramu, P., Billot, C., Rami, J.F., Senthilvel, S., Upadhyaya, H.D., Ananda Reddy, L.
& Hash, C.T. (2013). Assessment of genetic diversity in the sorghum
reference set using EST-SSR markers. Theoretical and Applied Genetics,
126(8), pp. 2051-64.
Reddy, B., Ramesh, S. & Reddy, P. (2004). Sorghum breeding research at ICRISAT-
goals, strategies, methods and accomplishments. International Sorghum
and Millets Newsletter, 45, pp. 5-12.
Reddy, B.V., Ramesh, S. & Longvah, T. (2005). Prospects of breeding for
micronutrients and b-carotene-dense sorghums. International Sorghum and
Millets Newsletter, 46, pp. 10-14.

44
Ritter, K.B., McIntyre, C.L., Godwin, I.D., Jordan, D.R. & Chapman, S.C. (2007).
An assessment of the genetic relationship between sweet and grain
sorghums, within Sorghum bicolor ssp. bicolor (L.) Moench, using AFLP
markers. Euphytica, 157(1-2), pp. 161-176.
Sabharwal, P., Lodhi, G., Grewal, R., Pahuja, S. & Nehra, S. (1995). A study on
genetic divergence in forage sorghum. CROP RESEARCH-HISAR-, 10, pp.
279-284.
Schulman, A.H. (2007). Molecular markers to assess genetic diversity. Euphytica,
158(3), pp. 313-321.
Sharon, D., Cregan, P., Mhameed, S., Kusharska, M., Hillel, J., Lahav, E. & Lavi,
U. (1997). An integrated genetic linkage map of avocado. Theoretical and
Applied Genetics, 95(5-6), pp. 911-921.
Shegro, A., Shargie, N.G., van Biljon, A. & Labuschagne, M.T. (2012). Diversity in
starch, protein and mineral composition of sorghum landrace accessions
from Ethiopia. Journal of Crop Science and Biotechnology, 15(4), pp. 275-
280.
Smith, J., Kresovich, S., Hopkins, M., Mitchell, S., Dean, R., Woodman, W., Lee,
M. & Porter, K. (2000). Genetic diversity among elite sorghum inbred lines
assessed with simple sequence repeats. Crop science, 40(1), pp. 226-232.
Snowden, J. (1936). The cultivated races of sorghum. (The cultivated races of
sorghum. London, UK: Trustees of Bentham-Moxon Fund.
Tao, Y., Manners, J., Ludlow, M. & Henzell, R. (1993). DNA polymorphisms in
grain sorghum (Sorghum bicolor (L.) Moench). Theoretical and Applied
Genetics, 86(6), pp. 679-688.
Thudi, M. & Fakrudin, B. (2011). Identification of unique alleles and assessment of
genetic diversity of rabi sorghum accessions using simple sequence repeat
markers. Journal of plant biochemistry and biotechnology, 20(1), pp. 74-
83.
Uptmoor, R., Wenzel, W., Friedt, W., Donaldson, G., Ayisi, K. & Ordon, F. (2003).
Comparative analysis on the genetic relatedness of Sorghum bicolor
accessions from Southern Africa by RAPDs, AFLPs and SSRs. Theoretical
and Applied Genetics, 106(7), pp. 1316-1325.
Van der Walt, J. (1956). Kaffircorn malting and brewing studies. II.—Studies on the
microbiology of Kaffir beer. Journal of the Science of Food and
Agriculture, 7(2), pp. 105-113.
Vanderlip, R. & Reeves, H. (1972). Growth stages of sorghum [Sorghum
bicolor,(L.) Moench.]. Agronomy Journal, 64(1), pp. 13-16.
Warburton, M., Reif, J., Frisch, M., Bohn, M., Bedoya, C., Xia, X., Crossa, J.,
Franco, J., Hoisington, D. & Pixley, K. (2008). Genetic diversity in
CIMMYT nontemperate maize germplasm: landraces, open pollinated
varieties, and inbred lines. Crop science, 48(2), pp. 617-624.
Velu, G., Rai, K., Muralidharan, V., Longvah, T. & Crossa, J. (2011). Gene effects
and heterosis for grain iron and zinc density in pearl millet (Pennisetum
glaucum (L.) R. Br). Euphytica, 180(2), pp. 251-259.
Yang, W., de Oliveira, A.C., Godwin, I., Schertz, K. & Bennetzen, J.L. (1996).
Comparison of DNA marker technologies in characterizing plant genome

45
diversity: variability in Chinese sorghums. Crop science, 36(6), pp. 1669-
1676.
Yeh, F., Yang, R.-C. & Boyle, T. (1999). PopGene Version 131: Microsoft Window-
based freeware for population genetic analysis. University of Alberta and
Centre for International Forestry Research, pp. 11-23.
Zhan, Q., Zhou, L., Bi, N., Wu, H., Li, J., Lu, J., Lu, J. & Lin, P. (2012). A
comprehensive analysis of genetic diversity and relationships of 13 sweet
sorghum varieties as energy sources. Journal of Sustainable Bioenergy
Systems, 2012(2), pp. 86-91.
Zhang, Z., Gu, J. & Gu, X. (2004). How much expression divergence after yeast
gene duplication could be explained by regulatory motif evolution? Trends
Genet, 20, pp. 403 - 407.

46
Acknowledgements
First and foremost I would like to give thanks to the Lord Almighty for His
unfailing love, grace and mercy during my study period.
I am greatly indebted to my main supervisor, Professor Tomas Bryngelsson,
for giving me the opportunity to conduct this research project, and for
encouraging the independence and confidence needed to advance in my research
career. Training with such a thoughtful, patient, understanding and generous
mentor has been an honour for me.
I would like to express my sincere gratitude to my co-supervisor, Dr. Mulatu
Geleta Dida, for the valuable support especially in the area of molecular markers.
He always made time off his busy work schedule to assist me both during
laboratory work and data analysis. He never tired of explaining things to me
extensively or correcting the many mistakes I made in my manuscripts, as well
as his constructive criticism on my work. His contribution to my work has been
invaluable and set me off on the right track in the research field.
I am grateful to Dr. Stephen Majara Chite, for initially encouraging me to
take up this study, as well as for his invaluable support and guidance throughout
my research work. He always made sure my field experiments were well taken
care of despite the difficulties that I came across.
I also wish to thank Professor Rodomiro Ortiz for correcting my manuscripts
and several discussions and advice he provided.
Logistical support and coordinator role were provided by Dr Moneim Fatih,
whose support I appreciate.
Financial support for this study was provided by the Swedish International
Development Cooperation Agency (Sida) through the SADC Plant Genetic
Resources Centre (SPGRC). I am greatly indebted to these two organisations for
financing my study beyond the SPGR Project life at the end of 2009.
I am also grateful to the management at the Department of Agricultural
Research for releasing me to take up this study and for facilitating and co-
financing field work.
I am grateful to the governments of Botswana, Namibia, Swaziland, Zambia
and Zimbabwe, through their national gene banks for providing germplasm used
in the study.
I am indebted to Ms Ania Zborowska, who patiently assisted me with
molecular laboratory work and was tolerant to all mistakes I made along the way.
Her knowledge and experience with molecular markers and hints on how to
achieve the best results out of experiments were amazing. I also thank Helen and
Annelie for assistance with ordering chemicals I needed in the laboratory after
Ania left.

47
I express my sincere gratitude to Ann-Sofie Fält for the humility and a warm,
welcoming attitude.
Special thanks to my friends Alphonsine, Busie, Rudo and Sonja for sharing
God-inspired and life-changing messages and discussions, time for shopping and
sight-seeing in Sweden. You ladies were awesome company and I thank God for
you.
My sincere gratitude to my friends from Botswana, Lesedi and Mbaki, who
made the atmosphere in Sweden more like home.
Many thanks to my office mates, fellow PhD students and friends in Alnarp
for making life in Sweden enjoyable: Abel, Abilio, Bahromidin, Birjan, Carlos,
Claid, Dagmawit, Dharani, Dickson, Elnura, Emelie, Esayas, Evelyn, Faiza,
Faraz, Faris, Firuz, Isabel, Karina, Lijie, Lorna, Mahbubjon, Marjan, Marufkul,
Michael, Mohammed, Nomcebo, Pamela, Rui, Sergey, Sophie, Tanya, Tibebe,
Thuy, Xiangyang, Yanrong and Zeratzion.
The long hours of fieldwork were endured with the assistance of the staff at
the different research stations of the Department of Agricultural Research
(DAR), Botswana. Joseph Pharudi, Boitshepo Letiyo, Elinah Khutsanayanaga,
Beji Mbulawa, Pinelo Mojewa and Oretlametse Samati at Pandamatenga. Mary
Molefe, Chiyapo Gwafila, Keletsositse Kgokong, Levy Molome, and Banewang
Sebego at Sebele. Without their contribution this work would not be, my
heartfelt and sincere thanks to them.
My colleagues and friends at DAR whose encouragement and sincere interest
in my work progress I appreciate: Antoinette, Bettina, Bikkie, Charles, Derrick,
Dukes, Emmanuel, Ikaneng, Ketseemang, Kabo, Leornard, Olaotswe, Onalenna,
Ontlametse, Ozzie, Selly, Tidimalo, Ugele, Utlwanang, Wame, Willie and
Zibani.
I express my thanks to my parents, Difako and Esther for the love they have
always afforded me. All my siblings thank you for helping with the kids. Thanks
to my niece, Dora and her little boy Sasa for taking time to be with my family
when I was not home.
Finally my deepest and heartfelt thanks and love go to my husband Moses
Biggie for playing both fatherly and motherly roles to the children and enduring
my absence all these years. Truly you have been great, and I would not have
done it without your support.
A big thank you also to my lovely babies: Bakang, Thuto and Thebe for your
understanding throughout the years though it was not easy for you. God bless
you abundantly!