genetic characterization of the mexican bovine lidia breed
TRANSCRIPT
Genetic Characterization of the Mexican Bovine
Lidia Breed
Paulina García Eusebi

Cover: Albert Oehlen, 2004. Oil on canvas
Back cover: Albert Oehlen, 2009. Oil on wood

Genetic Characterization of the Mexican Bovine
Lidia Breed
Paulina García Eusebi
Thesis
Submitted in fulfillment of the requirements for the degree of doctor
under the supervision of:
Dr. Javier Cañón Ferreras
Dr. Oscar Cortés Gardyn
UNIVERSITAT AUTÒNOMA DE BARCELONA
Departament de Ciència Animal i dels Aliments
Facultat de Veterinària
UNIVERSIDAD COMPLUTENSE DE MADRID
Departamento de Producción Animal
Facultad de Veterinaria
Bellaterra, 2018


We should always put a little art into what we do.
It's better that way
Jules Verne

El Dr. Javier Cañón Ferreras, Catedrático del Departamento de Producción Animal
y
El Dr. Oscar Cortés Gardyn, Profesor del Departamento de Producción Animal, de la
Universidad Complutense de Madrid,
CERTIFICAN:
Que Paulina García Eusebi ha realizado bajo su dirección el trabajo de investigación
titulado
“Caracterización genética de la raza bovina de Lidia Mexicana”
Para optar al grado de Doctor en Producción Animal por la Universitát Autónoma de
Barcelona.
Que este trabajo de investigación se ha llevado a cabo en el Departamento de Producción
Animal de la Universidad Complutense de Madrid bajo la tutoría del Dr. Jordi Jordana
Vidal por parte de la Universitát Autónoma de Barcelona.
Bellaterra, Mayo de 2018.
Dr. Javier Cañón Ferreras Dr. Oscar Cortés Gardyn
Director Director
Paulina García Eusebi
Doctoranda


Summary
9
he cattle of the Lidia breed have been selected during centuries for behavioral
related traits, a peculiarity that distinguishes it from the rest of the bovine breeds,
selected mostly for characteristics of productive interest, such as meat and milk. In Spain, the
original Lidia population has been studied through genomic data, allowing to know that the
genetic richness of the breed is owed to the contribution of each of the multiple lineages or
encastes in which it is subdivided. In Mexico, the Lidia breed represents an important
historical and cultural legacy and currently, its population has not been genetically
characterized.
In this thesis we analyze the genetic diversity and structure of the Mexican population and
compared it with data from the original Spanish population by using genomic information
derived from different types of molecular markers.
First, we analyzed parameters of genetic diversity in both populations using Microsatellite
and Single Nucleotide Polymorphisms autosomal markers, finding similar values of expected
heterozygosities with both types of molecular markers. We found also high values in terms of
FIS in both populations. Both, the high values of FIS in the lineages and the behavior of the
Runs of Homocigosity are a consequence of the lineages´ low census, contributing hence to
increase the inbreeding rate. Furthermore, we detected high genetic differentiation between
populations with both types of molecular markers: microsatellite and SNP, and the partition
of the total genetic variability analyzed with SNPs showed that 19% of the variation is
explained by the genetic differences among lineages within populations. Curiously, the
genetic structure of the Mexican population revealed that it shares few common genetic
origins with the original Spanish population, placing both populations in different groups.
The Y chromosome analysis evidenced the paternal footprint that Casta Navarra has left in
the Mexican population through a high frequency of the H6 Haplotype, exclusive of this
T

Summary
10
lineage. Mitochondrial DNA analyzes, on the other hand, revealed similar haplotype patterns
in both populations.
Finally, considering the peculiarity of the selection performed in this breed, we carried out an
analysis to detect signatures of selection that could affect agonistic behavioral related traits,
using as a reference two tamed Spanish breeds. Using two methods based on Bayesian
inferences, we jointly identified two selected genomic regions. Also, the direction and
intensity in the frequency of the allele selected of the Lidia breed is opposite to that of the
tame breeds. In these regions were detected genes associated to metabolic pathways such as
serotonin and dopamine, as well as genes expressed in the brain cortex, which have been
related to patterns of aggressive behavior in humans and laboratory animals.

Resumen
11
l ganado de la raza de Lidia ha sido seleccionado durante siglos por caracteres
relacionados al comportamiento, una peculiaridad que la distingue del resto de las
razas vacunas, principalmente seleccionadas por características de interés productivo,
como carne y leche. En España, la población de Lidia originaria ha sido estudiada por
medio de información genómica, permitiendo conocer que la riqueza genética de ésta raza
se debe al aporte proporcionado por cada uno de los múltiples encastes o linajes en los que
se subdivide. En México la raza de Lidia representa un legado histórico y cultural
importante y actualmente, su población no ha sido caracterizada genéticamente.
En esta tesis analizamos la diversidad y estructura genética de la población Mexicana y la
comparamos con información proveniente de la población originaria Española utilizando
información genómica mediante diferentes tipos de marcadores moleculares.
Primero analizamos los parámetros de diversidad genética en ambas poblaciones con
marcadores autosómicos de tipo Microsatélite y Polimorfismos de nucleótido único,
encontrando valores similares de heterocigosis esperada con ambos tipos de marcadores
moleculares. Encontramos también valores elevados en términos de FIS en ambas
poblaciones. Tanto los valores elevados de FIS en los encastes así como el comportamiento
que presentan las Carreras de Homocigosis son consecuencia del bajo censo de los
encastes, contribuyendo por ende a incrementar la tasa de endogamia. También
encontramos una alta diferenciación genética entre poblaciones con ambos tipos
marcadores moleculares; microsatélites y SNPs. La partición de la variabilidad genética
total analizada con SNPs mostró que el 19% de la variación se explica por las diferencias
genéticas entre linajes. Curiosamente, la estructura genética de la población mexicana
reveló que comparte escasos orígenes genéticos en común con la población originaria
española, ubicando a ambas poblaciones en grupos diferentes.
E
Summary
12
El análisis de cromosoma Y mostró que la Casta Navarra ha dejado huella paterna en la
población mexicana mediante una frecuencia elevada en el haplotipo H6, exclusivo de ésta
casta así como del encaste de Miura. Los análisis de ADN mitocondrial, por otro lado,
revelaron patrones de haplotipos similares en ambas poblaciones.
Por último, considerando la peculiaridad en la selección de esta raza, realizamos un
análisis para detectar huellas de selección que pudieran afectar caracteres asociados a
comportamiento de tipo agonista, utilizando dos razas mansas españolas como referencia.
Utilizando dos métodos que se basan en inferencias bayesianas, identificamos en común
dos regiones genómicas seleccionadas. A demás, la dirección e intensidad en la frecuencia
del alelo seleccionado en la raza de Lidia es opuesto a los de las razas mansas. En éstas
regiones detectamos genes asociados a rutas metabólicas como las de la serotonina y la
dopamina, así como genes expresados en corteza cerebral, los cuáles han sido relacionados
con patrones de comportamiento agresivo en humanos y animales de laboratorio.

Table of contents
List of tables............................................................................................................................ 15
List of figures .......................................................................................................................... 16
Abbreviations ......................................................................................................................... 17
GENERAL INTRODUCTION
1. Natural history of the Taurine cattle
1.1 Domestication, migration and origin of cattle breeds ................................................ 21
1.2 Cattle arrival to America .......................................................................................... 24
1.3 Cattle arrival to Mexico ............................................................................................. 26
2. The Lidia breed
2.1 Origin, concept of Tauromaquia and its representations ............................................ 27
2.2 Original population and the founding “Castes” ......................................................... 29
2.3 Current genetic diversity and structure of the Spanish population ............................. 30
2.4 The Lidia breed in Mexico .......................................................................................... 33
3. Genetic diversity
3.1 Concept and need to preserve the genetic diversity .................................................... 35
3.2 Measurements of population´s genetic diversity ........................................................ 37
3.3 Genetic diversity estimation using molecular markers .............................................. 40
OBJECTIVES ....................................................................................................................... 47
PUBLICATIONS ................................................................................................................... 48
COMPLEMENTARY DOCUMENTATION ..................................................................... 88

Table of contents
GENERAL DISCUSSION
1. The genetic diversity of the Mexican Lidia breed ....................................................... 97
2. Genetic structure of the Mexican Lidia population ................................................... 101
3. Analyses of the sex chromosomes ............................................................................. 103
4. Analysis of the Runs of Homozigosity ...................................................................... 104
5. Signatures of selection oriented to behavioural features ........................................... 107
CONCLUSIONS .................................................................................................................. 111
REFERENCES ..................................................................................................................... 112
ANNEXES ............................................................................................................................ 122
List of publications ............................................................................................................... 123
Acknowledgements .............................................................................................................. 124

List of tables
15
Table 1 Examples of molecular markers used in genetic diversity studies.
Table 2 Comparison of the expected heterozygosities obtained with the different types
of autosomal molecular markers used: microsatellites and SNPs.
Table 3 Comparison of the overall FST genetic distances obtained with the different
types of markers used: microsatellites and SNPs.
Table 4 Descriptive statistics of the number and total length of ROH in the genome for
the four cattle groups analyzed. Mean values of the segments and its standard deviation
(St.Dv.), and the size of the shortest and longest segments per group.

List of figures
16
Figure 1 Migration routes of the taurine cattle in Europe (Felius et al., 2014).
Figure 2 Columbus route during his second trip (1493).
Figure 3 Geographical locations of the bovine nuclei where the original castes were
born (U.C.T.L., 2018)
Figure 4 Lidia original founding castes and its raising century
Figure 5 Relationship between the number of ROH>1 Mb and the total length (Mb) of
the genome in those ROH, from each group.
Figure 6 Descriptive statistics of number of ROH and total length (Mb) for the four
cattle groups analyzed. Mean values of the segments and its standard deviation (SD),
and the size of the shortest and longest segments per group.

Abbreviations
17
B.P. Before Present
bp Base pair
CHR Chromosome
Ha Hectares
Ho Observed heterozygosity
He Expected heterozygosity
HWE Hardy- Weinberg equilibrium
LD Linkage Disequilibrium
Mb Mega base pair
mtDNA Mitocondrial DNA
PcoA Principal Coordinates Analysis
ROH Runs of Homozygosity
SNP Single Nucleotide Polymorphism

18

GENERAL INTRODUCTION


General Introduction
21
1. NATURAL HISTORY OF THE TAURINE CATTLE
1.1 Domestication, migration and origin of cattle breeds
The bovine cattle have been associated socially, culturally and economically to the
development of the human kind, and is one of the most important livestock species (Maudet,
2010). The domestication of the taurine bovines (Bos taurus taurus) occurred between
10,300–10,800 years ago in the Fertile Crescent, placed at the west of the Turkish-Syrian
border (Helmer et al., 2005; Vigne et al., 2011).
The taurine cattle descend from the extinct aurochs (Bos primigenius primigenius); a savage
type of bovines that ranged over most of the Eurasian continent. Molecular estimations of the
divergence time of the aurochs subspecies are of 147,000 years BP and, thus of taurine
(335,000 BP) and zebu cattle (350,000 BP) is estimated to happen long before. The most
recent divergence time of the aurochs is believed to happen given the difficulty of their
management and breeding (Felius et al., 2014). This huge and reputedly fierce species is
extinct since 1627, dying the last animal in Poland (Edwards et al., 2007).
From the center of domestication, the lack of pasture during the winters and the harsh
climatic conditions gave rise to the transhumance, and thus, a large proportion of the
domesticated cattle began to migrate and expand during the Neolithic transition (Felius et al.,
2014). First, with a westward expansion of the agricultural societies approximately 10,000 to
8,500 years BP to Europe (Conolly et al., 2012) and then a second eastward migration to
China, between 5,000 and 4,000 BP (Payne et al., 1997). The expansion of cattle to Europe
followed two routes (Figure 1): The Mediterranean, where the first bovine settlements were
placed in the south of Italy, north of Africa, the Tyrhenian Islands, south of France and in the
Iberian Peninsula, and the Danube route, which followed a north route bordering the Balkan

General Introduction
22
rivers, establishing then the first bovine populations in the Centre and North of the European
Continent (Shceu et al., 2015). Also, an influence of North African cattle is well documented
on Iberian breeds, attributed mainly to the Moorish occupation and to cattle exchanges via the
Straits of Gibraltar during the Bronze Age (Cymbron et al., 2005; Beja-Pereira et al., 2006).
Figure 1 Migration routes of the taurine cattle in Europe (Felius et al., 2014).
The demographic events that took place after the domestication have been described by
means of archeological evidence along with molecular tools using autosomal DNA,
mitochondrial DNA (Ajmone-Marsan et al., 2010), and Y-chromosomal DNA (Pérez-Pardal
et al., 2010). The phylogenetic analyses of mitochondrial DNA sequence variations of the
modern Bos Taurus allowed identifying four maternal clusters of haplogroups designated as
T1, T2 and T3, which coalesce to a central haplogroup T (Troy et al., 2001). The geographic
haplogroup distribution shown several spatial clusters such as: the high haplgroup diversity in
Southwest Asia with the presence of the four major mitochondrial haplogroups, the
prevalence of the T3 haplogroup in Europe and the almost exclusive occurrence of T1 in
Africa (Lenstra et al., 2014). Furthermore the frequencies of the T1 haplogroup in Spain
(15%) and Portugal (11%), and also in Italian and Greek bovine breeds, depict the influence
of the migration of African cattle into Europe across the sea straits of the Mediterranean
General Introduction
23
route. This is believed to happen at the early Bronze Age or during the Muslim occupation
(Anderung et al., 2005; Beja-Pereira et al., 2006).
The paternal genetic origins based on Y chromosome data that help to depict the migration
pattern of the cattle into Europe allowed identifying two haplotypes (Y1 and Y2) preceding
the contemporary cattle breeds (Götherström et al., 2005). The geographic distribution of
these two haplotypes follows a clear geographic structure; the Y2 haplotype has high
frequencies in the south of Europe (the Iberian Peninsula, France Switzerland and Italy),
while the haplotype Y1 in the north European breeds (Götherström et al., 2005). Some of the
north-south interpretations of the Y1 and Y2 haplotype distributions mention that these
distributions are result of two different migration events coming from the Near-east through
the Danubian and Mediterranean routes, and it also can be due to adaptative differences along
geographical areas that shift allele frequencies as a response to selection (Beja Pereira et al.,
2006). There is also the hypothesis that the haplotype Y2 colonized Europe earlier, with a
first European cattle arrival, followed by a local introgression with auroch bulls that may
contributed to create the Y1 haplotype (Götherström et al., 2005).
From the Hellenic period to the Middle Ages, cattle were not differentiated in breeds as we
know them now. Livestock at that period of time was raised in order to meet the population´s
needs, which varied over the regions. For example, in the Netherlands at the middle of the
XVI century the cattle were already recognized in the region as specialized in milk
production, leading place to migrations of cattle throughout Europe (Bieleman, 2000). Over
the years, at the beginning of the industrial revolution, a great diversity of cattle populations
were already classified under a breed´s name and livestock husbandry became organized
following breeding systems as a consequence of the farmers concern to increase the
productivity of their animals (Felius et al., 2011). Animal breeding then, became a social
concept of the upper bourgeoisie through breeding societies that created the herd books

General Introduction
24
making emphasis on the livestock selection towards the “racial purity” of their animals, and
aiming to get an attribute of prestige for the animals with pedigree records (Felius et al.,
2011).
At the XVIII century almost all the sires of the current main productive bovine breeds were
selected following a breeding criterion, some of their pedigrees were registered in the herd
books and begin to spread all over Europe and then to America and Australia (Felius et al.,
2015).
The creation of breeds changed the distribution of the diversity in a way that the groups of
herds that constituted a breed acquired uniformity, emphasizing their differentiation. From
the XVIII century, popular breeds spread widely outside their region of origin and by the XX
century, two centuries later, most of the more popular breeds got differentiated because of
their productivity in meat or milk production, like the Holstein-Freisians, where the most
numerous cattle worldwide (Felius et al., 2015). Conversely, the dispersal of the popular
breeds favored the disappearance of local breeds, less productive but adapted to their
geographical environment.
1.2 Cattle arrival to America
Considered one of the most important events in the history of the human kind, the discovery
of America produced great social and economic changes at both sides of the Atlantic Ocean
(Martínez et al., 2012). With the arrival of the Spanish colonizers in 1492 a whole new world
was discovered for cattle, non-existant in America, where the pre-Columbian civilizations
bred mainly dogs, turkeys, guinea pigs, and three species of Andean camelids. In this sense,
Columbus's trips had a great impact on the exchange of animal and plant genetic resources
between continents that revolutionized the population's lifestyle in terms of food types and
nutritional habits (Crosby, 2003).

General Introduction
25
The bovines were firstly introduced to America by Christopher Columbus on his second trip
which departed from Cadiz in 1493 to the Caribbean island of "La Española" (Figure 2)
transporting mainly horses, a few calves, goats and pigs. It was until his third trip in 1498
when more bovines were brought to the island (Payne et al., 1997). In “La Española”,
livestock breeding was a challenge, presenting some complications in the first years after
their introduction because those animals had to overcome and adapt to the new
meteorological and forage conditions, along to the natural difficulties of the tropical
ecosystems. For example, in 1505 a hurricane devastated almost all the bovine population
and, due to these meteorological disasters a law was crreated, avoiding the arrival of cattle to
the island. Thus the breeding of the extant bovines became an exclusive practice and a
privilege for a reduced amount of farmers (Payne et al., 1997). For the next fifty years, each
ship departing to America could legally transport just five or six bovines, and from them, just
two or three were expected to survive the journey.
Figure 2 Columbus route during his second trip (1493). Image obtained from
http://www.crossingtheoceansea.com
As consequence of such restrictions, the bovine population census at the Caribbean colonies
in 1524 was around 1,000 bovines, and from these islands some were distributed to the
Spanish colonies in the continental America. Most of the bovines that were transported
belonged to populations of the northwestern African coast and the Canary Islands that were

General Introduction
26
part of the Spanish occupation since 1479. This was the last port where the ships stop before
crossing the Atlantic Ocean (de Alba, 1987; Martínez et al., 2012).
As mentioned above, it is complicated to define the cattle breeds that were brought to
America since, the concept of breed was not defined at this period of time. However, it is
documented that, besides the Canarian and African bovines, the cattle that populated America
between 1493 and 1512 became also from the Iberian Peninsula, one in four animals became
from the marshlands of the Guadalquivir river, so those animals could be considered today as
belonging to the Retinta Andaluza and the Marismeña breeds (Rodero et al., 1992). A second
group of bovines arose from the North-westlands of Spain in the provinces of Galicia and
Asturias, where bovines from the breeds Asturianas and Gallegas are identified (de Alba,
1987). And finally the Palmera breed of the Canary Islands is considered also a basis of the
formation of the American creole breeds, as it was the last port of landing before embarking
to America (Rodero et al., 1992).
1.3 Cattle arrival to Mexico
The first 50 bovines that landed in the Mexican territories where introduced by Gregorio
Villalobos in 1521. Later in 1524, Rodrigo de Bastidas carried from the island “la Española”
200 bovines to Mexico. Those animals constituted the first bovine population in the
continental land (Suárez-Domínguez & López-Tirado, 1996). These animals were distributed
through different regions along the coast of the Gulf of Mexico, and by 1540 husbandry
practices were already spread into the central Mexican steppe.
After, during 1565 cattle of Iberian origin was brought to the Pacific coast of Mexico, getting
to the Peninsula of Baja California in 1670 (Ulloa-Arvizu et al., 2008).
The importations of cattle from Spain to Mexico and, in general, to all of the new colonies,
were highly controlled by the “House of Contract”, an institution that was responsible to dealt

General Introduction
27
with the illegal commerce of livestock at the moment of crossing through the Atlantic Ocean.
This institution lasted 200 years and became very popular in the Canary Islands, where all the
cattle transported to America was registered (Rodero et al., 1992). It is difficult to know the
census of the Mexican cattle populations during the first two centuries after their
introduction, the only information that allows knowing an approximation of the census are
the marketing records of taxes from the 18th
century onwards that provide the records of the
movements of cattle to the big cities (Celaya-Nández, 2003).
The bovine cattle imported until the end of the XIX century were taurine cattle (Bos t. taurus
or humpless) and at the beginning of the XX century the first indicine bovines (Bos t. indicus
or humped) were imported, because humped cattle is better adapted to the meteorological
conditions in tropical regions located at the south-east region of Mexico (Guevara & Lira-
Noriega, 2011).
2 THE LIDIA BREED
2.1 It’s Origin, the concept of Tauromaquia and its representations
As a need to represent the strength of the nature in a cultural way, the man has used the
bovines as a symbol to represent it and, in a certain way representing a defeat of this natural
world (Viard, 2014). Those animals that most probably were the fierce aurochs are the
iconography represented in the paintings at caves representing the prehistoric hunts at the
Paleolithic and Neolithic ages all over the Iberian Peninsula (Viard, 2014; Felius et al., 2015).
Later, the Classic Civilizations used bulls also in games and festivities always with a
religious nuance, such examples are embodied in the murals at the Cnosos palace in Creta,
the taurokhatapsies in Thessaly and also in the evidences derived from the Mitriac rituals and
the venations of the Roman Empire (Viard, 2014).

General Introduction
28
The oldest evidence of festivities that resembles the present tauromaquias belong to the XII
century in the south of France and north of Spain, where frequently, the cattle that crossed the
main streets of the towns running in the way to the slaughterhouse and, those animals whose
aggressive behavior made difficult their handling where set apart and destined to take part in
the festivities (Domecq, 2009; Viard, 2014). However, these bovines were reproduced un-
orderly until the middle of the XVIII century and, from then, the breeders created the herd
book and with it the breeding of their animals became specialized, creating rational selection
systems based on their morphological traits and behavioral characteristics (Domecq, 2009;
Prieto-Garrido, 2012).
In that period of time it was economically more profitable to raise cattle of the Lidia breed as
it has higher prices than those of the cattle selected for meat production and, has also more
regularity in the buyers demand (Martínez, 1995).
The term tauromaquia is related frequently to a restrictive meaning associated to the
“Spanish corrida” which is a total misconception . The term “Tauromaquia” makes reference
to numerous cultural representations of the acts and festivities involving bovines (Maudet,
2010). The cultural air of the tauromaquias has been extended from the southwest Europe to
America; where a wide spectrum of practices are found (from the great American rodeo in
North America, the Charreada and Jaripeo in Mexico, the bulls collected in Colombia and
Venezuela, the Rodeo montubio in Ecuador, the vaquejada and rodeo creole in Brazil, the
Chilean rodeo, etc.), all along with the traditional festivities of Spanish origin (Saumade,
2014).
In Portugal, there is a variation of the Spanish corrida known as Portuguese corrida, and in
France there is a tauromaquia based on popular courses or races in the Camarguesse and
Landaise regions. Also, it is remarkable the great diversity of popular spectacles using Lidia
breed cattle, such as the encierros, the bous al carrer, the bou embolat, the encaixonats, etc.

General Introduction
29
(Saumade, 2014). The tauromaquias are hence, a depository of a set of rituals in which the
central axis is the bovine, constituted in all their historical, geographical and cultural
contexts.
2.2 Original population and the founding “Castes”
The founding castes are the original or first populations of aggressive selected bovine cattle,
whose production and reproduction became specialized at mid-XVIII century. Those bovines
where classified according to their morphological and behavioral differences which coincided
also with differences in geographical origin (Domecq, 2009). The regions with the largest
number of Lidia cattle were located in Navarre, Castilla and Andalusia, and in lesser extent in
Extremadura, Aragon and Portugal. Showing a strong relation between the castes and the
principal Spanish rivers; like the Navarrese (Ebro), the Castilian (Duero, Tajo and Guadiana)
and the Andalusian (Guadalquivir) river basins (Figure 3).
Figure 3 Geographical locations of the bovine nuclei where the original castes were born (U.C.T.L.,
2018).

General Introduction
30
According to the Lidia Breeders Association (U.C.T.L., 1995) there are identified seven
founding castes, which are: Morucha Castellana, Navarra, Jijona, Cabrera, Vazqueña,
Vistahermosa and Gallardo (Figure 4). These castes are defined in the racial standards stated
by the Spanish Boletin Oficial del Estado (B.O.E., 2001) in which the original diversity of the
Lidia bovine breed are legally defined and, specified also the subdivision into subpopulations
named “encastes” or lineages, whose behavior and morphology is different among them.
Figure 4 Lidia original founding castes and its raising century.
2.3 Current genetic diversity and structure of the Spanish
population
Different types of traditional popular events demanded different types of behavior for the
bulls taking part in the events, this fact favored the subdivision of the original founding castes
into lineages that, at present are officially recognized (B.O.E., 2001). At present, the main
representative’s lineages are located mainly at the west and southwest of the Iberian
Peninsula, and do not follow any particular distribution pattern across the geographical
distribution areas (Cortés et al., 2008).

General Introduction
31
Numerous studies have been done to characterize genetically and depict the paternal and
maternal influences of the Spanish Lidia breed (Cañón et al., 2008; Cortés et al., 2008; Cortés
et al., 2011; Pelayo et al., 2015).
The genetic diversity of the Spanish lineages was described by Cañón et al. (2008) whom
using autosomic microsatellite DNA genotypic information detected that: (1) the Lidia breed
as a whole population (including all the lineages) possess high levels of genetic diversity but,
those levels are low within lineages, (2) significant inbreeding values were identified in the
lineages, mainly due to the small population sizes, and (3) a great level of genetic structure of
the breed is a reflection of the subdivision of the Spanish population into lineages, classifying
them in 29 the extant lineages genetically differentiated. As a result of both, the genetic drift
and different selection objectives of the breeders, such lineages become genetically
differentiated over the time.
According to Cañón et al. (2008) as a consequence of the subdivision of the breed, certain
alleles are fixed within the different lineages, and kept as a source of variation as long as the
lineage persists. The subdivision into lineages increases the number of homozygotes per
lineage, with the risk that this entails. As inbreeding increases, it also increase the risk of
disappearance of a lineage and therefore its exclusive alleles, and this process goes faster if
the effective size of the population is smaller; as is the case of some extant lineages. Cañón et
al. (2008) mentioned that the subdivision of the Lidia population into lineages, reproductively
isolated among them, could have been a good strategy for the maintenance of the whole
genetic variability of the population. To date, no action has been taken for the conservation of
the genetic variability of the Spanish Lidia breed.
The haplotype diversity of the Y chromosome determined that the lineages of the Spanish
Lidia breed population belong to two major haplogoups (Y1 and Y2) subdivided in 10

General Introduction
32
(Cortés et al., 2011), and 38 haplotypes (Pelayo et al., 2015). Both studies agree finding
diversity from both Y1 and Y2 haplogoups. Those two major paternal influences are
associated to two most common haplotypes, the H1 (Y1) and H3 (Y2) (Cortés et al., 2008). It
has been also detected the presence of the microsatellite allele INRA189-104 evidencing an
African paternal influence (Cortés et al., 2011).
The maternal lineages in the Lidia Spanish population revealed similar mtDNA diversity
richness within the Spanish Lidia lineages than the observed in the Middle East cattle breeds
and, greater than the recorded in most of the European breeds (Cortés et al., 2008). The
haplogroup T3 has the highest frequency (81%) as with most of the European cattle breeds,
followed by the African T1 haplogroup (17%) which has lower frequency in the European
breeds (Cymbron et al., 1999; Troy et al., 2001), and then lower frequencies of the
haplogroups T and T2. The high genetic variability of the Lidia breed is in part explained
because of the high frequency of the African-African haplogroup T1, observed with less
frequency on the rest of the European cattle breeds. Although, its distribution is widely
variated, for example, in five lineages the T1 haplotype was not detected, however in the
Miura lineage, its percentage is higher than 50%, varying within the lineages between 3% and
31% (Cortés et al., 2008).
At present the breeding of the Lidia breed in Spain population is organized in five herdbooks.
According to the U.C.T.L.(2018) the Lidia population is extended in more than 250,000 ha of
the Spanish territories, mostly in the Mediterranean forest ecosystem traditionally known as
Dehesa (grassland in between Mediterranean oaks) (Cañón et al., 2008). There are 976 herds
registered and by 2017 the census was estimated in 213,457 animals registered in the national
genealogical record (U.C.T.L., 2018).

General Introduction
33
2.4 The Lidia breed in Mexico
In 1522 Juan Gutierrez Altamirano, cousin of the conqueror Hernán Cortés, brought to the
New Spain (Mexico) ~30 bovines of Navarre origin, destined to take part in the first
festivities involving cattle that commemorated the conquest of the Aztec empire. At this
period of time cattle from Navarre was already being set apart for their aggressiveness,
recognizing these herds among the founding castas (U.C.T.L. 1995). In Mexico for many
years (1611-1679) it became popular among the breeders (that, in those years many of them
where ecclesiastics) to import Navarre cattle to keep their monasteries and to keep safe the
mines from the bandits’ (Prieto-Garrido, 2012).
The Lidia breed cattle in Mexico were held un-orderly in the same way as it happened in
Europe before the industrial revolution and the creation of herd-books. The specialization of
the Lidia breed in Mexico began at the last years of the XIX century and beginning of the XX
century, where four Mexican families of breeders: the Llaguno, González, Barbabosa and
Madrazo started raising Lidia cattle by reproducing the aggressive selected cattle already set
in Mexico, with Spanish Lidia sires imported to be sacrificed in the festivities (Scherrer,
1983). Then, between 1908 and 1912 the Llaguno´s and the González families imported a
reduced number of Spanish Lidia bovines destined specifically to be breeders of their herds
(Niño de Rivera, 2004).
Each family followed different breeding strategies, the Llaguno family followed a closed
breeding scheme reproducing the newly imported animals among them in one “line” named
“San Mateo”, and in a second line “Torrecilla” crossing the imported sires with local
aggressive cows (Niño de Rivera, 2004). Meanwhile, the González family crossed the new
imported animals among them and also with local cows selected for aggressiveness.

General Introduction
34
The census of the Mexican Lidia population suffered dramatic losses during the post-
revolution period, which lasted ten years (1910-1920). After those years, breeders recovered
the Lidia population from cattle that derived either from the Llaguno or González families. At
present an 80% of the Lidia Mexican breed derives from one of these two families, while the
bovine population legacy from Barbabosa and Madrazo families was lost during the post-
revolution period (Scherrer, 1983).
In recent years, between 1996 and 1997, a few Mexican breeders imported ≈1,000 Spanish
Lidia bovines belonging from different lineages before closing borders of importations from
Spain according data from the Mexican Lidia Breeders Association (A.N.C.T.L., 2017).
These breeders reproduced the new imported animals among them and kept them apart, or
reproduced the new imported animals with the local Lidia animals derived from Llaguno or
González “lines”. To date, this recent refreshment suggests a strong impact in the genetic
structure of the herds belonging from the breeders that took part in those importations. But
still, the major part of the Mexican Lidia population derives from the elder González and
Llaguno families (Niño de Rivera, 2004).
In Mexico the tauromaquia is a deep-rooted tradition that has been declared as national
intangible cultural heritage by the United Nations Organization for Education, Science and
Culture (U.N.E.S.C.O.). Currently there are 262 breeders registered in the National Breeders
Association of Lidia Cattle (Arévalo, 2015). It is estimated that each breeder has an average
of 232 cows with a fertility rate of 80%, and the average land extension of 649.2 hectares per
farm for breeder (C.O.T.E.C.O.C.A., 2017). It is difficult to have a precise census of the
Mexican Lidia population, but the estimated data from the A.N.C.T.L. (2017) is of 109,204
animals (Arévalo, 2015).
General Introduction
35
Regarding the tauromaquia festivities, between the years 2000 and 2015 average number of
animals per year that took place in the different types of festivities was around 592 per year
(3,173 in 15 years). It is estimated that the value of the tauromaquia industry per year is of ≈
€270,000 (Arévalo, 2015). Despite that the main use of the Lidia cattle is to participate in
festivities, at the end of the festivities all the byproducts are used. For example, there is a
special dish made with the bull´s tail named “rabo de toro” which is highly valued by the
butchers for sale in restaurants.
3. GENETIC DIVERSITY
3.1 Concept and need to preserve the genetic diversity
The concept of genetic diversity is defined by the Food and Agriculture Organization of the
United Nations (F.A.O.) as the genetic variety in the diverse animal genetic resources, as it
happens with the breeds within the different species (Henson, 1992). The genetic diversity
therefore, can be studied at all different levels, for example: species within ecosystems,
breeds within species, populations within breeds. So, “global diversity” can be defined as the
combination of all those sources of variability. The diversity can be studied at a molecular
level, which can be defined as the additive genetic variance within and between breeds or
populations (Meuwissen, 2009). The analyses of genetic variance can provide information of
the population´s genic structure.
The concern of preserving the biodiversity in domestic species is mainly due to: their
biological value, the sustainability that they bring to the ecosystems and also because of their
economic value for humans. At present almost two billion people depend at least partially on
domestic animals as economic support, and 12% of them depend of them almost completely
(F.A.O., 1999).

General Introduction
36
The genetic diversity allows the livestock to deal with several adversities such as new
diseases (infectious or parasitic), to wide variations in the availability and quality of the food
and water resources, among other limiting factors. The breeds adapted to local environments
may be modestly less productive compared with the highly specialized breeds, but instead are
very efficient in the use of the local resources, and are more sustainable in a long term. In
fact, on many occasions, imported animals from widespread commercial breeds with higher
productivity are not able to reproduce or survive in some regions, as are the locally adapted
breeds (F.A.O., 1999).
The maintenance of the genetic diversity is, hence, a priority objective in programs for the
conservation of the biodiversity (Fernández et al., 2004) in order to have sufficiently variated
genetic resources that guarantee the adaptation and viability of a species or breeds to variable
environments (Barker, 1999; INRA & CIRAD, 2002; Gandini & Oldenbroek, 2007).
The conservation of genetic diversity represents a safeguard against challenges from
unpredictable events, such as changes in the consumer´s preferences which may modify the
animal selection targets, the appearance of new diseases, new social trending’s that modify
the different systems of feeding or management of the animals, among others.
The loss of genetic variability, on the contrary, can lead a breed or a species to extinction.
The risk of losing a breed can be taken as a criterion of prioritization to stablish strategies of
conservation of the diversity, but it is complicated to provide an objective value of the real
risk of extinction of a breed. This is mainly because the main international organizations, like
the F.A.O., the European Federation of Animal Science (E.A.A.P.) and the European Union
(E.U.), do not share common criteria to categorize the levels of extinction risk. It is
challenging to gather all the elements influencing the extent of danger that a breed may have.
For instance, two breeds that apparently could be in the same category according to the
F.A.O., E.A.A.P. or E.U. regulation, may be subject to very different risks. To sum up,

General Introduction
37
different factors like sanitarian, social, political, economic or cultural and of course, genetic,
can alter significantly the possibilities of survival of a population.
3.2 Measurements of population´s genetic diversity
Many parameters, indicators and measurements are used to estimate genetic diversity; in this
chapter we make a brief review of the classic ways to evaluate it.
The information provided by genetic markers has been traditionally used to calculate
parameters related to the distribution of the genetic diversity in a sub-divided populations,
e.g. within and among breeds of domestic species. Indicators of diversity within breeds are,
for example, the heterozygosis (Lin et al., 2010), the average number of alleles (Zenger et al.,
2007), or the FIS statistic (Wright, 1951). Moreover, through the assessment of genetic
distances the genetic relationships of breeds among a species, or as in our case, lineages
among a breed, can be assessed.
One of the parameters used traditionally as a measure of the genetic diversity is the
heterozygosis that estimates the proportion of heterozygous individuals for a specific marker
or, in an extended way, for an average set of markers (Nei, 1978). There are two ways of
measuring the heterozygosis; one is by estimating the proportion of heterozygous individuals
by counting the number of heterozygous genotypes, or by acumulating the genic frequencies
of these, which is known as “observed heterozygosis (Ho)”. The second is the “expected
heterozygosis (He)” also known as “gene diversity” that is defined as the heterozygosis value
that would be expected under conditions of Hardy-Weinberg equilibrium (Weir & Ott 1997).
A subdivided population generally shows lower observed heterozygosis levels than the
expected; that reduction in the observed heterozygosis can be used to quantify the degree or
extent of differentiation between subpopulations. In order to measure this inter-population

General Introduction
38
genetic diversity it is necessary to estimate the genetic distances among populations. There
are different approaches to estimate genetic distance, such as the F-statisctics (Wright, 1951;
Cockerham, 1969). According to Wright´s denomination, the F-statistics are denoted by the
FIS, FST and FIT. while according to Cockerham´s definition, the statistics are denoted as f, θ
and F. Both annotations are correct and widely used in current population genetics studies.
To define them, the following values are considered:
Ho: Medium observed heterozygosity per individual within a population
He: Medium expected heterozygosity of an individual within a population
Ht: Medium expected heterozygosity of the whole population (estimated from
the average allele frequencies among subpopulations).
The F statistics are defined as follows:
𝐹𝐼𝑆 = 𝑓 =𝐻𝑒−𝐻𝑜
𝐻𝑒 The FIS provides a way of measuring mean heterozygosis reduction of an
individual within a subpopulation (inbreeding) (Holsinger & Weir, 2009). It varies between -
1 (all individuals are heterozygous) to +1 (absence of observed heterozygotes).
The FST or fixation index: 𝐹𝑆𝑇 = 𝜃 =𝐻𝑡−𝐻𝑒
𝐻𝑒 is the most widely used of the three statistics. It
measures the average reduction of heterozygosity of a subpopulation relative to the total
population due to genetic drift between subpopulations and.is, therefore, a measure of the
degree of genetic differentiation between subpopulations. It represents the percentage of
genetic variation that can be inferred as the differences between populations, and it is
complementary. Hence, the proportion attributable to differences within populations varies
between 0 (there is no differentiation) and 1 (complete differentiation).

General Introduction
39
The 𝐹𝐼𝑇 = 𝐹 =He−Ho
Ho statistic represents the mean reduction of heterozygosis of an
individual regarding the whole population.
These three parameters are related to each other through the following ecuation:
(1-FIT) = (1-FIS)(1-FST).
The statistical methodology for estimating genetic distances is well established, and the
availability of new methods to estimate locus- and population- specific effects on FST (Weir
& Hill, 2002; Balding, 2003; Beaumont & Balding 2004; Weir et al. 2005; Foll & Gaggiotti,
2008; Guo et al., 2009), provides a set of tools that allows identifying genomic regions or
populations with unusual evolutionary histories.
A significant part of this thesis is to assess the genetic structure of the Mexican population,
which theoretically, was originated from the original Spanish population.
The estimation of the allelic frequencies of sub-populations allows analyzing the extent of
differentiation among them and depending of that, the possibilities of assigning the genome
of individuals to one or several sub-populations. Depending of the type of information used,
Pritchard et al. (2000) for microsatellite data in the STRUCTURE software and Alexander &
Lange (2011) for SNPs in the ADMIXTURE software, developed non-supervised methods
based on a Bayesian inference that estimates the ancestry or number of different common
genetic origins assigning proportions of each animal genome to those inferred common
genetic origins. Nevertheless, STRUCTURE samples the posterior distribution via Markov
Chain Monte Carlo (MCMC) instead of ADMIXTURE which maximizes the likelihood.
Maximum likelihood approach in ADMIXTURE can accommodate a higher number of
markers and use then a further bootstrap to estimate standard error of the parameters. Both
approaches are well suited estimators of ancestry parameters and k-cluster.

General Introduction
40
Besides, the Multidimensional Scaling (MDS) analyses are methods to visualize the level of
similarity of the individuals of a dataset, in particular to display information contained in a
distance matrix. A Principal Coordinates Analysis (PcoA) is a classical multidimensional
scalling grapphic used to explore and visualize genetic structure of populations (Novembre &
Stephens, 2008). PcoA in population genetics is widely used as it has the advantage of
lacking the historical model to interpretation, because the representation depends of the input
data. But the same advantage makes this technique very sensitive to the choice of the dataset
in the way that unequal sampling may lead to misinterpretation of population structure
(McVean, 2009).
3.3 Genetic diversity estimation using molecular markers
The molecular markers are a good alternative to estimate genetic diversity more easily than
the traditional pedigree data sources of information (Schlötterer, 2004). An overview of the
most common markers that have been used for genetic diversity is shown in Table 1.
Table 1 Examples of molecular markers used in genetic diversity studies.
Marker Typical example Number
of Marker
alleles per
marker
Blood groups Buys, 1990 1 11
Allozymes Taggart et al., 1981 12 2-5
AFLP Ajmone-Marsan et al.,
2001
219 2
RAPD Kantanen et al., 1995 3-7 2
Microsatellite MacHug et al., 1997 20 8,4 (on
average)
SNP Decker et al., 2013 Depending
the density
2
Sequence Frischknecht et al.,-
2018
>1,000,000 1-2
Based on the inheritance of the red cell antigens, the blood groups were the first molecular
markers in cattle in the late 80´s and 90´s decade and were widely used. However, their low

General Introduction
41
number of markers show biases on the estimation of the genetic diversity of animal breeds
(Larsen & Hansen, 1986). The gene´s coding protein polymorphisms or allozymes were
widely used markers in livestock in the past decades, but they had a limitation on the number
of loci and the low polymorphism level (Toro et al., 2009). With the development of new
DNA technologies these markers were replaced by markers at the DNA chain level.
The AFLPs (amplified fragment length polymorphism) and RAPDs (randomly amplified
polymorphic DNAs) are genetic markers that were widely used in the decade of the 1990´s.
The AFLPs and RAPDs are dominant bi-allelic markers widely used to analyze genome-wide
variation and population genetic structure, but their dominant mode of inheritance and
difficulty to reproduce are pitfalls that reduces the power to analyze within breed diversity
(Toro et al., 2009). In recent years, microsatellites have been the most popular markers of
choice to study genetic variation. They are based upon sites in which the same short sequence
of nucleotides is many times repeated, presenting a high mutation rate and codominant
nature, which makes them appropriate for the study of both within- and between-breed
genetic diversity (Schlötterer, 2004).
The recent development of the genome-wide SNP (single nucleotide polymorphisms) allows
estimating genetic diversity and genetic structure at higher level of resolution, hard to reach
with other types of markers. An SNP marker is a single base change in a DNA sequence, with
two possible nucleotides at a given position (Vignal et al., 2002).
A great advantage of the SNPs with respect to other markers is their possibility to make high
throughput analyses at a relatively low-cost and, as they are uniformly distributed over the
whole genome, the estimation of genetic diversity across the genome is expected to be more
informative of the processes involved. In livestock, SNP markers have been widely used to
analyze genetic histories of bovine populations (Gibbs et al., 2009; Gautier et al., 2010). The

General Introduction
42
SNP markers have also been used for the analysis of genetic diversity and genetic structure,
as well as for QTL analysis and genomic selection (Bovine HapMap Consortium, 2009).
In recent years, new generation of sequencing technologies usually referred to as “second
generation” or “next generation” sequencing technologies, from Illumina/Solexa,
ABI/SOLiD, Roche's 454 and Helicos offer represents a promise for marker discovery due to
their ability to generate large amounts of sequence data (Morozova & Marra, 2008). These
instruments have been extensively used for genome sequencing, re-sequencing and SNP
discovery (Morozova & Marra, 2008). The most effective way to genotype large numbers of
SNPs is trough desining high-density assay that includes tens of thousands of SNPs
distributed throughout the genome. These SNP “chips” are a valuable resource for genetic
studies in livestock species (Meuweissen et al., 2001; Matukumalli et al., 2009). To date,
high-density SNP chips are available for bovine cattle (http://www.illumina.com;
http://www.affymetrix.com)
The availability of the SNPs markers allows tracking genomic regions that, as consequence of
domestication and artificial selection of the animals for their economic or morphological
characteristics, have left as a variety of imprints (Purfield et al., 2017). Recent studies are
focused on searching for contiguous lengths of homozygous genotypes that are present in an
individual due to parents transmitting identical haplotypes to their offspring, named Runs of
homozygosity (ROH) (McQuillan et al., 2008; Purfield et al., 2012).
The extent and frequency across the genome of the ROHs allows depicting patterns of
ancestry of an animal and hence of a population. The presence of long ROHs may inform a
recent inbreeding within a pedigree, while the distribution of shorter ROH segments may also
inform on the presence of more ancient relatedness (Purfield et al., 2012). In this sense, as
selection is characterized for reductions in haplotype diversity, the analysis of distribution of
General Introduction
43
the ROH patterns across the genome may provide insights of the patterns of recent or ancient
selective pressure in a population (Pryce et al., 2014; Purfield et al., 2017).
Apart from the identification of ROH, the SNP markers allow detecting a large amount of
polymorphism data that can be used to estimate how happened the selective adaptation
processes, bottlenecks, genetic drifts and migrations affected the variation in different regions
of the genome, this is known as selective sweep or signature of selection (Pritchard et al.,
2010).
Several methodologies have been developed to detect signatures of selection in cattle when,
under pressure of selection a novel genetic variant can be detected at a genomic level by
means of different tests like measuring allele frequencies, an excess in homozygotes, high
frequency of long haplotypes, or by detecting higher genetic differentiation among
populations (Qanbari & Simianer, 2014; Randhawa et al., 2016).


OBJECTIVES


Objectives
47
The main objective of this thesis is to analyze the genetic diversity and genetic structure of
the Mexican Lidia population, and their relative genetic position with respect to the Spanish
Lidia breed, based on four molecular sources of information: autosomal microsatellite
markers, SNP information over the whole genome, Y-chromosome (Microsatellites and
SNPs) and mitochondrial DNA sequences. Besides we wanted to determine whether there are
differences in diversity and structure between the Mexican and the Spanish Lidia populations
and finally to track possible signatures of selection associated to behavioral characteristics in
the Lidia breed.
To achieve this objective we propose the following research design:
First, we used autosomal microsatellite markers to study the genetic diversity and
structure of the Mexican Lidia population and its relationship with the original Spanish
population. We also used Y chromosome DNA markers and mitochondrial DNA
sequences to explore the maternal and paternal influences of the Mexican population.
Then we used autosomal SNPs selected from the 50K Beadchip to perform two
studies. In the first, we selected a panel of 573 SNPs to explore the genomic diversity
and structure of the Mexican population. In the second study we used a panel of 37,148
SNPs to analyze the same parameters, comparing them with Spanish autochthonous and
American native cattle breeds. Besides, we explored the distribution of the ROHs in
these populations.
Finally, we used information provided by the SNPs to locate genomic regions
associated with aggressive related traits in the Lidia breed, using two Spanish tamed
breeds as a reference. We also identified putative candidate genes mapping within these
regions in order to understand the evolutionary mechanisms of the Lidia breed.


PUBLICATIONS


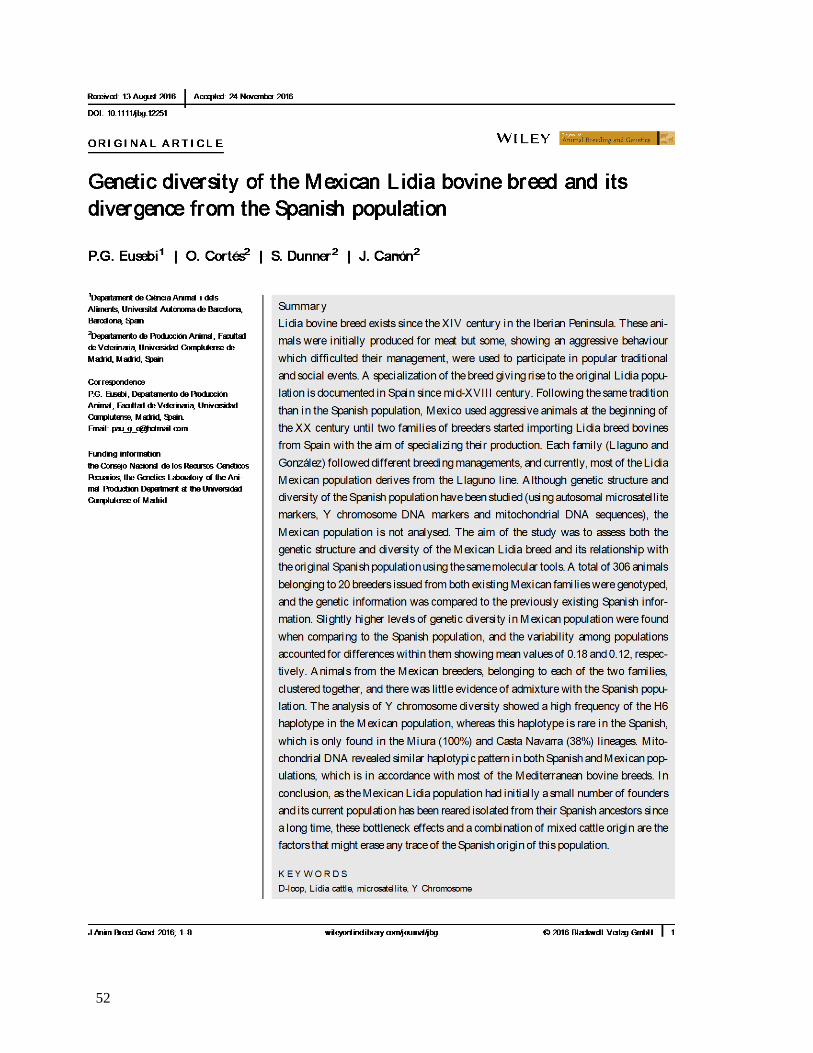
Genetic Diversity of the Mexican Lidia Bovine
Breed and its divergence from the Spanish
Population
Paulina G. Eusebi, Cortés O., Dunner S., Cañón J.
Journal of Animal Breeding and Genetics, 2017 134: 332-339
DOI: 10.1111/jbg.12251
Supplementary information:
http://onlinelibrary.wiley.com/store/10.1111/jbg.12251/asset/supinfo/jbg12251-sup-0001-
Supinfo.docx?v=1&s=6a6cb9f7e60e4a9e39e660656f431939e00a1178
52

53

54

55

56

57

58

59

60

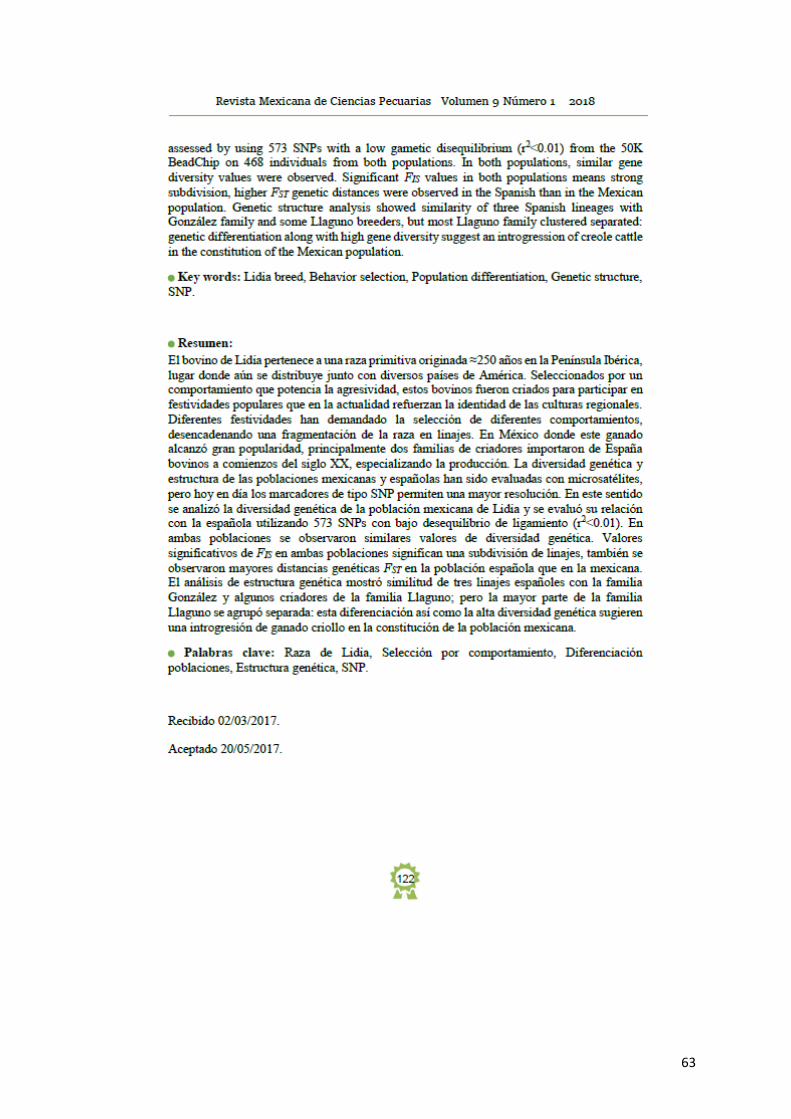
Genetic Diversity Analysis of the Mexican Lidia
Bovine Breed Population and its relation with the
Spanish Population by using a subset of SNPs under
low gametic disequilibrium
Paulina G. Eusebi, Cortés O., Dunner S., Cañón J.
Revista Mexicana de Ciencias Pecuarias. 2018, 9:118-134
DOI: http://dx.doi.org/10.22319/rmcp.v9i1.4393

62
121
http://dx.doi.org/10.22319/rmcp.v9i1.4393
Article
Genetic diversity analysis of the Mexican Lidia bovine breed population
and its relation with the Spanish population by using a subset of SNPs
under low gametic disequilibrium
Análisis de diversidad genética en la población de la Raza de Lidia
Mexicana y su relación con la población española por medio de un panel
de SNPs con bajo desequilibrio gamético
Paulina García Eusebia*,
Oscar Cortés Gardynb,
Susana Dunner Boxbergerb,
Javier Cañón Ferrerasb
a Universidad Autónoma de Barcelona. España.
b Universidad Complutense de Madrid. España.
Autor de correspondencia: [email protected]
Abstract:
Retaining features of the auroch (Bos taurus primigenius), the Lidia bovine is a primitive
breed originated ~250 yr ago in the Iberian Peninsula, where is still distributed, along with
France and several American countries. Selected upon a behavior, which enhances their
aggressiveness; these bovines were raised to participate in popular festivities that nowadays
reinforce the identity of regional cultures. Different festivities demanded diverse behavior
patterns, prompting a fragmentation of the breed into small lineages. In Mexico, where these
bovines reached high popularity, mainly two families of breeders imported Lidia bovines
from Spain in the early XX century specializing their production either reproducing the new
arrivals among them or realizing systematic crosses with local populations. Genetic diversity
and structure of the Mexican and Spanish Lidia populations has been assessed with
microsatellite data, but nowadays SNP molecular markers allows higher resolution level.
Genetic diversity of the Mexican and Spanish Lidia populations and their relationship were
63

64
Revista Mexicana de Ciencias Pecuarias Volumen 9 Número 1 2018
123
Introduction
Possessing multiple ancient features of their earliest forms originated from the auroch (Bos
taurus primigenius), and distinguished by its extensive management(1), the Lidia bovine is a
primitive breed whose roots can be traced back to approximately 250 yr ago in the Iberian
Peninsula in order to satisfy a demand of cattle destined to participate in popular spectacles.
At present, shows involving cattle are found in geographical areas comprising mainly the
southwest region of Europe (Italy, France, Spain and Portugal) and along the American
continent involving approximately 14 countries(2). These kinds of spectacles have their
origins in the early Mediterranean civilizations, where bovines of untamed behavior, lacking
of docile temperament, participated in ceremonies and rituals as an assigned symbol of the
nature´s strength(3). After, in the 13th Century those practices evolved into social events called
tauromachies or “tauromaquias”, a term that makes reference of a cultural and subjective
representation of all types of games involving cattle and not as a single term for identifying
one single practice (since sometimes the term is associated exclusively with the Spanish
bullfight or “corrida”). To date, tauromaquias assemble a social and semantic construction,
are an important livestock economic source and reinforce local and regional identities of the
countries where are still found(2,4). Diversity in orography and climate along with historical
factors and traditions, led place to the development of different variants of bovine
populations. There all were selected based upon behavioral performance of aggressiveness:
the Andalusian and Navarro-Aragonese that in Spain gave rise to the original Lidia breed
population, in Portugal the Lidia Portuguese breed and in France the Landaise and
Camargue’s cattle populations(5).
The specialization and intensification of animal husbandry did not take place until ~250 yr
ago with the emergence of many specialized breeds during the industrial revolution. In Spain,
to become breeder of this type of cattle provide more status to the members of aristocracy
and gentry, who in search of improving the behavioral skills of their “aggressive” bovines
developed a documented breeding system, giving rise to the original Lidia breed
population(4,6). Moreover, these breeders concerned about raising bovines that could be
distinguished for performing different type of behavior (sometimes demanded for the
different type of festivities) established closed family trees that prompted to a fragmentation
of the racial group into small lineages(7).
In America, specifically in Mexico, bovines with these behavioral characteristics were
imported during the colonial period (after the conquest of the Aztec empire in 1521) to take
part in the festivities that were inherited as traditions of the Spanish colonizers(2). The Lidia
breed specialization began between 1908 and 1912 when mainly two families of breeders
(Llaguno and González) imported a reduced number of Spanish Lidia bovines. Each family

65
Revista Mexicana de Ciencias Pecuarias Volumen 9 Número 1 2018
124
kept different breeding strategies, the Llaguno family followed a closed breeding scheme
reproducing the new imported animals among them, and the González family reproduced the
imported animals with local Mexican bovines selected for aggressiveness(8).
Mexican Lidia census suffered dramatic losses during the post-revolution period, which
lasted ten years (1910-1920). After those years, breeders recovered their Lidia production
opting for raise cattle that derived either from the Llaguno or González families. In recent
years, during 1996 and 1997, some Mexican breeders imported close to 1,000 Spanish Lidia
bovines before closing borders of importations from Spain(9). To date, this recent refreshment
suggests a strong impact in the genetic structure of the herds belonging from the breeders
that took part in those importations. But still, the major part of the Mexican Lidia population
derives from the elder Llaguno and González families(8). Despite both Mexican and Spanish
Lidia populations are demographically well stablished, their low effective population size
places them at risk of extinction(7).
Previous studies on the Spanish Lidia population found a genetic uniqueness in the breed,
which is given by a high genetic differentiation between lineages(6). Moreover, Eusebi et al(10)
studied the genetic diversity of the Mexican Lidia population and its divergence from the
Spanish Lidia population and found high genetic differentiation among them. However, both
studies have been conducted by using neutral autosomal microsatellites, and recently, the
availability of SNP panels allow the investigation of livestock genetic diversity and genetic
structure at higher level of resolution, hard to reach with other types of markers.
In this study, a subset of 573 SNPs with low gametic disequilibrium were selected from the
50K medium density genotyping array (Illumina Inc., San Diego, CA) to assess the genetic
diversity and structure of the Mexican and Spanish Lidia populations and thereafter analyze
the relationships among these two populations, in order to explore the degree of admixture
among them.
Material and methods
Blood samples of 468 Lidia bovines were collected: 119 belonging to the Mexican population
and 349 to the Spanish population. Classification of the Spanish lineages was given according
to Cañón et al(6) and, for the Mexican Lidia population the samples arise from 20 breeders
studied independently but classified into the family that they belong to (González or

66
Revista Mexicana de Ciencias Pecuarias Volumen 9 Número 1 2018
125
Llaguno), according to standards set by the by the Mexican Lidia Breeders Association(9).
More information is available in Table1.
Table 1. Description of the Mexican and Spanish populations (Pop) analyzed by SNP
markers, providing names of breeders, their acronyms, number of breeders (NB) and (N)
number of samples analyzed
Pop Family Name Acronym NB N Pop Name Acronym NB N
ME
XIC
O
Lla
gu
no
Celia
Barbabosa BAR
1 6
SP
AIN
Albaserrada ALB 3 14
Boquilla del
Carmen BOQ
1 6 Anastasio Martín ANA 1 6
Corlomé CRL 1 6 Antonio Pérez ANT 1 9
Los Encinos ENC 1 5 Araúz de Robles ARA 1 10
Fernando de la
Mora FER
1 6
Atanasio
Fernández ATA 3 14
Garfias GAR 1 6 Baltasar Iban BAL 2 12
La Antigua IGU 1 6 Carlos Núñez CAR 4 9
San José JOS 1 6 Santa Coloma COL 8 36
Marrón MAR 1 6 Contreras CON 3 10
San Mateo MAT 1 6 Conde de la Corte COR 1 10
Montecristo MON 1 6 José Marzal CRM 1 9
Reyes Huerta REY 1 6 Cuadri CUA 1 7
Fermín Rivera RIV 1 6 Domecq DOM 5 29
Teófilo Gómez TEO 1 6 Félix Gómez FEL 1 9
Torreón de
Cañas TOR
1 6 Gamero Cívico GAM 3 16
Xajay XAJ 1 6 Hidalgo Barquero HID 3 15
Arroyo Zarco ZAR 1 6 Manuel Arranz MAN 1 9
Gon
zále
z Carlos
Castañeda CAS
1 6 Conde de la Maza MAZ 1 3
De Haro HAR 1 6 Miura MIU 1 9
Rancho Seco SEC 1 6 Murube MUR 4 16
Pablo Romero PAB 1 9
Pedrajas PED 2 10
Saltillo SAL 3 15
Concha y Sierra SIE 1 10
Urcola URC 1 7
Veragua VER 2 16
Vega Villar VEG 4 17
Marqués de
Villamarta VIL 2 13
Animals were randomly chosen according to their origin, and qualified veterinarians
collected the samples during routine practices in the framework of official programs aimed
at applying preventive medicine. Blood samples were maintained in Magic Buffer® DNA

67
Revista Mexicana de Ciencias Pecuarias Volumen 9 Número 1 2018
126
solution(11) until DNA extraction by standard phenol/chloroform methods(12). Genotypes
were obtained with the Illumina 50k BeadChip (Illumina Inc., San Diego, CA) and SNP
quality was analyzed with the Genome Studio software (Illumina). Thereupon, by using the
PLINK software(13) the dataset of SNPs was filtered according to the following excluding
criteria: SNPs located on sexual chromosomes; individuals with >20% missing genotypes;
SNPs with a minimum allele frequency <0.01; markers that did not match Hardy-Weinberg
equilibrium expectations (P<10-6); and a restricted linkage disequilibrium criterion of
r2<0.01; thus assuring low gametic disequilibrium rate among markers. Finally, the
information derived from 573 SNPs spanning across all the bovine autosomal chromosomes,
were selected.
Statistical estimates of genetic diversity were performed followed by a multifactorial
correspondence analysis estimated to quantify genetic diversity; these analyses were carried
out with the GENETIX v.4.0.5 software(14). The proportion of mixed ancestries among
populations was inferred with STRUCTURE v.2.1. software(15) which uses a hierarchical
Bayesian model to infer a population structure from multilocus genotypes and assign each
individual into that supposed population, assuming that each individual may have mixed
ancestry from different underlying populations. The figurative number of populations or
genetic clusters (K) ranged from 2 to 4 with six replicate chains for each value of K. The
runs sharing maximum likelihood pattern were selected to be displayed in a graphic
constructed with the DISTRUCT v.1.1. software(16).
Results
Genetic diversity
Indicators of genetic diversity estimated per population (Mexican and Spanish) and
inbreeding FIS estimates are shown in Table 2. In the analysis of the Mexican population,
observed (Ho) and expected heterozygosities (He) ranged from 0.35 (Carlos Castañeda) to
0.48 (Teófilo Gómez) and from 0.35 (Marrón and de Haro) to 0.42 (San José, Fermín Rivera
and Teófilo Gómez) respectively. Genetic diversity values from the completely Mexican
population were 0.46 (He), 0.43 (Ho). Regarding FIS estimates, most of the breeders
presented negative values, with estimates that fluctuated from -0.17 (Corlomé) to 0.09
(Boquilla del Carmen) and a FIS of 0.06 was obtained when the whole Mexican population
was considered. Moreover, genetic diversity indicators in the Spanish population revealed a
wider range of values compared to the Mexican population. With He estimates that goes from
0.26 (Cuadri) to 0.44 (Santa Coloma) and Ho ranging from 0.33 (Gamero Cívico) to 0.46
(Anastasio Martín and José Marzal). Genetic diversity values for the whole Spanish

68
Revista Mexicana de Ciencias Pecuarias Volumen 9 Número 1 2018
127
population were 0.48 for He and 0.38 of Ho, and FIS values going from -0.13 (Manuel Arranz)
to 0.19 (Santa Coloma), thus evidencing a clear lineage subdivision.
Table 2. Genetic diversity parameters of the Mexican and Spanish Lidia breed populations:
expected (He) and observed (Ho) heterozigosities, and FIS inbreeding and significance
(*P<0.01)
Pop Family Acronym He Ho F IS Pop Acronym He Ho F IS
ME
XIC
O
Lla
gu
no
BAR 0.39 0.46 -0.09*
SP
AIN
ALB 0.33 0.34 0.03*
BOQ 0.38 0.38 0.09* ANA 0.38 0.46 -0.12*
CRL 0.38 0.48 -0.17* ANT 0.36 0.39 -0.05*
ENC 0.39 0.41 0.07* ARA 0.32 0.37 -0.11*
FER 0.40 0.46 -0.07* ATA 0.38 0.38 0.05*
GAR 0.36 0.42 -0.04* BAL 0.38 0.40 -0.01
IGU 0.41 0.43 -0.04* CAR 0.41 0.42 0.02
JOS 0.42 0.45 0.04* COL 0.44 0.37 0.19*
MAR 0.35 0.40 0.02 CON 0.38 0.38 0.04*
MAT 0.37 0.43 -0.06* COR 0.34 0.38 -0.06*
MON 0.39 0.45 -0.06* CRM 0.39 0.46 -0.11*
REY 0.38 0.44 -0.05* CUA 0.26 0.30 -0.10*
RIV 0.42 0.44 -0.07* DOM 0.41 0.39 0.08*
TEO 0.42 0.48 -0.06* FEL 0.35 0.37 -0.01
TOR 0.40 0.45 -0.06* GAM 0.39 0.33 0.20*
XAJ 0.39 0.44 -0.04* HID 0.40 0.37 0.12*
ZAR 0.36 0.41 -0.02 MAN 0.34 0.41 -0.13*
Gon
zále
z CAS 0.30 0.35 -0.07* MAZ 0.40 0.43 0.13*
HAR 0.35 0.40 -0.07* MIU 0.34 0.39 -0.07*
SEC 0.38 0.44 0.06* MUR 0.39 0.36 0.11*
Value of the whole population 0.46 0.43
0.06 PAB 0.31 0.35 -0.06*
PED 0.37 0.35 0.11* SAL 0.39 0.38 0.06* SIE 0.37 0.41 -0.06* URC 0.37 0.41 -0.02 VEG 0.39 0.34 0.15* VER 0.43 0.44 0.00
VIL 0.41 0.42 0.02
Value of the whole population
0.48
0.38
0.21
FST genetic distances were estimated among breeders within breeders (Mexico) and among
lineages (Spain) by analyzing each population independently, followed by a second
estimation of FST genetic distances including both, Mexican and Spanish populations (Table
69
Revista Mexicana de Ciencias Pecuarias Volumen 9 Número 1 2018
128
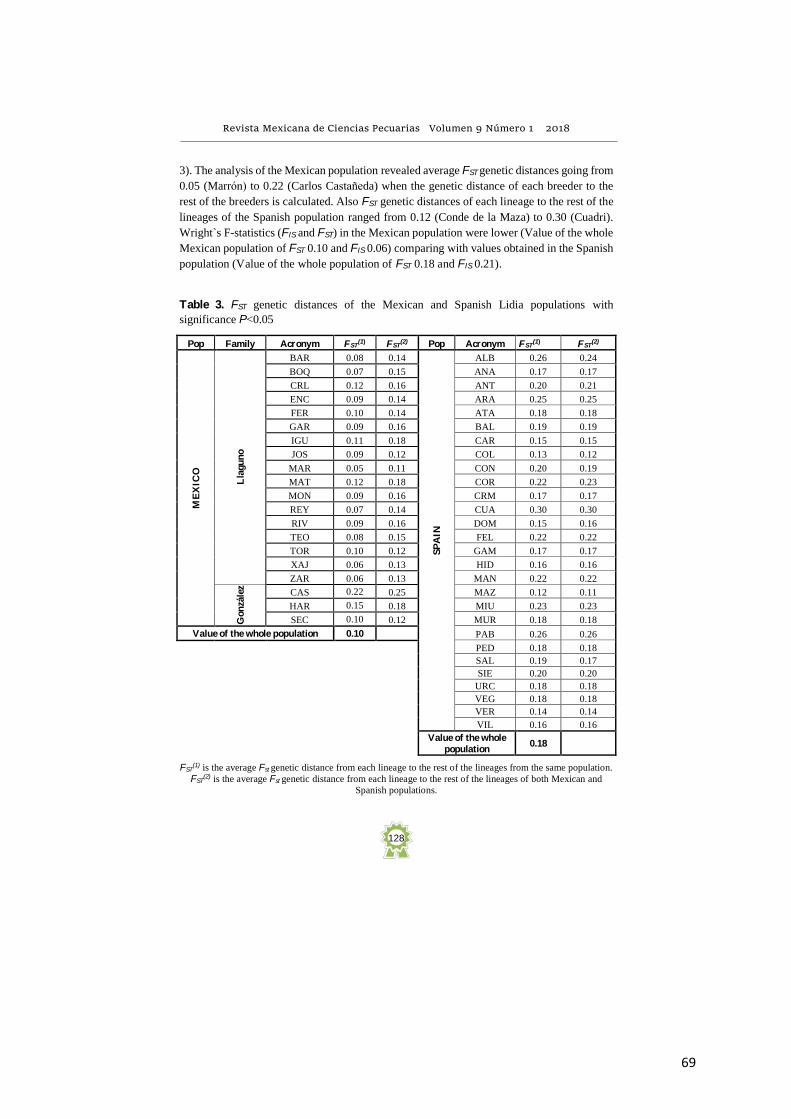
3). The analysis of the Mexican population revealed average FST genetic distances going from
0.05 (Marrón) to 0.22 (Carlos Castañeda) when the genetic distance of each breeder to the
rest of the breeders is calculated. Also FST genetic distances of each lineage to the rest of the
lineages of the Spanish population ranged from 0.12 (Conde de la Maza) to 0.30 (Cuadri).
Wright`s F-statistics (FIS and FST) in the Mexican population were lower (Value of the whole
Mexican population of FST 0.10 and FIS 0.06) comparing with values obtained in the Spanish
population (Value of the whole population of FST 0.18 and FIS 0.21).
Table 3. FST genetic distances of the Mexican and Spanish Lidia populations with
significance P<0.05
Pop Family Acronym FST(1) FST
(2) Pop Acronym FST
(1) FST(2)
ME
XIC
O
Lla
gu
no
BAR 0.08 0.14
SP
AIN
ALB 0.26 0.24
BOQ 0.07 0.15 ANA 0.17 0.17
CRL 0.12 0.16 ANT 0.20 0.21
ENC 0.09 0.14 ARA 0.25 0.25
FER 0.10 0.14 ATA 0.18 0.18
GAR 0.09 0.16 BAL 0.19 0.19
IGU 0.11 0.18 CAR 0.15 0.15
JOS 0.09 0.12 COL 0.13 0.12
MAR 0.05 0.11 CON 0.20 0.19
MAT 0.12 0.18 COR 0.22 0.23
MON 0.09 0.16 CRM 0.17 0.17
REY 0.07 0.14 CUA 0.30 0.30
RIV 0.09 0.16 DOM 0.15 0.16
TEO 0.08 0.15 FEL 0.22 0.22
TOR 0.10 0.12 GAM 0.17 0.17
XAJ 0.06 0.13 HID 0.16 0.16
ZAR 0.06 0.13 MAN 0.22 0.22
Gon
zále
z
CAS 0.22 0.25 MAZ 0.12 0.11
HAR 0.15 0.18 MIU 0.23 0.23
SEC 0.10 0.12 MUR 0.18 0.18
Value of the whole population 0.10 PAB 0.26 0.26
PED 0.18 0.18
SAL 0.19 0.17
SIE 0.20 0.20
URC 0.18 0.18
VEG 0.18 0.18
VER 0.14 0.14
VIL 0.16 0.16
Value of the whole population
0.18
FST(1) is the average Fst genetic distance from each lineage to the rest of the lineages from the same population.
FST(2) is the average Fst genetic distance from each lineage to the rest of the lineages of both Mexican and
Spanish populations.

70
Revista Mexicana de Ciencias Pecuarias Volumen 9 Número 1 2018
129
Population relationships and clustering
The Bayesian approach implemented in STRUCTURE software(15) was used to analyse the
clustering and genetic relationship among both Mexican and Spanish populations, acronyms
are stated as defined in Table 1, displaying names of the breeders and their belonging family
of the Mexican population, and names of the lineages of the Spanish population. The
contribution of the assumed ancestral populations is graphically presented in Figure 1, with
K populations going from 2 to 4.
Figura 1. Analysis of the genetic structure of the Mexican breeders and the Spanish lineages,
the plot shows common genetic ancestors, or model based population assignments (K), for
values going from from k=2 (upper) to k=4 (lower)
The acronyms are as defined in Table 1 and each acronym encloses the number of breeders belonging to each
lineage.
In the Mexican population, from k=2 to k=4 a single ancestral population is observed in most
of the breeders of the Llaguno family (Gar, Igu, Boq, Mat, Mon, Zar, Riv, Rey, Bar, Teo, Xaj
and Mat), with a clear separation between González and Llaguno families. Mixed
contributions with some of the Spanish lineages (Alb, Sal and Col) are observed in all of the
Spain
Vil
Mu
r
Sal
Col
Ver
Alb
Hid
Urc
Do
m
Ata
Miu
Gam
Bal
Co
r
An
t
Crm
Car
Ara
Pab
Fel
Maz
An
a
Ped
Man
Sie
Veg
Con
Cu
a
M exico
K =2
K =3
K =4
Llaguno González
To
r
Teo
Xaj
Bar
Fer
Crl
Jo
s
Sec
Cas
Har
Gar
Bo
q
Mo
n
Rey
En
cM
ar
Mat
Zar
Riv
Igu
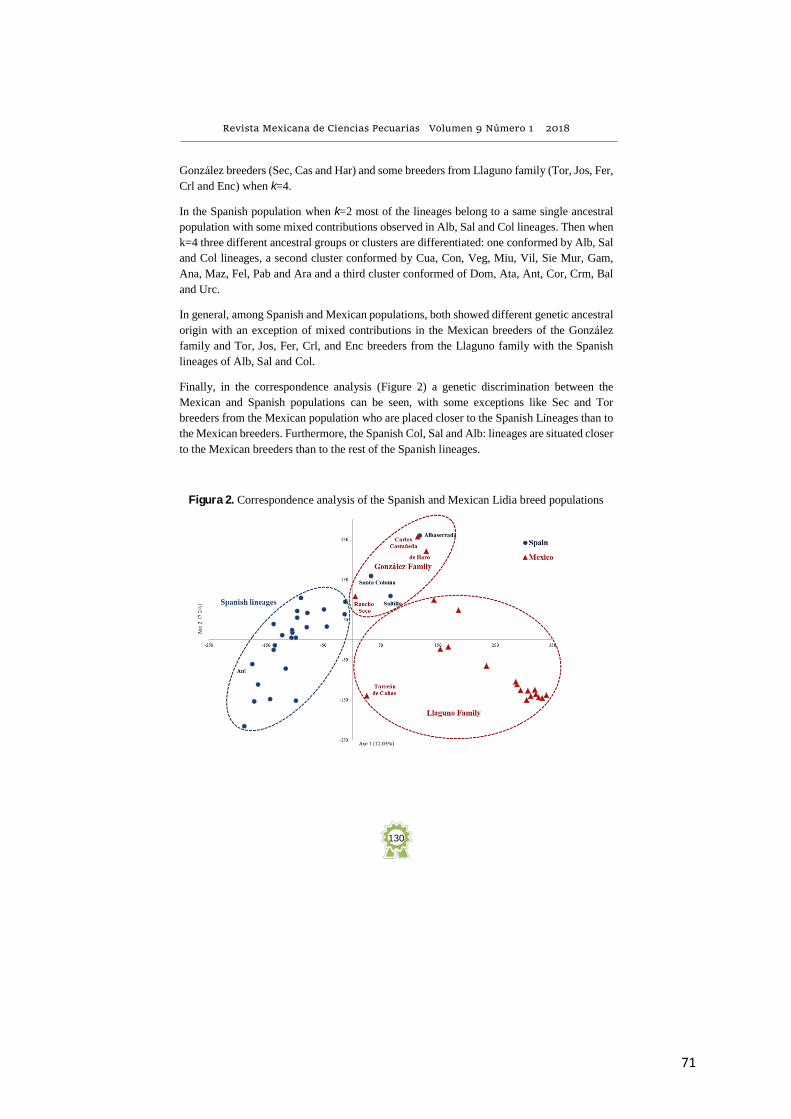
71
Revista Mexicana de Ciencias Pecuarias Volumen 9 Número 1 2018
130
González breeders (Sec, Cas and Har) and some breeders from Llaguno family (Tor, Jos, Fer,
Crl and Enc) when k=4.
In the Spanish population when k=2 most of the lineages belong to a same single ancestral
population with some mixed contributions observed in Alb, Sal and Col lineages. Then when
k=4 three different ancestral groups or clusters are differentiated: one conformed by Alb, Sal
and Col lineages, a second cluster conformed by Cua, Con, Veg, Miu, Vil, Sie Mur, Gam,
Ana, Maz, Fel, Pab and Ara and a third cluster conformed of Dom, Ata, Ant, Cor, Crm, Bal
and Urc.
In general, among Spanish and Mexican populations, both showed different genetic ancestral
origin with an exception of mixed contributions in the Mexican breeders of the González
family and Tor, Jos, Fer, Crl, and Enc breeders from the Llaguno family with the Spanish
lineages of Alb, Sal and Col.
Finally, in the correspondence analysis (Figure 2) a genetic discrimination between the
Mexican and Spanish populations can be seen, with some exceptions like Sec and Tor
breeders from the Mexican population who are placed closer to the Spanish Lineages than to
the Mexican breeders. Furthermore, the Spanish Col, Sal and Alb: lineages are situated closer
to the Mexican breeders than to the rest of the Spanish lineages.
Figura 2. Correspondence analysis of the Spanish and Mexican Lidia breed populations

72
Revista Mexicana de Ciencias Pecuarias Volumen 9 Número 1 2018
131
Discussion
High gene diversity values were found in both the Spanish (0.48) and the Mexican
populations (0.46). This value obtained in the Mexican population is remarkable, since lower
gene diversity values were expected to obtain considering that, most of the current Mexican
population arose from a few individuals of the Spanish Lidia population. On the contrary,
similar diversity values were observed in both populations, so it is reasonable to consider
certain degree of introgression with local Creole cattle populations of diverse origin during
the establishment of the Mexican Lidia breed population.
Moreover, significant FIS (P<0.01) values were observed in both populations which means a
subdivision within each, higher (0.21) in the Spanish than in the Mexican population (0.06).
This subdivision in lineages or breeders results in the preservation of more genetic
variance(17), but a faster loss of genetic diversity within sub-population can be expected.
Additionally, a loss of diversity due to population bottlenecks and founder effects result in
increased inbreeding, resulting that the preservation of heterozygosity in the whole
population is at the expense of a progressive poor genetic health within each sub-population.
Genetic diversity analysis revealed significantly higher genetic distances (P<0.05) in the
Spanish population compared to the genetic distances of the Mexican population, with whole
population FST values of 0.18 and 0.10 respectively (Table 3). Similar results were observed
by Eusebi et al(10) with data obtained with microsatellite markers. In the Mexican population
the lower genetic distances among breeders means higher animal exchangeability, a common
practice in Mexico and less usual in Spain, where higher genetic distances between lineages
were obtained, thus explained by higher genetic isolation among lineages.
Furthermore, genetic structure analysis revealed in both, Correspondence and Bayesian
clustering analysis a clear separation among families (González and Llaguno) of the Mexican
population and in the Spanish population three clusters are observed at k=4. The cluster with
Albaserrada (Alb), Saltillo (Sal) and Santa Coloma (Col) is placed closer (correspondence
analysis) and share genetic structure with the Mexican González family and some Llaguno
breeders (Tor, Crl, Jos and Enc), leaving clearly differentiated the remaining Llaguno
breeders. This similarity of Spanish Alb, Sal and Col lineages with the above mentioned
González family and the few Llaguno breeders is not surprising, given the fact that those
breeders were involved in the imports of 1996 and 1997, introducing mainly animals from
Santa Coloma (Col) and in lesser extent Saltillo (Sal) and Vega Villar (Veg)(8). But it is worth
to note the proximity of Albaserrada (Alb) lineage to the Mexican population, since

73
Revista Mexicana de Ciencias Pecuarias Volumen 9 Número 1 2018
132
Albaserrada herds have been raised under strict closed breeding schemes from 1912
onwards(18). This genetic closeness is explained by two similar historical and genetical
phenomenons’ as Albaserrada lineage derive from Saltillo and Santa Coloma lineages(6) and
in parallel, those similar Mexican breeders constructed their herds by mating animals from
the same lineages as ancestors.
A deeper analysis of the Mexican population structure revealed that anthropogenic barriers
are well documented drivers of the genetic differentiation observed among breeders (e.g., the
clear genetic division observed between the González and Llaguno families). Both families
where located respectively in the North and south central regions of Mexico and became
much like hegemony of Lidia cattle, being in charge to supply Lidia cattle to emerging
farmers in their regions. In addition, both families’ bovines did not mix each other(8),
confirming the different genetic origin among them.
Conclusions and implications
Isolation along with a small founder population size shaped by a classic bottleneck effect can
explain the differentiation of the Llaguno Family of the Mexican population from the Spanish
Lineages of which it arose. To all this, a possible introgression of Creole Cattle populations
located at the north and south central regions of Mexico(19) could explain this gain of
diversity. A trace-back analysis of the extant cattle populations in those regions could be
footprints in the way to explain the major ancestors of the Mexican Llaguno family.
Acknowledgements
Thanks to the Lidia breeders associations of Mexico, Spain and to all the breeders who kindly
provided the biological material used in this study. Financial support received by the Consejo
Nacional de los Recursos Genéticos Pecuarios and Consejo Nacional de Ciencia y
Tecnología from México and by the Genetics Laboratory of the Animal Production
Department at the Universidad Complutense of Madrid is deeply acknowledged. Finally
thanks to Hannah Colder for her English interpretation and translation services.

74
Revista Mexicana de Ciencias Pecuarias Volumen 9 Número 1 2018
133
Cited literature
1. Wilson DE, Reeder DM editors. Mammal species of the world: a taxonomic and
geographic reference. JHU Press; 2005.
2. Maudet JB. Terres de taureaux: les jeux taurins de L´Europe à L´Amerique. Madrid:
Casa de Velázquez; 2010.
3. Felius M, Beerling ML, Buchanan DS, Theunissen B, Koolmees PA, Lenstra JA. On the
history of cattle genetic resources. Diversity 2014;6(Suppl 4):705-750.
4. Saumade F. Des sauvages en Occident: les cultures tauromachiques en Camargue et en
Andalousie. France: Éditions de la Maison des sciences de l’homme; 2014.
5. Digard JP. L'homme et les animaux domestiques: anthropologie d'une passion Paris:
Fayard; 1990:151-179.
6. Cañón J, Tupac-Yupanqui I, Garcia-Atance MA, Cortés O, Garcia D, Fernandez J,
Dunner S. Genetic variation within the Lidia bovine breed. Anim Genet 2008;39:439-
445.
7. Cortés O, Sevane N, Baro JA, Cañón J. Pedigree analysis of a highly fragmented
population, the Lidia cattle breed. Livest Sci 2014;167:1-8.
8. Niño de Rivera L. Sangre de Llaguno, la razón de ser del toro bravo mexicano. México:
Punto de Lectura. 2004.
9. ANCTL. Asociacion Nacional de Criadores de Toros de Lidia. México. 2016.
10. Eusebi PG, Cortés O, Dunner S, Cañón J. Genetic diversity of the Mexican Lidia bovine
breed and its divergence from the Spanish population. J Anim Breed Genet 2017: 332-
339.
11. Dunner S. Cañón J. Solution for the indefinite maintenance of nucleic acids in the cell
of origin thereof. 2006: Patent WO 2006/040376.
12. Sambrook J, Fritsch EF, Maniatis T. Molecular cloning: A laboratory manual. 2nd ed.
NY, USA: Cold Spring Harbor Laboratory Press; 1989.
13. Purcell SM, Neale B, Todd-Brown K, Thomas L, Ferreira M, et al. PLINK: A tool set
for whole-genome association and population-based linkage analyses. Am J Human
Genet 2007;81:559-575.
75
Revista Mexicana de Ciencias Pecuarias Volumen 9 Número 1 2018
134
14. Belkhir K, Borsa P, Chikhi L, Raufaste N, Bonhomme F. GENETIX 4.05, logicielsous
Windows TM pour la génétique des populations. Laboratoire Génome, Populations,
Interactions CNRS.UPR. 9060. 1996;5000:1996-2004.
15. Pritchard JK, Stephens M, Donnelly P. Inference of population structure using
multilocus genotype data. Genetics 2000;155:945-59.
16. Rosenberg NA. Distruct: a program for the graphical display of population structure.
Mol Ecol Notes 2004;4:137-138.
17. Wright S. The genetical structure of populations. Ann Eugen 1951;15: 323-354.
18. Martín GV. Victorino por Victorino. Madrid: Espasa Libros. 2000.
19. Censo Agrícola, Ganadero y Forestal 2007. INEGI. http://www.inegi.org.mx.
Consultado Dic 15, 2016.

76

DETECTION OF -SELECTION SIGNATURES FOR
AGONISTIC BEHAVIOR IN CATTLE
Paulina G. Eusebi, Cortés O., Carleos C. , Dunner S., Cañón J.
Journal of Animal Breeding and Genetics (In press)

78

79

80

81

82

83

84

85

86

COMPLEMENTARY DOCUMENTATION

88

Genomic diversity and population structure of the
Mexican and Spanish bovine Lidia breed
Paulina G. Eusebi, Cortés O., Dunner S., Cañón J.
Animal Genetics. 2017. 48(6), 682-685
DOI: 10.1111/age.12618
Supplementary information:
http://onlinelibrary.wiley.com/store/10.1111/age.12618/asset/supinfo/age12618-sup-0001-SupInfo.docx?v=1&s=14751c95a5570614a3f566ec73d2edf37cdb3af8

90

91

92

93


GENERAL DISCUSSION


General discussion
97
Herein we provide a genomic analysis of the Mexican Lidia breed, a unique population likely
founded by a few individuals of the original Spanish Lidia population. Our work conclusively
shows that the Mexican population shares few common genetic origins with the hypothetical
original population, which led us to propose new hypothesis about the genetic origins of the
Mexican population, whose genetic resources are valuable to address the challenge of the
genetic improvement of the Lidia breed.
We also studied the possible existence of genomic regions affected by selection for agonistic
behavior related traits, whose is the selection target of the Lidia breed, and compared it with
two tamed Spanish breeds as a reference. The results allowed identifying selected genomic
regions in the Lidia breed containing genes putatively associated to behavioral features.
1. The genetic diversity of the Mexican Lidia breed
The results of the genetic diversity parameters analyzed with data derived from microsatellite
and SNP molecular markers revealed, in general, similar genetic diversity values in both the
Mexican and Spanish Lidia populations. The medium number of alleles (MNA) obtained
with the microsatellite data in the Mexican population ranged from 3.4 to 5.4 (average of
4.4), similar to the Spanish lineages that ranged from 3.1 to 6.9 (average of 4.8). These values
are lower than the observed by Cymbron et al. (2005), who worked with a pool of North
European commercial cattle breeds analyzed with a panel of 20 microsatellites, and detected
an average value of 7.97 MNA, and also with a pool of Mediterranean cattle breeds, finding
an average value of 7.62 MNA. However, when each of these breeds was analyzed
individually, the MNA ranged from 3.8 to 4.9 (Cymbron et al., 2005), placing the Lidia breed
in general (including both, the Mexican and Spanish populations) within the range of these

General discussion
98
European breeds. Curiously, the values of MNA in four Mexican creole herds, analyzed with
a panel of 19 microsatellites, ranged from 6.68 to 8.3 (Ginja et al., 2013).
In terms of heterozygosity, the results were in a similar situation than the observed with the
values of MNA. The mean values of expected heterozygosities were alike in both, the
Mexican and the Spanish populations, using the two types of genetic markers (Table 2),
being slightly higher the results obtained with the microsatellite data than the values obtained
with SNPs. The statistical power per locus was higher in microsatellite markers than in the
SNPs because their higher polymorphism, while typically SNPs have just two alleles per
locus, in which case heterozygosity cannot exceed values of 0.5. Comparing the efficiency to
detect genetic diversity of both types of genetic markers, microsatellite loci are more
informative because of their greater extent of polymorphism, but SNPs have the advantage of
being much more abundant and thus, have more power to infer differences in genetic
summary statistics than the data obtained with microsatellites (Valï et al., 2008; Coates et al.,
2009; Ciani et al., 2013).
Table 2 Comparison of the expected heterozygosities obtained with the different types of autosomal genetic
markers used: microsatellites and SNPs.
Gene diversity (Hexp)
Population Microsatellite data 573 SNP data 50K SNP data
Over all Spanish lineages 0.61 0.48 0.36
Over all Mexican families 0.62 0.46 0.36
The autosomal gene diversity of the Mexican population differs from what we expected.
Historical data affirms that just a few Lidia animals were imported to Mexico between 1908
and 1912 with the specific purpose of breeding (Scherrer, 1983; Niño de Rivera, 2004).
Before that, the reproduction of the Lidia bovines was not held in an organized way.
The loss of genetic variability is an important aspect in the management of populations since
a genetic impoverishment could ultimately lead a breed or species to extinction. Accodringly,

General discussion
99
we made an analysis to quantify the loss of diversity in origin. We assessed the correlation
between the diversity in origin per lineage and the He estimates and detected low correlation
between these values (0.12). This result is not surprising because, in general, the Lidia breed
has a reproductive system which is focused traditionally on closed breeding schemes, where
the exchange of animals among breeders within lineages, although is less common in Spain
(Cañón et al., 2008), than in Mexico (Eusebi et al., 2017), lead to a high genetic uniformity
within the lineages and a loss of genetic diversity with respect to the diversity in origin.
Assuming simple genetic models of rapid colonization (Olivieri, 2009), we expected to find a
reduction of the genetic variability in the Mexican population as a consequence of both, the
founder and bottleneck effects. Conversely, we detected (with both type of molecular
markers) similar patterns of genetic diversity in the Mexican population when compared to
the original Spanish population.
In terms of FIS, the Mexican population showed similar to lower average values (0.06 with
the 573 selected SNPs and 0.05 with the Microsatellite data) than obtained in the Spanish
population (0.21 with the 573 selected SNP data and 0.12 with the Microsatellite data). When
we analyzed the distribution patterns of the individual inbreeding values within each
population using the 50K SNP data, we found that in the Spanish population 42% of the
variability is explained by the differences of the inbreeding values among lineages, and
conversely, we did not detect significant differences in terms of inbreeding among the two
Mexican families.
The particular racial grouping of the Spanish population must be highlighted to explain the
great differences of the inbreeding variability (42%). There are different levels of gene flow
within lineages; while some lineages are composed of a single herd with reduced population
size e.g. Partido de Resina, Miura, Arauz de Robles or Cuadri, the remaining lineages are
composed by a wide range of herds and besides, the genetic exchange between lineages is
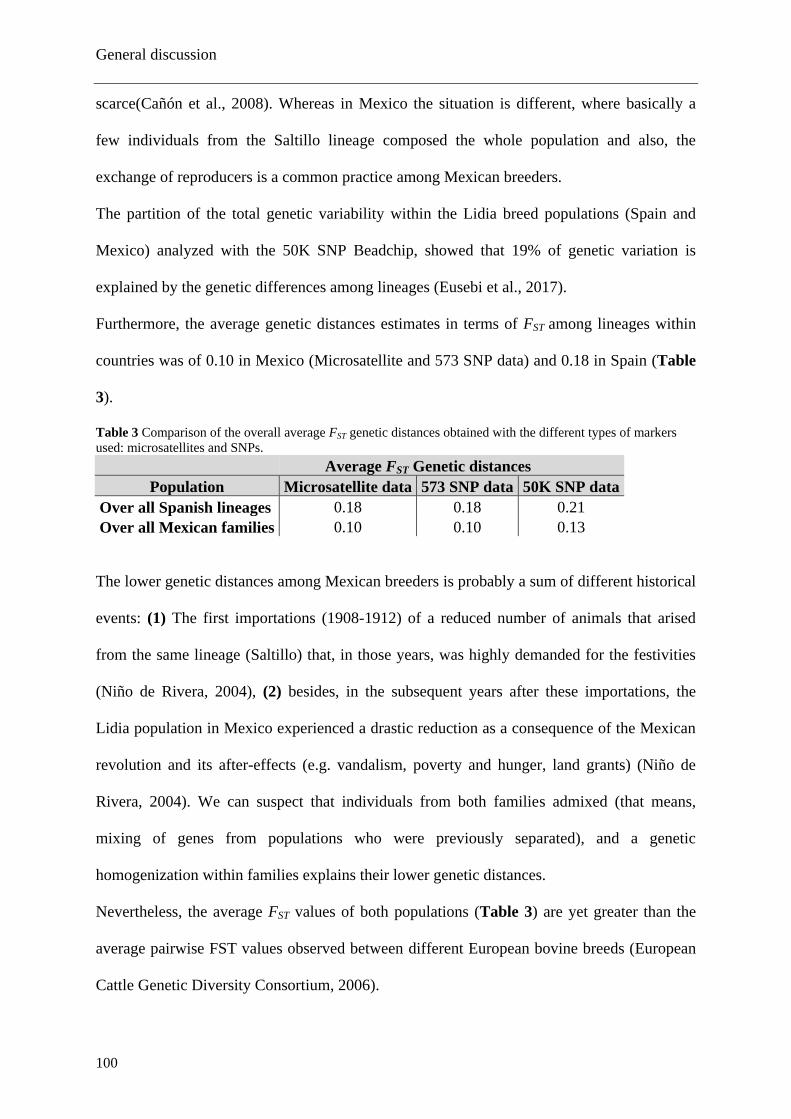
General discussion
100
scarce(Cañón et al., 2008). Whereas in Mexico the situation is different, where basically a
few individuals from the Saltillo lineage composed the whole population and also, the
exchange of reproducers is a common practice among Mexican breeders.
The partition of the total genetic variability within the Lidia breed populations (Spain and
Mexico) analyzed with the 50K SNP Beadchip, showed that 19% of genetic variation is
explained by the genetic differences among lineages (Eusebi et al., 2017).
Furthermore, the average genetic distances estimates in terms of FST among lineages within
countries was of 0.10 in Mexico (Microsatellite and 573 SNP data) and 0.18 in Spain (Table
3).
Table 3 Comparison of the overall average FST genetic distances obtained with the different types of markers
used: microsatellites and SNPs.
Average FST Genetic distances
Population Microsatellite data 573 SNP data 50K SNP data
Over all Spanish lineages 0.18 0.18 0.21
Over all Mexican families 0.10 0.10 0.13
The lower genetic distances among Mexican breeders is probably a sum of different historical
events: (1) The first importations (1908-1912) of a reduced number of animals that arised
from the same lineage (Saltillo) that, in those years, was highly demanded for the festivities
(Niño de Rivera, 2004), (2) besides, in the subsequent years after these importations, the
Lidia population in Mexico experienced a drastic reduction as a consequence of the Mexican
revolution and its after-effects (e.g. vandalism, poverty and hunger, land grants) (Niño de
Rivera, 2004). We can suspect that individuals from both families admixed (that means,
mixing of genes from populations who were previously separated), and a genetic
homogenization within families explains their lower genetic distances.
Nevertheless, the average FST values of both populations (Table 3) are yet greater than the
average pairwise FST values observed between different European bovine breeds (European
Cattle Genetic Diversity Consortium, 2006).
General discussion
101
2. Genetic structure of the Mexican Lidia population
Currently, the use of genetic markers allows estimating ancestries or common genetic origins
of individuals within populations. This is an increasingly important method applied nowadays
because it helps to solve different problems such as: (1) the detection of population structure
(2) defining the number of subpopulations in a sample (3) assigning anonymous individuals
to subpopulations (4) defining the number of ancestral populations in admixed populations
(5) assigning ancestral population proportions to admixed individuals.
The software STRUCTURE (Pritchard et al., 2000) uses a Bayesian clustering approach.
Similarly, the ADMIXTURE (Alexander et al., 2009; Alexander et al., 2011) program uses a
maximum likelihood framework, both software’s aim to infer population genetic structure
and assign individuals ancestry proportions to a K supposed population. Unlike
STRUCTURE, ADMIXTURE is focused on maximum likelihood estimation (MLE) rather
than sampling the posterior distribution using MCMC, and calculates the estimations via a
block relaxation approach, which results in improvements in speed. This computational
efficiency provides an advantage over STRUCTURE when using very large numbers of
markers, for example when using dense SNP data instead of smaller microsatellite panels
(Liu et al., 2013). For this reason we used the ADMIXTURE to analyze the information
provided by the SNPs and STURCTURE to analyze the microsatellite data.
The analyses revealed a considerable genetic differentiation between the Mexican population
and the original Spanish lineages, with the exception of some mixed contributions observed
in a few individuals of the Mexican González and Llaguno families with three Spanish
lineages: Santa Coloma, Saltillo and Marqués de Albaserrada. Although, when we traced
back the origins of those Mexican individuals sharing common genetic origins with the

General discussion
102
Spanish lineages and we found that these animals were admixed with Spanish individuals
from recent importations made at the beginning of the 1990´s (A.N.C.T.L., 2017).
Given the clear genetic differentiation between the Mexican and the Spanish populations,
we hypothesized the introduction of bovines with different genetic origins, like Spanish local
or American creole breeds, all of these potential breeds that could be involved in shaping the
current genetic structure of the Mexican Lidia population. To test this hypothesis we included
additional microsatellite and SNPs genotypic data of these breeds and performed the
respective analyses using STRUCTURE and ADMIXTURE software’s. Although, we did not
detect common genetic ancestry of our Lidia population and the breeds included, and thus
could not provide directions of the ancestry of the Mexican population.
Initially, observing the similarity of the heterozygosity patterns between the Mexican and
Spanish populations and also the different ancestry of both populations, we can argue that
this differentiation can be a consequence of two concomitant and, in a certain way, related
phenomena: a population bottleneck, and a founder effect. The founder effect of the Lidia
Mexican population was strong because of the limited number of Spanish Lidia bovines
firstly introduced at the beginning of the 20th century (Niño de Rivera, 2004).
In the view of the foregoing, we additionally hypothesize the probability of an admixture
with local “Cimarron” genes, as mentioned by Eusebi et al. (2017). In this case we adopted
the term cimarron that is a “run-away” individual that escape from their original environment
and return to its wild state (Maudet, 2010). There are many successful examples of cimarron
bovine populations in America, for example, during the first social disturbs in Texas from
1830 to 1848, about 80% of 100,000-headed cattle in the region returned to their “wild state”
(Jacquin, 2015). Mexican cimarron bovines selected for their aggressiveness can be then, the
source of the genetic divergence of the Mexican Lidia group. Thus, a trace-back looking for
footprints of cimarron genes may provide more information of the ancestry of this lineage.

General discussion
103
3. Analyses of the sex chromosomes
The distribution of the paternal haplogroups in both Lidia populations (Mexican and
Spanish) revealed the presence of the two haplogroups (Y1 and Y2), which coincides with
the geographical distribution of the majority of the northern and southern European Breeds
(Götherström et al., 2005). In the Mexican Lidia breed population three of the ten haplotypes
previously identified in the Spanish population (Cortés et al., 2011) were observed.
A remarkable high frequency of the haplotype H6 was detected in the Mexican population,
with frequencies of 69% and 20% in Llaguno and Gonzalez breeders respectively. This
haplotype was described by Cortés et al. (2008), as exclusive in the Miura lineage (frequency
of 100%) and with a high frequency (38%) in Casta Navarra. The presence of this H6
haplotype in the Mexican population has a plausible explanation, which is a strong paternal
influence of males from the Casta Navarra, whose introduction to Mexico after the conquest
is well documented (Niño de Rivera, 2004). Similarly, the influence of this haplotype in the
total paternal lineage in the Miura lineage is explained by the strong influence of a sire of
Casta Navarra named “Murcielago”, who was a predominant and widely used sire during the
late 19th
century (López del Ramo, 1991), imprinting this haplotype to the whole Miura male
offspring as a classic founder effect.
The analysis of the maternal lineages revealed similar patterns of genetic haplotype
diversity in the Mexican population compared to the observed in the great majority of the
European bovine breeds. The lower mtDNA haplotype diversities of the Mexican population
compared to the observed in the original Spanish population could be due to a combination of
factors, such as (1) a bottleneck effect (2) genetic drift acting on the small population of the
Mexican families. In general, the most common European haplogroup T3 is predominant

General discussion
104
(67%) in the Mexican dataset, similar to the haplotype distribution of the southern European
breeds (Felius et al., 2011). The following high frequency of T1 (17%) is also seen in the
Spanish lineages, and the presence of this haplogroup might be influence of the intense
migrations across the Mediterranean sea, facilitated by the proximity to northern Africa,
where T1 is prevalent (Bonfiglio et al., 2012). The haplogroup T have the smallest
frequencies (3.3%) but yet higher comparing with the Spanish frequency (1.1%).
Our results suggest that, the Mexican mitochondrial gene pool still preserves the genetic
footprints of a different maternal origin that is observed similarly in the Spanish lineages that
gave rise to this population.
4. Analysis of the Runs of Homozygosity
Both Mexican and Spanish Lidia groups displayed similar ROH patterns in terms of total
length of segments, composed mostly of high number of long ROHs (Table 4). The results
were different in the non-Lidia breeds we also analysed in order to assess for possible
admixture patterns of these breeds in the formation of the Lidia breed (Eusebi et al., 2017)
(Details of the Spanish native and American creole groups are defined in the Table S1 of the
annexes).
In the Spanish native breeds group the total length of ROH is composed for a very low
number of large segments and the results were similar in the American creole breeds group,
with some extreme animals observed who had high number of segments (125) (Table 4).

General discussion
105
Table 4 Descriptive statistics of the number and total length of ROH in the genome for the four cattle groups
analyzed. Mean values of the segments and its standard deviation (St.Dv.), and the size of the shortest and
longest segments per group.
We analysed for each of the four groups the number and total length of ROHs and detected
considerable variations across individuals and populations. The Figure 5 illustrates the
number of ROH greater that 1 Mb against the total ROH length obtained in the four
populations.
Figure 5 Relationship between the number of ROH>1 Mb and the total length (Mb) of the genome in
those ROH, from each group.
0
40
80
120
160
0 200 400 600 800 1000 1200 1400 1600
Spanish Lidia
0
40
80
120
160
0 200 400 600 800 1000 1200 1400 1600
Mexican Lidia
0
40
80
120
160
0 200 400 600 800 1000 1200 1400 1600
American-creole
0
40
80
120
160
0 200 400 600 800 1000 1200 1400 1600
Spanish native
Total length in ROH (>1Mb)
Nu
mb
er o
f R
OH
(>
1Mb
)
ROH Group Spanish
Lidia
Mexican
Lidia
Spanish
native American-creole
Number of
ROH
Mean 104 116 43 22
St. Dv. 24.4 27.4 31.1 14.0
Min. 9 46 5 6
Max. 151 162 125 60
Total length
of genome
>1Mb
Mean 736.2 683.9 332.2 160.7
St. Dv. 240.3 221.0 295.9 109.5
Min. 25.1 182.6 8.3 14.3
Max. 1630.0 1264.0 1183.9 438.6

General discussion
106
When we divided ROH lengths into categories (Figure 6), the Mexican Lidia group showed
the highest proportion (63%) of 4-6 Mb ROH length, followed by the Spanish Lidia group
with 59% of 6-8 Mb ROH length. Among the four groups, the Spanish native breeds showed
a greater amount of long ROH (>8 Mb).
Figure 6 Differences between groups of the total length of genome in ROH divided into different length
categories and ROH length.
In general, the Lidia groups have high number and large size of the ROH, the longest
segments (6-8 Mb) detected in the Spanish lineages agree with the higher inbreeding values
detected in terms of both, the FIS and pedigree (Cortés et al., 2014) analysis and is the
consequence of their historical background of the reproduction system followed by the
breeders, based on a traditional closed breeding schemes (Cañón et al., 2008). Overall, the
long homozygous segments throughout the genome has been reported as result of mattings of
close relatives, reduction in population size and selection (Bosse et al., 2012), all of these
factors match perfectly with the description of the Lidia breed populations.
1-2 2-4 4-6 6-8 >80
10
20
30
40
50
60
70 American-creole
Spanish native
Spanish Lidia
Mexican Lidia
ROH length (Mb)
Aver
age
tota
l le
ngh
t of
gen
om
e in
RO
H (
%)

General discussion
107
5. Signatures of selection oriented to behavioral features
We analyzed data from the Mexican and Spanish Lidia populations and two other Spanish
non-specialized tamed breeds: Asturiana de los Valles and Morenas Gallegas with the aim to
seek selection signatures for agonistic behavioral related trait, we also aimed to identify
candidate genes or metabolic processes associated with the regions involved in the selection
processes that may occur during the evolution of the Lidia populations. To meet these goals
we used two software’s: the SelEstim program developed by Vitalis et al. (2013) based on a
Bayesian approach that allows distinguishing between selected and nearly neutral
polymorphisms under a genetic model that assumes the subdivision of a population into sub-
populations that may exchange migrants. The second method is the Bayescan program based
on a statistical methodology based on finding outlier loci based on the significantly different
FST- coefficients given a model of neutrality (Foll & Gaggiotti, 2008).
An advantage of the SelEstim software is that it is able to detect a migration rate (Mi) which
is equivalent to measure genetic distances and relative admixture of each group analyzed with
respect to a joint pool of all of them. In this regards we detected that the tamed Asturiana de
los Valles breed had the highest migration rate value, this result is similar to the finding of
González-Rodriguez et al. (2017) where the explanation given for the high migration rates is
that the Asturiana de los Valles has exchanged sires to other Spanish breeds. Although, this is
not the same case of our study, where both Lidia and Morenas Gallegas breeds, are extremely
isolated breeds (even more considering the geographical separation respect to the Mexican
Lidia population), making the hypothesis of exchanging sires of the Asturiana breed not
possible.

General discussion
108
We detected two genomic regions in common with both SelEstim and Bayescan procedures.
In both of genomic regions associated to selection are placed genes like the NCDN, GRIK3,
DLGAP3, THRAP3 and SFPQ which are highly expressed in the central nervous system and
involved in metabolic pathways associated with processes like the development of
personality, development of aggressive behavior such as fear induced behavior, intermale
aggression, predatory aggression and maternal aggression (Kulikov and Popova, 1996;
Kulikov et al., 2005; da Veiga et al.,2011). Although, most of these studies have been
conducted mainly using laboratory animals, our results provide insights of clear signatures of
selection oriented for behavioral traits left by the Lidia breed respect to other non-specialized
breeds.
The low concordance of both approaches to detect regions with strong signals of selection
may have different causes, (1) that strong selection signals may be hidden, considering that
artificial selection processes do not always leave relevant signatures of selection, (2) we also
need to consider that polygenic traits such as behavior, in which many loci are involved
shifting their frequencies moderately, hampers the detection of selective sweeps with
statistical significance (Pritchard et al., 2010). Besides we need to take into consideration a
high rate of false positives due to the differences in the allelic frequencies between breeds, as
a consequence of the genetic drift and founder effect. Despite the above mentioned, this
analysis allowed identifying genomic regions with opposite selection direction in the Lidia
breed compared to the tamed breeds, corroborating a target selection that may have left
imprints in the genome of the Lidia breed.

CONCLUSIONS

Conclusions
111
1. The Mexican Lidia population is genetically differentiated from the Spanish
population. We observed that the gene diversity values of the Mexican
population were similar to that observed in the Spanish population, differing
hence of what we expected: a gene diversity reduction in the Mexican
population as a consequence of genetic drift and a bottleneck effect.
As a reflection, this clear genetic differentiation between the Mexican and the
Spanish Lidia populations allows the argument that the denomination of
“Lidia breed” when referring to the Mexican population actually is a rhetoric
fueled result whereby the term “Lidia” has been exploited more towards the
iconography that festivities represent rather to the breed itself. This may be,
therefore, like a phenomenon of adaptive convergence but applied to a
terminology.
2. The Spanish Lidia population is divided in lineages genetically more isolated
than the families of the Mexican population.
3. The maternal lineages of the Mexican population are a skewed sample of the
Spanish haplotype diversity.
4. Thanks to the exclusive haplotype of the Spanish Casta Navarra has been
possible to trace the maintenance of this lineage in the current Mexican
population.
5. Genomic regions with different intensity and allele frequency of selection
were found in the Lidia breed than that detected in tamed cattle breeds.

References
112
A.
Anderung C., Bouwman A., Persson P., Carretero J.M., Ortega A.I., Elburg R., Smith
C., Arsuaga J.L., Ellegren H., Gotherstrom A., et al. 2005. Prehistoric contacts
over the Straits of Gibraltarindicated by genetic analysis of Iberian Bronze Age
cattle. Proc. Natl. Acad. Sci. 102, 8431–8435.
Ajmone‐Marsan P., Negrini R., Crepaldi P., Milanesi E., Gorni C., Valentini A., and
Cicogna M. 2001. Assessing genetic diversity in Italian goat populations using
AFLP® markers. Anim. Genet. 32, 281-288.
Ajmone-Marsan P., Garcia J. F., & Lenstra J. A. 2010. On the origin of cattle: how
aurochs became cattle and colonized the world. Evol. Anthropol: Issues, News,
and Reviews. 19, 148-157.
Akey J.M., Zhang G., Zhang K., Jin L. & Shriver M.D. 2002. Interrogating a high-
density SNP map for signatures of natural selection. Genome. Res. 12:1805–14.
doi: 10.1101/gr.631202.
Alexander D. H., Novembre J. & Lange K. 2009. Fast model-based estimation of
ancestry in unrelated individuals. Genome Res. 19, 1655–64.
Alexander D. H. & Lange K. 2011. Enhancements to the ADMIXTURE algorithm for
individual ancestry estimation. BMC bioinformatics. 12, 246.
A.N.C.T.L. Asociación Nacional de Criadores de Toros de Lidia. México. 2017.
Información documental de la Asociación. México.
Arévalo J.C. 2015. Vida y lidia del toro bravo: ecología, ética y estética del sacrificio
taurino., A.N.C.T.L.-S.A.G.A.R.P.A. Distrito Federal, México.
B.
Barker J.S.F. 1999. Conservation of livestock breed diversity. Anim. Genet. Resour.,
25, 33-43.
Balding D. J. 2003.Likelihood-based inference for genetic correlation coefficients.
Theor. Popul. Biol. 63, 221–230.
Beaumont M. A. & Balding D. J., 2004. Identifying adaptive genetic divergence among
populations from genome scans. Mol. Ecol. 13, 969–980.
Beja-Pereira A., Caramelli D., Lalueza-Fox C., Vernesi C., Ferrand N., Casoli A.,
Goyache F., et al. 2006. The origin of European cattle: evidence from modern and
ancient DNA. Proc. Natl. Acad. Sci. U S A, 103, 8113-8118.

References
113
Bieleman J., 2000. Techniek in Nederland in De Twintigste Eeuw III [Technique in the
Netherlands in the Twentieth Century III]; Walburg Pers: Zutphen, The
Netherlands.
B.O.E. Boletin Oficial del Estado. 2001. Real Decreto 60/2001, de 26 de enero, sobre
prototipo racial de la raza bovina de lidia. Boletin Oficial del Estado 38, 5255–61.
Bonfiglio S., Ginja C., De Gaetano A., Achilli A., Olivieri A., Colli L., et al. 2012
Origin and spread of Bos taurus: new clues from mitochondrial genomes
belonging to haplogroup T1. PLoS One.7:e38601.
Bosse M., Megens H.J., Madsen O., Paudel Y., Frantz L.A.F., Schoock L.B., et al.
2012. Regions of Homozygosity in the porcine genome: consequence of
demography and the recombination landscape. PLoS Genet. 8, e1003100.
Bovine HapMap Consortium. 2009. Genome-wide survey of SNP variation uncovers
the genetic structure of cattle breeds. Science. 324, 528-532.
Buys C. 1990. Blood group frequencies in rare breeds of Dutch cattle. Blood group
frequencies in rare breeds of Dutch cattle., 203-205.
C.
Cañón J., Tupac-Yupanqui I., García-Atance M. A., Cortés O., Garcia D., Fernández J.,
& Dunner S. 2008. Genetic variation within the Lidia bovine breed. Anim. Genet.
39, 439-445.
Celaya-Nández Y. 2003. Producción y mercado ganadero en las fuentes del siglo XVII.
América Latina en la Historia Económica. 10, 25.
Ciani E., Cecchi F., Castellana E., D’Andrea M., Incoronato C., D’Angelo F., Albenzio
M.,Pilla F., et al. 2013. Poorer resolution of low-density SNP vs. STR markers in
reconstructing genetic relationships among seven Italian sheep breeds. Large
Anim. Rev. 19, 236-41.
Coates B. S., Sumerford D. V., Miller N. J., Kim K. S., Sappington T. W., Siegfried B.
D., & Lewis L. C. 2009. Comparative performance of single nucleotide
polymorphism and microsatellite markers for population genetic analysis. J.
Hered.100, 556-564.
Cockerham C. C. 1969. Variance of gene frequencies. Evolution, 23, 72-84.
Conolly J., Manning K., Colledge S., Dobney K., & Shennan S. 2012. Species
distribution modelling of ancient cattle from early Neolithic sites in SW Asia and
Europe. The Holocene. 22, 997-1010.

References
114
Crosby A. W. 2003. The Columbian exchange: biological and cultural consequences of
1492 (V.2). Greenwood Publishing Group. U.S.A.
Cortés O. Tupac-Yupanqui I., Dunner S., García-Atance M.A., García D., Fernández J.
& Cañón J., 2008. Ancestral matrilineages and mitochondrial DNA diversity of
the Lidia cattle breed. Anim. Genet. 39, 649-954.
Cortés O., Tupac-Yupanqui I., Dunner S., Fernández J. & Cañón J. 2011. Y
chromosome genetic diversity in the Lidia bovine breed: a highly fragmented
population. J. Anim. Breed. Genet., 128, 491-498.
Cortés O., Sevane N., Baro J.A., Cañón J. 2014. Pedigree analysis of a highly
fragmented population, the Lidia cattle breed. Livest. Sci., 167,1,8.
C.O.T.E.C.O.C.A. Comisión Técnico Consultiva de Coeficientes de Agostadero. 2017.
http://www.sagarpa.gob.mx/Glosario/Paginas/COTECOCA.aspx
Cymbron T., Freeman A. R., Malheiro M. I., Vigne J. D., & Bradley D. G. 2005.
Microsatellite diversity suggests different histories for Mediterranean and
Northern European cattle populations.Proc. R. Soc. B. Biol Sci., 272, 1837-1843.
D.
da Veiga C.P., Miczek K.A., Lucion A.B. and de Almeida R.M. 2011. Social instigation
and aggression in postpartum female rats: role of 5-Ht1A and 5-Ht1B receptors in
the dorsal raphe nucleus and prefrontal cortex. Psychopharmacology 213, 475–
487.
de Alba J. 1987. Criollo cattle in Latin America. In: J. Hodges. Ed. Animal Genetic
Resources: Strategies for Improved Use and Conservation. FAO Animal
production and Health Paper 66. Food and Agriculture Organization of the United
Nations, pp.19–44 Rome, Italy.
Decker J. E., McKay S. D., Rolf M. M., Kim J., Alcalá A. M., Sonstegard T. S.,
Hanotte O., Götherström A., Christopher M., et al. 2014. Worldwide patterns of
ancestry, divergence, and admixture in domesticated cattle. PLoS genetics, 10,
e1004254.
Domecq J. P. 2009. Del toreo a la bravura. Alianza Editorial. Madrid, Spain
E.
Edwards C.J., Bollongino R., Scheu A., Chamberlain A., Tresset A., Vigne J.D. et al.
2007. Mitochondrial DNA analysis shows a Near Eastern Neolithic origin for
domestic cattle and indication on of domestication of European aurochs. Proc R
Soc Lond B Biol Sci, 274: 1377–1385.
European Cattle Genetic Diversity Consortium. 2006. Marker-assisted conservation of
European cattle breeds: an evaluation.Anim. Genet. 37,475–81.

References
115
F.
F.A.O. 1999. The global strategy for the management of farm animal genetic resources.
Executive brief. FAO. Rome.
Fernández J.; Toro M.A. & Caballero A. 2004. Managing individuals’ contributions to
maximize the allelic diversity maintained in small, conserved populations.
Conserv. Biol., 18, 1358-1367
Felius M., Koolmees P. A., & Theunissen B., European Cattle Genetic Diversity
Consortium, & Lenstra J. A., 2011. On the breeds of cattle historic and current
classifications. Diversity 3, 660–692.
Felius M., Beerling M. L., Buchanan D. S., Theunissen B., Koolmees P. A., & Lenstra
J. A. 2014. On the history of cattle genetic resources. Diversity, 6, 705-750.
Felius M., Theunissen B., & Lenstra J. A. 2015. Conservation of cattle genetic
resources: the role of breeds. J. Agric. Sci., 153, 152-162.
Foll M. & Gaggiotti O. 2008.A genome-scan method to identify selected loci
appropriate for both dominant and codominant markers: a Bayesian perspective.
Genetics. 180, 977–993.
Frischknecht M., Meuwissen T. H., Bapst B., Seefried F. R., Flury C., Garrick
D.,Signer-Hasler H., Stricker Ch., et al. 2018. Genomic prediction using imputed
whole-genome sequence variants in Brown Swiss Cattle. J. Dairy Sci. 101, 1292-
1296.
G.
Gandini G. & Oldenbroek K. 2007. Strategies for moving from conservation to
utilisation. In Oldenbroek, K., ed.: Utilisation and conservation of farm animal
genetic resources. Wageningen Academic Publishers, The Netherlands pp. 29-54.
Gautier M., Laloë D. & Moazami-Goudarzi K. 2010. Insights into the genetic history of
French cattle from dense SNP data on 47 worldwide breeds. PLoS One 5, e13038.
Guevara S., & Lira-Noriega A. 2011. De los pastos de la selva a la selva de los pastos:
la introducción de la ganadería en México. Pastos, 34, 109-150.
Gibbs R.A., Taylor J.F., Van Tassell C.P., Barendse W., Eversole K.A., et al. 2009.
Genome-wide survey of SNP variation uncovers the genetic structure of
cattlebreeds. Science. 80, 528–532
References
116
Ginja C., Gama L. T., Cortes Ó., Delgado J. V., Dunner S., García D., Landi V.,
Martín-Buriel I., et al. 2013. Analysis of conservation priorities of Iberoamerican
cattle based on autosomal microsatellite markers. Genet.Sel. Evol., 45, 35.
González-Rodríguez A., Munilla S., Mouresan E. F., Cañas-Álvarez J. J., Baro J. A.,
Molina A., et al. 2017. Genomic differentiation between Asturiana de los Valles,
Avileña-Negra Ibérica, Bruna dels Pirineus, Morucha, Pirenaica, Retinta and
Rubia Gallega cattle breeds. Animal, 1-13.
Götherström A., Anderung C., Hellborg L., Elburg R., Smith C., Bradley D. G., &
Ellegren H. 2005. Cattle domestication in the Near East was followed by
hybridization with aurochs bulls in Europe. Proc. R. Soc. Lond. B Biol. Sci. 272,
2345-2351.
Guo F., Dey D. K. & Holsinger K. E. 2009. A Bayesian hierarchical model for analysis
of SNP diversity in multilocus, multipopulation models. J. Am. Stat. Assoc. 164,
142–154.
H.
Helmer D., Gourichon L., Monchot H., Peters J. & Saña-Segui M. 2005. Identifying
early domestic cattle from prepottery Neolithic sites on the middle Euphrates
using sexual dimorphism. In The First Steps of Animal Domestication. Ed.
Oxbow Books. Oxford, UK, pp. 86–95.
Henson E. L. 1992. In situ conservation of livestock and poultry. FAO. Health paper 99,
FAO/UNEP 112p.
Holsinger K. E., & Weir B. S. 2009. Genetics in geographically structured populations:
defining, estimating and interpreting FST. Nat. Rev. Genet., 10, 639.
I.
INRA; CIRAD. 2002. Contributions to sustainable livelihoods and development:
realising sustainable breeding programmes in livestock production. Proceedings
of the 7th World Congress on Genetics Applied to Livestock Production,
Montpellier, 19-23 August. CD-ROM. INRA, Toulouse
J.
Jacquin P. 2015. Le cow-boy: un Américain entre le mythe et l'histoire. Paris, Albin
Michel.
K.
Kantanen J., Vilkki J., Elo K., & Mäki‐Tanila A. 1995. Random amplified polymorphic
DNA in cattle and sheep: application for detecting genetic variation. Anim.
Genet., 26, 315-320.

References
117
Kulikov A.V. & Popova N.K. 1996. Association between intermale aggression and
genetically defined tryptophan hydroxylase activity in the mouse brain. Aggress.
Behav., 22:111–117.
Kulikov A. V., Osipova D. V., Naumenko V. S., & Popova N. K. 2005. Association
between Tph2 gene polymorphism, brain tryptophanhydroxylase activity and
aggressiveness in mouse strains.Genes, Brain, and Behavior, 4, 482–485.
L.
Larsen B., & Hansen K. M. 1986. Linkage analysis of loci controlling blood groups and
the rectovaginal constriction syndrome in Jersey cattle. Anim. Genet. 17, 277-
282.
Lenstra J.A., Ajmone-Marsan P., Beja-Pereira A., Bollongino R., Bradley D.G., Colli,
L., de Gaetano A., Edwards C.J., Felius M., Ferretti L., et al. 2014. Meta-analysis
of mitochondrial DNA reveals several population bottlenecks during worldwide
migrations of cattle. Diversity, 6,178–187.
Lin B. Z., Sasazaki S., & Mannen H. 2010. Genetic diversity and structure in Bos taurus
and Bos indicus populations analyzed by SNP markers. Anim. Sci. J, 81, 281-289.
Liu Y., Nyunoya T., Leng S., Belinsky S. A., Tesfaigzi Y., & Bruse S. 2013. Softwares
and methods for estimating genetic ancestry in human populations. Hum.
Genom., 7, 1.
Lòpez del Ramo J. 1991. La tierra de los Carriquiri. Por las rutas del toro bravo.
Madrid, Spain: Espasa-Calpe.
M.
MacHugh D. E., Shriver M. D., Loftus R. T., Cunningham P., & Bradley D. G. 1997.
Microsatellite DNA variation and the evolution, domestication and
phylogeography of taurine and zebu cattle (Bos taurus and Bos indicus). Genetics,
146, 1071-1086.
McVean G. 2009. A genealogical interpretation of principal components analysis. PLoS
Genetics, 5, e1000686.
Maudet J.B. 2010. Terres de taureaux: les jeux taurins de L´Europe à L´Amerique. Ed.
Casa de Velzaquez. Madrid, Spain 476p.
Martínez A. L. L. 1995. La génesis de la ganadería de lidia en Andalucía. Revista de
Estudios Taurinos. 79-106.
Martínez A. M., Gama L. T., Cañón J., Ginja C., Delgado J. V., Dunner S., et al. 2012.
Genetic footprints of Iberian cattle in America 500 years after the arrival of
Columbus. PLoS One, 7, e49066.

References
118
Matukumalli K.L., Lawley C.T., Schnabel R.D., Taylor J.F., Allan M.F., et al. 2009.
Development and characterization of a high density SNP genotyping assay for
cattle. PLoS ONE. 4, e5350.
McQuillan R., Leutenegger A.L., Abdel-Rahman R., Franklin C.S., Pericic M., Barac-
Lauc L., et al. 2008. Runs of homozygosity in European populations. The Am. J.
Hum. Genet., 8, 359–72.
Meuwissen T.H., Hayes B.J. & Goddard M.E. 2001. Prediction of total genetic value
using genome-wide dense marker maps. Genetics 157,1819–1829.
Meuwissen T. 2009. Towards consensus on how to measure neutral genetic diversity?.
J. Anim. Breed. Genet., 126, 333-334.
Morozova O. & Marra M.A. 2008. Applications of next-generation sequencing
technologies in functional genomics. Genomics 92, 255–264.
N.
Nei M. 1978. Estimation of average heterozygosity and genetic distance from a small
number of individuals. Genetics, 89, 583-590.
Niño de Rivera L. 2004. Sangre de Llaguno, la razón de ser del toro bravo mexicano.
Punto de Lectura: México
Novembre J., & Stephens M. 2008. Interpreting principal component analyses of spatial
population genetic variation. Nat. Genet., 40, 646.
O.
Olivieri, I. 2009. Alternative mechanisms of range expansion are associated with
different changes of evolutionary potential. Trends Ecol. Evol., 24, 289-292.
P.
Payne W. J. A., & Hodges J. 1997. Tropical cattle: origins, breeds and breeding
policies. Blackwell Science Ltd. U.K.
Pelayo R., Valera M., Molina A., & Royo L. J. 2015. Contribution of Lidia cattle breed
historical castes to the paternal genetic stock of Spain. Anim. Genet. 46, 312-315.
Pérez-Pardal L., Royo L. J., Beja-Pereira A., Cˇurik I., Traoré A., Fernández I., J
Sölkner, J Alonso, et al. 2010. Y-specific microsatellites reveal an African
subfamily in taurine (Bos taurus) cattle. Anim. Genet. 41, 232-241.
Purfield D. C., Berry D. P., McParland S., & Bradley D. G. 2012. Runs of
homozygosity and population history in cattle. Bmc Genetics, 13, 70.

References
119
Purfield D. C., McParland S., Wall E., & Berry D. P. 2017. The distribution of runs of
homozygosity and selection signatures in six commercial meat sheep breeds. PloS
one, 12, e0176780.
Prieto-Garrido J.L. 2012. El toro bravo: ganaderías míticas. Ed. Almuzara. Spain.
Pritchard J. K., Stephens M., & Donnelly P. 2000. Inference of population structure
using multilocus genotype data. Genetics, 155, 945-959.
Pritchard J. K., Pickrell J. K., & Coop G. 2010. The genetics of human adaptation: hard
sweeps, soft sweeps, and polygenic adaptation. Curr. Biol., 20 R208-R215.
Pryce J.E., Haile-Mariam M., Goddard M.E., Hayes B.J. 2014. Identification of
genomic regions associated with inbreeding depression in Holstein and Jersey
dairy cattle. Genet. Select Evol.. 46,71.
Q.
Qanbari S., & Simianer H. 2014. Mapping signatures of positive selection in the
genome of livestock. Livest. Sci., 166, 133-143.
R.
Randhawa I. A., Khatkar M. S., Thomson P. C., & Raadsma H. W. 2016. A meta-
assembly of selection signatures in cattle. PLoS One, 11, e0153013.
Rodero A., Delgado J. V., & Rodero E. 1992. El ganado andaluz primitivo y sus
implicaciones en el Descubrimiento de América. Archivos de Zootecnia, 41, 383-
400.
S.
Saumade F. 2014. Des sauvages en Occident: les cultures tauromachiques en Camargue
et en Andalousie. Éditions de la Maison des sciences de l’homme.France. France.
Scheu A., Powell A., Bollongino R., Vigne J. D., Tresset A., Çakırlar C., et al. 2015.
The genetic prehistory of domesticated cattle from their origin to the spread
across Europe. BMC Genetics, 16, 54.
Scherrer H. L. 1983. Historia del toro bravo mexicano. Editado por la Asociación
Nacional de Criadores de Toros de Lidia. Distrito Federal, México.
Schlötterer, C. 2004. The evolution of molecular markers—just a matter of fashion?.
Nat. Rev. Genet. 5, 63.
Suárez-Domínguez H., & López-Tirado Q. 1996. La ganadería bovina productora de
carne en México. Situación Actual. Universidad Autónoma Chapingo.
Departamento de Zootecnia. Chapingo, México.

References
120
T.
Taggart J., Ferguson A., & Mason F. M. 1981. Genetic variation in Irish populations of
brown trout (Salmo trutta L.): electrophoretic analysis of allozymes. Comp
Biochem Physiol B Biochem Mol Biol. 69, 393-412.
Toro M. A., Fernández J., & Caballero A. 2009. Molecular characterization of breeds
and its use in conservation. Livest. Sci., 120, 174-195.
Troy C. S., MacHugh D. E., Bailey J. F., Magee D. A., Loftus R. T., Cunningham P.,
Chambrelain T., Sykes B.C. & Bradley, D. G. 2001. Genetic evidence for Near-
Eastern origins of European cattle. Nature, 410, 1088-1091.
U.
U.C.T.L. 1995. Unión de Criadores de Toros de Lidia: Libro de transmisiones
ganaderas de la (1945-2005). Madrid, España.
U.C.T.L. 2018. Comunicación Unión de Criadores de Toros de Lidia. Madrid España.
Ulloa-Arvizu R., Gayosso-Vázquez A., Ramos-Kuri M., Estrada F. J., Montano M., &
Alonso R. A. 2008. Genetic analysis of Mexican Criollo cattle populations. J.
Anim. Breed. Genet. 125, 351-359.
V.
Väli Ü., Einarsson A., Waits L., & Ellegren H. 2008. To what extent do microsatellite
markers reflect genome.wide genetic diversity in natural populations?. Mol. Ecol.
17, 3808-3817.
Viard A. 2014. Tierras Taurinas: Cultura y pasión. Opus 27 Ed. Terres
Taurines,.France, 224p.
Vigne J.D. 2011. The origins of animal domestication and husbandry: A major change
in the history of humanity and the biosphere. C.R. Biol, 334, 171-181.
Vignal A., Milan D., SanCristobal M., & Eggen,A. 2002. A review on SNP and other
types of molecular markers and their use in animal genetics. Genet. Sel. Evol. 34,
275-306.
Vitalis R., Gautier, M., Dawson K. J., & Beaumont M. A. 2013. Detecting and
measuring selection from gene frequency data. Genetics, genetics-113.
W.
Weir B. S., & Ott J. 1997. Genetic data analysis II. Trends Genet. 13, 379.

References
121
Weir B. S. & Hill W. G. 2002. Estimating F-statistics. Annu. Rev. Genet. 36, 721–750
Weir B. S., Cardon L. R., Anderson A. D., Nielsen D. M. & Hill W. G. 2005. Measures
of human population structure show heterogeneity among genomic regions.
Genome Res. 15, 1468–1476
Wright S.1951. The theoretical structure of populations. Annals of Eugenesy. 15, 323-
354
X.
Zenger K. R., Khatkar M. S., Cavanagh J. A. L., Hawken R. J., & Raadsma H. W.
2007. Genome-wide genetic diversity of Holstein Friesian cattle reveals new
insights into Australian and global population variability, including impact of
selection. Anim. Genet., 38, 7-14.

Anexxes
122
Table S1 Data of the Spanish native and American-creole breeds included in the analyses according Decker et al. (2013).
Group Breed
Number
of
Samples
Continent Geographic Origin
American creole Corriente 5 America Sonora, Mexico
Texas Longhorn 20 America Texas, United States
Spanish native
Berrenda en Negro 5 Europe
Ciudad Real, Jaen,
Cordoba, Sevilla, and
Huelva, Spain
Berrenda en
Colorado
5
Europe
Cordoba, Sevilla,
Huelva, and Cadiz,
Spain
Cárdena Andaluza 5 Europe Sierra Morena, Spain
Mostrenca 5 Europe
National Park of
Donana, southwestern
Spain
Morucha 5 Europe Salamanca
Negra Andaluza 5 Europe
Sierra Morena
Mountains, Cordoba,
and Sevilla Spain
Retinta 4 Europe Southwest of Spain and
bordering Portugal
Terreña 5 Europe
Vasconcades
mountainous region of
Alava, Spain
List of publications
123
The present Ph.D thesis is based on the list of studies bellow:
Eusebi P. G., Cortés O., Dunner S., Cañón J. 2018. Detection of -selection signatures for agonistic behavior
in cattle. J.Anim.Breed.Genet. (In press).
Eusebi P.G., Cortés O., Dunner S., Cañón J. 2018. Genetic diversity analysis of the Mexican and Spanish
Lidia populations and its relationships by using a subset of non-linked snps. Rev. Mex. Cienc. Pecu.
9:118-134.
Eusebi P.G., Cortés O., Dunner S., Cañón J. 2017. Genetic diversity of the Mexican Lidia bovine breed and
its divergence from the Spanish population. J.Anim.Breed.Genet.. 134: 332-339.
Eusebi P. G., Cortés O., Dunner S., Cañón J. 2017. Genomic diversity and population structure of Mexican
and Spanish bovine Lidia breed. Anim. Genet. 48: 682-685.
Eusebi P.G., Cortés O., Dunner S., Cañón J. 2017 Genetic diversity and admixture of the Mexican
Lidia population inferred from medium-density genotypic data. Book of Abstracts of the International
Society of Animal Genetics. p.121.
Eusebi P.G., Cortés O., Dunner S., Cañón J. 2017 Genetic analyses of the Mexican Lidia breed and its
position respecting to the Spanish population. Festa Nailha Açoriana, 21: 78-81.
Eusebi P.G., Cortés O., Dunner S., Cañón J. 2017. Genomic analyses of the Mexican Lidia breed,
similarities and differences with respect to the Spanish Lidia breed. Book of Abstracts of the
International Congress of Veterinary of the Lidia breed. 27-31.
Eusebi, P. G., J. Cañon, and O. Cortés. 2016. P4022 Genetic diversity of Mexican cattle lidia breed and its
relationships with Spanish populations through bovine SNP 50k Beadchip. J. Anim. Sci. 94:89-90.
Doi:10.2134/jas2016.94supplement489x.
Eusebi P.G., Cortés O., Dunner S., Cañón J. 2017 Genetic diversity of the Mexican and Spanish Lidia
populations by using a subset of non-linked SNPs. Book of abstracts of the EAAP-68TH
Annual
meeting. p.84.

Acknowledgements
124