genetic architecture underlying the lignin biosynthesis...
TRANSCRIPT

Acc
epte
d A
rtic
le
This article has been accepted for publication and undergone full peer review but has not
been through the copyediting, typesetting, pagination and proofreading process, which may
lead to differences between this version and the Version of Record. Please cite this article as
doi: 10.1111/pbi.12978
This article is protected by copyright. All rights reserved.
DR. DEQIANG ZHANG (Orcid ID : 0000-0002-8849-2366)
Article type : Research Article
Genetic architecture underlying the lignin biosynthesis pathway
involves non-coding RNAs and transcription factors for growth and
wood properties in Populus
Mingyang Quan1,2,3
, Qingzhang Du1,2,3
, Liang Xiao1,2,3
, Wenjie Lu1,2,3
, Longxin Wang1,2,3
,
Jianbo Xie1,2,3
, Yuepeng Song1,2,3
, Baohua Xu1,2,3
, and Deqiang Zhang1,2,3*
1Beijing Advanced Innovation Center for Tree Breeding by Molecular Design, Beijing Forestry
University, No. 35, Qinghua East Road, Beijing 100083, P. R. China
2National Engineering Laboratory for Tree Breeding, College of Biological Sciences and
Technology, Beijing Forestry University, No. 35, Qinghua East Road, Beijing 100083, P. R.
China
3Key Laboratory of Genetics and Breeding in Forest Trees and Ornamental Plants, Ministry
of Education, College of Biological Sciences and Technology, Beijing Forestry University,
No. 35, Qinghua East Road, Beijing 100083, P. R. China.
*Corresponding Author: Deqiang Zhang, Email: [email protected];
Tel: +86-10-62336007; Fax: +86-10-62336164
Acc
epte
d A
rtic
le
This article is protected by copyright. All rights reserved.
Running head: Genetic network of lignin biosynthesis pathway in Populus
Summary
Lignin provides structural support in perennial woody plants and is a complex phenolic
polymer derived from phenylpropanoid pathway. Lignin biosynthesis is regulated by
coordinated networks involving transcription factors (TFs), microRNAs (miRNAs), and long
noncoding RNAs (lncRNAs). However, the genetic networks underlying the lignin
biosynthesis pathway for tree growth and wood properties remains unknown. Here, we
used association genetics (additive, dominant, and epistasis) and expression quantitative
trait nucleotide (eQTN) mapping to decipher the genetic networks for tree growth and
wood properties in 435 unrelated individuals of Populus tomentosa. We detected 124
significant associations (P ≤ 6.89E-05) for 10 growth and wood property traits using 30,265
single-nucleotide polymorphisms from 203 lignin biosynthetic genes, 81 TF genes, 36 miRNA
genes, and 71 lncRNA loci, implying their common roles in wood formation. Epistasis
analysis uncovered 745 significant pairwise interactions, which helped to construct
proposed genetic networks of lignin biosynthesis pathway and found that these regulators
might affect phenotypes by linking two lignin biosynthetic genes. eQTNs were used to
interpret how causal genes contributed to phenotypes. Lastly, we investigated the possible
functions of the genes encoding 4-coumarate: CoA ligase and cinnamate-4-hydroxylase in
wood traits using epistasis, eQTN mapping, and enzymatic activity assays. Our study

Acc
epte
d A
rtic
le
This article is protected by copyright. All rights reserved.
provides new insights into the lignin biosynthesis pathway in poplar and enables the novel
genetic factors as biomarkers for facilitating genetic improvement of trees.
Key words: lignin biosynthesis pathway; association genetics; epistasis; eQTN mapping; long
non-coding RNA; miRNA; transcription factor; Populus.
Introduction
Lignin is a phenylpropanoid-derived phenolic polymer abundant in vascular plants and is a
component of the secondary cell wall (Bonawitz & Chapple, 2010). Lignin provides
mechanical strength and hydrophobicity to cell walls, enabling trees to grow to great
heights and transport water and nutrients over long distances, and plays essential roles in
protection from pathogens (Ros, 1997; Bhuiyan et al., 2009). Lignin is also one of the main
components of wood, which is the substantial character of perennial woody plants and
provides the raw materials for industrial products and renewable energy (Novaes et al.,
2010).
The biosynthesis of the lignin monomer starts with the deamination of phenylalanine,
resulting in the synthesis of three monolignols: coniferyl, sinapyl, and p-coumaryl alcohols.
In dicots, such as Populus, lignin polymers are composed of guaiacyl (G), syringyl (S), and low
levels of p-hydroxyphenyl (H) units, which are processed from the three monomers,
Acc
epte
d A
rtic
le
This article is protected by copyright. All rights reserved.
respectively (Campbell & Sederoff, 1996; Voxeur et al., 2015). Some key genes in lignin
biosynthesis pathway regulate the lignin content in dicots. For example, downregulation of
4CL (4-coumarate: CoA ligase) in hybrid poplar (P. tremula × P. alba) sharply decreased the
amount of lignin and largely changed wood chemistry and wood metabolism (Voelker et al.,
2010). Furthermore, downregulation of C4H (cinnamate-4-hydroxylase) in transgenic
tobacco reduced the phenylalanine ammonia-lyase (PAL) enzymatic activity by feedback
modulation (Blount et al., 2000); phenylalanine concentration also increased the expression
of PAL, 4CL, CCoAOMT (caffoyl-CoA O-methytransferase), and CCR (cinnamoyl-CoA
reductase) in Pinus taeda (Anterola et al., 2002). While these studies demonstrated the
interactions of multiple lignin biosynthetic genes, other aspects of this network require
further study, such as the patterns of genetic interaction within the lignin biosynthesis
pathway and how the multi-gene coordinated network functions in wood formation.
Notably, growing evidence suggests that lignin biosynthesis pathway is regulated by
various upstream genetic factors. Transcription factors (TFs) have important functions in the
regulation of lignin biosynthesis. The presence of AC elements in the promoters of many
lignin biosynthetic genes of Pinus teada, which can be recognized by MYB TFs, provide
evidence of the involvement of common TFs in the regulation of lignin biosynthesis (Patzlaff
et al., 2003). Recently, regulation by non-coding RNAs (ncRNAs), such as microRNAs
(miRNAs) and long non-coding RNAs (lncRNAs), has also attracted considerable attention.
For example, overexpression of miR397a in P. trichocarpa downregulated the expression of

Acc
epte
d A
rtic
le
This article is protected by copyright. All rights reserved.
17 laccase (LAC) genes, resulting in a reduction of lignin content (Lu et al., 2013). In P.
tomentosa, eight lncRNAs exhibited epistatic effects with 15 phenylpropanoid biosynthesis
genes, which contributed to the regulation of biomass in trees (Zhou et al., 2017).
Therefore, to improve our understanding of the lignin biosynthesis pathway in Populus, it is
critical to uncover the broad-spectrum regulatory networks involving ncRNAs (lncRNAs and
miRNAs) and TFs underlying various wood formation phenotypes and to ascertain the
specific functions of each genetic factor in lignin biosynthesis.
Association mapping is an excellent strategy for examining the allelic variants behind
the complex quantitative traits of perennial trees with large population sizes and abundant
phenotypic variation (Wegrzyn et al., 2010; Beaulieu et al., 2011; Guerra et al., 2013). Single
nucleotide polymorphism (SNP)-based association mapping has been used to characterize
the SNPs within specific lignin biosynthetic genes for wood properties in trees (Thumma et
al., 2005). Association studies underlying additive, dominant, and epistatic interactions have
become a powerful method for deciphering the genetic architecture of multi-gene networks
(Mackay, 2014; Du et al., 2015; Deng et al., 2017). However, there is a substantial gap in our
knowledge of how the causative genes identified from association mapping contribute to
traits. This gap can be addressed with expression quantitative trait nucleotide (eQTN)
mapping, which is used to decipher the allelic variations that contribute to phenotypes at
the transcriptional level, and has been applied in deciphering the genetic architecture of
quantitative traits in maize (Li et al., 2013; Wen et al., 2014). Thus, association studies and

Acc
epte
d A
rtic
le
This article is protected by copyright. All rights reserved.
eQTN mapping can be combined to uncover the genetic factors (miRNAs, lncRNAs, TFs, and
protein-coding genes) underlying the lignin biosynthesis pathway, which offers effective
clues for understanding the comprehensive genetic networks and identifying causal genes
for wood property traits.
Here, we identified potential ncRNAs (lncRNAs and miRNAs) and TFs that are
associated with 203 lignin biosynthetic genes in P. tomentosa. Using association studies, we
deciphered the genetic basis (additive, dominant, and epistatic effects) of these genetic
factors underlying lignin biosynthesis for tree growth and wood properties in a natural
population of 435 unrelated individuals of P. tomentosa. Based on this, we determined the
multi-genotype combinations for lignin content and proposed genetic networks in the lignin
biosynthesis pathway, which will be useful for selection breeding. eQTN mapping combined
with analyses of enzymatic activity aided our interpretation of the causal genes identified in
association studies for tree growth and wood properties. The strategy of integrating
association mapping (additive, dominant, and epistasis) with eQTN analysis offers an
alternative idea for deciphering the genetic regulatory mechanisms of complex traits in
perennial trees. Our findings provide new insight into the lignin biosynthesis pathway in
poplar and may enhance the efficiency of tree breeding.
Acc
epte
d A
rtic
le
This article is protected by copyright. All rights reserved.
Results
Identification and expression analysis of candidate genetic factors in lignin biosynthesis
pathway in P. tomentosa
Expression patterns of candidate lignin biosynthetic genes in P. tomentosa
We identified 298 genes from 13 gene families in lignin biosynthesis pathway in P.
trichocarpa genome: PAL, 4CL, LAC, CCR, C4H, CCoAOMT, CSE (caffeoyl shikimate esterase),
CAD (cinnamyl alcohol dehydrogenase), C3H (4-coumarate 3-hydroxylase), F5H
(ferulate/coniferaldehyde 5-hydroxylase), PO (peroxidase), HCT
(p-hydroxycinnamoyl-CoA:quinate shikimate p-hydroxycinnamoyltransferase), and COMT
(caffeic acid/5-hydroxyconiferaldehyde O-methytransferase). RNA-seq were used to
examine the transcript abundance of the 298 lignin biosynthetic genes, which found that
203 genes expressed in at least one tested tissue of P. tomentosa, i.e. leaf, developing
xylem, mature xylem, and cambium, with diverse patterns (Data S1). For example, all CSE
and PAL family members were highly expressed in stem tissues (developing xylem, mature
xylem, and cambium). Genes in the C4H, CCR, F5H, CCoAOMT, and C3H families exhibited
low to moderate expression levels in the tested tissues. Some genes showed tissue-specific
expression; for example, Ptr-COMT27 was preferentially expressed in mature xylem but had
no expression in the leaf. 70.94% of the lignin biosynthetic genes had higher expression
levels in at least one stem tissue than in leaf (Data S1), indicating their potential functions in
wood formation.
Acc
epte
d A
rtic
le
This article is protected by copyright. All rights reserved.
Identification of lncRNAs and miRNAs for lignin biosynthetic genes
To investigate the potential ncRNAs involved in the lignin biosynthesis pathway, we
identified 296 lncRNA–mRNA pairs representing 190 lncRNAs and 73 lignin biosynthetic
genes in P. tomentosa (Data S2). Of which, 59.05% of the pairs were cis-acting and 45 of the
lncRNAs had both cis and trans roles. Expression analysis identified 47 lncRNAs only
expressed in one tissue (Data S3). Expression correlations of 296 lncRNA-mRNA pairs
showed that 76.69% of the pairs exhibited significantly strong correlations (r > 0.4 or < -0.4,
P < 0.01, Table S1), indicating the close regulatory relationship between these 190 lncRNAs
and lignin biosynthetic genes. Additionally, degradome sequencing showed that 36 miRNAs
from 17 miRNA families regulate 31 lignin biosynthetic genes in P. tomentosa (Data S4). The
expression of these 36 miRNAs varied across the six tissues (Data S5), and the expression
correlations for 69 miRNA–mRNA pairs revealed that 54 pairs were significantly negatively
correlated (-0.960 to -0.189, P < 0.01, Table S2), strongly supporting the roles of miRNAs in
regulation of lignin biosynthetic genes.
Cis-regulatory motif analysis identified the shared TFs regulating lignin biosynthetic genes
To explore the potential TFs that regulate the lignin biosynthetic genes, 26 TF binding motifs
were over-represented in > 90% of the lignin biosynthetic gene promoters, and every
promoter contained 1 to 297 TF binding sites (TFBS) (mean of 121) (Table S3 and Data S6),
which suggested the universal regulatory mechanism of TFs for lignin biosynthesis, in
contrast to ncRNAs, which affect only a subset of genes. Examination of the motif position

Acc
epte
d A
rtic
le
This article is protected by copyright. All rights reserved.
showed that most were evenly distributed across the 203 lignin biosynthetic gene
promoters, except for two TFBS of the AT-Hook family (TFBS_0131 and TFBS_0148), which
were preferentially located 1 kb upstream of the transcription start site (TSS) (frequency >
0.1; Figure S1). Correspondingly, 81 TF genes from eight TF families (HD-ZIP, Myb/SANT,
AT-Hook, TCR, TBP, bZIP, bHLH, and C2H2) interacted with the 26 enriched motifs (Table S3).
Expression correlations of 15,246 TF-gene pairs revealed that 62.47% were strongly
correlated (r > 0.4 or < -0.4, P < 0.01) (Data S7 and Data S8), revealing their potential
regulatory roles for lignin biosynthetic genes.
The expression profiles of 40 genes, selected from 13 gene families, were validated by
real-time quantitative PCR (RT-qPCR), which showed consistent patterns with the RNA-seq
data (r = 0.91, P < 0.01; Figure S2a–b). Additionally, six lncRNAs, six miRNAs, and nine TFs
which revealed significant expression correlations with the 40 genes by RNA-seq were
chosen for RT-qPCR validation, results showed a nearly perfect correlation with the RNA-seq
results for the expression profiles and expression correlations of lncRNA/miRNA/TF–mRNA
pairs (r = 0.85, 0.64, and 0.71, respectively, P < 0.01, Figure S2c–d). These findings supported
that candidate ncRNAs and TFs have extensive regulatory roles in lignin biosynthesis
pathway.
Acc
epte
d A
rtic
le
This article is protected by copyright. All rights reserved.
Genetic diversity assessment within candidate genes and linkage disequilibrium (LD) tests
in the association population of P. tomentosa
According to the genomic re-sequencing data (coverage > 15×) for the 435 unrelated
individuals of P. tomentosa, we detected 35,161 SNPs from all candidate genes of the lignin
biosynthesis pathway, including 203 biosynthesis genes, 81 TF genes, 36 miRNA genes, and
71 lncRNA loci. Of these, 30,265 high-quality SNPs (minor allele frequency (MAF) > 5% and
missing data < 10%) were selected for further analysis (Data S9–S12). Of the high-quality
SNPs, 7,451 were in ncRNA genes, and the remaining 22,814 were derived from
protein-coding genes, with 81.92% in non-coding regions, revealing the high nucleotide
diversity in non-coding sequences. The SNP frequency varied across genes with one SNP per
15-659 bp (Table 1 and Table S4). Notably, the lignin biosynthetic genes had the highest
nucleotide diversity (average π = 0.0428), followed by lncRNA loci (average π = 0.0419) and
TFs (average π = 0.0372), with miRNA genes being the most conserved (average π = 0.0356).
The nucleotide diversity in noncoding regions (π = 0.0654) of protein-coding genes was
higher than that in coding regions (π = 0.0318), indicating that coding regions were under
stronger selection pressure. Moreover, non-synonymous (dN) diversity was lower than
synonymous (dS) diversity (dN/dS = 0.43), indicating purifying selection within the exons. The
r2 (squared allele-frequency correlations) of all pairwise combinations, combined with their
physical distance, were used to evaluate the overall patterns of LD for each chromosome.
We detected ~2,400 high-LD blocks (r2 > 0.75, P < 0.01) across 19 chromosomes and the r2
dropped to 0.1 within ~0.6kb to ~1.2 kb on average (Figure S3-S4).
Acc
epte
d A
rtic
le
This article is protected by copyright. All rights reserved.
Genetic basis of natural variants for tree growth and wood property traits in P. tomentosa
To identify the causative variants among the candidate genetic factors of the lignin
biosynthesis pathway for wood formation in P. tomentosa, 10 tree growth and wood
property traits were measured for all individuals in the association population, i.e. diameter
at breast height (DBH), tree height (H), stem volume (V), fiber width (FW), fiber length (FL),
microfibril angle (MFA), lignin content (LC), holocellulose content (HC), α-cellulose content
(CC), and hemicellulose content (HEC). Collectively, 124 associations representing 116
significant loci were identified at P ≤ 6.89E-05 (P = 1/n, a Bonferroni correction) (Figure S5
and Table 2). The phenotypic variation explained (R2) by each association was
13.14–31.30%, with an average of 21.40% (Table S5).
The 116 significant loci distributed across 85 candidate genes, and 96 of them were
independent loci (weak or no LD, r2 < 0.75 or different chromosomes). For the 34
associations identified in ncRNA genes, 15 loci overlapped with transcribed regions of
lncRNAs, and five were in miRNA genes with one in the precursor miRNA (pre-miRNA)
region (Pto-MIR397a_SNP7 for DBH; Figure S6a). Of the 90 loci identified in protein-coding
genes, 11 were in exons, such as Ptr-HCT12_SNP59 (G/C), which caused a non-synonymous
mutation of Ala to Pro, and had the peak signal for H (P = 1.29E-05) (Figure S6b). We found
that 59 loci in lignin biosynthetic genes were associated with seven traits, and 42 were in
promoters, such as Ptr-4CL12_SNP28 overlapped with TFBS_0323 of Myb/SANT, which was
associated with FL (P = 1.21E-10) (Figure S6c). These results supported that candidate TFs

Acc
epte
d A
rtic
le
This article is protected by copyright. All rights reserved.
and ncRNAs have functions in wood formation. Each trait associated with 1-27 loci from four
categories of genes, indicating their common roles in tree growth and wood properties. For
example, 27 significant SNPs, including eight in lncRNA loci, four in miRNA genes, nine in
lignin biosynthetic genes, and six in TF genes, were associated with DBH with R2 of
20.59–26.85% (Figure S6a).
The associated loci exhibited various effects on traits. For the 124 locus–trait
associations, 100 and 97 associations possessed additive and dominant effects, respectively,
and 58.87% of associations had joint additive and dominant effects (Table S5). Twelve
pleiotropic genes, including three lncRNA loci, one miRNA gene, four lignin biosynthetic
genes, and four TF genes, shared 2–3 traits, and they showed different effects on traits,
indicating their common roles in wood formation. Seven pleiotropic genes possessed
combined additive and dominant effects for all associated traits, such as Pto-MIR167a for
DBH and V. Notably, one locus had different contributions to different traits.
Ptr-CAD13_SNP44 possessed joint effects for HC and V; however, it showed distinctly
dominant effects for HC (12.160) and V (-30.827). Additionally, the pleiotropic genes could
have either an additive or dominant effect for traits. For example, Ptr-TBP2 showed additive
effects for FL, but dominant effects for HC. Additionally, the pleiotropic genes could show
combined effects for one trait, and a single effect to other traits. For instance, SNPs in L40
(lncRNA locus 40) showed combined additive and dominant effects for LC, but only
displayed varied additive effects for MFA (0.696–1.546) (Table S5). These findings indicated

Acc
epte
d A
rtic
le
This article is protected by copyright. All rights reserved.
the diverse functions of the four types of genetic factors for specific traits related to wood
formation.
Based on the effects of significant loci for a trait, the possible genotype combinations
of significant SNPs for the same trait were identified. Eight independent SNPs were
significantly associated with LC (Figure 1a-b), which different genotypes of them contributed
differently to LC (Figure 1c), and they displayed seven possible common genotype
combinations (frequency ≥ 5%, P < 0.01) for LC (Figure 1d). The genotype alternation of
three major loci (Ptr-4CL20_SNP116, L40_SNP80, and Ptr-bHLH23_SNP98) led to phenotypic
differences of LC, where GT-CT-CT and GG-TT-CC combinations of the three major loci
represented the maximum (23.16%) and minimum (19.23%) phenotypic values, respectively.
Pairwise epistasis between candidate loci revealed complex genetic networks in the lignin
biosynthesis pathway
To decipher the genetic networks in the lignin biosynthesis pathway, we chose 6,313 loci
that were significant in SNP-based associations at P < 0.01 and tested the epistatic
interactions between each SNP pair for each trait. Collectively, 745 significant pairwise
epistatic combinations were detected for 10 tree growth and wood property traits at P < 1.0
×10-4. Based on this, we constructed a proposed epistatic network among genetic factors in
lignin biosynthesis pathway, which exemplified by S-lignin biosynthesis (Figure 2), providing
useful resource for the genetic interactions within the pathway. The 745 SNP pairs
Acc
epte
d A
rtic
le
This article is protected by copyright. All rights reserved.
represented 395 loci within 167 genes (Figure 3a and Table S6), including 166, 188, and 23
epistatic interactions for TFs, lncRNAs, and miRNAs with lignin biosynthetic genes,
respectively (Figure 2 and figure 3a). Interestingly, 169 SNP–SNP pairs were between
ncRNA/TF genes and their corresponding target genes. Additionally, 52 significant genes
were repeatedly detected with epistatic effects (507 pairwise), including 11 causative
variants with additive/dominant effects. For example, Ptr-bHLH11_SNP45 (G/A) showed a
joint effects of additive, dominant, and epistasis. Additionally, 68.29% (267) of the loci
showed epistatic interactions with multiple SNPs and 50 SNP–SNP pairs associated with
more than one trait. For example, Ptr-CCR13_SNP7 (G/A), a non-synonymous mutation of
Gly to Arg, had 28 pairwise combinations with 22 SNPs for four traits. The
Ptr-CCR13_SNP7-L19_SNP33 interaction was associated with D, V, and FW, in which the
different genotype combinations provided substantial epistatic effects than single locus for
the traits (Figure S7).
Among the 745 epistatic interactions, 257 additive × additive (AA), 166 additive ×
dominance (AD), 189 dominance × additive (DA), and 133 dominance × dominance (DD)
interaction effects were partitioned for 10 traits, indicating the diverse interaction models
for traits (Table S6). Interestingly, we found that ncRNA/TF genes linked two lignin
biosynthetic genes in the pathway (Figure 2). For example, L19_SNP68 had epistatic
interactions with COMT-22 (Ptr-COMT22_SNP58) and PO-70 (Ptr-PO70_SNP64), in which the
different allelic interactions showed different effects for HC (Figure 3b). Moreover,

Acc
epte
d A
rtic
le
This article is protected by copyright. All rights reserved.
transcription factor C2H2 (Ptr-C2H2-72_SNP33) linked 4CL (Ptr-4CL4_SNP69) and LAC
(Ptr-LAC31_SNP6) together, which had no direct genetic or regulatory interactions within
the pathway, and the allelic combinations showed considerable non-additive effects for V
(Figure 3c). These results demonstrated that, except for the direct interaction among lignin
biosynthetic genes, ncRNAs and TFs participated in alternative interactions among genes.
We also found that the genotype combinations of SNPs with epistatic interactions for
phenotypes displayed stronger effects than single loci. For example, CC varied across
different genotype combinations (Ptr-PO52_SNP37, Ptr-bHLH11_SNP44, and
Ptr-PAL3_SNP117), and phenotypic differences ranged from -20.556 (TT-CT-CT) to 5.237
(TT-TT-CC), which differed from single-locus effects (Figure 3d–e). These findings revealed
that epistatic interactions involving miRNAs, lncRNAs, and TFs enriched the lignin
biosynthesis pathway and proposed alternative interaction models connecting lignin
biosynthetic genes, thereby substantially affecting growth and wood properties of P.
tomentosa.
Genetic regulation of gene expression accounts for a substantial proportion of phenotypic
variations in P. tomentosa
To investigate the causative allelic variants underlying the level of transcription of lignin
biosynthetic genes, eQTN mapping was conducted between 30,265 genetic variants and the
expression levels of 74 lignin biosynthetic genes (expressed in ≥ 80% of the 435 individuals;
Data S13). At P ≤ 6.89E-05, we found that 42 lignin biosynthetic genes defined 20,558 eQTN

Acc
epte
d A
rtic
le
This article is protected by copyright. All rights reserved.
signals, representing 11,787 eQTN loci from 377 genes (Figure S8 and Data S14). The
number of eQTNs identified for each expressed lignin biosynthetic genes ranged 1-7,611
and 99.20% of the genes with eQTNs were pleiotropic (Table S7). Remarkably, in 90.91% of
the associated genes, we detected eQTNs in their corresponding ncRNA genes and 96.97%
of eQTN signals in TF genes were associated with their corresponding targets, supporting
the regulatory roles of ncRNAs/TFs for lignin biosynthetic genes. The number of eQTNs in
non-coding regions were much higher than that in coding regions (17,048 vs. 3,510),
suggesting that non-coding sequences might play dominant roles in the regulation of
expression of lignin biosynthetic genes. The distribution of eQTN signals for associated
genes were compared. We identified 162 cis-eQTNs and 20,396 trans-eQTNs, indicating that
trans-eQTNs were more frequent across the whole genome.
We identified 3,262 eQTNs whose localized genes were significant in association
studies, including 36 significant SNPs. For example, three eQTN loci of Ptr-COMT30
(L57_SNP8, L57_SNP9, and Ptr-HD-ZIP54_SNP13) also associated with LC (Figure S9a–d).
Variants within L57 and Ptr-HD-ZIP54 also regulated the expression of 10 additional genes as
cis/trans-eQTNs (Data S14), of which the expression levels of three genes (Ptr-COMT30,
Ptr-HCT12, and Ptr-PO54) were positively correlated with LC (r = 0.187, 0.160, and 0.138,
respectively, P < 0.01; Figure S9e), indicating that SNPs in causal genes might affect
phenotypes by regulating the expression of other genes. Interestingly, L57_SNP21 affected
Ptr-PO64 as a cis-eQTN, while it functioned as a trans-eQTN for Ptr-CCR29 and Ptr-CCR33,
indicating the diverse actions of eQTNs for traits.
Acc
epte
d A
rtic
le
This article is protected by copyright. All rights reserved.
Additionally, the phenotypes were determined by expressions of the causal lignin
biosynthetic genes, which were affected by multi-eQTNs. Of the 42 associated expression
traits, 13 were significant in association mapping. For example, Ptr-LAC27
(Ptr-LAC27_SNP50) was identified to associate with FW, whose expression level was
negatively correlated with FW (r = -0.353, P < 0.01; Figure S9f). Ptr-LAC27 expression was
also determined by one cis-eQTNs and 66 trans-eQTNs. Of these, four trans-eQTNs in four
causative genes (Ptr-LAC8, Ptr-LAC26, Ptr-TCR2, and L50) displayed potential epistatic
interactions for the expression of Ptr-LAC27 (Figure S9g-i), including two causal loci for FW
(Ptr-LAC8_SNP27 and Ptr-LAC26_SNP13). Thus, Ptr-LAC27 probably affected FW by
regulating its own gene expression, and this process might be regulated by Ptr-LAC8,
Ptr-LAC26, Ptr-TCR2, and L50. These findings suggested that causal genes might contribute
to phenotypes by affecting the expression of other genes and/or are regulated by multiple
eQTNs.
Functional interpretation of 4CL and C4H underlying growth and wood property traits of P.
tomentosa
To further confirm the findings in our association studies, we conducted an in-depth
investigation on how causal SNPs contributed to phenotypes. We identified that
Ptr-4CL9_SNP 39 was a lead SNP for FW (P = 3.01E-06) (Figure 4a–b), and the expression
level of Ptr-4CL9 was negatively correlated with FW (r = -0.303, P < 0.01) (Figure 4c). We
detected two strong cis-eQTN signals, found in Ptr-4CL9’s corresponding lncRNA loci (L16
Acc
epte
d A
rtic
le
This article is protected by copyright. All rights reserved.
and L17), and four trans-eQTNs that determine the expression of Ptr-4CL9 (Figure 4d). Of
these, two trans-eQTNs (Ptr-HD-ZIP40_SNP13 and Ptr-COMT25_SNP84) and one cis-eQTN
(L17_SNP225) showed clear epistatic interactions, and different genotype combinations of
these SNPs contributed differently to the expression of Ptr-4CL9 (Figure 4e). Tissue-specific
analysis showed a clear expression correlation between Ptr-4CL9 and its cis-lncRNA
TCONS_00058839 (r = -0.611, P < 0.01; Figure 4f). Notably, association mapping underlying
PO enzymatic activities showed that Ptr-4CL9_SNP34 was significantly associated with PO
activity (P = 4.00E-03, Q < 0.1, R2 = 12.15%). The significant correlation (r = -0.241, P < 0.01)
was observed between PO activity and FW (Figure 4g), implying that Ptr-4CL9 might affect
FW by regulating PO activity.
Ptr-C4H3_SNP 69 was the lead SNP for LC (P = 1.29E-05) (Figure 5a–d), and 15
independent eQTNs were identified in causative genes to determine the expression of
Ptr-C4H3 (Figure 5e), which was negatively correlated with the phenotypic variation of LC (r
= -0.175, P < 0.01) (Figure 5f). Epistasis analysis showed that four trans-eQTNs formed
interaction networks for Ptr-C4H3 expression (Figure 5g), implying that Ptr-C4H3 might be
regulated by the four causal genes, Pto-MIR397a, L51, L70, and Ptr-C3H2. Tissue expression
analysis also showed significant correlations of Ptr-C4H3 with these four genes (Figure 5h),
supporting the hypothesis that these causal genes might indirectly affect LC. Additionally,
association analysis with enzymatic activity revealed that Ptr-C4H3_SNP104 associated with
CAD activity (P = 3.82E-03, Q < 0.1, R2 = 8.11%), and very weak negative correlations (r =
0.11, P = 1.20E-02) were shown between lignin content and CAD enzymatic activity,
indicating a potential alternative pathway for Ptr-C4H3 affecting LC.

Acc
epte
d A
rtic
le
This article is protected by copyright. All rights reserved.
Discussion
Genetic basis for the coordinated network underlying the lignin biosynthesis pathway for
tree growth and wood properties in P. tomentosa
The phenylpropanoid biosynthesis pathway is the principal determinant of lignin content
(Ros, 1997; Bonawitz & Chapple, 2010). Previously reported lignin biosynthetic genes are
regulated by several categories of genetic factors (miRNAs, lncRNAs, and TFs), resulting in
phenotype diversification (Patzlaff et al., 2003; Lu et al., 2013; Zhou et al., 2017). Thus, our
primary goal was to comprehensively understand the interplay of these genetic factors in
lignin biosynthesis pathway, and dissect their roles in tree growth and wood properties.
Combining bioinformatics prediction, degradome sequencing, and expression pattern
analysis, we identified 190 lncRNAs, 36 miRNAs, and 81 TFs that were associated with 203
lignin biosynthetic genes of P. tomentosa, indicating the universal regulation of lignin
biosynthesis by these factors. The majority of the upstream regulators exhibited strong
expression correlations to their putative target genes (Figure S2), suggesting that these
regulators could affect lignin biosynthesis pathway by regulating the expression of lignin
biosynthetic genes (Shi et al., 2010), and offering a new understanding of these genetic
factors in tree growth and wood formation.

Acc
epte
d A
rtic
le
This article is protected by copyright. All rights reserved.
Association mapping is a popular strategy for determining the causal genes in
population genetics studies of trees (Neale & Savolainen, 2004; Ingvarsson & Street, 2011).
Here, we detected 124 SNP–trait associations harboring different additive/dominant effects
for phenotypes (Figure S5), and a majority of the loci (52.42%) were in genes encoding
ncRNAs and TFs, suggesting that tree growth and wood formation are regulated by these
genetic factors (Solovieff et al., 2013). We demonstrated that 12 pleiotropic genetic factors
contributed to wood formation with diverse genetic effects, suggesting that these genes
affect wood formation in different ways. The coordinated regulation of wood formation by
ncRNAs and TFs largely depended on the different genetic effects of the loci. For instance,
eight independent SNPs from three types of genetic factors conferred the fixed genotype
combinations for LC (Figure 1), which demonstrated that the phenotypic variations were the
result of the interplay of many genetic factors, and the genes and genetic effects would
modify across the traits (Bac-Molenaar et al., 2015; Du et al., 2015). These findings offer
additional resources for gene-based breeding of trees and provide valuable clues for
understanding the coordinated networks of miRNAs, lncRNAs, and TFs in the lignin
biosynthesis pathway in Populus.
Linkage disequilibrium has significant implication on SNP-trait associations. The decay
of LD was substantial rapidly than previously reported in P. trichocarpa (Slavov et al., 2012).
Factors for this result could explain below. First, the population structure and the individuals
of the association population could cause the differences of LD decay in Populus (Terwilliger
Acc
epte
d A
rtic
le
This article is protected by copyright. All rights reserved.
& Hiekkalinna, 2006). Second, the MAF thresholds used for SNP screening and allele
frequency of the loci were probably the considerable reasons for LD detection (Slavov et al.,
2012; VanLiere & Rosenberg, 2008). Finally, LD in our studies were estimated based on the
candidate genes, which was different from the previously studies on genome re-sequencing
data (Slavov et al., 2012). Comparably, the LD decay in our study was more consistent with
that on candidate gene-based association mapping (Gilchrist et al., 2006; Wegrzyn et al.,
2010).
Epistasis analysis and eQTN mapping interpreted the multi-factor genetic networks in the
lignin biosynthesis pathway underlying growth and wood properties in Populus
Epistasis is a critical component for the genetic basis of quantitative traits, which defines the
non-additive interactions between variants or genes (Mackay, 2014). Here, we identified
745 significant epistatic pairwise interactions (Figure 3a), and a fraction of loci (11 SNPs)
were detectable with additive/dominant effects, suggesting that epistasis analysis could
capture loci with minor effects (Xu & Jia, 2007) and providing information other than
additive/dominant effects of significant loci for phenotypes. Interestingly, 68.29% of loci and
50 SNP–SNP pairs associated with multiple traits with various effects, supporting that the
pleiotropism of these genes affects wood formation of P. tomentosa (Figure S7).
We enriched the lignin biosynthesis pathway using genes encoding lncRNAs, miRNAs,
and TFs that had epistatic interactions with lignin biosynthetic genes (Figure 2). TFs and
ncRNAs also affected phenotypic variations by linking two lignin biosynthetic genes (Figure

Acc
epte
d A
rtic
le
This article is protected by copyright. All rights reserved.
3b–c), which supported the crosstalk among the four genetic factors and proposed an
alternative pathway for the regulatory roles of TFs and ncRNAs. Additionally, the interaction
graph for α-cellulose content sufficiently illustrated that epistasis had stronger effects than
single loci (Figure 3d–e), which supported the notion that allelic variations and epistatic
interplays are dominant drivers of phenotypes (Mackay, 2014). These findings
demonstrated that the genetic factors underlying the lignin biosynthesis pathway are
network dependent (Zhao & Dixon, 2011). TFs and ncRNAs are essential components in the
lignin biosynthesis pathway, and our understanding of the heritability of growth and wood
properties would be lacking if we failed to account for their effects.
Much work is being devoted to exploring the causal loci for phenotypes at the
transcriptional level. Investigation of eQTNs provides insights into the gene expression
effects of candidate loci and helps to unravel the relationship between genotypes and
phenotypes (Westra & Franke, 2014). In our studies, the eQTNs identified for 42 expressed
lignin biosynthetic genes were more abundant in noncoding regions than those in coding
sequences (82.93% vs. 17.07%) (Figure S8), highlighting the regulatory roles of non-coding
sequences for quantitative traits (Li et al., 2012; Liu et al., 2017). Additionally, trans-eQTNs
are more frequent in the genome, which indicates that genes are largely regulated by
trans-eQTNs (Drost et al., 2010). These findings were consistent with studies in P.
trichocarpa and humans, demonstrating the importance of long-range control of gene
expression and the dominant roles of non-coding sequences for regulation (Bryois et al.,
2014; Drost et al., 2010). .

Acc
epte
d A
rtic
le
This article is protected by copyright. All rights reserved.
Here, eQTN analysis demonstrated that causal genes could affect phenotypes through
an alternative pathway involving miRNA, lncRNA, and TF genes at the transcriptional level.
Collectively, the causal SNPs and/or genes affect tree growth and wood properties in two
ways. Causal genes (L57 and Ptr-HD-ZIP54) might directly contribute to the traits according
to the association results at genomic level, alternatively, they might also affect lignin
content by regulating the expression of additional genes by cis/trans-eQTNs within them
(figure S9a–d). This notion was supported by the significant correlations between
phenotype variations and gene expression (Figure S9e), and the functions of these causal
genes should be investigated in the future. Additionally, a causal gene could affect
phenotypes by regulating its own expression, and several genes might contribute to
expression dynamics in this process. These observations were supported by the distinct
contributions of epistatic interactions of four trans-eQTNs for Ptr-LAC27 (Figure S9f–i). In
particular, variants in ncRNA and TF genes played a significant role in this process,
illustrating the additional regulation model that ncRNAs and TFs regulate gene expression at
genome-wide levels. Collectively, the detection of eQTNs demonstrated another layer of
interaction of the four genetic factors (miRNAs, lncRNAs, TFs, and lignin biosynthetic genes)
for phenotypes, which links the genetic variation with phenotype diversification, and
emphasizes that ncRNAs and TFs participate in tree growth and wood formation at the
genome-wide level.

Acc
epte
d A
rtic
le
This article is protected by copyright. All rights reserved.
Previously, substantial regulatory networks have been reported for wood formation in
trees (Du et al., 2015; Zhou et al., 2017), and they dissected a well characterized pathway
involves in a fraction of major genes, such as miR397a (Lu et al., 2013) and the MYB gene
family (Patzlaff et al., 2003). Here, we dissected the multi-gene genetic network underlying
lignin biosynthesis pathway includes lncRNAs, miRNAs, and TFs, which provides a more
comprehensive genetic networks for wood formation and captures the major loci in
non-coding transcripts. Notably, epistasis explored more loci with minor effects for the
networks, which is reasonable for application in marker-assisted breeding. Importantly, our
study also demonstrated the alternative function of causal genes within this multi-factor
network at transcriptional level, providing important leads to functional studies on
understanding the mechanisms whereby natural variants leads to complex traits in trees.
Functional interpretation of causal genes associated with growth and wood property traits
of P. tomentosa
Based on our findings, two lead SNPs contributed to phenotypes via different methods, and
the integrated strategy using association mapping to find the underlying additive, dominant,
and epistatic effects, and eQTN analysis helped to define the putative mechanisms of causal
SNPs for quantitative traits in P. tomentosa. Additionally, analysis of enzymatic activities in
the lignin biosynthesis pathway also aided in the interpretation of the functional roles of
causal genes (Bonawitz & Chapple, 2010).

Acc
epte
d A
rtic
le
This article is protected by copyright. All rights reserved.
We detected that a lead SNP, Ptr-4CL9_SNP39, was associated with FW (Figure 4a–c),
indicating the potential roles of 4CL9 on FW. We propose the following mechanisms for this
association. First, Ptr-4CL9 might affect FW through regulating its own expression by
Ptr-HD-ZIP40, Ptr-COMT25, and L17 (Figure 4d). Allelic interactions of three eQTNs in three
regulators might play critical roles in expression variations (Figure 4e), including the
cis-lncRNA of TCONS_00058839, whose expression showed significant correlations in the
tested tissues (Figure 4f). As an alternative pathway, Ptr-4CL9 might affect FW by regulating
PO enzymatic activity, which was supported by significant associations of Ptr-4CL9_SNP34
with PO activity. In P. deltoides, PO activity and FW are somewhat related under salt stress
(Li et al., 2003), which supported the negative correlations between the expression of 4CL9
and PO activity (Figure 4g). Further studies are needed to determine this mechanism in
trees.
Another example illustrates the possible mechanisms of Ptr-C4H3 for LC. Previous
studies reported that down-regulation of C4H expression led to decreased levels of lignin
content (Sewalt et al., 1997). Alternatively, we identified four causal genes (Pto-MIR397a,
Ptr-C3H2, L51, and L70) that affect the expression of Ptr-C4H3 (Figure 5e–g). Of which,
Pto-MIR397a has been characterized as a master regulator of LC by down-regulating the
expression of LAC in Populus (Lu et al., 2013; Chen et al., 2015). Notably, Pto-MIR397a,
Ptr-C3H2, and two lncRNAs in L51 (TCONS_00161734) and L70 (TCONS_00280147) also
showed significant correlations in tissue expression analysis, supporting that epistatic
interactions of genotypes within the four loci contributed to the expression of Ptr-C4H3
(Figure 5h). Association studies of enzymatic activity showed that C4H-3 (Ptr-C4H3_SNP104)
Acc
epte
d A
rtic
le
This article is protected by copyright. All rights reserved.
significantly associated with CAD activity, but a very weak correlation was observed
between lignin content and CAD activity. The change of CAD activity did not significantly
alter lignin content, while the lignin structure and composition were altered in tobacco
stems (Halpin et al., 1994). These findings indicated that C4H-3 alters lignin composition and
structure by affecting the enzymatic activity of CAD. Further studies are needed to
investigate the detailed mechanisms.
In summary, we identified a functional link between genetic variants underlying the
lignin biosynthesis pathway and tree growth and wood formation. The integration of
multiple strategies, including association mapping (additive, dominant, and epistasis), gene
expression profiling, and analysis of enzymatic activities, has facilitated the identification of
candidate genetic factors (Bonawitz & Chapple, 2010; Wen et al., 2014; Deng et al., 2017).
Epistasis is a critical component of genetic effect for the phenotypes, and is important for
our understanding of heritability (Xu & Jia, 2007). The eQTNs allow for resolution down to
the single-nucleotide level by determining the function of alleles in phenotypes (Liu et al.,
2017). LncRNAs, miRNAs, and TFs have an important and broad-spectrum impact on the
lignin biosynthesis pathway, which affects the genetic architecture of tree growth and wood
formation. Also, the endogenous target mimicry also provides a crucial regulatory
mechanism of miRNA-lncRNA-mRNA in plants, which should be considered in the future
(Franco-Zorrilla et al., 2007; Karakülah et al., 2016). Importantly, more major regulators
(lncRNAs, miRNAs and TFs) will be found if we used the integrated mapping strategy
Acc
epte
d A
rtic
le
This article is protected by copyright. All rights reserved.
(genome-wide association studies and eQTN mapping), which have the substantial potential
to accelerate the genetic improvement in perennial trees. Also, natural variants within these
regulators could be effectively used since these regulators exist in the upper layer of
regulation so that it might have the master regulation roles for the downstream genes,
which would decrease the cumbersome of genetic manipulation in trees. Future studies
should focus on multiple aspects, such as enzymology, metabolomics, and phenomics,
which could improve precision and efficiency in uncovering the genetic basis of complex
traits, and benefit tree breeding and improvement.
Experimental procedures
Population materials and DNA extraction
The association population was composed of 435 unrelated individuals of P. tomentosa,
representing almost all the natural distribution of P. tomentosa; i.e. the southern,
northwestern, and northeastern region of China. This collection was selected from a clonal
arboretum that includes 1,047 individuals of P. tomentosa assembled from an area of 1
million km2 along the Yellow River (30–40°N, 105–125°E), which was established in Guan
Xian Country (Shandong Province, China, 36°23′N, 115°47′E) in 1982, using a randomized
complete block design approach with three clonal replications (Du et al., 2012). Fresh leaves
were harvested from each genotype in the association population and total genomic DNA
was extracted using the DNeasy Plant Mini Kit (Qiagen, Shanghai, China) according to the
manufacturer’s protocol.

Acc
epte
d A
rtic
le
This article is protected by copyright. All rights reserved.
Phenotypic data
Ten tree growth and wood property traits were scored for all individuals in the association
population with at least three replications per genotype. The growth traits were: DBH (cm),
H (m), and V (m3). The wood properties were: FW (μm), FL (mm), MFA (degrees), LC (%), HC
(%), CC (%), and HEC (%). The detailed sampling and measurement methods were reported
previously (Du et al., 2014). The phenotypic variance (ANOVA) and Pearson’s correlations
coefficients (r) for the 10 quantitative traits were calculated by SPSS Statistics v19.0 (SPSS
Inc., Chicago, IL, USA), in which abundant phenotypic variations were observed and 72.22%
of pairwise correlations were significant at P < 0.05 (Table S8–S9). Additionally, two
enzymatic activity traits, PO (U/(g×min)) and CAD (U/(g×min)), from the mature xylem of P.
tomentosa in the association population were measured according to the protocol of a plant
PO assay kit and a plant CAD assay kit (Nanjing Jiancheng Bioengineering Institute, Jiangsu
Province, China), respectively.
RNA isolation and RNA-sequencing
Total RNAs were extracted from the cambium, developing xylem, mature xylem, and leaves
of 1-year-old P. tomentosa clone “LM50” planted in Guan Xian Country, using the Plant
Qiagen RNAeasy kit following the manufacturer’s instructions, which were used for
transcriptome sequencing of mRNAs and lncRNAs. For biological replicates, three individuals
were used in our studies. FPKM (fragments per kilobase of transcript per million fragments)
were used to normalize the transcripts’ expression. Transcripts abundance failed to detect

Acc
epte
d A
rtic
le
This article is protected by copyright. All rights reserved.
in any tested tissues were excluded in our analysis. The processing of transcriptome data
are described in Methods S1.
RT-qPCR
The RT-qPCR was performed on a 7500 Fast Real-time PCR system using SYBR Premix Ex Taq
(TaKaRa, Dalian, China). The cDNA templates were transcribed from total RNA extracted
from the cambium, developing xylem, mature xylem, and leaves of 1-year-old P. tomentosa
clone “LM50”. The gene-specific primers were designed by Primer Express v5.0 software
(Applied Biosystems; Data S15). All reactions were performed with triplicate technical and
triplicate biological repetitions with Actin (EF145577) as the internal control, according to
the PCR program described in Zhang et al (2011). The melting curve was used to examine
the specificity of the amplification and Opticon Monitor Analysis software v3.1 was used to
analyze the data.
Identification of lignin biosynthetic genes in P. tomentosa
Thirteen lignin biosynthetic gene families (298 gene models) were determined by
phenylpropanoid biosynthesis pathway in the KEGG database (http://www.kegg.jp/kegg/)
and the reports by Shi et al (2010), based on P. trichocarpa genome annotation v3.0 (Tuskan
et al., 2006), and 203 of them were expressed in at least one tested tissue of P. tomentosa
(Data S1). The numerical IDs for the genes were in accordance with Shi et al (2010). The

Acc
epte
d A
rtic
le
This article is protected by copyright. All rights reserved.
newly identified genes, which were not reported in Shi et al (2010) but were annotated in
the KEGG database and the P. trichocarpa genome v3.0, were numbered consecutively.
Prediction of miRNAs and lncRNAs for lignin biosynthetic genes
Small RNAs from six tissues (leaf, phloem, cambium, developing xylem, mature xylem, and
shoot apex), collected from 1-year-old P. tomentosa clone “LM50”, were used to detect the
transcript abundance of miRNAs according to the method described by Xie et al (2016), and
three individuals were used as the biological replicates. TPM (transcripts per million) was
used to normalized the expression of miRNA transcripts. The lncRNA datasets identified in
leaf, cambium, developing xylem, and mature xylem have been reported previously (Tian et
al., 2016; Zhou et al., 2017). The methods for predicting miRNAs and cis/trans-lncRNAs for
lignin biosynthetic genes are described in Methods S1.
Determination of cis-regulatory elements and TFs
We obtained the 2,000-bp upstream sequences from the 5′ end of the 203 lignin
biosynthetic genes in the Populus annotation. The PlantPAN v2.0
(http://PlantPAN2.itps.ncku.edu.tw) was used to analyze the combinatorial cis-regulatory
elements and detect the corresponding TFs, using the promoter sequences of the Populus
genes as background (Chow et al., 2016). The significantly over-represented TFBS were

Acc
epte
d A
rtic
le
This article is protected by copyright. All rights reserved.
identified with a cutoff of P < 0.05 and represented in at least 90% of the genes examined,
information that was used for determining the regulatory TFs with each gene.
Genotyping by re-sequencing
The 435 unrelated individuals of P. tomentosa were re-sequenced using the Illumina GA II
platform with a depth of > 15× (raw data). The filtered reads were mapped to the Populus
reference genome v3.0 (Tuskan et al., 2006), which were used for SNP calling (Methods S1).
We obtained genotype data within the full-length sequences of protein-coding genes and
lncRNA genes, including promoter regions (2,000-bp upstream) and flanking regions (500-bp
downstream), using VCF tools (Danecek et al., 2011). BLASTN and BLASTX were used with a
cutoff E-value < 1E-10 to obtain the location of lncRNA genes and miRNA genes. The lncRNA
genes clustered in the same genomic location were treated as one lncRNA locus, totaling 71
lncRNA loci (Data S3). The genomic DNA sequences of miRNA genes contained the
pre-miRNA and the 600-bp flanking regions on each side of the pre-miRNA. The SNPs used
in our analysis are listed in Data S9–S12. The methods for assessing nucleotide diversity and
LD are listed in Methods S1.
Acc
epte
d A
rtic
le
This article is protected by copyright. All rights reserved.
SNP-based association mapping
The mixed linear model (MLM) in TASSEL v5.0 (Bradbury et al., 2007) was conducted to test
the statistical association between SNPs and tree growth and wood property traits in the
association population, accounting for the population structure (Q) and pairwise kinship
coefficients (K). The K matrix was assessed by SPAGeDi v1.3 (Hardy & Vekemans, 2002),
which was reported previously (Du et al., 2012), and the Q matrix was evaluated via
STRUCTURE v2.3.4 (Evanno et al., 2005) based on significant subpopulations (k = 3).
Additionally, we used GEC software to calculate the effective number of independent SNPs
(Li et al., 2012), considering that many of the SNPs should be in LD. The P-value was
calculated for each association and the significance was defined with a suggestive P-value ≤
6.89E-05 (P = 1/n; n represented the independent marker number, which is roughly a
Bonferroni correction).
Multi SNP-based epistatic interaction analysis
The EPISNP1 package in epiSNP software (Ma et al., 2008) was used to test the pairwise
epistatic effect with P-value < 1E-04. Only the SNPs showing significance with P-value < 0.01
in SNP-based association mapping were used for epistasis analysis. The two-locus
interaction effect was divided into four components: AA, AD, DA, and DD interactions. A
multifactor dimensionality reduction (MDR) algorithm was conducted to investigate the
genotype combination effects in our studies (Hahn et al., 2003).
Acc
epte
d A
rtic
le
This article is protected by copyright. All rights reserved.
eQTN mapping
The eQTNs, defined as associations between candidate SNPs and the expression level of
genes, were performed using the same method as the SNP-based association studies. Total
RNAs extracted from the mature xylem of 435 unrelated individuals of P. tomentosa were
used for RNA-seq in 2016, using the methods described above. Library construction and
sequencing were performed by Beijing Biomarker Technology Cooperation (Beijing, China).
Transcripts expressed in more than 80% of the 435 individuals were retained for eQTN
analysis (Data S13). The detected eQTNs located within a 10-Kb window surrounding the TSS
of its targets were regarded as cis-eQTNs, and the others were treated as trans-eQTNs.
Accession numbers
The lncRNA sequencing data have been deposited in NCBI under the accession number of
SRP073689 and the Genome Sequence Archive in BIG Data Center, Beijing Institute of
Genomics (BIG), Chinese Academy of Sciences (CAS), under accession number of CRA000992
that is publicly accessible at http://bigd.big.ac.cn/gsa/. The miRNA sequencing data,
degradome sequencing data, and the raw data of genome re-sequencing have been
deposited in the Genome Sequence Archive in BIG Data Center (BIG, CAS, China) under
accession number of CRA000983, CRA000989, and CRA000903, respectively.
Acc
epte
d A
rtic
le
This article is protected by copyright. All rights reserved.
Acknowledgements
This work was supported by the State “13.5” Key Research Program of China (No.
2016YFD0600102), the Projects of the National Natural Science Foundation of China (No.
31500550 and 31670333), and the Project of the Natural Science Foundation of Beijing (No.
6172027). The authors declare no conflict of interest.
Authors' contributions
D.Z. designed the experiments; M.Q., Q.D., L.X., and W.L. collected and analyzed the data;
L.X., W.L., J.X., L.W., Y.S., and B.X. performed the experiments; M.Q. and D.Z. wrote the
manuscript; D.Z. obtained funding and is responsible for this article. All authors read and
approved the manuscript.
Legends for Supporting Information
Methods S1. The detailed experimental procedures were described for some methods.
Figure S1. The distribution of enriched transcription factor binding sites (TFBS) in the
promoters of 203 lignin biosynthetic genes.
Figure S2. Expression profiles of candidate genes related to the lignin biosynthesis
pathway. (a) Transcript abundance of 40 lignin biosynthetic genes selected from the 13
gene families revealed by RNA-seq (left) and RT-qPCR (right). (b) Plot of correlation between
RNA-seq and RT-qPCR for 40 lignin biosynthetic genes in four tissues. (c) The expression

Acc
epte
d A
rtic
le
This article is protected by copyright. All rights reserved.
patterns of six lncRNAs, six miRNAs, and nine TF genes selected from the candidate genetic
factors revealed by RT-qPCR in four tissues of P. tomentosa. (d) Plot of correlation for
expression correlations between RNA-seq and RT-qPCR of ncRNA/TFs and their
corresponding genes.
Figure S3. Pairwise linkage disequilibrium (LD) between SNP markers within the same
chromosome and haplotype blocks across 19 chromosomes. The adjacent SNPs in
significant LD are colored red, and high-LD blocks (r2 ≥ 0.75, P ≤ 1.0E-03) are shown in black
triangles.
Figure S4. Decay of LD of candidate genes at the chromosome level in the association
population of P. tomentosa. Nonlinear regressions of r2 onto the physical distance are
described by separate curves for each chromosome.
Figure S5. Manhattan (left) and quantile-quantile plots (right) resulting from the
SNP-based association studies for ten tree growth and wood property traits in the
association population of P. tomentosa. The red line in each Manhattan plot depicts the
Bonferroni-adjusted significance threshold (6.89×10⁻⁵). The x and y axes show the genomic
position and the significance denoted as -log10 (P), respectively.
Figure S6. Significant SNPs and genes identified by SNP-based association studies. (a)
diameter at breast height (DBH), (b) tree height (H), and (c) fiber length (FL). Top,
association results of tree growth and wood property traits, the significant genes are
marked. Middle, the association results on the same chromosome of significant SNPs whose
positions are indicated by black dashed lines. Bottom, the structure of genes with significant

Acc
epte
d A
rtic
le
This article is protected by copyright. All rights reserved.
SNPs. The red line in each Manhattan plot depicts the Bonferroni-adjusted significance
threshold (6.89×10⁻⁵). The x and y axes show the genomic position and the significance
denoted as –log10 (P), respectively.
Figure S7. The epistatic interactions of SNP pairs in the natural population of P.
tomentosa. Epistatic interactions of SNP pairs for fiber width (a-c), diameter at breast height
(d-f), and stem volume (g-i) in the association population of P. tomentosa. (a-b, d-e, g-h) The
single locus effects for the traits. (c, f, i) The epistatic effects of genotype combinations for
the traits.
Figure S8. Summary of the distribution of the eQTNs. (a) The distribution of eQTNs in the
four types of genetic factors. (b) The detailed distribution of eQTNs in lignin biosynthetic
genes and transcription factor genes (c).
Figure S9. The interpretation of causal SNPs for phenotypes by eQTNs. (a) Manhattan plot
displaying the association results for Ptr-COMT30 expression and lignin content. (b) The
overlapped associated loci are marked with dashed lines. (c–d) The genotype effects of
Ptr-HD-ZIP54_SNP13 and L57_SNP8 for lignin content and Ptr-COMT30 expressions,
respectively. We discarded L57_SNP9 as it was in LD with L57_SNP8. (e) Plot of correlations
between lignin content and normalized expression levels of Ptr-COMT30, Ptr-HCT12, and
Ptr-PO54. The r value indicated Pearson’s correlation coefficient. (f) Plot of correlations
between fiber width and normalized expression levels of Ptr-LAC27. (g) Manhattan plot
displaying the association results for Ptr-LAC27 expression marking the causal loci with
epistatic interactions. (h) The epistatic effects of four loci for the variations in expression of
Acc
epte
d A
rtic
le
This article is protected by copyright. All rights reserved.
LAC-27. The blue values indicate the single variant effects and the red values represent the
pairwise effects. (i) Box plots revealing the epistatic effects of different genotypic
combinations for phenotypic variations of Ptr-LAC27 expression.
Table S1. Pearson’s correlation coefficients for each lncRNA-mRNA pair.
Table S2. Pearson’s correlation coefficients for each miRNA-mRNA pair.
Table S3. The enriched transcription factor binding motifs in the promoters of lignin
biosynthesis genes.
Table S4. Details of single nucleotide polymorphisms (SNPs) within all the candidate genes.
Table S5. Details of significant SNPs within candidate genes associated with growth and
wood properties in the association population of P. tomentosa.
Table S6. Detailed information of significant epistatic SNP-SNP pairs for each trait in the
association population of P. tomentosa.
Table S7. Details of eQTNs identified for each gene in the lignin biosynthesis pathway.
Table S8. Phenotypic variation of ten growth and wood property traits in the association
population of P. tomentosa.
Table S9. Phenotypic correlations for tree growth and wood property traits in the
association population of P. tomentosa.
Data S1. The expression profiles of lignin biosynthetic genes detected by RNA-seq in P.
tomentosa.
Acc
epte
d A
rtic
le
This article is protected by copyright. All rights reserved.
Data S2. The lncRNA-mRNA pairs identified in our studies.
Data S3. The expression abundance of lncRNAs detected by RNA-seq and lncRNA loci used
in our analysis.
Data S4. The miRNA-mRNA pairs identified in our studies.
Data S5. The expression abundance of miRNAs detected by RNA-seq in our analysis.
Data S6. The TFBS in each promoter of the lignin biosynthesis genes.
Data S7. Pearson’s correlation coefficients for each TF-mRNA pair.
Data S8. The expression abundance of TF genes detected by RNA-seq used in our analysis.
Data S9. SNPs within lignin biosynthetic genes used for association analysis.
Data S10. SNPs within transcription factor genes used for association analysis.
Data S11. SNPs within lncRNA loci used for association analysis.
Data S12. SNPs within miRNA genes used for association analysis.
Data S13. The gene expression data used for expression QTN mapping in our analysis.
Data S14. Detailed information of significant eQTNs for lignin biosynthetic genes in the
association population of P. tomentosa.
Data S15. Real-time quantitative PCR primers used in our studies.

Acc
epte
d A
rtic
le
This article is protected by copyright. All rights reserved.
References
Anterola AM, Jeon J, Davin LB, Lewis NG (2002) Transcriptional control of monolignol
biosynthesis in pinus taeda: factors affecting monolignol ratios and carbon allocation in
phenylpropanoid metabolism. The Journal of Biological Chemistry 277: 18272-18280.
Bac-Molenaar JA, Vreugdenhil D, Granier C, Keurentjes JJ (2015) Genome-wide association
mapping of growth dynamics detects time-specific and general quantitative trait loci.
Journal of Experimental Botany 66: 5567-5580.
Beaulieu J, Doerksen T, Boyle B, Clement S, Deslauriers M, Beauseigle S, Blais S, Poulin P,
Lenz P, Caron S, Rigault P, Bicho P, Bousquet J, MacKay J (2011) Association genetics of
wood physical traits in the conifer white spruce and relationships with gene expression.
Genetics 188: 197-329.
Bhuiyan NH, Selvaraj G, Wei Y, King J (2009) Role of lignification in plant defense. Plant
Signaling & Behavior 4: 158-159.
Blount JW, Korth KL, Masoud SA, Rasmussen S, Lamb C, Dixon RA (2000) Altering expression
of cinnamic acid 4-hydroxylase in transgenic plants provides evidence for a feedback loop at
the entry point into the phenylpropanoid pathway. Plant Physiology 122: 107-116.
Bonawitz ND, Chapple C (2010) The genetics of lignin biosynthesis: connecting genotype to
phenotype. Annual Review of Genetics 44: 337-363.
Acc
epte
d A
rtic
le
This article is protected by copyright. All rights reserved.
Bradbury PJ, Zhang Z, Kroon DE, Casstevens TM, Ramdoss Y, Buckler ES (2007) Tassel:
software for association mapping of complex traits in diverse samples. Bioinformatics 23:
2633-2635.
Bryois J, Buil A, Evans DM, Kemp JP, Montgomery SB (2014) Cis and Trans effects of human
genomic variants on gene expression. PLoS Genetics, 10: e1004461.
Campbell MM, Sederoff RR (1996) Variation in lignin content and composition (mechanisms
of control and implications for the genetic improvement of plants. Plant Physiology 110:
3-13.
Chen J, Chen B, Yang X, Tian J, Du Q, Zhang D (2015) Association genetics in Populus reveals
the interactions between Pt-mir397a and its target genes. Scientific Reports 5: 11672.
Chow C, Zheng H, Wu N, Chien C, Huang H, Lee T, Chiang-Hsieh Y, Hou P, Yang T, Chang W
(2016) Plantpan 2.0: an update of plant promoter analysis navigator for reconstructing
transcriptional regulatory networks in plants. Nucleic Acids Research 44: D1154-D1160.
Danecek P, Auton A, Abecasis G, Albers CA, Banks E, DePristo MA, Handsaker RE, Lunter G,
Marth GT, Sherry ST, McVean G, Durbin R (2011) The variant call format and vcftools.
Bioinformatics 27: 2156-2158.
Deng M, Li D, Luo J, Xiao Y, Liu H, Pan Q, Zhang X, Jin M, Zhao M, Yan J (2017). The genetic
architecture of amino acids dissection by association and linkage analysis in maize. Plant
Biotechnology Journal 15: 1250-1263.
Acc
epte
d A
rtic
le
This article is protected by copyright. All rights reserved.
Drost DR, Benedict CI, Berg A, Novaes E, Novaes CRDB, Yu Q, Dervinis C, Maia JM, Yap J,
Miles B, Kirst M (2010) Diversification in the genetic architecture of gene expression and
transcriptional networks in organ differentiation of Populus. Proceedings of the National
Academy of Sciences of the United States of America 107: 8492-8497.
Du Q, Tian J, Yang X, Pan W, Xu B, Li B, Ingvarsson PK, Zhang D (2015) Identification of
additive, dominant, and epistatic variation conferred by key genes in cellulose biosynthesis
pathway in Populus tomentosa. DNA Research 22: 53-67.
Du Q, Wang B, Wei Z, Zhang D, Li B (2012) Genetic diversity and population structure of
Chinese white poplar (Populus tomentosa) revealed by SSR markers. Journal of Heredity 103:
853-862.
Du Q, Xu B, Gong C, Yang X, Pan W, Tian J, Li B, Zhang D (2014). Variation in growth, leaf,
and wood property traits of Chinese white poplar (Populus tomentosa), a major industrial
tree species in northern china. Canadian Journal of Forest Research 44: 326-339.
Evanno G, Regnaut S, Goudet J (2005) Detecting the number of clusters of individuals using
the software structure: a simulation study. Molecular Ecology 14: 2611-2620.
Franco-Zorrilla JM, Valli A, Todesco M, et al., (2007). Target mimicry provides a new
mechanism for regulation of microRNA activity. Nature Genetics 39: 1033-1037.
Gilchrist EJ, Haughn GW, Ying CC, Otto SP, Zhuang J, Cheung D, Hamberger B, Aboutorabi F,
Kalynyak T, Johnson L, Bohlmann J, Ellis BE, Douglas CJ and Cronk QC (2006) Use of Ecotilling
Acc
epte
d A
rtic
le
This article is protected by copyright. All rights reserved.
as an efficient SNP discovery tool to survey genetic variation in wild populations of Populus
trichocarpa. Molecular Ecology 15:1367-1378.
Guerra FP, Wegrzyn JL, Sykes R, Davis MF, Stanton BJ, Neale DB (2013) Association genetics
of chemical wood properties in black poplar (Populus nigra). New Phytologist 197: 162-176.
Hahn LW, Ritchie MD, Moore JH (2003) Multifactor dimensionality reduction software for
detecting gene-gene and gene-environment interactions. Bioinformatics 19: 376-382.
Halpin C, Knight ME, Foxon GA, Campbell MM, Boudet AM, Boon JJ, Chabbert B, Tollier M,
Schuch W (1994) Manipulation of lignin quality by downregulation of cinnamyl alcohol
dehydrogenase. The Plant Journal 3: 339-350.
Hardy O, Vekemans X (2002) SPAGeDi: a versatile computer program to analyse spatial
genetic structure at the individual or population levels. Molecular Ecology Resource 2:
618-620.
Ingvarsson PK, Street NR (2011) Association genetics of complex traits in plants. New
Phytologist 189: 909-922.
Karakülah G, Yücebilgili Kurtoğlu K, Unver T (2016) PeTMbase: A database of plant
endogenous target mimics (eTMs). PLoS One 11: e0167698.
Li G, An S, Zhang J, Li J, Wang Y, Sun J (2003) Impact of salt stress on peroxidase activity in
Populus deltoides cambium and its consequence. The Journal of Applied Ecology 14:
871-874.
Acc
epte
d A
rtic
le
This article is protected by copyright. All rights reserved.
Li H, Peng Z, Yang X, Wang W, Fu J, Wang J, Han Y, Chai Y, Guo T, Yang N, Liu J, Warburton
ML, Cheng Y, Hao X, Zhang P, Zhao J, Liu Y, Wang G, Li J, Yan J (2013) Genome-wide
association study dissects the genetic architecture of oil biosynthesis in maize kernels.
Nature Genetics 45: 43-50.
Li M, Yeung JMY, Cherny SS, Sham PC (2012) Evaluating the effective numbers of
independent tests and significant P-value thresholds in commercial genotyping arrays and
public imputation reference datasets. Human Genetics 131: 747-756.
Li X, Zhu C, Yeh CT, Wu W, Takacs EM, Petsch KA, Tian F, Bai G, Buckler ES, Muehlbauer GJ,
Timmermans MC, Scanlon MJ, Schnable PS, Yu J (2012) Genic and nongenic contributions to
natural variation of quantitative traits in maize. Genome Research 22: 2436-2444.
Liu H, Luo X, Niu L, Xiao Y, Chen L, Liu J, Wang X, Jin M, Li W, Zhang Q, Yan J (2017) Distant
eQTLs and non-coding sequences play critical roles in regulating gene expression and
quantitative trait variation in maize. Molecular Plant 10: 414-426.
Lu S, Li Q, Wei H, Chang MJ, Tunlaya-Anukit S, Kim H, Liu J, Song J, Sun YH, Yuan L, Yeh TF,
Peszlen I, Ralph J, Sederoff RR, Chiang VL (2013) Ptr-miR397a is a negative regulator of
laccase genes affecting lignin content in Populus trichocarpa. Proceedings of the National
Academy of Sciences of the United States of America 110: 10848-10853.
Ma L, Runesha HB, Dvorkin D, Garbe JR, Da Y (2008) Parallel and serial computing tools for
testing single-locus and epistatic SNP effects of quantitative traits in genome-wide
association studies. BMC Bioinformatics 9: 315.

Acc
epte
d A
rtic
le
This article is protected by copyright. All rights reserved.
Mackay TFC (2014) Epistasis and quantitative traits: using model organisms to study
gene-gene interactions. Nature Review Genetics 15: 22-33.
Neale DB, Savolainen O (2004) Association genetics of complex traits in conifers. Trends in
Plant Science 9: 325-330.
Novaes E, Kirst M, Chiang V, Winter-Sederoff H, Sederoff R (2010) Lignin and biomass: a
negative correlation for wood formation and lignin content in trees. Plant Physiology 154:
555-561.
Patzlaff A, McInnis S, Courtenay A, Surman C, Newman LJ, Smith C, Bevan MW, Mansfield S,
Whetten RW, Sederoff RR, Campbell MM (2003) Characterisation of a pine MYB that
regulates lignification. Plant Journal 36: 743-754.
Ros BA (1997) Lignification in plant cell walls. International Review of Cytology 176: 87-132.
Sewalt V, Ni W, Blount JW, Jung HG, Masoud SA, Howles PA, Lamb C, Dixon RA (1997)
Reduced lignin content and altered lignin composition in transgenic tobacco down-regulated
in expression of l-phenylalanine ammonia-lyase or cinnamate 4-hydroxylase. Plant
Physiology 115: 41-50.
Shi R, Sun Y, Li Q, Heber S, Sederoff R, Chiang VL (2010) Towards a systems approach for
lignin biosynthesis in Populus trichocarpa: transcript abundance and specificity of the
monolignol biosynthetic genes. Plant and Cell Physiology 51: 144-163.
Slavov GT, DiFazio SP, Martin J, Schackwitz W, Muchero W, Rodgers-Melnick E, Lipphardt
MF, Pennacchio CP, Hellsten U, Pennacchio LA, Gunter LE, Ranjan P, Vining K, Pomraning KR,

Acc
epte
d A
rtic
le
This article is protected by copyright. All rights reserved.
Wilhelm LJ, Pellegrini M, Mockler TC, Freitag M, Geraldes A, El-Kassaby YA, Mansfield SD,
Cronk QC, Douglas CJ, Strauss SH, Rokhsar D and Tuskan GA (2012) Genome resequencing
reveals multiscale geographic structure and extensive linkage disequilibrium in the forest
tree Populus trichocarpa. New Phytologist 196:713-725.
Solovieff N, Cotsapas C, Lee PH, Purcell SM, Smoller JW (2013). Pleiotropy in complex traits:
challenges and strategies. Nature Review Genetics 14: 483-495.
Terwilliger JD, Hiekkalinna T (2006) An utter refutation of the ‘Fundamental Theorem of the
HapMap’. European Journal of Human Genetics 14: 426–437.
Thumma BR, Nolan MF, Evans R, Moran GF (2005) Polymorphisms in cinnamoyl CoA
reductase (CCR) are associated with variation in microfibril angle in Eucalyptus spp. Genetics
171: 1257-1265.
Tian J, Song Y, QingzhangDu, Yang X, Ci D, Chen J, Xie J, Li B, Zhang D (2016) Population
genomic analysis of gibberellin-responsive long non-coding RNAs in Populus. Journal of
Experimental Botany 67: 2467-2482.
Tuskan GA, Difazio S, Jansson S, Bohlmann J, Grigoriev I, Hellsten U, Putnam N, Ralph S,
Rombauts S, Salamov A, et al., (2006) The genome of black cottonwood, Populus trichocarpa
(Torr. & Gray). Science 313: 1596-1604.
Voelker SL, Lachenbruch B, Meinzer FC, Jourdes M, Ki C, Patten AM, Davin LB, Lewis NG,
Tuskan GA, Gunter L, Decker SR, Selig MJ, Sykes R, Himmel ME, Kitin P, Shevchenko O,

Acc
epte
d A
rtic
le
This article is protected by copyright. All rights reserved.
Strauss SH (2010) Antisense down-regulation of 4CL expression alters lignification, tree
growth, and saccharification potential of field-grown poplar. Plant Physiology 154: 874-886.
VanLiere JM and Rosenberg NA (2008) Mathematical properties of the measure of the r2
measurement of linkage disequilibrium. Theoretical Population Biology 74:130-137.
Voxeur A, Wang Y, Sibout R (2015) Lignification: different mechanisms for a versatile
polymer. Current Opinion in Plant Biology 23: 83-90.
Wegrzyn JL, Eckert AJ, Choi M, Lee JM, Stanton BJ, Sykes R, Davis MF, Tsai C, Neale DB
(2010) Association genetics of traits controlling lignin and cellulose biosynthesis in black
cottonwood (Populus trichocarpa, salicaceae) secondary xylem. New Phytologist 188:
515-532.
Wen W, Li D, Li X, Gao Y, Li W, Li H, Liu J, Liu H, Chen W, Luo J, Yan J (2014)
Metabolome-based genome-wide association study of maize kernel leads to novel
biochemical insights. Nature Communications 5: 3438.
Westra H, Franke L (2014) From genome to function by studying eQTLs. Biochimica et
Biophysica Acta (BBA)-Molecular Basis of Disease 1842: 1896-1902.
Xie J, Yang X, Song Y, Du Q, Li Y, Chen J, Zhang D (2016) Adaptive evolution and functional
innovation of Populus-specific recently evolved microRNAs. New Phytologist 213: 206-219.
Xu S, Jia Z (2007) Genomewide analysis of epistatic effects for quantitative traits in barley.
Genetics 175: 1955-1963.

Acc
epte
d A
rtic
le
This article is protected by copyright. All rights reserved.
Zhang D, Xu B, Yang X, Zhang Z, Li B (2011) The sucrose synthase gene family in Populus:
structure, expression, and evolution. Tree Genetics & Genomes 7: 443-456.
Zhao Q, Dixon RA (2011) Transcriptional networks for lignin biosynthesis: more complex
than we thought? Trends in Plant Science 16: 227-233.
Zhou D, Du Q, Chen J, Wang Q, Zhang D (2017) Identification and allelic dissection uncover
roles of lncRNAs in secondary growth of Populus tomentosa. DNA Research 24: 473-486.
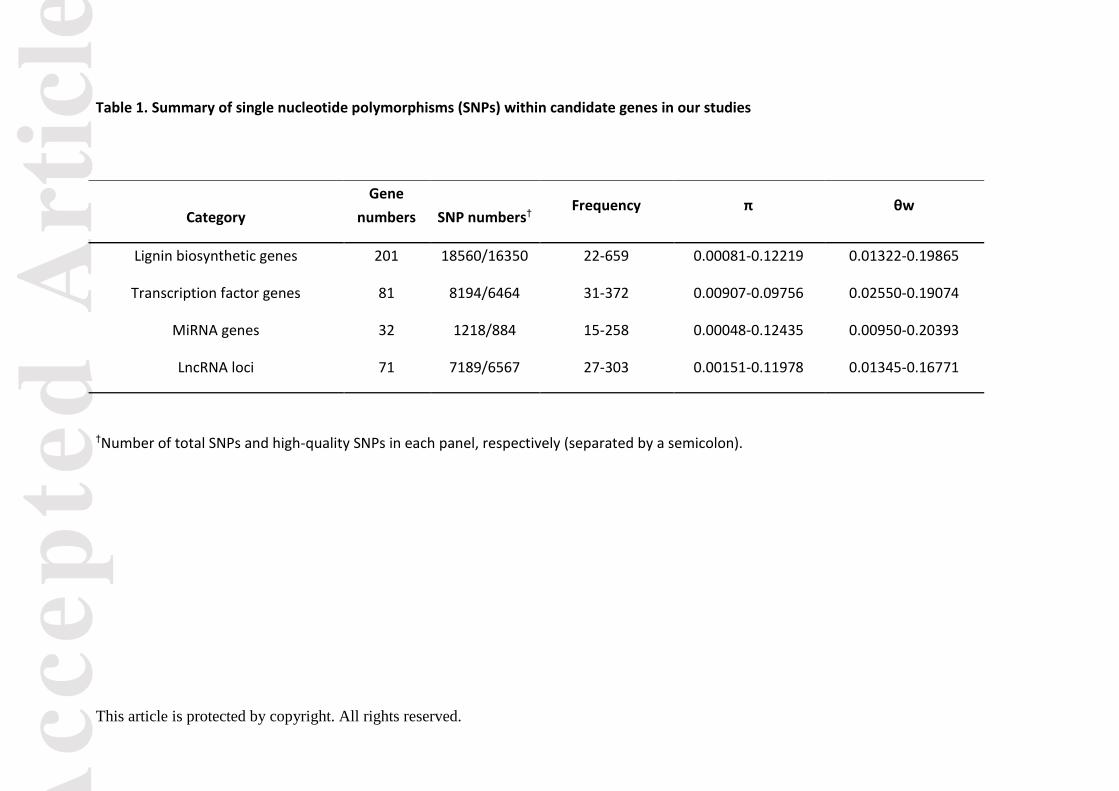
Acc
epte
d A
rtic
le
This article is protected by copyright. All rights reserved.
Table 1. Summary of single nucleotide polymorphisms (SNPs) within candidate genes in our studies
Category
Gene
numbers SNP numbers† Frequency π θw
Lignin biosynthetic genes 201 18560/16350 22-659 0.00081-0.12219 0.01322-0.19865
Transcription factor genes 81 8194/6464 31-372 0.00907-0.09756 0.02550-0.19074
MiRNA genes 32 1218/884 15-258 0.00048-0.12435 0.00950-0.20393
LncRNA loci 71 7189/6567 27-303 0.00151-0.11978 0.01345-0.16771
†Number of total SNPs and high-quality SNPs in each panel, respectively (separated by a semicolon).

Acc
epte
d A
rtic
le
This article is protected by copyright. All rights reserved.
Table 2. Summary of causal SNPs within candidate genes associated with growth and wood properties in the association population of P.
tomentosa
Trait Number of
Associations
SNP
numbers
Independent
SNP
numbers
The source of significant SNPs
Additive
effect
Dominant
effect R2 (%) lignin
biosynthetic
genes
Transcription
factor genes
MiRNA
gene
LncRNA
loci
DBH 27 27 26 9 6 4 8 0.090-7.913 -4.222-8.645 20.59-26.85
H 3 3 2 3 0 0 0 1.436-2.194 -4.009-2.762 20.17-22.41
V 10 10 10 3 2 1 4 1.497-30.608 -31.147-33.557 21.14-23.57
MAF 10 10 4 0 7 0 3 0.696-1.546 -5.573-5.569 18.32-26.64
FW 31 27 21 22 4 0 5 0.262-3.49 -1.703-4.541 17.62-25.48
FL 21 19 13 12 4 0 5 0.001-0.099 -0.328-0.057 15.39-27.36
CC 1 1 1 0 1 0 0 2.822 - 17.45
HC 11 11 10 6 4 0 1 0.514-12.967 -20.164-22.254 18.19-31.3
HEC 1 1 1 0 1 0 0 13.981 11.088 22.80
LC 9 9 8 4 2 0 3 0.296-2.101 -1.021-3.564 13.14-20.65

Acc
epte
d A
rtic
le
This article is protected by copyright. All rights reserved.
Table and Figure legends
Table 1. Summary of single nucleotide polymorphisms (SNPs) within candidate genes in
our studies
Table 2. Summary of causal SNPs within candidate genes associated with growth and
wood properties in the association population of P. tomentosa
Figure 1. The proposed multi-SNP-based genotype combinations for lignin content. (a)
Manhattan plot for lignin content marked with the eight causal genes whose significant
SNPs simultaneously associated with lignin content. (b) Pairwise LD plots among multiple
loci around each causal SNP; the pink and red blocks represent the r2 of two SNPs that were
less than and greater than 0.75, respectively. (c) Genotype effects of each causal SNP for
lignin content. (d) Seven possible genotype combinations with a frequency of ≥ 5% from the
eight allelic variations, and the genotype combination effects for lignin content in the
association population of P. tomentosa. The SNPs in each genotype combination were
ordered according to (c). We used SNP8 in L57, as L57-SNP8/9 were in LD.
Figure 2. The proposed genetic interactive network among genetic factors in lignin
biosynthesis pathway, which exemplified by S-lignin biosynthesis. The red circles
represented the lignin biosynthetic genes and blue circles represente lncRNAs, miRNAs, and
TFs that had epistatic interactions with lignin biosynthetic genes. The blue circles marked
“L” depict the lncRNA locus.
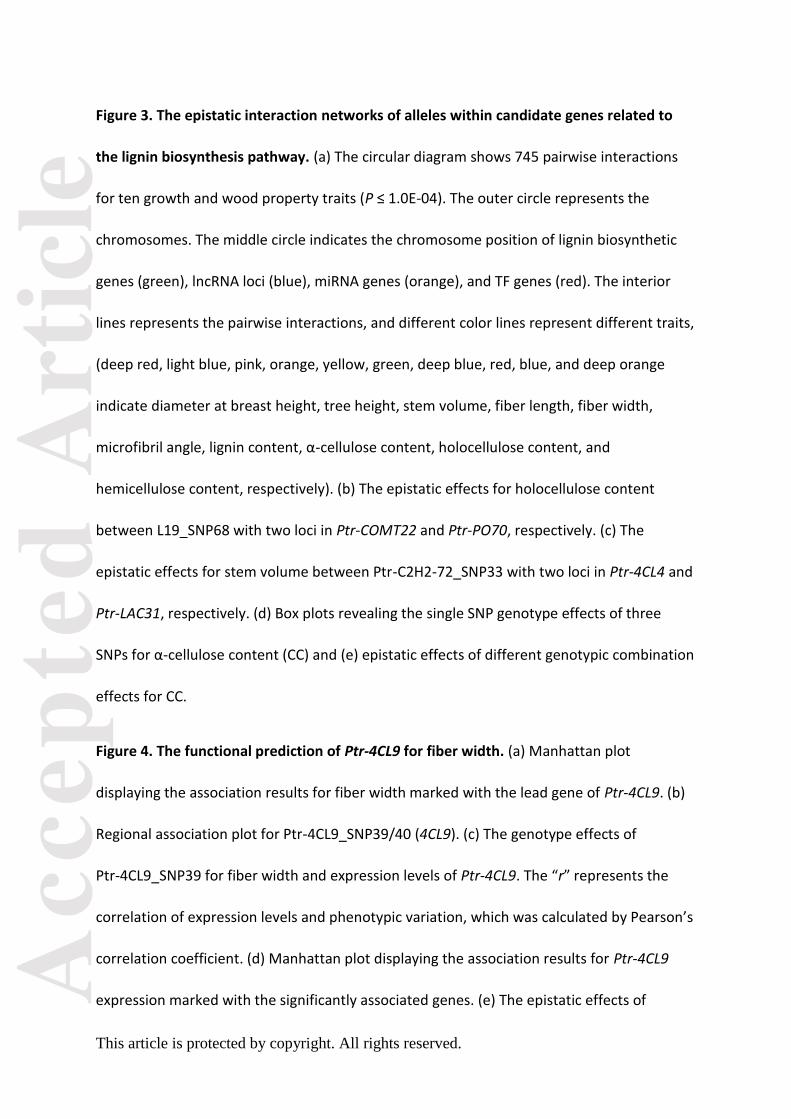
Acc
epte
d A
rtic
le
This article is protected by copyright. All rights reserved.
Figure 3. The epistatic interaction networks of alleles within candidate genes related to
the lignin biosynthesis pathway. (a) The circular diagram shows 745 pairwise interactions
for ten growth and wood property traits (P ≤ 1.0E-04). The outer circle represents the
chromosomes. The middle circle indicates the chromosome position of lignin biosynthetic
genes (green), lncRNA loci (blue), miRNA genes (orange), and TF genes (red). The interior
lines represents the pairwise interactions, and different color lines represent different traits,
(deep red, light blue, pink, orange, yellow, green, deep blue, red, blue, and deep orange
indicate diameter at breast height, tree height, stem volume, fiber length, fiber width,
microfibril angle, lignin content, α-cellulose content, holocellulose content, and
hemicellulose content, respectively). (b) The epistatic effects for holocellulose content
between L19_SNP68 with two loci in Ptr-COMT22 and Ptr-PO70, respectively. (c) The
epistatic effects for stem volume between Ptr-C2H2-72_SNP33 with two loci in Ptr-4CL4 and
Ptr-LAC31, respectively. (d) Box plots revealing the single SNP genotype effects of three
SNPs for α-cellulose content (CC) and (e) epistatic effects of different genotypic combination
effects for CC.
Figure 4. The functional prediction of Ptr-4CL9 for fiber width. (a) Manhattan plot
displaying the association results for fiber width marked with the lead gene of Ptr-4CL9. (b)
Regional association plot for Ptr-4CL9_SNP39/40 (4CL9). (c) The genotype effects of
Ptr-4CL9_SNP39 for fiber width and expression levels of Ptr-4CL9. The “r” represents the
correlation of expression levels and phenotypic variation, which was calculated by Pearson’s
correlation coefficient. (d) Manhattan plot displaying the association results for Ptr-4CL9
expression marked with the significantly associated genes. (e) The epistatic effects of
Acc
epte
d A
rtic
le
This article is protected by copyright. All rights reserved.
three-locus genotype combinations for the expression level of Ptr-4CL9. (f) Expression
patterns of Ptr-4CL9 and its cis lncRNAs in four tissues of P. tomentosa. (g) Plot of
correlation between the peroxidase enzymatic activity and phenotype variations of fiber
width.
Figure 5. The proposed function of Ptr-C4H3 for lignin content. (a) Manhattan plot
displaying the association results for lignin content marked with the lead gene of Ptr-C4H3.
(b) Regional association plot for Ptr-C4H3_SNP69. (c) The gene structure of Ptr-C4H3. (d)
Pairwise LD between the lead SNP (Ptr-C4H3_SNP69) and SNPs around it. (e) Manhattan
plot for the association results of Ptr-C4H3 expression marked with significantly associated
genes; the red frame represents the four causal genes with epistatic interactions. (f)
Correlation for lignin content and normalized expression levels of Ptr-C4H3, which is
indicated by “r” calculated by Pearson’s correlation coefficient. (g) The epistatic interactions
of four loci for variations in lignin content. The blue values indicate the single variant effects
and the red values represent the pairwise effects. (h) Expression patterns (top) and the
Pearson’s correlation coefficient (bottom) of Ptr-4CL9 and its eQTNs hosted genes in four
tissues and organs of P. tomentosa.

Acc
epte
d A
rtic
le
This article is protected by copyright. All rights reserved.
Figure 1 The proposed multi-SNP-based genotype combinations for lignin content. (a)
Manhattan plot for lignin content marked with the eight causal genes whose significant
SNPs simultaneously associated with lignin content. (b) Pairwise LD plots among multiple
loci around each causal SNP; the pink and red blocks represent the r2 of two SNPs that were
less than and greater than 0.75, respectively. (c) Genotype effects of each causal SNP for
lignin content. (d) Seven possible genotype combinations with a frequency of ≥ 5% from the
eight allelic variations, and the genotype combination effects for lignin content in the
association population of P. tomentosa. The SNPs in each genotype combination were
ordered according to (c). We used SNP8 in L57, as L57-SNP8/9 were in LD.
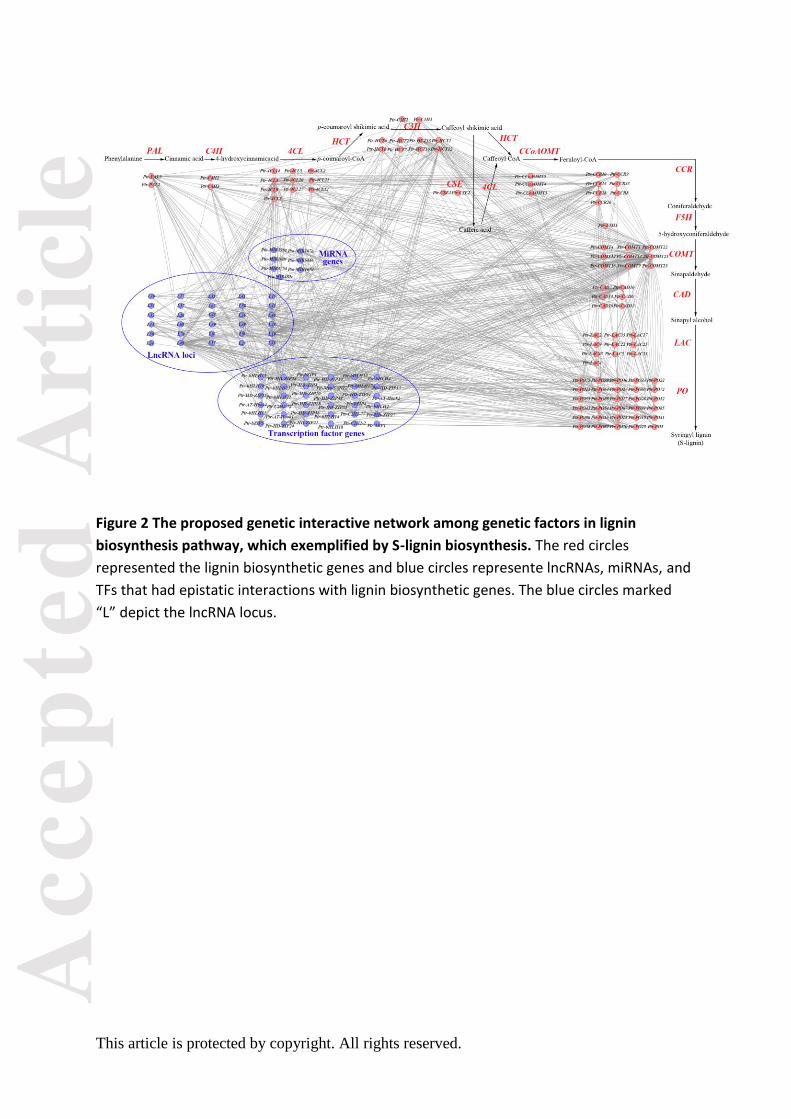
Acc
epte
d A
rtic
le
This article is protected by copyright. All rights reserved.
Figure 2 The proposed genetic interactive network among genetic factors in lignin
biosynthesis pathway, which exemplified by S-lignin biosynthesis. The red circles
represented the lignin biosynthetic genes and blue circles represente lncRNAs, miRNAs, and
TFs that had epistatic interactions with lignin biosynthetic genes. The blue circles marked
“L” depict the lncRNA locus.
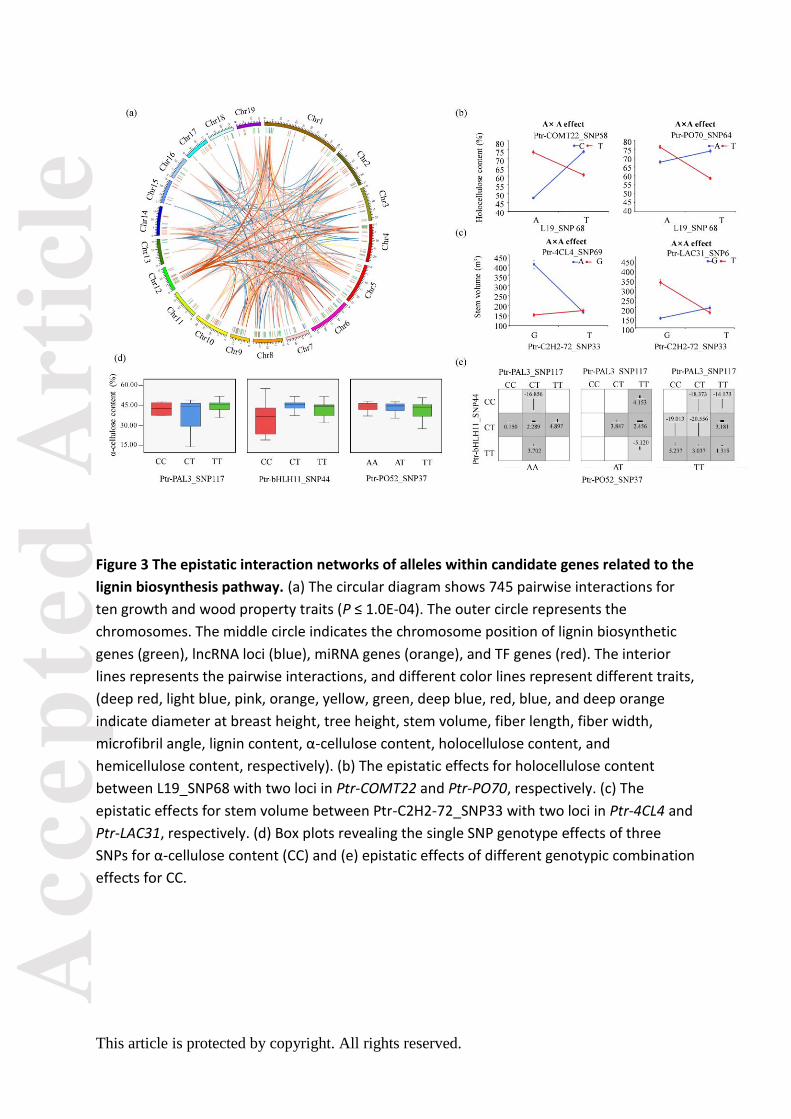
Acc
epte
d A
rtic
le
This article is protected by copyright. All rights reserved.
Figure 3 The epistatic interaction networks of alleles within candidate genes related to the
lignin biosynthesis pathway. (a) The circular diagram shows 745 pairwise interactions for
ten growth and wood property traits (P ≤ 1.0E-04). The outer circle represents the
chromosomes. The middle circle indicates the chromosome position of lignin biosynthetic
genes (green), lncRNA loci (blue), miRNA genes (orange), and TF genes (red). The interior
lines represents the pairwise interactions, and different color lines represent different traits,
(deep red, light blue, pink, orange, yellow, green, deep blue, red, blue, and deep orange
indicate diameter at breast height, tree height, stem volume, fiber length, fiber width,
microfibril angle, lignin content, α-cellulose content, holocellulose content, and
hemicellulose content, respectively). (b) The epistatic effects for holocellulose content
between L19_SNP68 with two loci in Ptr-COMT22 and Ptr-PO70, respectively. (c) The
epistatic effects for stem volume between Ptr-C2H2-72_SNP33 with two loci in Ptr-4CL4 and
Ptr-LAC31, respectively. (d) Box plots revealing the single SNP genotype effects of three
SNPs for α-cellulose content (CC) and (e) epistatic effects of different genotypic combination
effects for CC.

Acc
epte
d A
rtic
le
This article is protected by copyright. All rights reserved.
Figure 4 The functional prediction of Ptr-4CL9 for fiber width. (a) Manhattan plot displaying
the association results for fiber width marked with the lead gene of Ptr-4CL9. (b) Regional
association plot for Ptr-4CL9_SNP39/40 (4CL9). (c) The genotype effects of Ptr-4CL9_SNP39
for fiber width and expression levels of Ptr-4CL9. The “r” represents the correlation of
expression levels and phenotypic variation, which was calculated by Pearson’s correlation
coefficient. (d) Manhattan plot displaying the association results for Ptr-4CL9 expression
marked with the significantly associated genes. (e) The epistatic effects of three-locus
genotype combinations for the expression level of Ptr-4CL9. (f) Expression patterns of
Ptr-4CL9 and its cis lncRNAs in four tissues of P. tomentosa. (g) Plot of correlation between
the peroxidase enzymatic activity and phenotype variations of fiber width.
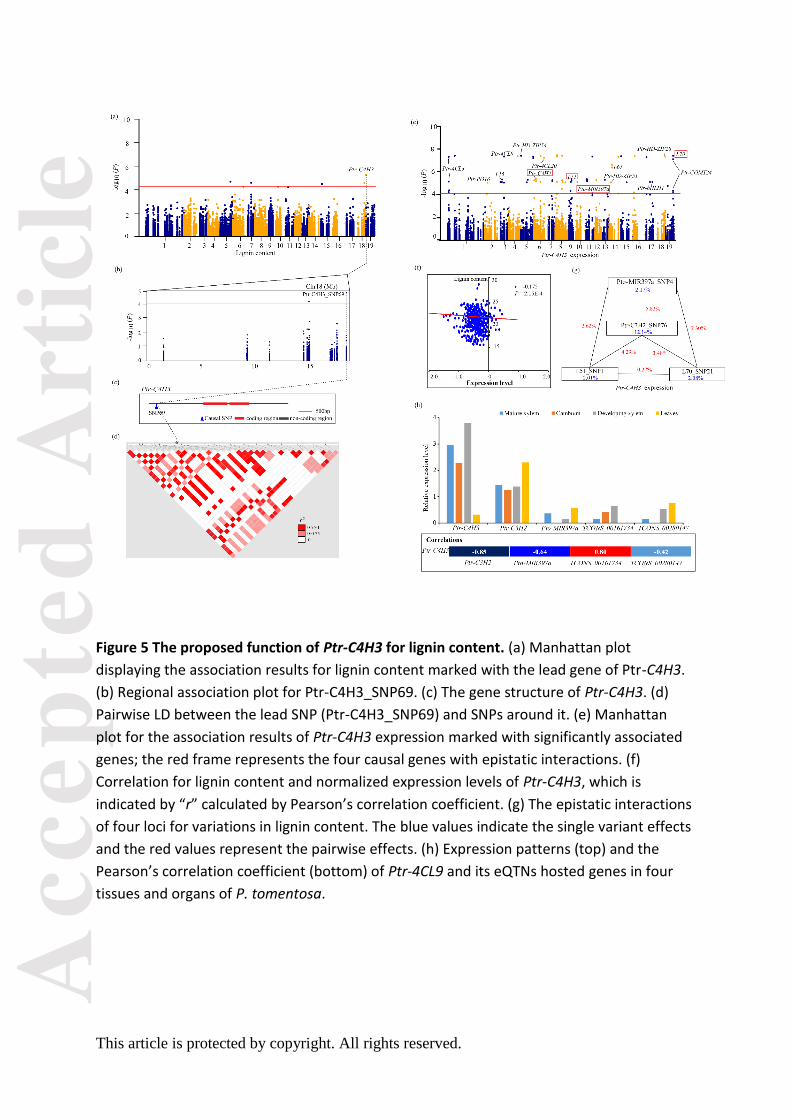
Acc
epte
d A
rtic
le
This article is protected by copyright. All rights reserved.
Figure 5 The proposed function of Ptr-C4H3 for lignin content. (a) Manhattan plot
displaying the association results for lignin content marked with the lead gene of Ptr-C4H3.
(b) Regional association plot for Ptr-C4H3_SNP69. (c) The gene structure of Ptr-C4H3. (d)
Pairwise LD between the lead SNP (Ptr-C4H3_SNP69) and SNPs around it. (e) Manhattan
plot for the association results of Ptr-C4H3 expression marked with significantly associated
genes; the red frame represents the four causal genes with epistatic interactions. (f)
Correlation for lignin content and normalized expression levels of Ptr-C4H3, which is
indicated by “r” calculated by Pearson’s correlation coefficient. (g) The epistatic interactions
of four loci for variations in lignin content. The blue values indicate the single variant effects
and the red values represent the pairwise effects. (h) Expression patterns (top) and the
Pearson’s correlation coefficient (bottom) of Ptr-4CL9 and its eQTNs hosted genes in four
tissues and organs of P. tomentosa.