genesys+™ series communication installation and
TRANSCRIPT

1
GENESYS+ Series Communication Installation and Applications Guide
IA761-04-03G
2
REVISION HISTORY
Date Revision Issue Oct. 2017 Initial Revision Aug. 2018 A 1. Update Software Requirements. Brief regarding Excel requirement.
2. Update Table of Contents. Incorrect page numbering. 3. Update Table of Figures. Incorrect page numbering. 4. Add NI copyright (page 6). 5. Update Figure 1 & 5 (add IVI driver to the main CD-ROM page). 6. Update Figure 31 (Additional registers – GERR, PERR, PWS) 7. Page 25 – Decrease Maximum sequence time from 1,000,000mSec to 6E+5mSec 8. Update USB connection sequence (install driver first). Pages 8 and 9. 9. Page 19 – NORM/REV(19) affects Enable signal polarity, not Interlock. 10. Page 26 – File Path updated to C:\Users\Public\Documents\....
Sep. 2018 B Update Figure 1 & 5 (includes Technical Centre Web Page link). Oct. 2018 C Page 16 - Transient Tab, Auxiliary Controls – Fix 3.4 text and reference. May. 2019 D 1. Remove Windows 7 and 32-bit OS support.
2. Add MODBUS-TCP GUI. 3. Add Waveform Creator pre-built Sine, Square, Sawtooth and Triangle. 4. Add General Information (Section 1).
Oct. 2019 E 1. Add EtherCAT ESI File. 2. Add Table of Contents.
May. 2020 F Remove CD-ROM, update manual to refer to TDK-Lambda Web-Page. Jul. 2020 G Added Multi-Model Communication GUI Chapter.
3
Figures: Figure 1 ................................................................................................................................................................ 6 Figure 2 ................................................................................................................................................................ 6 Figure 3 ................................................................................................................................................................ 7 Figure 4 ................................................................................................................................................................ 8 Figure 5 ................................................................................................................................................................ 8 Figure 6 ................................................................................................................................................................ 8 Figure 7 ................................................................................................................................................................ 9 Figure 8 ................................................................................................................................................................ 9 Figure 9 .............................................................................................................................................................. 10 Figure 10 ............................................................................................................................................................ 10 Figure 11 ............................................................................................................................................................ 11 Figure 12 ............................................................................................................................................................ 11 Figure 13 ............................................................................................................................................................ 12 Figure 14 ............................................................................................................................................................ 14 Figure 15 ............................................................................................................................................................ 17 Figure 16 ............................................................................................................................................................ 18 Figure 17 ............................................................................................................................................................ 18 Figure 18 ............................................................................................................................................................ 20 Figure 19 ............................................................................................................................................................ 21 Figure 20 ............................................................................................................................................................ 21 Figure 21 ............................................................................................................................................................ 22 Figure 22 ............................................................................................................................................................ 22 Figure 23 ............................................................................................................................................................ 24 Figure 24 ............................................................................................................................................................ 24 Figure 25 ............................................................................................................................................................ 25 Figure 26 ............................................................................................................................................................ 25 Figure 27 ............................................................................................................................................................ 27 Figure 28 ............................................................................................................................................................ 28 Figure 29 ............................................................................................................................................................ 29 Figure 30 ............................................................................................................................................................ 30 Figure 31 ............................................................................................................................................................ 31 Figure 32 ............................................................................................................................................................ 31 Figure 33 ............................................................................................................................................................ 33 Figure 34 ............................................................................................................................................................ 33 Figure 35 ............................................................................................................................................................ 35 Figure 36 ............................................................................................................................................................ 36 Figure 37 ............................................................................................................................................................ 37 Figure 38 ............................................................................................................................................................ 38 Figure 39 ............................................................................................................................................................ 39
4
1. Table of Contents
2. GENERAL INFORMATION ................................................................................................................... 5
3. SYSTEM INTRODUCTION .................................................................................................................... 5
INTRODUCTION ........................................................................................................................................................ 5 COMMUNICATION INTERFACE .................................................................................................................................... 5 SOFTWARE REQUIREMENTS ....................................................................................................................................... 5 MINIMUM HARDWARE REQUIREMENTS ....................................................................................................................... 5
4. APPLICATIONS AND LABVIEW RUN-TIME INSTALLATION .................................................................... 6
5. MODBUS-TCP APPLICATION INSTALLATION ....................................................................................... 7
6. USB DRIVER INSTALLATION ............................................................................................................... 8
7. ADD NEW LAN DEVICE ..................................................................................................................... 10
8. GENESYS+ WAVEFORM CREATOR .................................................................................................... 12
INTRODUCTION ...................................................................................................................................................... 12 INTERFACE TAB ................................................................................................................................................... 12 TRANSIENT TAB .................................................................................................................................................. 14
9. GENESYS+ VIRTUAL FRONT PANEL ................................................................................................... 18
MAIN FEATURES ................................................................................................................................................ 19 Common Features .................................................................................................................................... 19 Virtual Front Panel (VFP) .......................................................................................................................... 19 Status Logger............................................................................................................................................ 19 Waveform Profiler .................................................................................................................................... 19 V/I Graph .................................................................................................................................................. 19 Advanced Settings .................................................................................................................................... 19
APPLICATION RUN .................................................................................................................................................. 20 VIRTUAL FRONT PANEL (VFP) .................................................................................................................................. 21 STATUS LOGGER .................................................................................................................................................... 24 WAVEFORM PROFILER ............................................................................................................................................ 25 V/I GRAPH............................................................................................................................................................ 28 ADVANCED TAB .................................................................................................................................................. 31
10. GENESYS+ MODBUS-TCP VIRTUAL FRONT PANEL .......................................................................... 33
APPLICATION RUN .................................................................................................................................................. 33
11. GENESYS+ ETHERCAT ESI FILE ....................................................................................................... 35
12. MULTI-MODEL COMMUNICATION ................................................................................................ 36
INTRODUCTION ...................................................................................................................................................... 36 COMMUNICATION SETUP ........................................................................................................................................ 36 OPERATION ........................................................................................................................................................... 37
5
2. General Information Documentation (including this Manual) is subject to change without notice. Refer to TDK-Lambda Technical Data web page for an up-to-date documentation: https://www.emea.lambda.tdk.com/uk/technical-data/data.aspx?resource=Installation-Manuals Drivers and GUIs are updated periodically to support new features. Refer to TDK-Lambda Technical Centre web page for up-to-date drivers and GUIs: https://www.emea.lambda.tdk.com/uk/technical-centre/software-tools.aspx
3. System Introduction
Introduction This software is applicable to TDK-Lambda series power supplies only.
Communication Interface There are six types of communication interfaces between a PC to a power supply.
• RS232/RS485 • USB • Ethernet (LAN) • GPIB • MODBUS-TCP • EtherCAT
Software Requirements • Microsoft Windows 10 (64bit) • Microsoft Excel 2007 or higher, supporting *.xlsx format (only if Store/Load functions are required)
Minimum Hardware Requirements • Intel i3 processor or above • At least 20GB hard disk space • At least 4GB memory • Display resolution: 1280x768 (Scale and layout set to 100%)
GUIs Developed in LabVIEW Copyright © [2018] National Instruments Corporation. All Rights Reserved.
Modbus® is a registered trademark of Schneider Electric, licensed to the Modbus Organization, Inc.
EtherCAT® is a registered trademark and patented technology, licensed by Beckhoff Automation GmbH, Germany.
6
4. Applications and LabVIEW Run-Time Installation
1. Navigate to: https://www.emea.lambda.tdk.com/uk/technical-centre/software-tools.aspx 2. Click on GENESYS+TM tab. 3. Two GUIs are available, GENESYS+TM Virtual Front Panel and GENESYS+TM Waveform Creator.
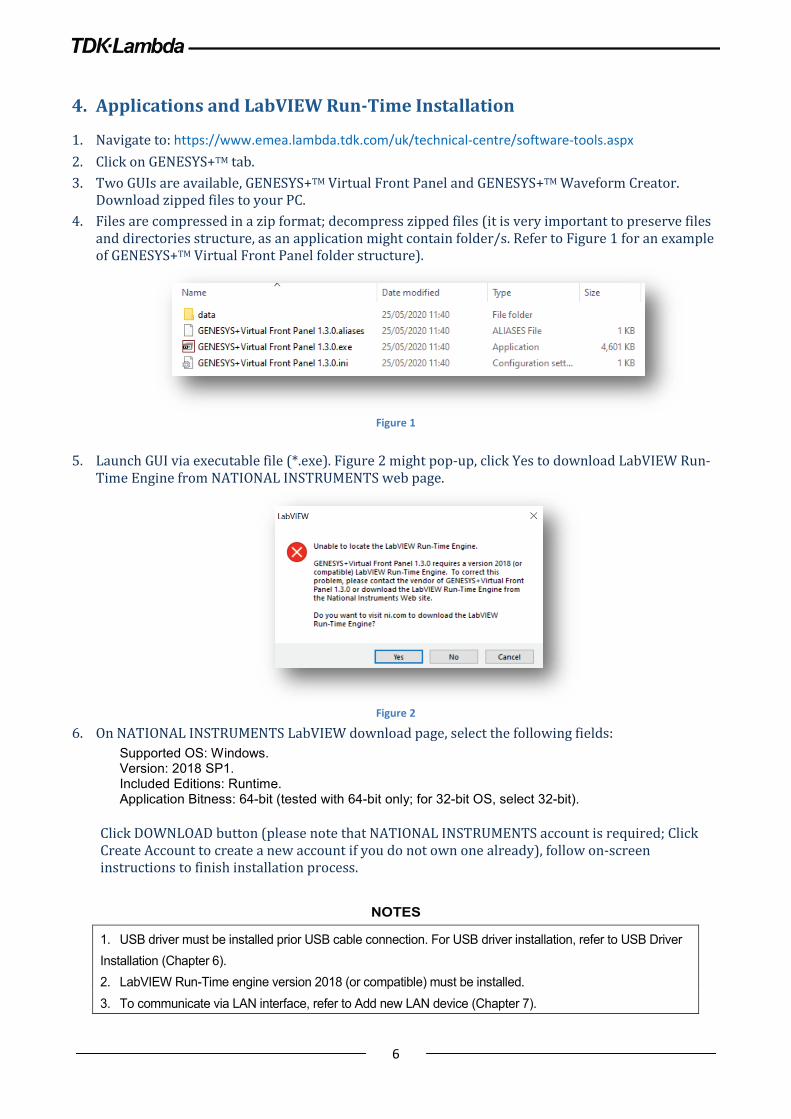
Download zipped files to your PC. 4. Files are compressed in a zip format; decompress zipped files (it is very important to preserve files
and directories structure, as an application might contain folder/s. Refer to Figure 1 for an example of GENESYS+TM Virtual Front Panel folder structure).
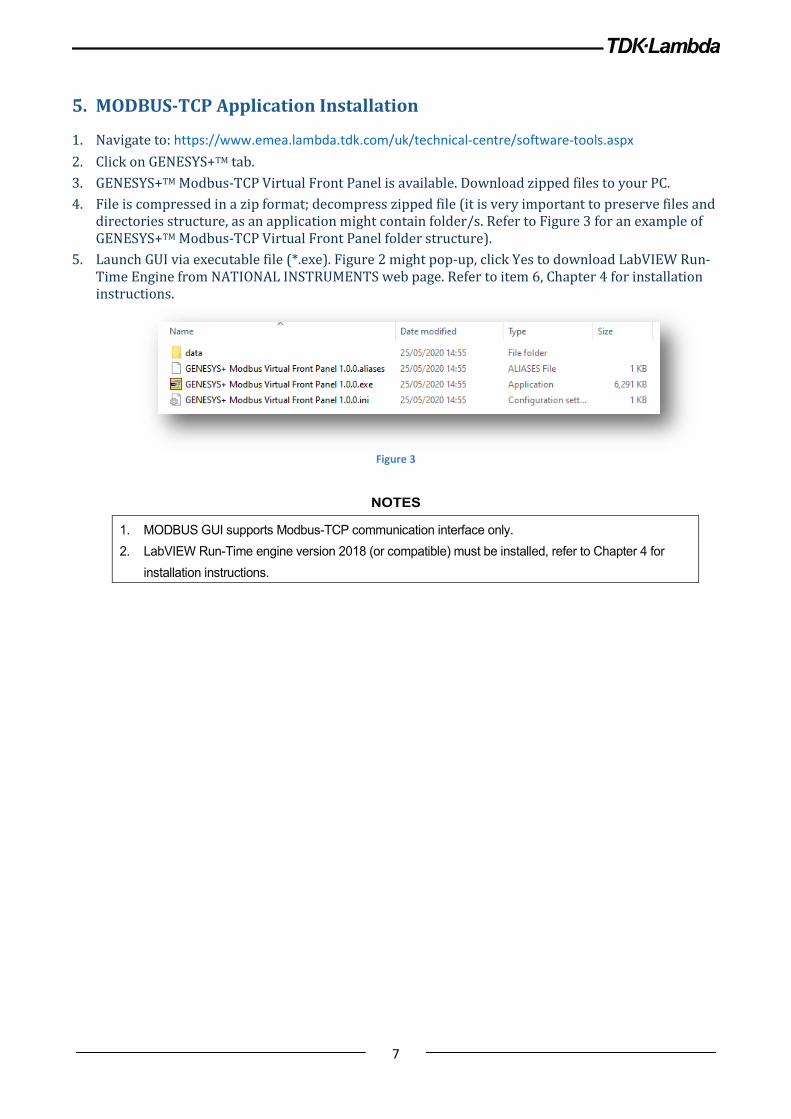
Figure 1 5. Launch GUI via executable file (*.exe). Figure 2 might pop-up, click Yes to download LabVIEW Run-
Time Engine from NATIONAL INSTRUMENTS web page.
Figure 2
6. On NATIONAL INSTRUMENTS LabVIEW download page, select the following fields: Supported OS: Windows. Version: 2018 SP1. Included Editions: Runtime. Application Bitness: 64-bit (tested with 64-bit only; for 32-bit OS, select 32-bit).
Click DOWNLOAD button (please note that NATIONAL INSTRUMENTS account is required; Click Create Account to create a new account if you do not own one already), follow on-screen instructions to finish installation process.
NOTES
1. USB driver must be installed prior USB cable connection. For USB driver installation, refer to USB Driver Installation (Chapter 6). 2. LabVIEW Run-Time engine version 2018 (or compatible) must be installed. 3. To communicate via LAN interface, refer to Add new LAN device (Chapter 7).
7
5. MODBUS-TCP Application Installation
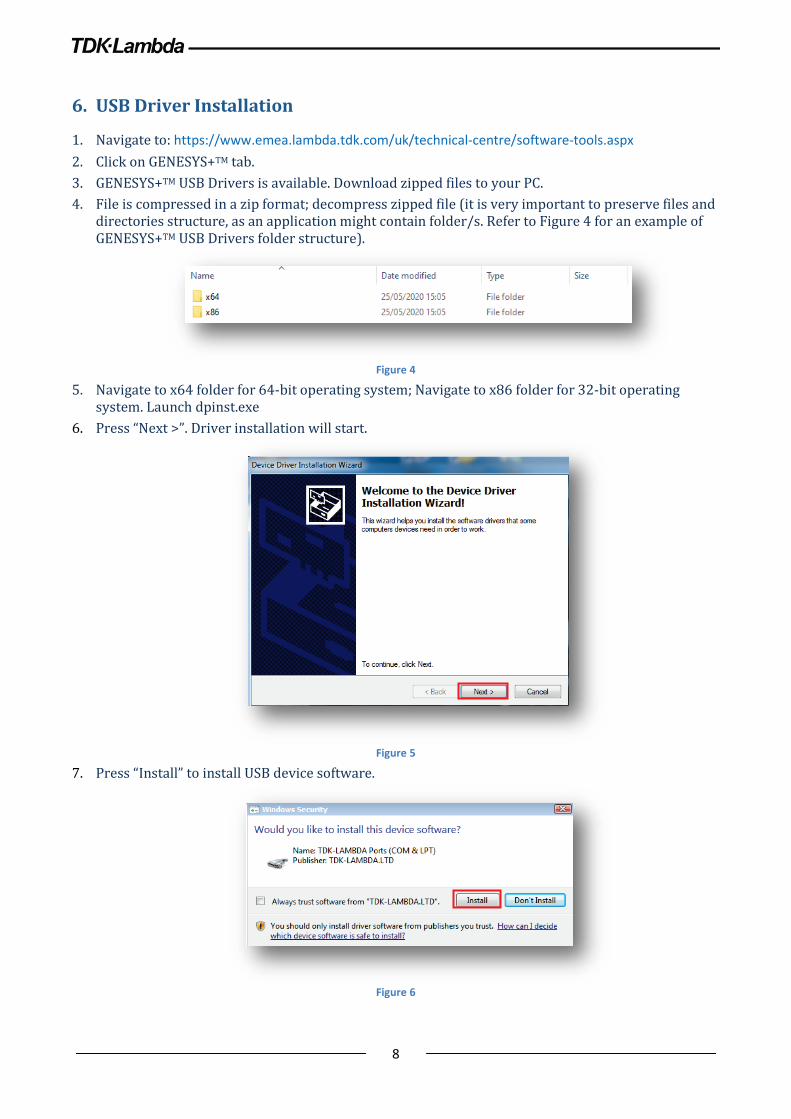
1. Navigate to: https://www.emea.lambda.tdk.com/uk/technical-centre/software-tools.aspx 2. Click on GENESYS+TM tab. 3. GENESYS+TM Modbus-TCP Virtual Front Panel is available. Download zipped files to your PC. 4. File is compressed in a zip format; decompress zipped file (it is very important to preserve files and
directories structure, as an application might contain folder/s. Refer to Figure 3 for an example of GENESYS+TM Modbus-TCP Virtual Front Panel folder structure).
5. Launch GUI via executable file (*.exe). Figure 2 might pop-up, click Yes to download LabVIEW Run-Time Engine from NATIONAL INSTRUMENTS web page. Refer to item 6, Chapter 4 for installation instructions.
Figure 3
NOTES
1. MODBUS GUI supports Modbus-TCP communication interface only. 2. LabVIEW Run-Time engine version 2018 (or compatible) must be installed, refer to Chapter 4 for
installation instructions.
8
6. USB Driver Installation
1. Navigate to: https://www.emea.lambda.tdk.com/uk/technical-centre/software-tools.aspx 2. Click on GENESYS+TM tab. 3. GENESYS+TM USB Drivers is available. Download zipped files to your PC. 4. File is compressed in a zip format; decompress zipped file (it is very important to preserve files and
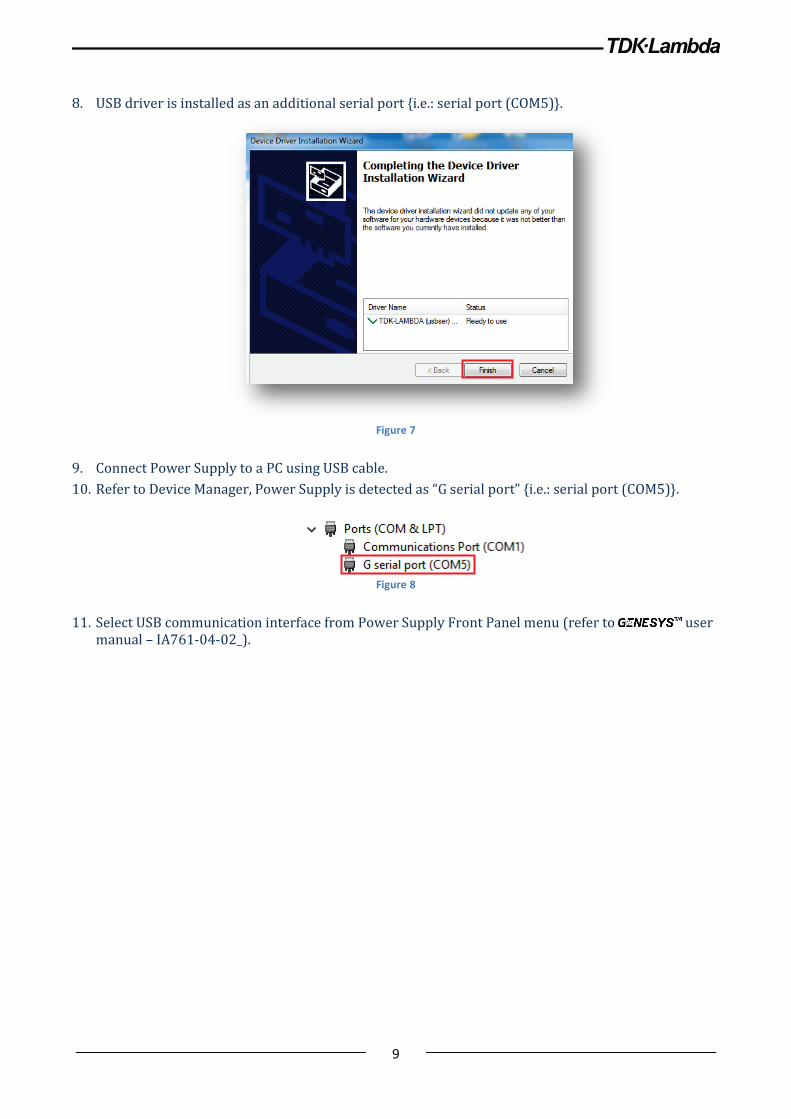
directories structure, as an application might contain folder/s. Refer to Figure 4 for an example of GENESYS+TM USB Drivers folder structure).
Figure 4
5. Navigate to x64 folder for 64-bit operating system; Navigate to x86 folder for 32-bit operating system. Launch dpinst.exe
6. Press “Next >”. Driver installation will start.
Figure 5
7. Press “Install” to install USB device software.
Figure 6
9
8. USB driver is installed as an additional serial port {i.e.: serial port (COM5)}.
Figure 7
9. Connect Power Supply to a PC using USB cable. 10. Refer to Device Manager, Power Supply is detected as “G serial port” {i.e.: serial port (COM5)}.
Figure 8
11. Select USB communication interface from Power Supply Front Panel menu (refer to user
manual – IA761-04-02_).
10
7. Add new LAN device
1. NI-VISA is required to communicate via LAN interface. Download NI-VISA from the following link: https://www.ni.com/en-il/support/downloads/drivers/download.ni-visa.html#306043
2. On NATIONAL INSTRUMENTS NI-VISA download page, select the following fields: Supported OS: Windows. Version: 18.5. Included Editions: Full.
3. Click DOWNLOAD button (please note that NATIONAL INSTRUMENTS account is required; Click Create Account to create a new account if you do not own one already), follow on-screen instructions to finish installation process.
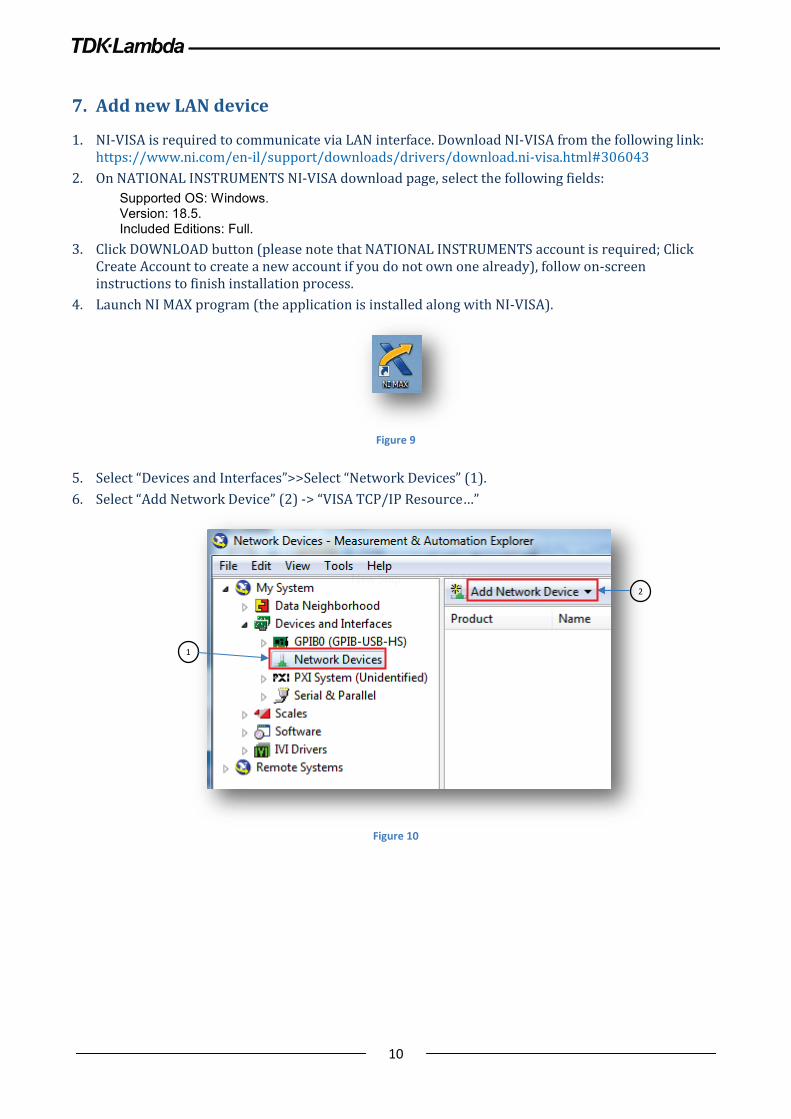
4. Launch NI MAX program (the application is installed along with NI-VISA).
Figure 9
5. Select “Devices and Interfaces”>>Select “Network Devices” (1). 6. Select “Add Network Device” (2) -> “VISA TCP/IP Resource…”
Figure 10
1
2
11
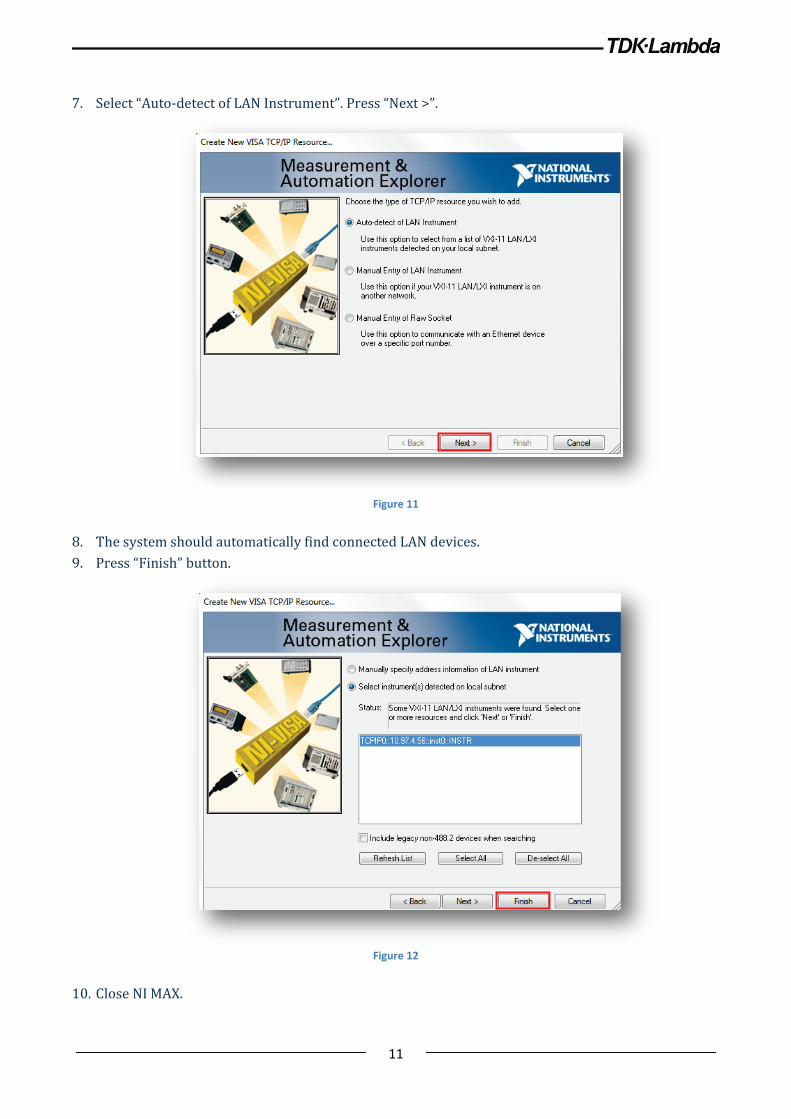
7. Select “Auto-detect of LAN Instrument”. Press “Next >”.
Figure 11
8. The system should automatically find connected LAN devices. 9. Press “Finish” button.
Figure 12
10. Close NI MAX.
12
8. GENESYS+ Waveform Creator
Introduction The application is provided to help the user to create and trigger different sequencing profiles. The sequences include voltage or current settings in LIST or WAVE modes.
• LIST Mode – Set voltage or current level and dwell time (length of each step). • WAVE Mode – Set voltage or current level and time (slope of each step).
In addition, the application stores/loads created sequences into/from Power Supply EEPROM. The user has the option to load a sequence from a file stored in a PC, or store a sequence from the Power Supply to a file.
NOTE GENESYS+ Waveform Creator does not support MODBUS-TCP communication interface.
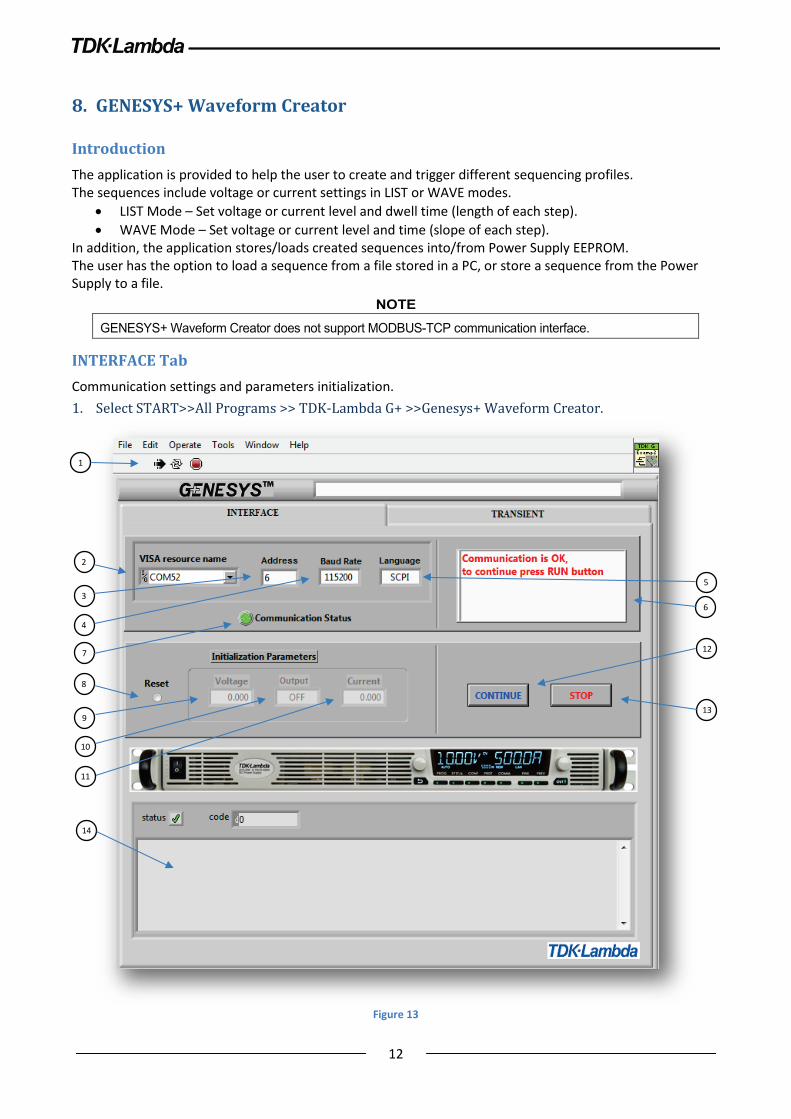
INTERFACE Tab Communication settings and parameters initialization. 1. Select START>>All Programs >> TDK-Lambda G+ >>Genesys+ Waveform Creator.
Figure 13
1
2
3
4
5
6
7
8
9
14
12
13
10
11
13
2. Press button (1) to run the application (when launched, automatically set to run mode).
2.1. Visa resource name, select COM port for RS232/485 and USB, GPIB::x::INSTR for GPIB or TCPIP::x::INSTR for LAN (Refer to chapter 7). Select “Refresh” to update connection (2).
2.2. Address, select Power Supply address (3).
2.3. Baud Rate, select Baud Rate for RS232/485 and USB mode only (4).
2.4. Language, for information only. Application supports SCPI language (5).
2.5. Communication status log (6) and LED indicator (7). When communication is OK, LED illuminates solid Green color. If Communication LED stays RED, communication has not been established. Confirm that Power Supply settings correspond to PC configuration.
2.6. Initialization Parameters (optional), it is possible to set initial Power Supply parameters. Thick “Reset” (8), enter initial Voltage (9), output state (10) and Current (11).
3. Green Color LED indicator (7) activate, press “CONTINUE” (12) button. The INTERFACE tab
immediately switches to the TRANSIENT tab. 4. To stop the application, press “STOP” button (13). 5. In case of an error or VISA failure, an error is displayed (14).
NOTES
1. Application supports SCPI communication language only. Remember to set Power Supply to SCPI language (5). 2. Baud Rate selection is available in RS232/485 and USB communication interfaces. 3. Baud Rate is fixed to 115200bps for LAN and Optional (i.e. IEEE) communication interfaces. 4. Setting Baud Rate in USB communication interface affects only RS485 retransmit speed.
14
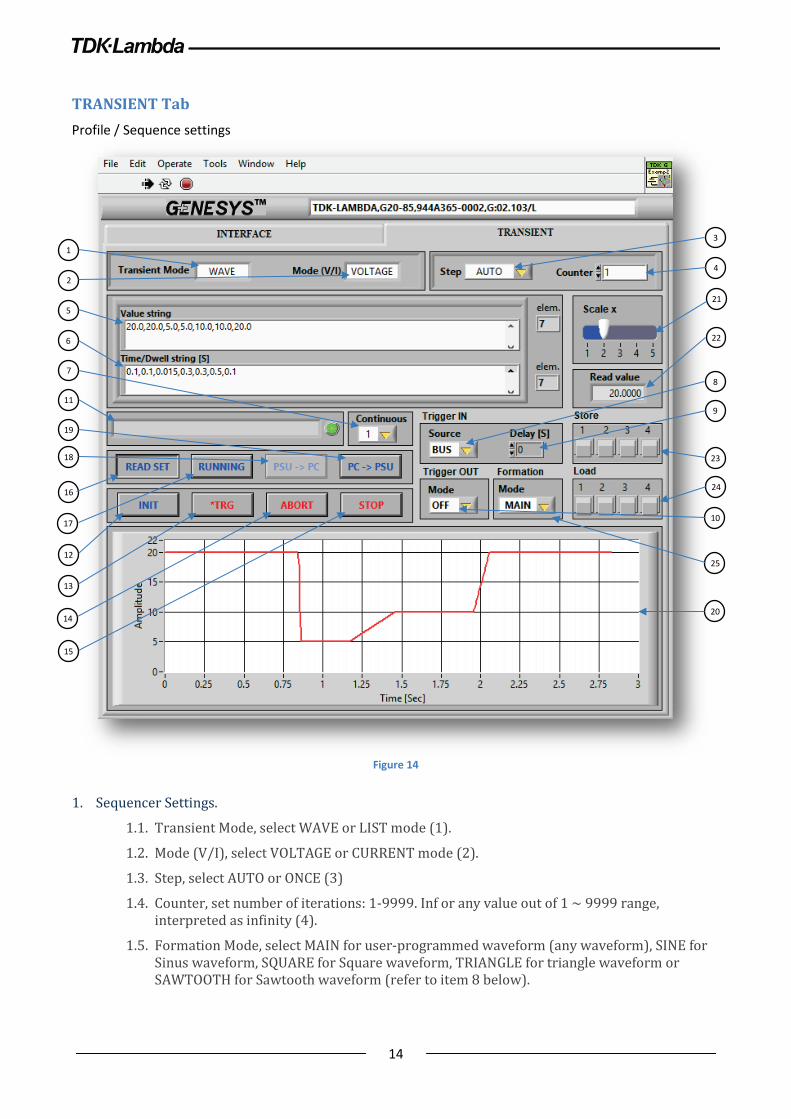
TRANSIENT Tab Profile / Sequence settings
Figure 14
1. Sequencer Settings.
1.1. Transient Mode, select WAVE or LIST mode (1).
1.2. Mode (V/I), select VOLTAGE or CURRENT mode (2).
1.3. Step, select AUTO or ONCE (3)
1.4. Counter, set number of iterations: 1-9999. Inf or any value out of 1 ~ 9999 range, interpreted as infinity (4).
1.5. Formation Mode, select MAIN for user-programmed waveform (any waveform), SINE for Sinus waveform, SQUARE for Square waveform, TRIANGLE for triangle waveform or SAWTOOTH for Sawtooth waveform (refer to item 8 below).
1
2
3
4
5
6
7 8
9
23
24
21
22
11
19
18
16
17
12
13
14
15
10
25
20
15
1.6. Value String, enter up to 100 Voltage or Current values (according to Mode (V/I selection (2)) (5). Elements counter is located to the right of the row.
1.7. Time/Dwell String [S], enter up to 100 Time (in Wave mode) or Dwell (in List mode) values (6). Elements counter is located to the right of the row.
NOTES
1. The number of elements in Value string (5) must be equal to the number of elements in Time/Dwell string [S] (6). 2. “.” (dot) - Used for decimal numbers. 3. “,” (comma) – Used for values separation.
1.8. Continuous, defines if trigger state is automatically re-initialized (Continuous = 1) or idle (Continuous = 0) after finishing a sequence (7).
1.9. Trigger IN Source, defines input trigger source. BUS (Communication command or Front Panel), EXT (external pulse) (8).
1.10. Trigger IN Delay [S], set a time delay between a trigger event to the start of any corresponding trigger action (9).
1.11. Trigger OUT Mode, select output trigger pulse mode: OFF, TRIG or FSTR (10).
NOTE
Refer to Power Supply user manual for further explanation regarding FSTR Trigger OUT Mode.
1.12. Refer to error message during insertion or selection of parameters (11).
2. Execution Controls
2.1. INIT button, initialize sequencer and trigger system (12).
2.2. *TRG button, generate trigger for BUS (8) mode (13).
2.3. ABORT button, abort sequence execution (14).
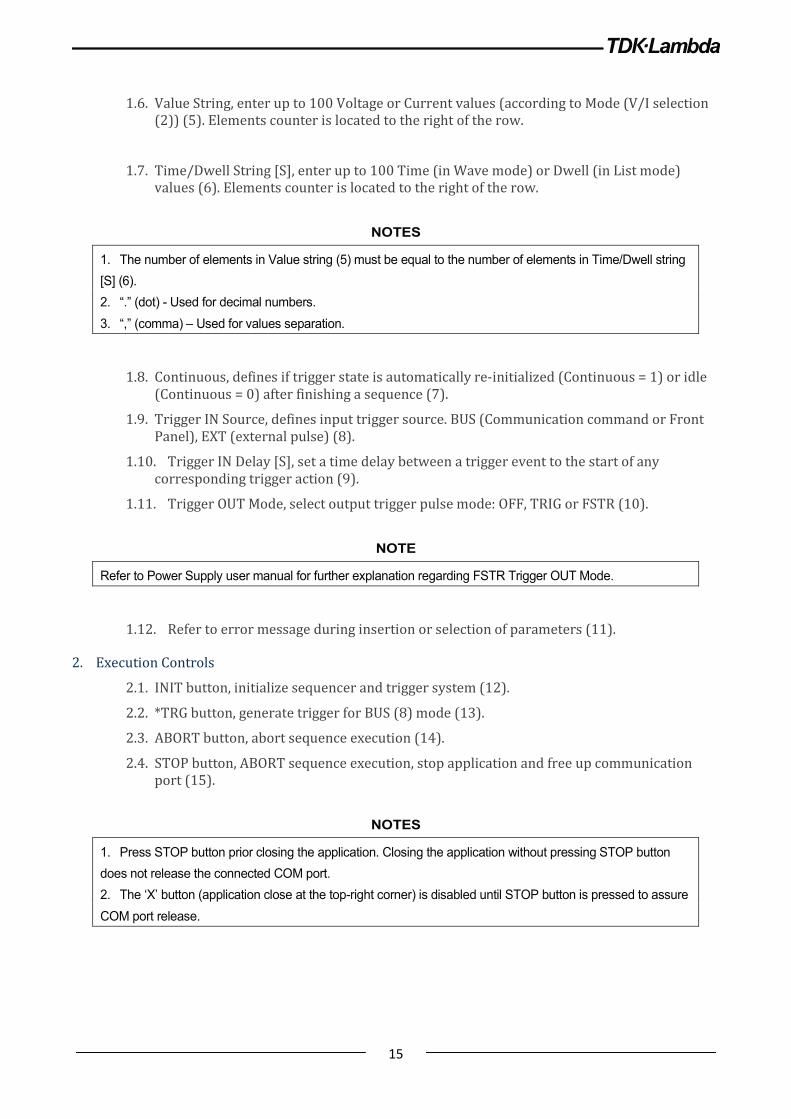
2.4. STOP button, ABORT sequence execution, stop application and free up communication port (15).
NOTES
1. Press STOP button prior closing the application. Closing the application without pressing STOP button does not release the connected COM port. 2. The ‘X’ button (application close at the top-right corner) is disabled until STOP button is pressed to assure COM port release.

16
3. Auxiliary Controls
3.1. READ MEAS/READ SET button, select measurement values graph view or setting values graph view (16).
3.2. RUNNING/FREEZE button, select to update (running) graph or freeze graph (17).
3.3. PSU -> PC button, upload a sequence from a Power Supply to a PC (18). Refer to chapter 6 (PSU - > PC Upload).
3.4. PC->PSU button, download a sequence from a PC to a Power Supply (19). Refer to chapter 7 (PC -> PSU Download).
4. Graph & Auxiliary Graph Control
4.1. Graph view, displays measured values or setting values (20), selected by (16)
4.2. Scale x, select Graph (20) time scale (21).
4.3. Read value, view preset read-back value (22). 5. Store / Load
5.1. Store a sequence into Power supply memory cell (23), select cells 1 ~ 4.
5.2. Load previously stored sequence from Power Supply memory (24), select cells 1 ~ 4.
NOTE
Continuous setting (7), Trigger IN Source, Trigger IN Delay and Trigger OUT Mode parameters are not stored/loaded into/from Power Supply memory.
6. PSU - > PC Upload The function uploads data from Power Supply memory cell (18). Step setting, Counter setting, Continuous state setting, Trigger IN Source, Trigger IN delay, Trigger OUT Mode and stored cell number are saved as a script, *.txt file.
6.1. Create a sequence using controls (1) ~ (10), store data by Store function (23) in any memory cell 1~ 4, or load data by Load function (24) from any memory cell 1 ~ 4.
6.2. Press PSU -> PC button (18) to open file dialog.
6.3. Enter File Name, press OK.
7. PC -> PSU Download The function downloads a script data *.txt file into Power Supply memory.
7.1. Press PC -> PSU button (19).
7.2. Choose a script file, press OK.
7.3. Press INIT button (12), press *TRG button (13) or provide an external trigger, according to Trigger IN Source (8) setting.
17
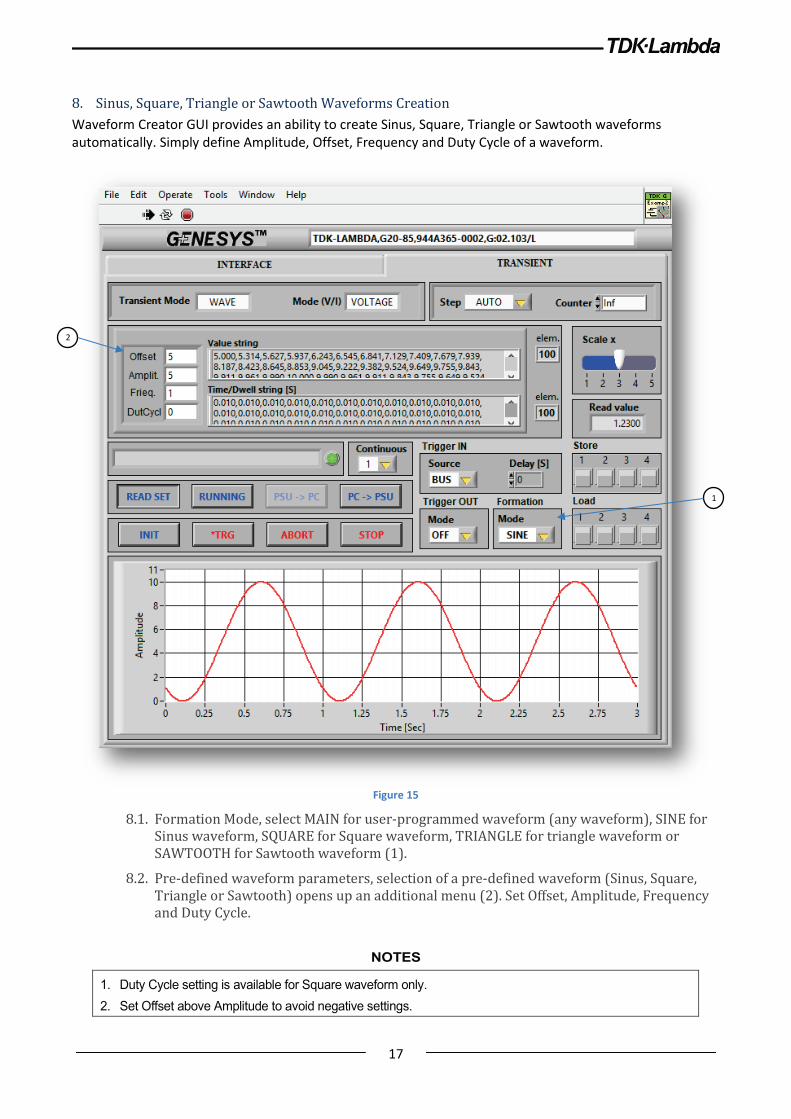
8. Sinus, Square, Triangle or Sawtooth Waveforms Creation Waveform Creator GUI provides an ability to create Sinus, Square, Triangle or Sawtooth waveforms automatically. Simply define Amplitude, Offset, Frequency and Duty Cycle of a waveform.
Figure 15
8.1. Formation Mode, select MAIN for user-programmed waveform (any waveform), SINE for Sinus waveform, SQUARE for Square waveform, TRIANGLE for triangle waveform or SAWTOOTH for Sawtooth waveform (1).
8.2. Pre-defined waveform parameters, selection of a pre-defined waveform (Sinus, Square, Triangle or Sawtooth) opens up an additional menu (2). Set Offset, Amplitude, Frequency and Duty Cycle.
NOTES
1. Duty Cycle setting is available for Square waveform only. 2. Set Offset above Amplitude to avoid negative settings.
2
1

18
9. GENESYS+ Virtual Front Panel
Figure 16
Figure 17
NOTE GENESYS+ Virtual front Panel does not support MODBUS-TCP communication interface. For GENESYS+ MODBUS-TCP Virtual Front Panel, refer to section 10.
19
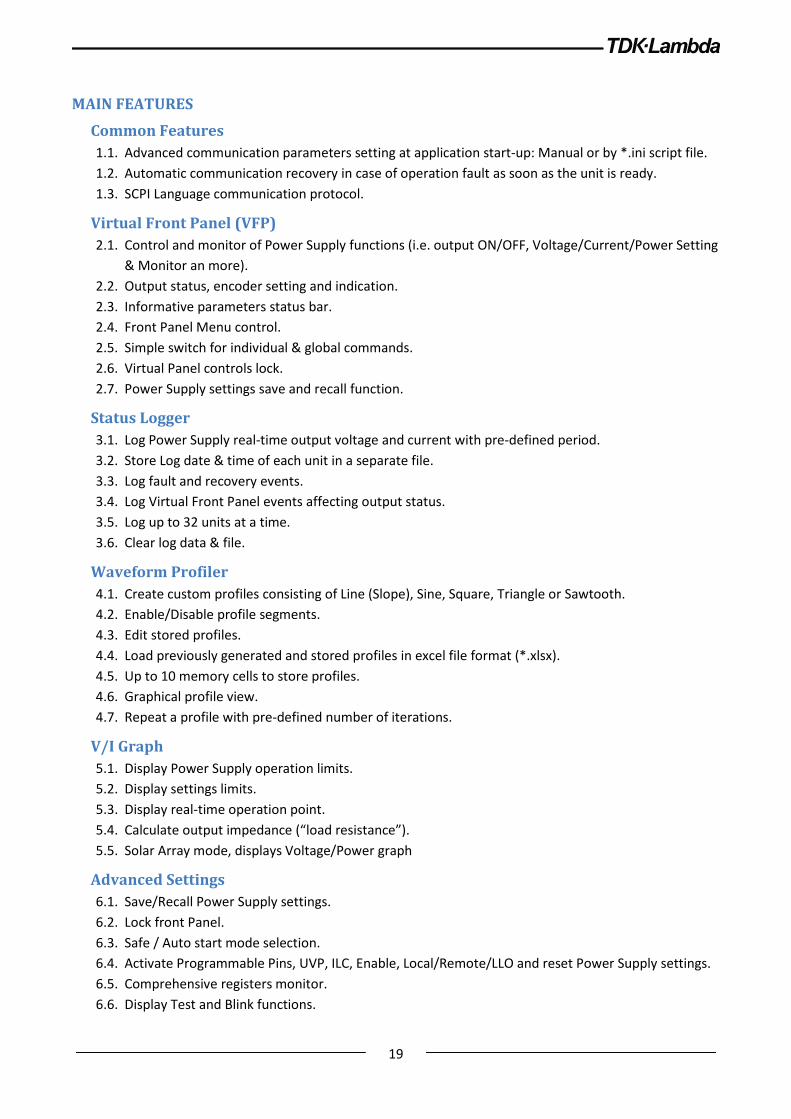
MAIN FEATURES
Common Features 1.1. Advanced communication parameters setting at application start-up: Manual or by *.ini script file. 1.2. Automatic communication recovery in case of operation fault as soon as the unit is ready. 1.3. SCPI Language communication protocol.
Virtual Front Panel (VFP) 2.1. Control and monitor of Power Supply functions (i.e. output ON/OFF, Voltage/Current/Power Setting
& Monitor an more). 2.2. Output status, encoder setting and indication. 2.3. Informative parameters status bar. 2.4. Front Panel Menu control. 2.5. Simple switch for individual & global commands. 2.6. Virtual Panel controls lock. 2.7. Power Supply settings save and recall function.
Status Logger 3.1. Log Power Supply real-time output voltage and current with pre-defined period. 3.2. Store Log date & time of each unit in a separate file. 3.3. Log fault and recovery events. 3.4. Log Virtual Front Panel events affecting output status. 3.5. Log up to 32 units at a time. 3.6. Clear log data & file.
Waveform Profiler 4.1. Create custom profiles consisting of Line (Slope), Sine, Square, Triangle or Sawtooth. 4.2. Enable/Disable profile segments. 4.3. Edit stored profiles. 4.4. Load previously generated and stored profiles in excel file format (*.xlsx). 4.5. Up to 10 memory cells to store profiles. 4.6. Graphical profile view. 4.7. Repeat a profile with pre-defined number of iterations.
V/I Graph 5.1. Display Power Supply operation limits. 5.2. Display settings limits. 5.3. Display real-time operation point. 5.4. Calculate output impedance (“load resistance”). 5.5. Solar Array mode, displays Voltage/Power graph
Advanced Settings 6.1. Save/Recall Power Supply settings. 6.2. Lock front Panel. 6.3. Safe / Auto start mode selection. 6.4. Activate Programmable Pins, UVP, ILC, Enable, Local/Remote/LLO and reset Power Supply settings. 6.5. Comprehensive registers monitor. 6.6. Display Test and Blink functions.
20
NOTE Maximum available time per single sequence (single iteration) for the whole profile is 6E+5 [mSec].
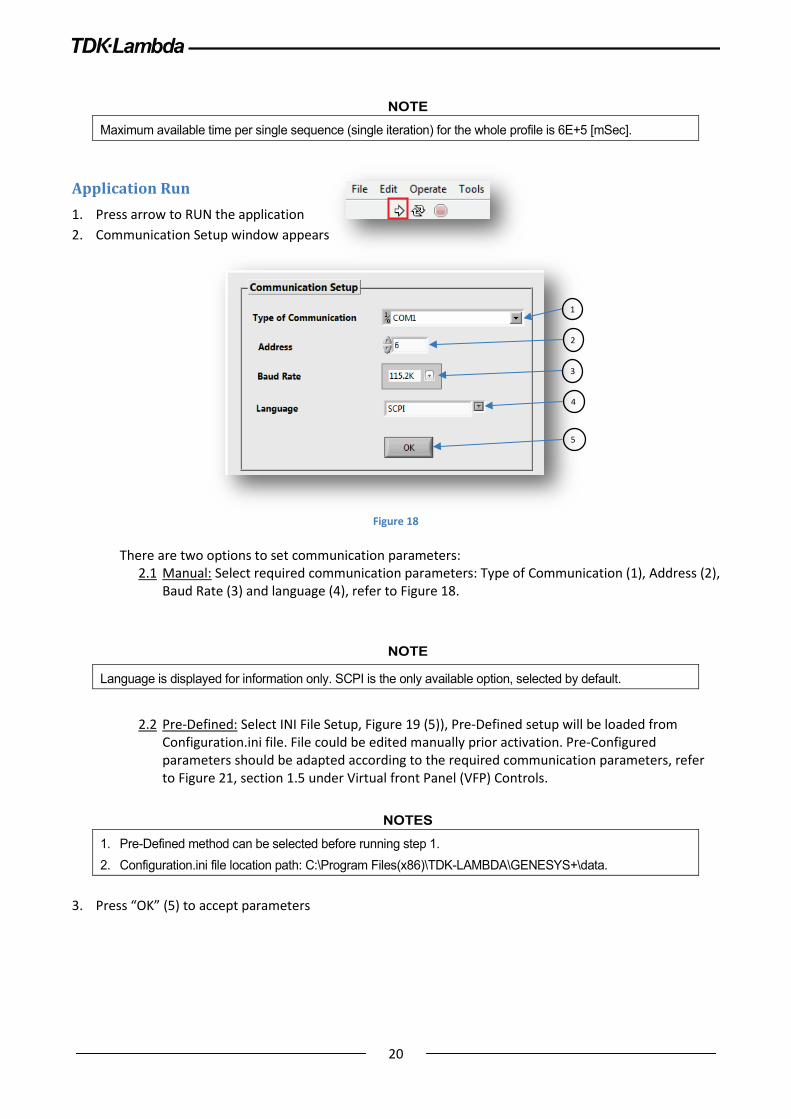
Application Run 1. Press arrow to RUN the application 2. Communication Setup window appears
Figure 18
There are two options to set communication parameters:
2.1 Manual: Select required communication parameters: Type of Communication (1), Address (2), Baud Rate (3) and language (4), refer to Figure 18.
NOTE
Language is displayed for information only. SCPI is the only available option, selected by default.
2.2 Pre-Defined: Select INI File Setup, Figure 19 (5)), Pre-Defined setup will be loaded from
Configuration.ini file. File could be edited manually prior activation. Pre-Configured parameters should be adapted according to the required communication parameters, refer to Figure 21, section 1.5 under Virtual front Panel (VFP) Controls.
NOTES
1. Pre-Defined method can be selected before running step 1. 2. Configuration.ini file location path: C:\Program Files(x86)\TDK-LAMBDA\GENESYS+\data.
3. Press “OK” (5) to accept parameters
2
3
1
4
5
21
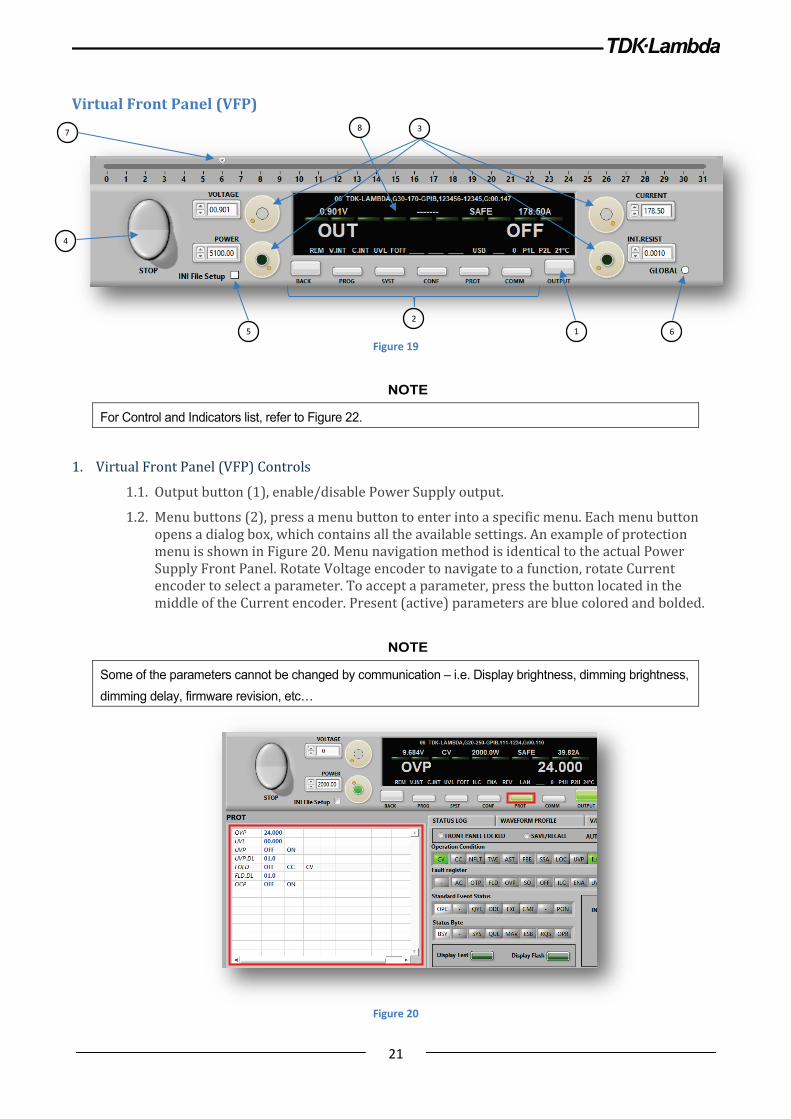
Virtual Front Panel (VFP)
Figure 19
NOTE
For Control and Indicators list, refer to Figure 22.
1. Virtual Front Panel (VFP) Controls
1.1. Output button (1), enable/disable Power Supply output.
1.2. Menu buttons (2), press a menu button to enter into a specific menu. Each menu button opens a dialog box, which contains all the available settings. An example of protection menu is shown in Figure 20. Menu navigation method is identical to the actual Power Supply Front Panel. Rotate Voltage encoder to navigate to a function, rotate Current encoder to select a parameter. To accept a parameter, press the button located in the middle of the Current encoder. Present (active) parameters are blue colored and bolded.
NOTE
Some of the parameters cannot be changed by communication – i.e. Display brightness, dimming brightness, dimming delay, firmware revision, etc…
Figure 20
7
4
1 2
3 8
5 6
22
1.3. Setting Encoders (3), there are four independent encoders to control Voltage, Current, Power, Internal Resistance and navigate the interactive menu. Close to each encoder, there is a field to enter values directly, or increase/decrease a value using up/down arrows.
1.4. Stop button (4), stop application and communication with the Power Supply.
NOTE
Always use the Stop button prior closing the application. Stop button releases the communication (COM) port to allow other applications to communicate with the Power Supply. To close the application, first press Stop button.
1.5. INI File Setup (5), select the function to run a script pre-configuring application parameters. Running Configuration.ini file skips communications’ setting procedure. Refer to Figure 21 for a script example.
Figure 21
1.6. GLOBAL (6), select the function to set Voltage, Current, Output ON/OFF, Reset, Save and Recall commands to global.
1.7. Address Bar (7), select Power Supply address to control and monitor.
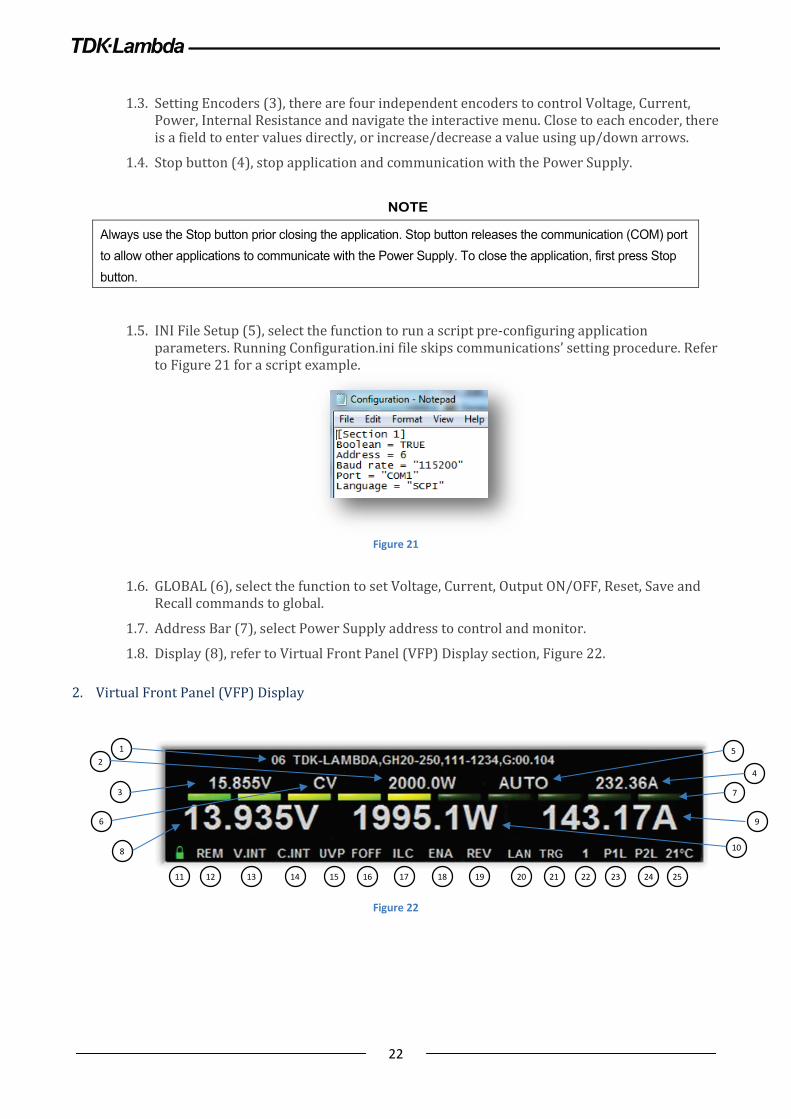
1.8. Display (8), refer to Virtual Front Panel (VFP) Display section, Figure 22. 2. Virtual Front Panel (VFP) Display
Figure 22
1 2
3
5
4
7
6
8
9
10
11 12 13 14 15 16 17 18 19 20 21 22 23 24 25

23
2.1. Power Supply unique address, model, serial number, main firmware revision (1).
2.2. Power limit setting (2) appears only if Constant Power limit mode is enabled.
2.3. Voltage (3) and Current (4) settings.
2.4. Power Supply start mode (5) setting.
2.5. Operation mode indicator (6), Constant Voltage (CV), Constant Current (CC), Constant Power Limit (CP).
2.6. Power bar (7), indicating (in a graphical view) real-time power load.
2.7. Real-time Voltage (8), Current (9) and Power (10) monitor.
2.8. Real-time Status Bar, (11 ~ 25): - LFP (11) – Locked Front Panel, appears if Power Supply Front Panel control is locked. The
symbol blinks if Power Supply Front Panel is unlocked, but VFP (Virtual Front Panel) control is locked.
- LOC/REM/LLO (12) – Power Supply control mode: LOC (Local) control through the front panel is enabled. REM (Remote) control by communication, Front Panel is locked. LLO (Local Lock Out) control by communication, Front Panel locked, unlock by communication or AC recycle.
- V.INT/V.VOL/V.RES (13) – Voltage control source by digital source (Front Panel or communication), external voltage source or external resistance.
- C.INT/C.VOL/C.RES (14) – Current control source by digital source (Front Panel or communication), external voltage source or external resistance.
- UVL/UVP (15) – Under voltage mode, under voltage limit or protection - FOFF/FCV/FCC (16) – Foldback mode selection, OFF, Constant Voltage Mode or Constant
Current Mode. - ILC (17) – Interlock function ON. If Interlock function is disabled, ILC indicator disappears. - ENA (18) – Enable function ON. If Enable function is disabled, ENA indicator disappears. - NORM/REV (19) – Enable function polarity, indicator appears if Enable function is ON. - RS/USB/LAN/OPT (20) – Communication interface. - TRG (21) – If Power Supply is ready to receive trigger input, TRG indicator appears. - “_”, 1 ~ 4 (22) – Active Memory cell. “_” appears if currently loaded sequence is different
from any stored memory cell. 1 ~ 4 appears if a sequence is loaded from an internal power Supply memory cell. Blinking symbol indicates sequence is currently running.
- P1H, P1L (23) - Programmable pin 1 state. - P2H, P2L (24) - Programmable pins 2 state. - 21°C (25) - Ambient temperature measurement (21 degrees is an example).
NOTE
Application automatically updates the following parameters: Set Voltage/Current/Power, Measured Voltage/Current/Power, Status Byte, Status Register, Power Level, Programmable Pin1 state, Programmable Pin2 state, Loaded sequence (program) number, RIN (Internal Resistance) state, Locked Front Panel state, Ambient Temperature, Voltage/Current control source Mode, Interlock Enable/Disable function, Enable Enable/Disable function, Enable function polarity, Foldback Mode, Communication Local/Remote/LLO status, UVP/UVL setting, Auto/Safe start Mode, Trigger ready and running sequence (profile) state.
24
3. Virtual Front Panel (VFP) Graph
Figure 23
3.1. Real-time graphical view of Voltage or Current setting and measurement (1).
3.2. Voltage / Current selector (2), select to view Voltage or Current.
3.3. CAPTURE (3), freeze graph to capture Voltage or Current setting/measurement.
3.4. Setting/Measure (4), click to show Setting and/or Measure value/s
3.5. Scale (s) (5), scale X-axis (time) to define capture length.
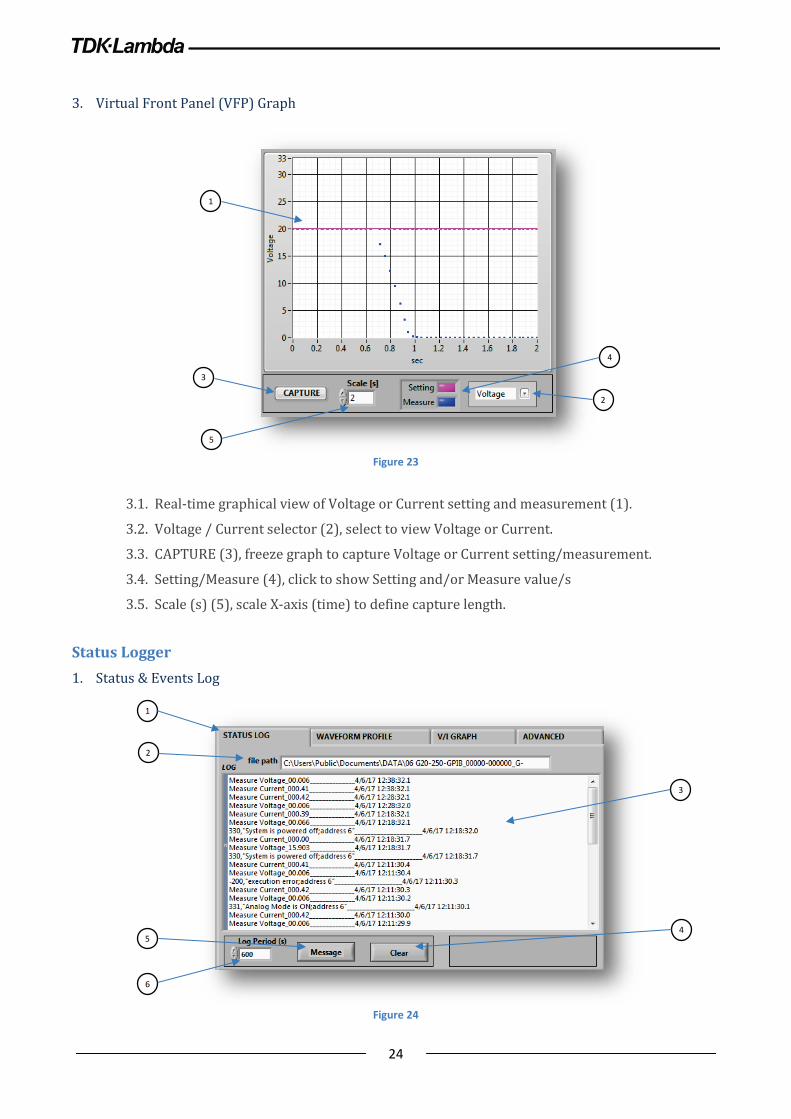
Status Logger 1. Status & Events Log
Figure 24
1
3
5
4
1
2
3
4 5
6
2
25
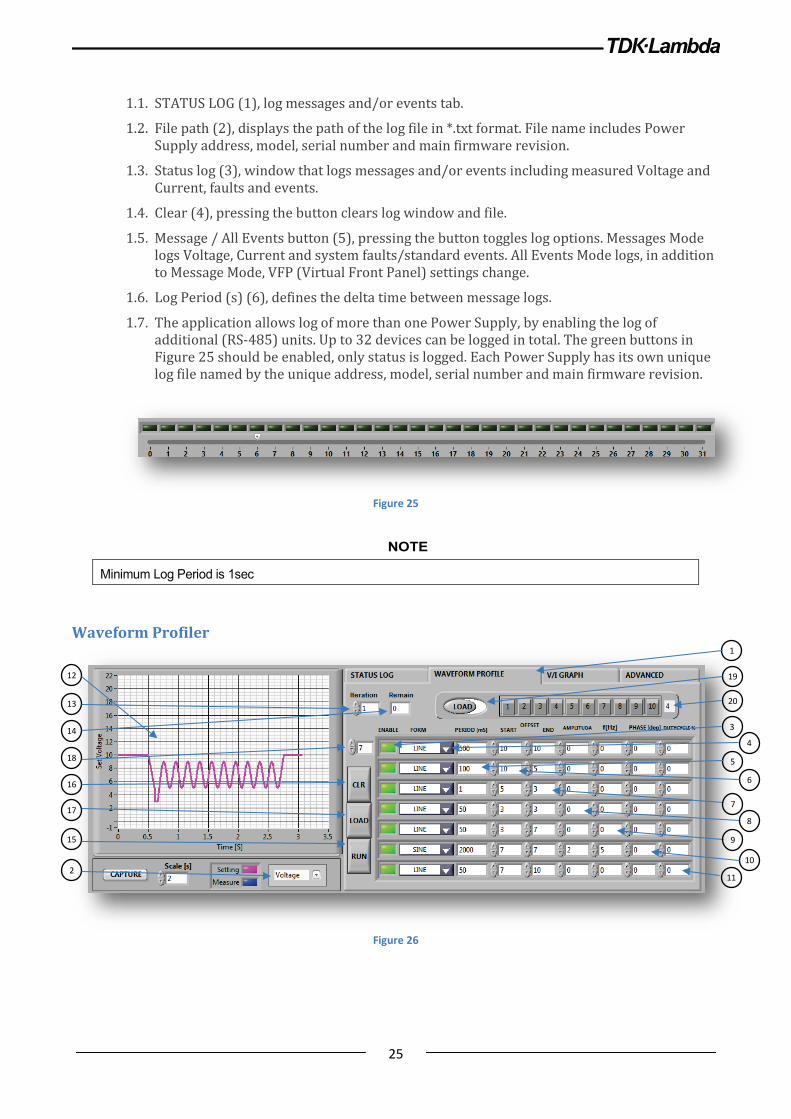
1.1. STATUS LOG (1), log messages and/or events tab.
1.2. File path (2), displays the path of the log file in *.txt format. File name includes Power Supply address, model, serial number and main firmware revision.
1.3. Status log (3), window that logs messages and/or events including measured Voltage and Current, faults and events.
1.4. Clear (4), pressing the button clears log window and file.
1.5. Message / All Events button (5), pressing the button toggles log options. Messages Mode logs Voltage, Current and system faults/standard events. All Events Mode logs, in addition to Message Mode, VFP (Virtual Front Panel) settings change.
1.6. Log Period (s) (6), defines the delta time between message logs.
1.7. The application allows log of more than one Power Supply, by enabling the log of additional (RS-485) units. Up to 32 devices can be logged in total. The green buttons in Figure 25 should be enabled, only status is logged. Each Power Supply has its own unique log file named by the unique address, model, serial number and main firmware revision.
Figure 25
NOTE
Minimum Log Period is 1sec
Waveform Profiler
Figure 26
12
1
19
20 13
14
18
16
17
15
2
3
4
5
6
7
8
9
10
11
26
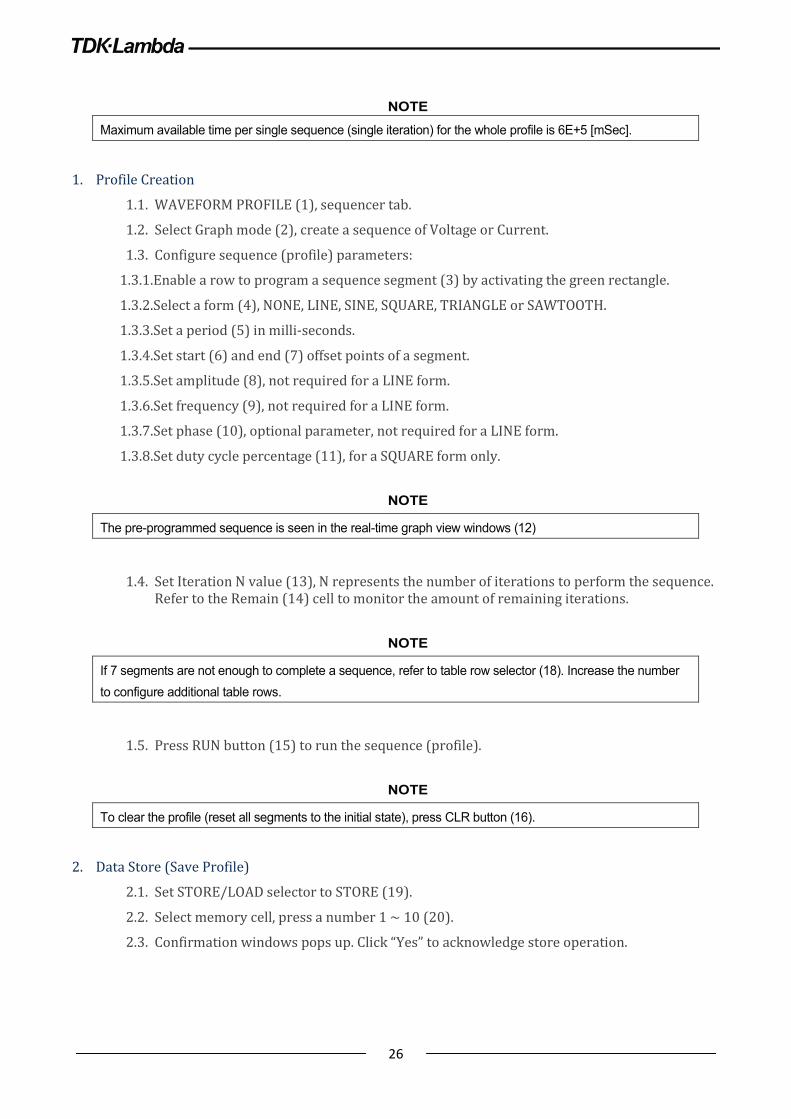
NOTE Maximum available time per single sequence (single iteration) for the whole profile is 6E+5 [mSec].
1. Profile Creation
1.1. WAVEFORM PROFILE (1), sequencer tab.
1.2. Select Graph mode (2), create a sequence of Voltage or Current.
1.3. Configure sequence (profile) parameters:
1.3.1. Enable a row to program a sequence segment (3) by activating the green rectangle.
1.3.2. Select a form (4), NONE, LINE, SINE, SQUARE, TRIANGLE or SAWTOOTH.
1.3.3. Set a period (5) in milli-seconds.
1.3.4. Set start (6) and end (7) offset points of a segment.
1.3.5. Set amplitude (8), not required for a LINE form.
1.3.6. Set frequency (9), not required for a LINE form.
1.3.7. Set phase (10), optional parameter, not required for a LINE form.
1.3.8. Set duty cycle percentage (11), for a SQUARE form only.
NOTE
The pre-programmed sequence is seen in the real-time graph view windows (12)
1.4. Set Iteration N value (13), N represents the number of iterations to perform the sequence. Refer to the Remain (14) cell to monitor the amount of remaining iterations.
NOTE
If 7 segments are not enough to complete a sequence, refer to table row selector (18). Increase the number to configure additional table rows.
1.5. Press RUN button (15) to run the sequence (profile).
NOTE
To clear the profile (reset all segments to the initial state), press CLR button (16).
2. Data Store (Save Profile)
2.1. Set STORE/LOAD selector to STORE (19).
2.2. Select memory cell, press a number 1 ~ 10 (20).
2.3. Confirmation windows pops up. Click “Yes” to acknowledge store operation.
27
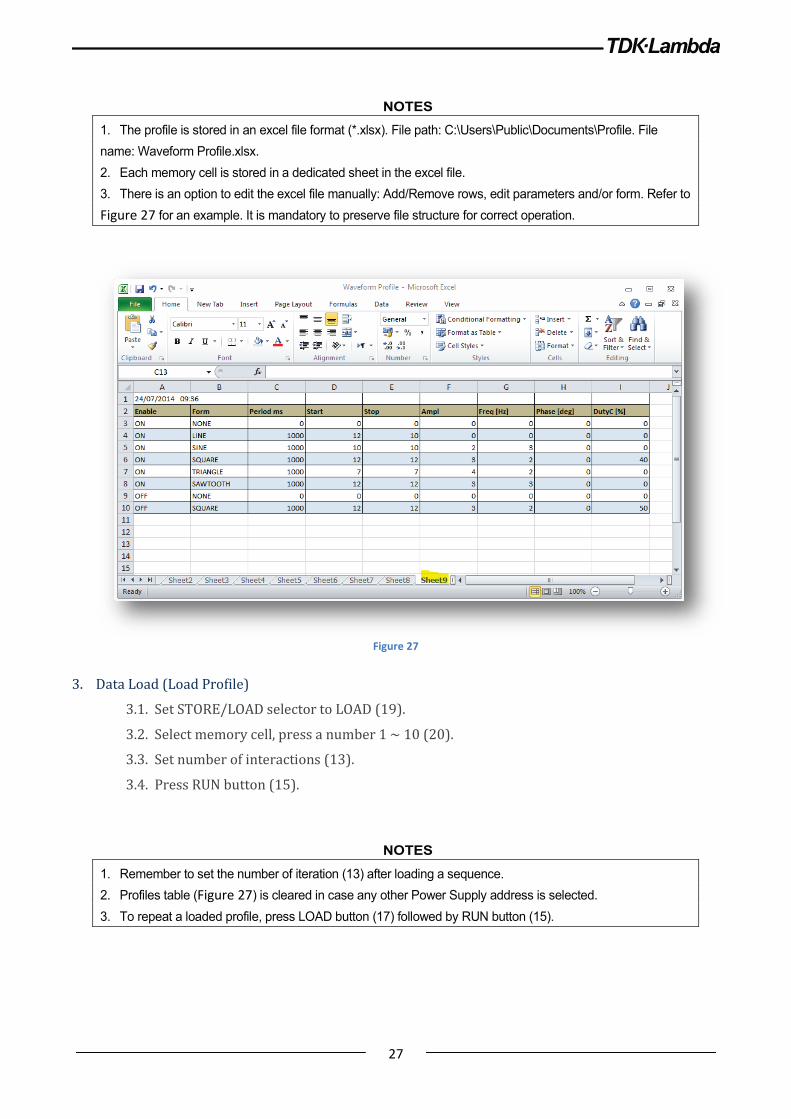
NOTES 1. The profile is stored in an excel file format (*.xlsx). File path: C:\Users\Public\Documents\Profile. File name: Waveform Profile.xlsx. 2. Each memory cell is stored in a dedicated sheet in the excel file. 3. There is an option to edit the excel file manually: Add/Remove rows, edit parameters and/or form. Refer to Figure 27 for an example. It is mandatory to preserve file structure for correct operation.
Figure 27
3. Data Load (Load Profile)
3.1. Set STORE/LOAD selector to LOAD (19).
3.2. Select memory cell, press a number 1 ~ 10 (20).
3.3. Set number of interactions (13).
3.4. Press RUN button (15).
NOTES
1. Remember to set the number of iteration (13) after loading a sequence. 2. Profiles table (Figure 27) is cleared in case any other Power Supply address is selected. 3. To repeat a loaded profile, press LOAD button (17) followed by RUN button (15).
28
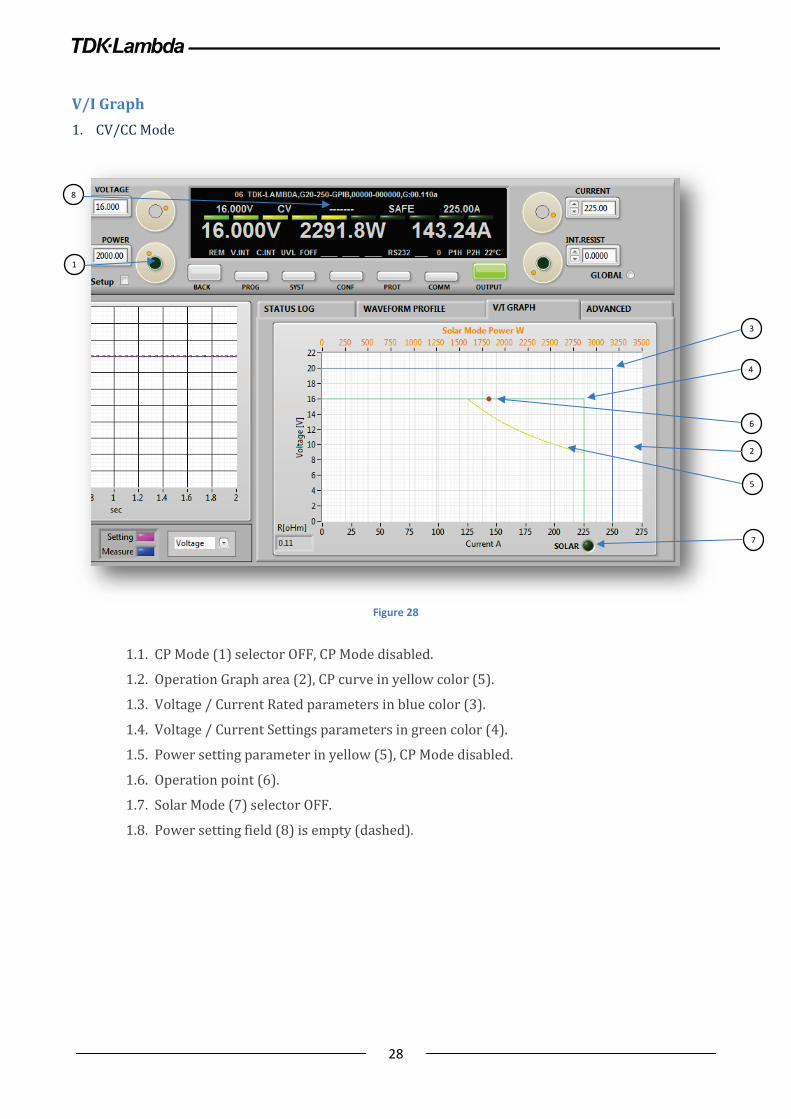
V/I Graph 1. CV/CC Mode
Figure 28
1.1. CP Mode (1) selector OFF, CP Mode disabled.
1.2. Operation Graph area (2), CP curve in yellow color (5).
1.3. Voltage / Current Rated parameters in blue color (3).
1.4. Voltage / Current Settings parameters in green color (4).
1.5. Power setting parameter in yellow (5), CP Mode disabled.
1.6. Operation point (6).
1.7. Solar Mode (7) selector OFF.
1.8. Power setting field (8) is empty (dashed).
1
2
3
5
6
8
4
7

29
2. CV/CC/CP Mode
Figure 29
2.1. CP mode (1) selector ON, CP Mode enabled.
2.2. Operation Graph area (2).
2.3. Voltage / Current Rated parameters in blue color (3).
2.4. Voltage / Current / Power Settings parameters in green color (4).
2.5. Power setting encoder (5), rotate (or enter a value) to set power.
2.6. Operation point (6).
2.7. Solar Mode (7) selector OFF.
2.8. Power setting value (8)
NOTE
CP Mode is disabled if SAS (Solar Array Simulator) Mode is enabled.
1
2
3
6
8
4
7
5
30
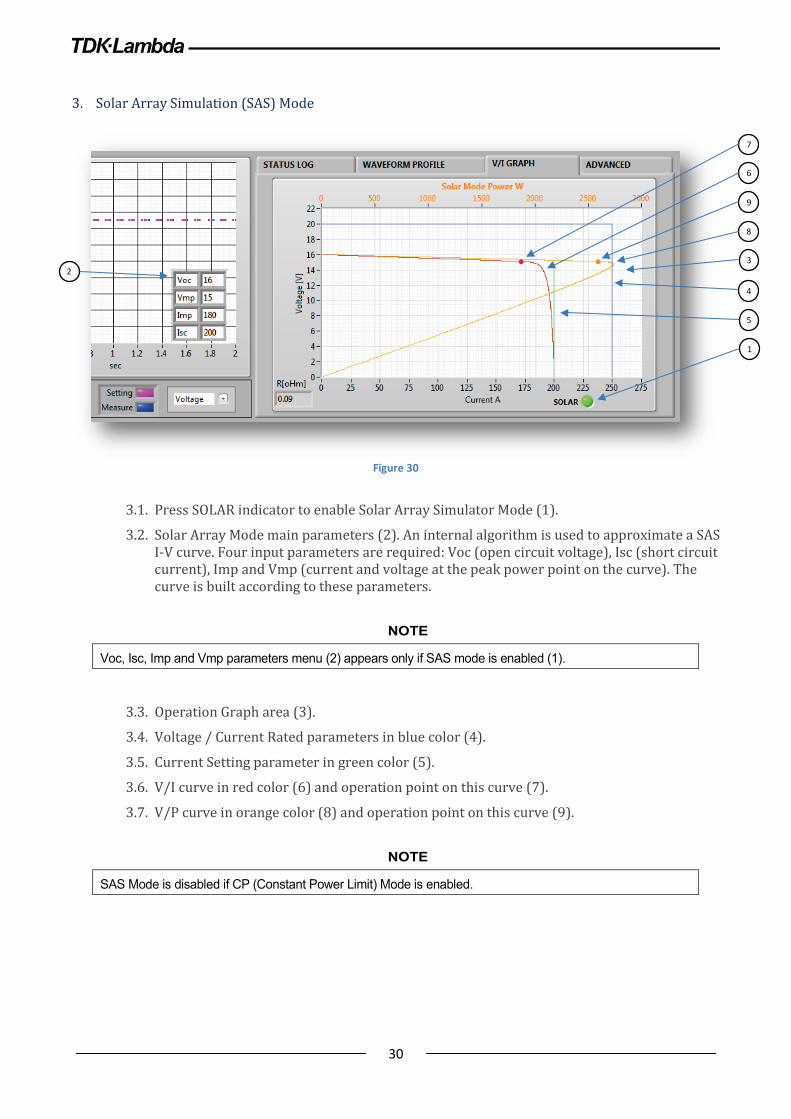
3. Solar Array Simulation (SAS) Mode
Figure 30
3.1. Press SOLAR indicator to enable Solar Array Simulator Mode (1).
3.2. Solar Array Mode main parameters (2). An internal algorithm is used to approximate a SAS I-V curve. Four input parameters are required: Voc (open circuit voltage), Isc (short circuit current), Imp and Vmp (current and voltage at the peak power point on the curve). The curve is built according to these parameters.
NOTE
Voc, Isc, Imp and Vmp parameters menu (2) appears only if SAS mode is enabled (1).
3.3. Operation Graph area (3).
3.4. Voltage / Current Rated parameters in blue color (4).
3.5. Current Setting parameter in green color (5).
3.6. V/I curve in red color (6) and operation point on this curve (7).
3.7. V/P curve in orange color (8) and operation point on this curve (9).
NOTE
SAS Mode is disabled if CP (Constant Power Limit) Mode is enabled.
2 3
4
5
7
6
8
9
1
31
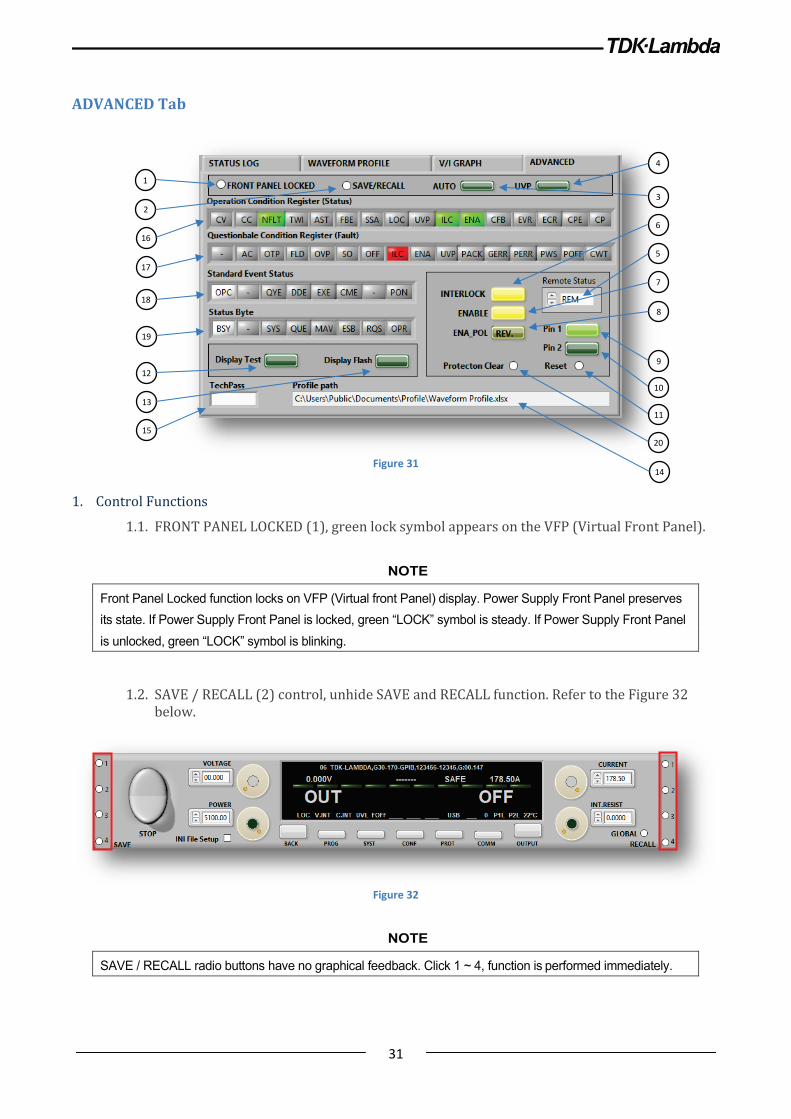
ADVANCED Tab
Figure 31
1. Control Functions
1.1. FRONT PANEL LOCKED (1), green lock symbol appears on the VFP (Virtual Front Panel).
NOTE
Front Panel Locked function locks on VFP (Virtual front Panel) display. Power Supply Front Panel preserves its state. If Power Supply Front Panel is locked, green “LOCK” symbol is steady. If Power Supply Front Panel is unlocked, green “LOCK” symbol is blinking.
1.2. SAVE / RECALL (2) control, unhide SAVE and RECALL function. Refer to the Figure 32 below.
Figure 32
NOTE
SAVE / RECALL radio buttons have no graphical feedback. Click 1 ~ 4, function is performed immediately.
1
2
16
4
3
17
18
19
12
13
15
6
5
7
8
9
10
11
14
20
32
1.3. AUTO button (3), activate Auto-Start function ON / OFF.
1.4. UVP button (4), activate UVP (Under Voltage Protection) function ON / OFF.
1.5. Remote Mode selection (5), set to Local, Remote or LLO (Local Lock Out).
1.6. ILC (INTERLOCK) function (6), set ON / OFF to enable / disable ILC function.
1.7. ENA (ENABLE) function (7), set ON / OFF to enable / disable ENA function.
1.8. ENA_POL (ENABLE POLARITY) function (8), set ON / OFF to enable / disable reverse ENA polarity.
1.9. Programmable Pin 1 function (9), set ON / OFF to toggle programmable signal 1 state.
1.10. Programmable Pin 2 function (10), set ON / OFF to toggle programmable signal 2 state.
1.11. Reset function (11), reset to default settings.
1.12. Protection Clear (20), clear faults (output protection clear command).
1.13. Display Test (12), set to turn ON all display segments and LEDs of the Power Supply Front Panel. Virtual Front Panel Display shows present parameters (not affected).
1.14. Display Flash (13), set to flash (blink) display of the Power Supply. Virtual Front Panel Display shows present parameters (not affected).
1.15. Profile path (14), set location to store waveform profiles.
1.16. TechPass (15), used for application Developer only. 2. Registers View
2.1. Operational Register (Status Register) view (16).
2.2. Questionable Register (Fault Register) view (17).
2.3. Standard Event Status Register view (18).
2.4. Standard Byte Register view (19).
33
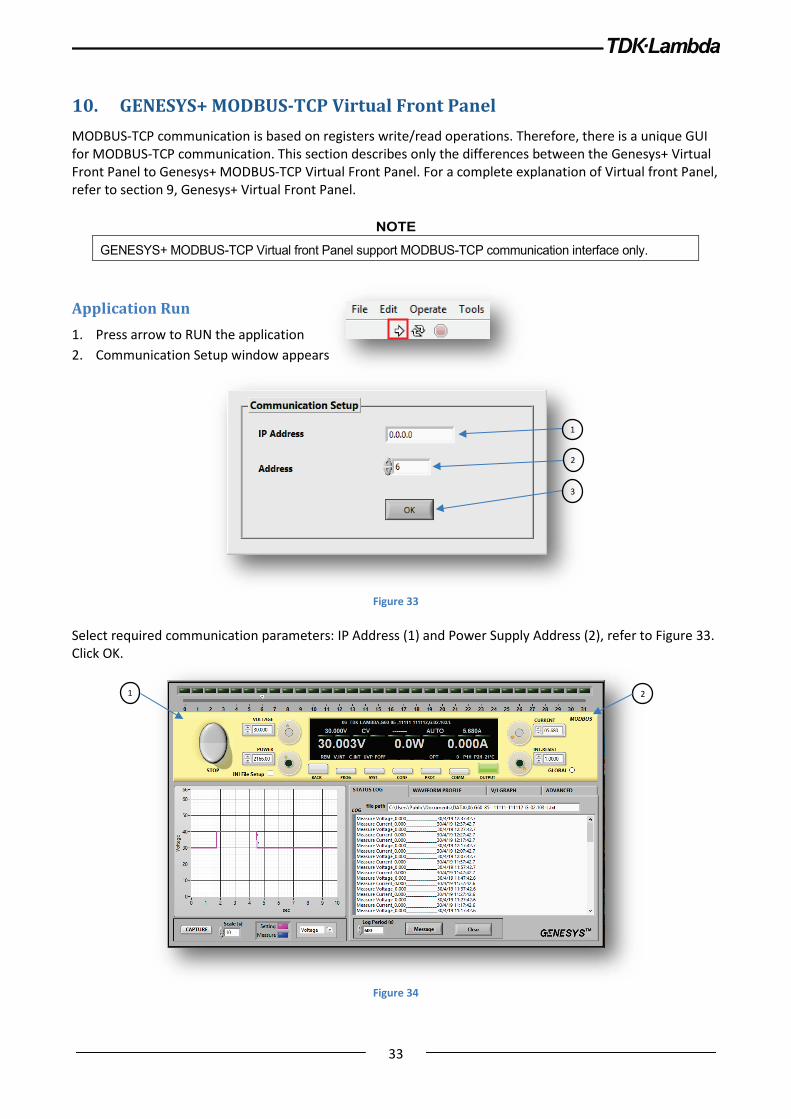
10. GENESYS+ MODBUS-TCP Virtual Front Panel MODBUS-TCP communication is based on registers write/read operations. Therefore, there is a unique GUI for MODBUS-TCP communication. This section describes only the differences between the Genesys+ Virtual Front Panel to Genesys+ MODBUS-TCP Virtual Front Panel. For a complete explanation of Virtual front Panel, refer to section 9, Genesys+ Virtual Front Panel.
NOTE GENESYS+ MODBUS-TCP Virtual front Panel support MODBUS-TCP communication interface only.
Application Run 1. Press arrow to RUN the application 2. Communication Setup window appears
Figure 33
Select required communication parameters: IP Address (1) and Power Supply Address (2), refer to Figure 33. Click OK.
Figure 34
2
3
1
1 2

34
There are two unique items, which identify GENESYS+ MODBUS-TCP Virtual Front Panel (compared to GENESYS+ Virtual Front Panel). The background of the Virtual front Panel has a yellow color (1) and MODBUS (2) is written on the top right side, refer to Figure 34.
35
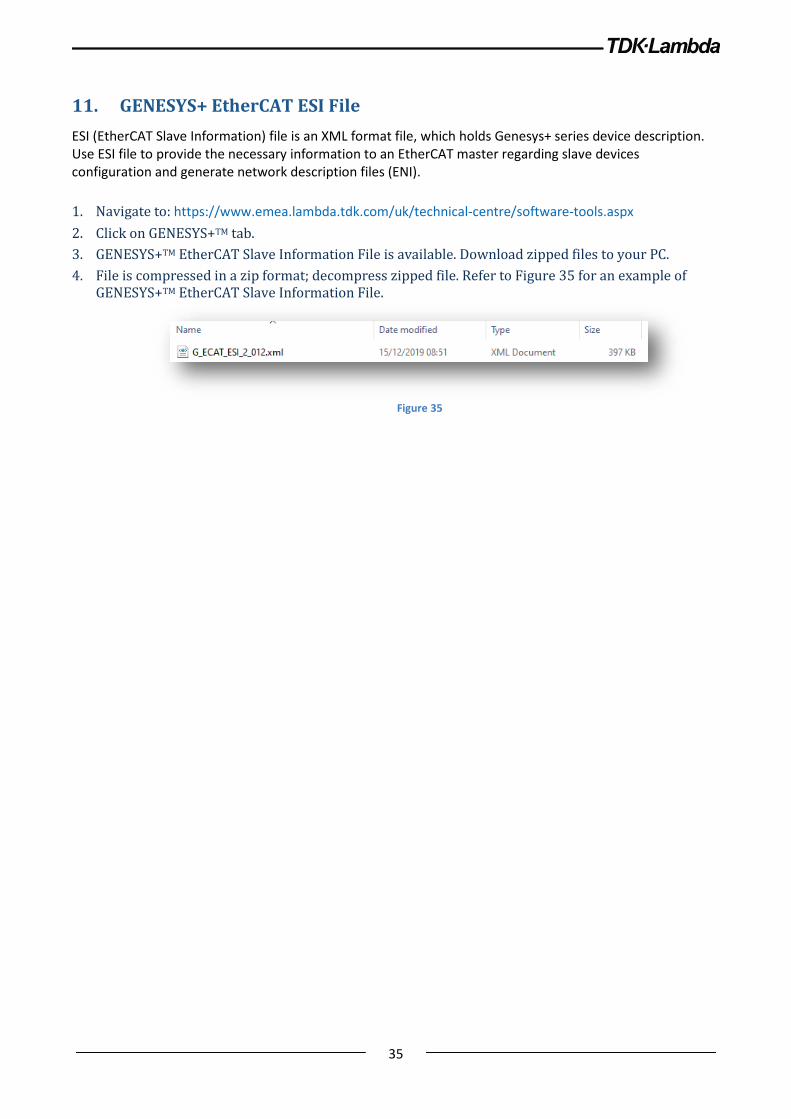
11. GENESYS+ EtherCAT ESI File ESI (EtherCAT Slave Information) file is an XML format file, which holds Genesys+ series device description. Use ESI file to provide the necessary information to an EtherCAT master regarding slave devices configuration and generate network description files (ENI). 1. Navigate to: https://www.emea.lambda.tdk.com/uk/technical-centre/software-tools.aspx 2. Click on GENESYS+TM tab. 3. GENESYS+TM EtherCAT Slave Information File is available. Download zipped files to your PC. 4. File is compressed in a zip format; decompress zipped file. Refer to Figure 35 for an example of
GENESYS+TM EtherCAT Slave Information File.
Figure 35
36
12. Multi-Model Communication
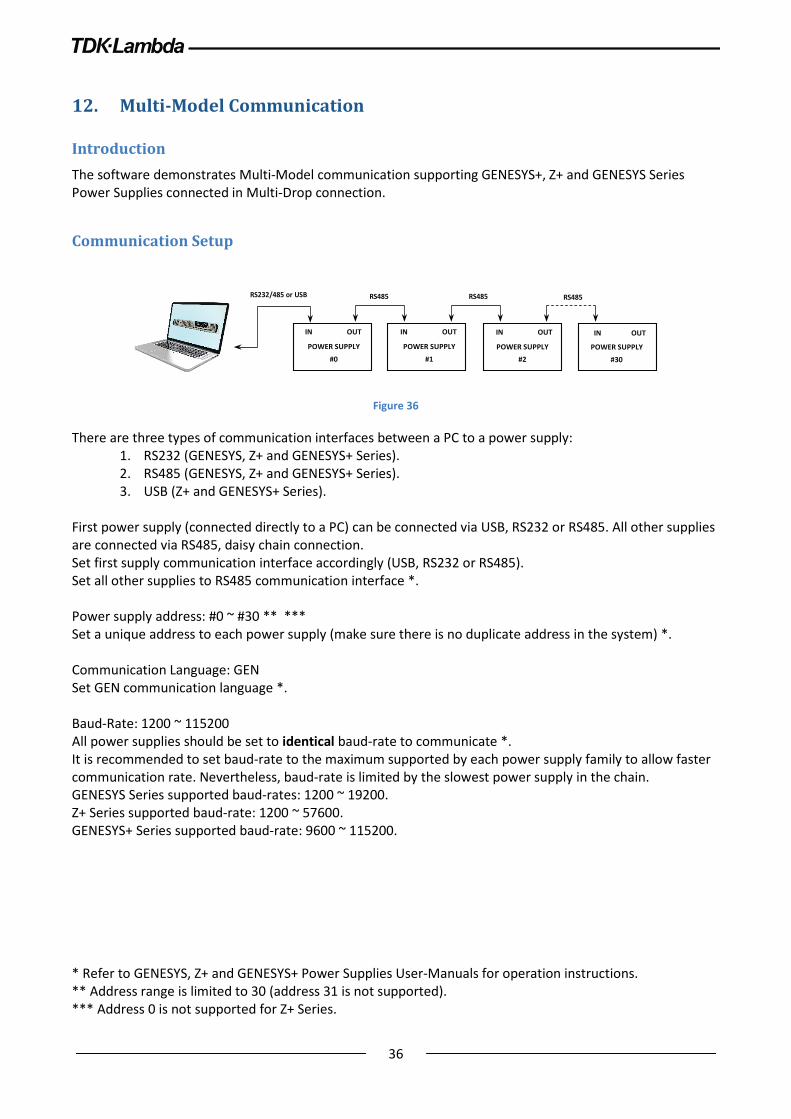
Introduction The software demonstrates Multi-Model communication supporting GENESYS+, Z+ and GENESYS Series Power Supplies connected in Multi-Drop connection.
Communication Setup
Figure 36
There are three types of communication interfaces between a PC to a power supply: 1. RS232 (GENESYS, Z+ and GENESYS+ Series). 2. RS485 (GENESYS, Z+ and GENESYS+ Series). 3. USB (Z+ and GENESYS+ Series).
First power supply (connected directly to a PC) can be connected via USB, RS232 or RS485. All other supplies are connected via RS485, daisy chain connection. Set first supply communication interface accordingly (USB, RS232 or RS485). Set all other supplies to RS485 communication interface *. Power supply address: #0 ~ #30 ** *** Set a unique address to each power supply (make sure there is no duplicate address in the system) *. Communication Language: GEN Set GEN communication language *. Baud-Rate: 1200 ~ 115200 All power supplies should be set to identical baud-rate to communicate *. It is recommended to set baud-rate to the maximum supported by each power supply family to allow faster communication rate. Nevertheless, baud-rate is limited by the slowest power supply in the chain. GENESYS Series supported baud-rates: 1200 ~ 19200. Z+ Series supported baud-rate: 1200 ~ 57600. GENESYS+ Series supported baud-rate: 9600 ~ 115200. * Refer to GENESYS, Z+ and GENESYS+ Power Supplies User-Manuals for operation instructions. ** Address range is limited to 30 (address 31 is not supported). *** Address 0 is not supported for Z+ Series.
IN OUT
POWER SUPPLY #0
IN OUT
POWER SUPPLY #1
IN OUT
POWER SUPPLY #2
IN OUT
POWER SUPPLY
#30
37
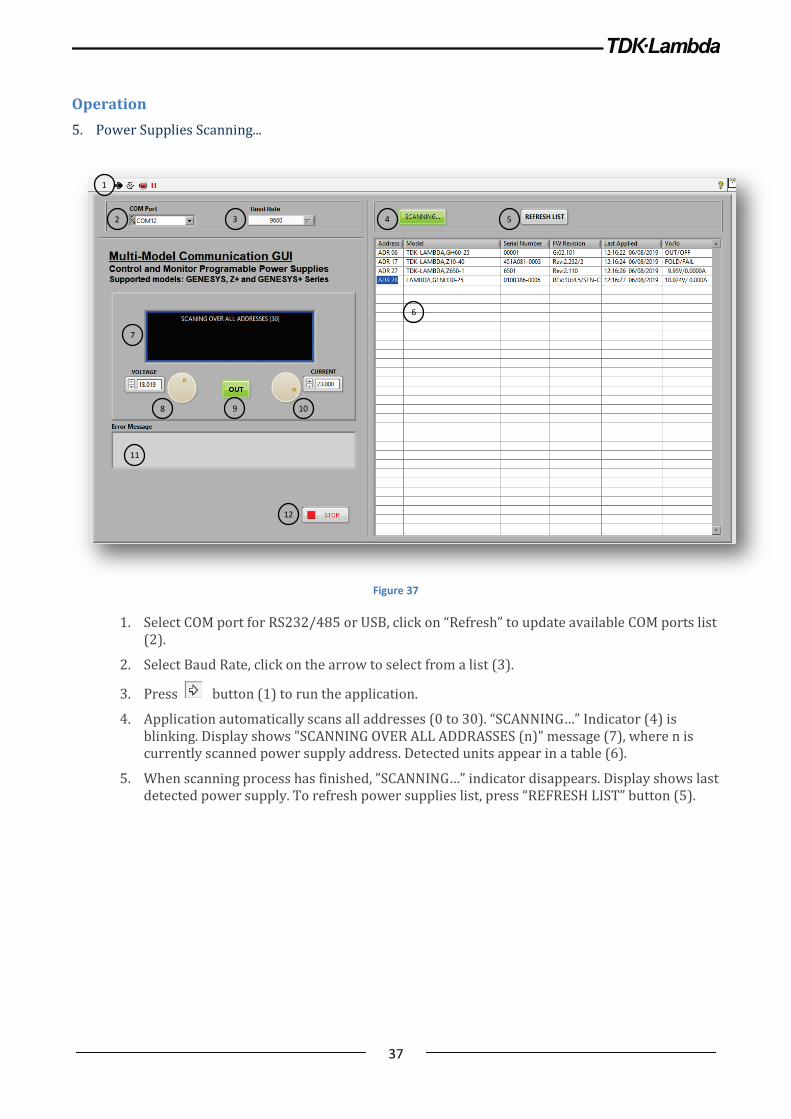
Operation 5. Power Supplies Scanning...
Figure 37
1. Select COM port for RS232/485 or USB, click on “Refresh” to update available COM ports list (2).
2. Select Baud Rate, click on the arrow to select from a list (3).
3. Press button (1) to run the application.
4. Application automatically scans all addresses (0 to 30). “SCANNING…” Indicator (4) is blinking. Display shows "SCANNING OVER ALL ADDRASSES (n)" message (7), where n is currently scanned power supply address. Detected units appear in a table (6).
5. When scanning process has finished, ”SCANNING…” indicator disappears. Display shows last detected power supply. To refresh power supplies list, press “REFRESH LIST” button (5).
2 3
1
4 5
7
8 10
6
9
11
12
38
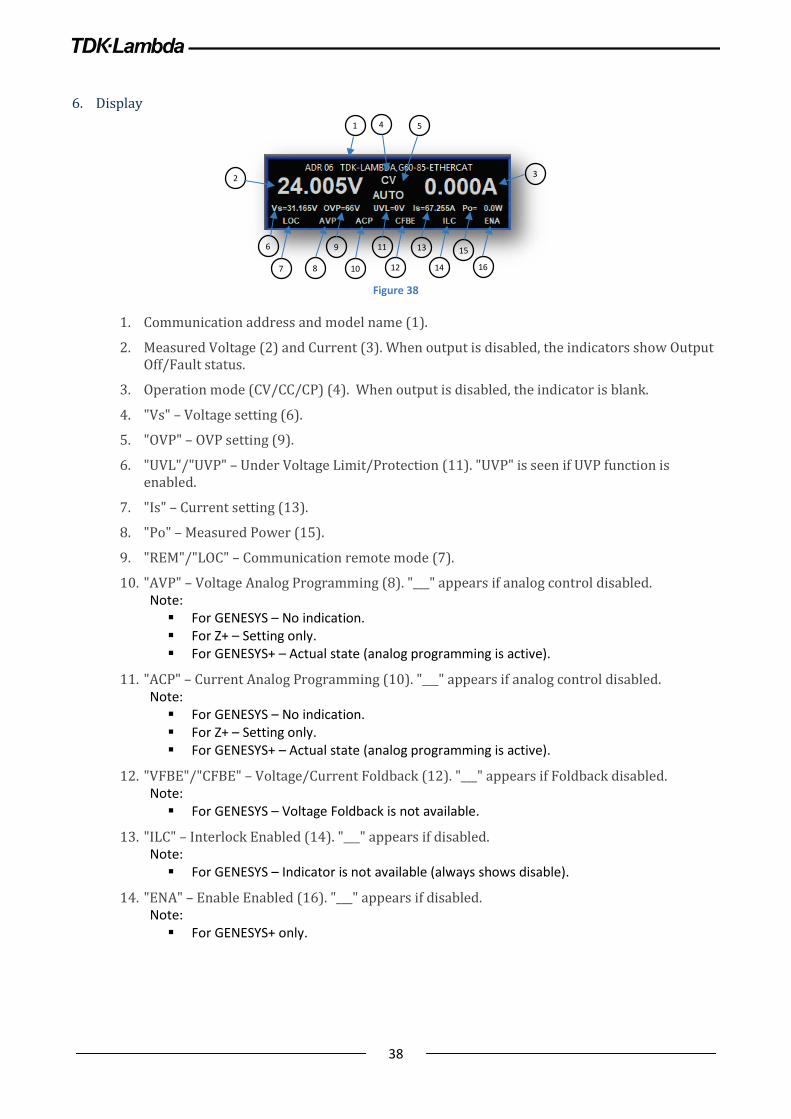
6. Display
Figure 38
1. Communication address and model name (1).
2. Measured Voltage (2) and Current (3). When output is disabled, the indicators show Output Off/Fault status.
3. Operation mode (CV/CC/CP) (4). When output is disabled, the indicator is blank.
4. "Vs" – Voltage setting (6).
5. "OVP" – OVP setting (9).
6. "UVL"/"UVP" – Under Voltage Limit/Protection (11). "UVP" is seen if UVP function is enabled.
7. "Is" – Current setting (13).
8. "Po" – Measured Power (15).
9. "REM"/"LOC" – Communication remote mode (7).
10. "AVP" – Voltage Analog Programming (8). "___" appears if analog control disabled. Note: For GENESYS – No indication. For Z+ – Setting only. For GENESYS+ – Actual state (analog programming is active).
11. "ACP" – Current Analog Programming (10). "___" appears if analog control disabled. Note: For GENESYS – No indication. For Z+ – Setting only. For GENESYS+ – Actual state (analog programming is active).
12. "VFBE"/"CFBE" – Voltage/Current Foldback (12). "___" appears if Foldback disabled. Note: For GENESYS – Voltage Foldback is not available.
13. "ILC" – Interlock Enabled (14). "___" appears if disabled. Note: For GENESYS – Indicator is not available (always shows disable).
14. "ENA" – Enable Enabled (16). "___" appears if disabled. Note: For GENESYS+ only.
1
2 3
4 5
6
7 8
9
10
11
12
13
14
15
16
39
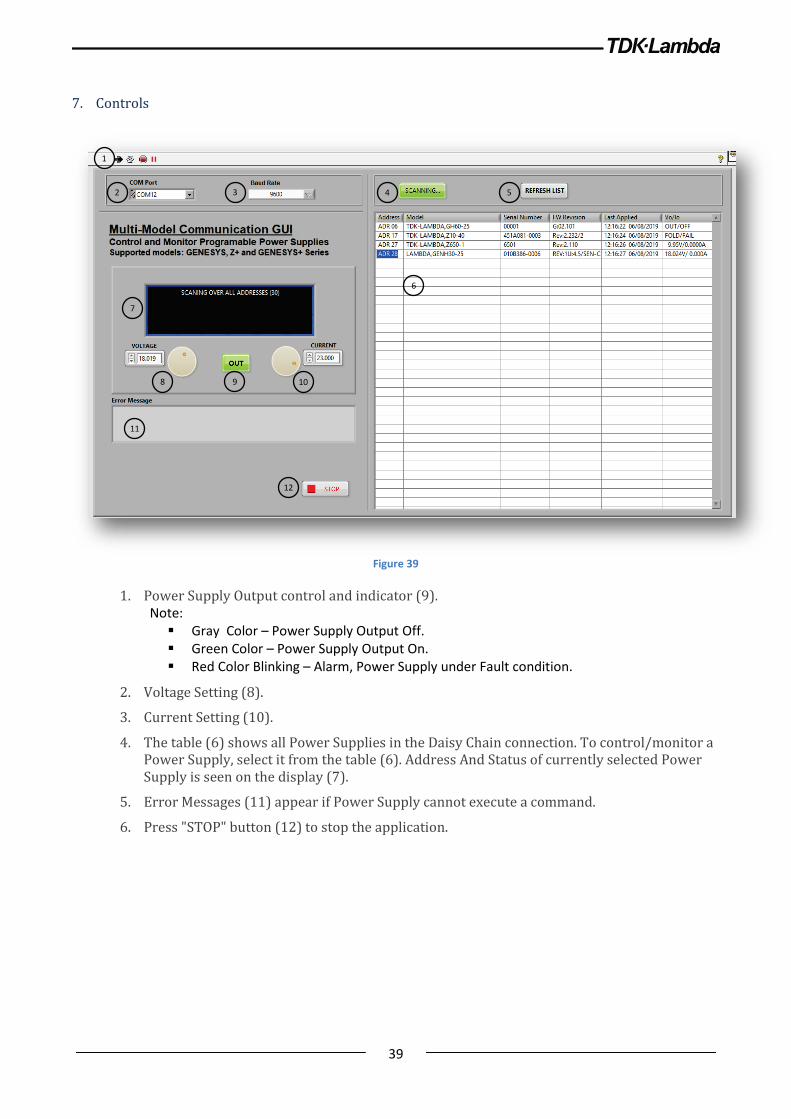
7. Controls
Figure 39
1. Power Supply Output control and indicator (9). Note: Gray Color – Power Supply Output Off. Green Color – Power Supply Output On. Red Color Blinking – Alarm, Power Supply under Fault condition.
2. Voltage Setting (8).
3. Current Setting (10).
4. The table (6) shows all Power Supplies in the Daisy Chain connection. To control/monitor a Power Supply, select it from the table (6). Address And Status of currently selected Power Supply is seen on the display (7).
5. Error Messages (11) appear if Power Supply cannot execute a command.
6. Press "STOP" button (12) to stop the application.
2 3
1
4 5
7
8 10
6
9
11
12