general household survey 2018 - statistics south africa
TRANSCRIPT

StatsSA
General Household
Survey 2018Measuring the progress of development in
the country - May 2019
Statistician-General: Risenga Maluleke

Health and Social
Development
Housing
Food security
Agriculture
Household access to
services and facilities
EducationThe survey covers 6 areas. It provides
trends across the seventeen-year
period since the GHS was introduced
in 2002
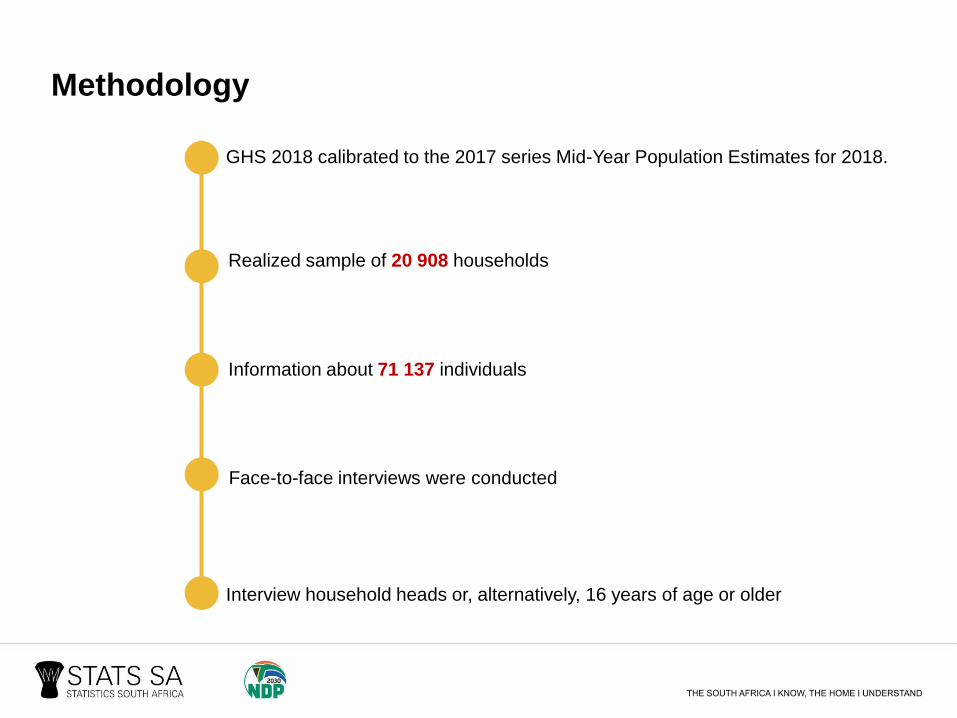
GHS 2018 calibrated to the 2017 series Mid-Year Population Estimates for 2018.
Realized sample of 20 908 households
Information about 71 137 individuals
Face-to-face interviews were conducted
Interview household heads or, alternatively, 16 years of age or older
Methodology

94,7%85,8%
0%
20%
40%
60%
80%
100%
Male Female
18-34
Single
Widowed
Divorced orseparated
Livingtogether
LegallyMarried
31,8% 28,9%
12,3%11,7%
51,8% 45,9%
Male Female
Total
Nationally about half of individuals aged 18 years and older were single. The 18 to 34
year age grouping shows very high ratio of single (never married or not living together). Although marriage
and cohabitation becomes more common with age, being single remains relatively common throughout all
age groups.
All Ages 18+18-34
Percentage of individuals by marital
status and selected ages, 2018

25,7%14,0% 37,6% 14,2%
60% 40% 20% 0% 20% 40% 60% 80%
NW
GP
RSA
MP
KZN
WC
EC
LP
FS
NC
5,09
8,5
8,67
7,07
Large
Percentage
Single or
Single
Generation
Households
Higher Percentage Skip
Generations in Rural Provinces
Households growing faster than population. This phenomenon is largely driven by fact that
one-quarter of households consist of one person.
Single PersonSingle Gen. Double Generation Triple Generation Skip Generation
Percentage of households by household
composition and province, 2018

Housing and Service Delivery

Number of households that lived in formal,
informal and traditional dwellings, 2018
To meet the increasing need for housing, the number of formal dwellings have
increased sharply over the past 17 years. The shortfall is, however, filled by an increase in
informal dwellings.
Increasing
number of formal
dwellings
13,5M
0
2
4
6
8
10
12
14
16
18
2002 2003 2004 2005 2006 2007 2008 2009 2010 2011 2012 2013 2014 2015 2016 2017 2018
Mill
ions
8M
FORMAL DWELLINGS
1,5M
2,1M
1,2M
0,8M
Other
0,01M


3,6%3,6%
2002 2003 2004 2005 2006 2007 2008 2009 2010 2011 2012 2013 2014 2015 2016 2017 2018
57,5%
2,2%
16,1%
20,0%
Energy used for cooking,
2002-2018
WOOD
PARRAFIN
ELECTRICITY
Paraffin and wood as a source of energy for cooking continues to decline as
electricity becomes more accessible.
76,8%
7,7%

72,6%
92,7%
84,7%
2002 2004 2006 2008 2010 2012 2014 2016 2018
76,0%
90,7%
2002 2004 2006 2008 2010 2012 2014 2016 2018
88,5%
87,9%
2002 2004 2006 2008 2010 2012 2014 2016 2018
55,3%
87,4%
2002 2004 2006 2008 2010 2012 2014 2016 2018
68,6%
83,5%
2002 2004 2006 2008 2010 2012 2014 2016 2018
87,2%
77,7%
2002 2004 2006 2008 2010 2012 2014 2016 2018
81,6%
91,7%
2002 2004 2006 2008 2010 2012 2014 2016 2018
85,1%
91,2%
2002 2004 2006 2008 2010 2012 2014 2016 2018
Declines in connection to electricity in Gauteng can be associated with the rapid in-
migration experienced by the province. Household growth in Gauteng can be attributed to in-
migration.
LP NC FS
MP WC EC
KZN GP
SA
82,0%
83,7%
2002 2004 2006 2008 2010 2012 2014 2016 2018
Percentage of households connected to the mains
electricity supply by province, 2002─2018
NW

46,3
28,5
12,3
1,9
3,6
1,2
3,0
1,7
0,1
0,9
0,4
Piped water in dwelling
Piped water on site
Public/ communal tap
Neighbour’s tap
Boreholes (on-site / communal)
Rainwater tank
Water carrier
Stream, river
Stagnant water, pool
Spring, Well
OtherPercentage of households by selected main
water source, 2018
Around 1,8% of Households relied on streams, rivers, dams or stagnant water, for main
sources of drinking water. 89,0% of SA households have access to improved water sources
Imp
roved
sou
rce

Slide needed on national sanitation picture
Sanitation
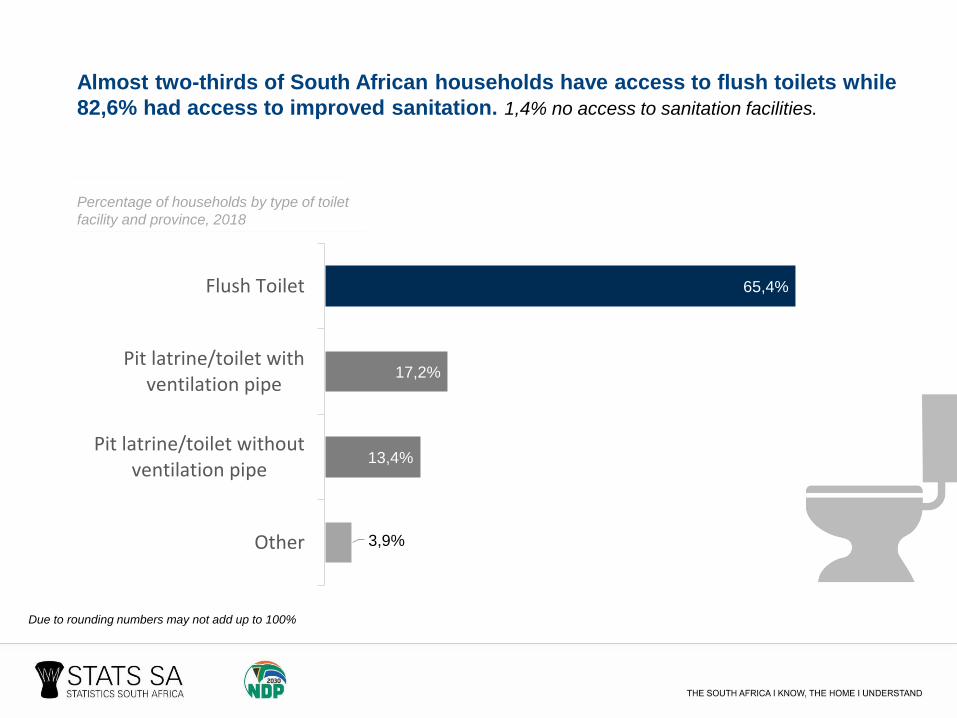
Almost two-thirds of South African households have access to flush toilets while
82,6% had access to improved sanitation. 1,4% no access to sanitation facilities.
Due to rounding numbers may not add up to 100%
65,4%
17,2%
13,4%
3,9%
Flush Toilet
Pit latrine/toilet withventilation pipe
Pit latrine/toilet withoutventilation pipe
Other
Percentage of households by type of toilet
facility and province, 2018

92,2%
93,8%
83,0%
2002200420062008201020122014201620172018
88,9%91,8%
2002 2004 2006 2008 2010 2012 2014 2016 2017 2018
75,5%
90,0%
2002 2004 2006 2008 2010 2012 2014 2016 2017 2018
33,4%
88,0%
2002 2004 2006 2008 2010 2012 2014 2016 2017 2018
64,7%85,5%
2002 2004 2006 2008 2010 2012 2014 2016 2017 2018
50,9%
81,4%
2002 2004 2006 2008 2010 2012 2014 2016 2017 2018
54,1%
70,6%
2002200420062008201020122014201620172018
50,7%
68,1%
2002 2004 2006 2008 2010 2012 2014 2016 2017 2018
26,9%
58,9%
2002 2004 2006 2008 2010 2012 2014 2016 2017 2018
WP GP NC
EC FS KZN
NW MP LP
Despite nearly doubling access to improved sanitation since 2002, access remains the
most limited in Limpopo. EC had large improvements in ventilated toilets
Percentage of households that have access to
improved sanitation per province, 2002–2018
SA

vs
Percentage of households who wash their hands with
soap after using the toilet by Province, 2018
57,8
61,6
72,4
76,2
76,3
77,2
78,2
84,1
84,6
96,3%
LP
MP
KZN
RSA
FS
GP
EC
NC
NW
WC
More than three-quarters (76,2%) of households indicated that their members
usually wash their hands with soap and water after they had used the toilet. However only two-thirds (67,5%) said that they had easy access to hand washing facilities with soap.

A quarter of households across all metros separated waste for recycling. Fewer households living in Mangaung, eThekwini and Tshwane reported separating waste for
recycling purposes.
Households that separate waste
for recycling 2018
37,3%
31,4%
27,3%25,7% 25,6% 24,7%
16,8%
9,1%
5,3%
CPT COJ EKU BUF NMB Metros TSH ETH MAN

25,7%
27,8%
34,9%
39,2%
39,6%
44,0%
48,9%
64,7%
0 10 20 30 40 50 60 70
EKU
CPT
TSH
ETH
BUF
COJ
NMB
MAN
Me
tro A
ve
rag
e
37,0
%
Percentage of households who experienced
waste removal problems by metropolitan
area, 2018
Waste removal and littering was considered most important across all metros.
Regular refuse removal for almost 90% of metro households. Satisfaction levels vary and the case
of Mangaung well documented.

85,4%
40,9
0%
20%
40%
60%
80%
100%
20
04
20
05
20
06
20
07
20
08
20
09
20
10
20
11
20
12
20
13
20
14
20
15
20
16
20
17
20
18
Access to piped water
Pay for water
63,9%
26,2
11,4%
0%
20%
40%
60%
80%
100%
20
05
20
06
20
07
20
08
20
09
20
10
20
11
20
12
20
13
20
14
20
15
20
16
20
17
20
18
Good Average Poor
THE NUMBER OF HOUSEHOLDS WITH ACCESS TO PIPED WATER HAD INCREASED
SINCE 2006. However, this coincided with a decline in the percentage of households who paid for the
piped water they received.
Access to piped municipal water
supplies, payment and service ratings
for local municipalities, 2006–2018
Access to piped municipal water
supplies, payment for local
municipalities, 2006–2018

Households livelihood
Households livelihood

Vulnerability to hunger at an individual and household level has been declining
whilst access to grants has been increasing.
22,8%
9,7%
27,7%
11,3%
12,8%
31,0%30,8%
44,3%
2002 2004 2006 2008 2010 2012 2014 2016 2018
Grants and Vulnerability to hunger
2002 - 2018
Grant: persons
Grant: households
Vulnerability to hunger: persons
Vulnerability to hunger: HH
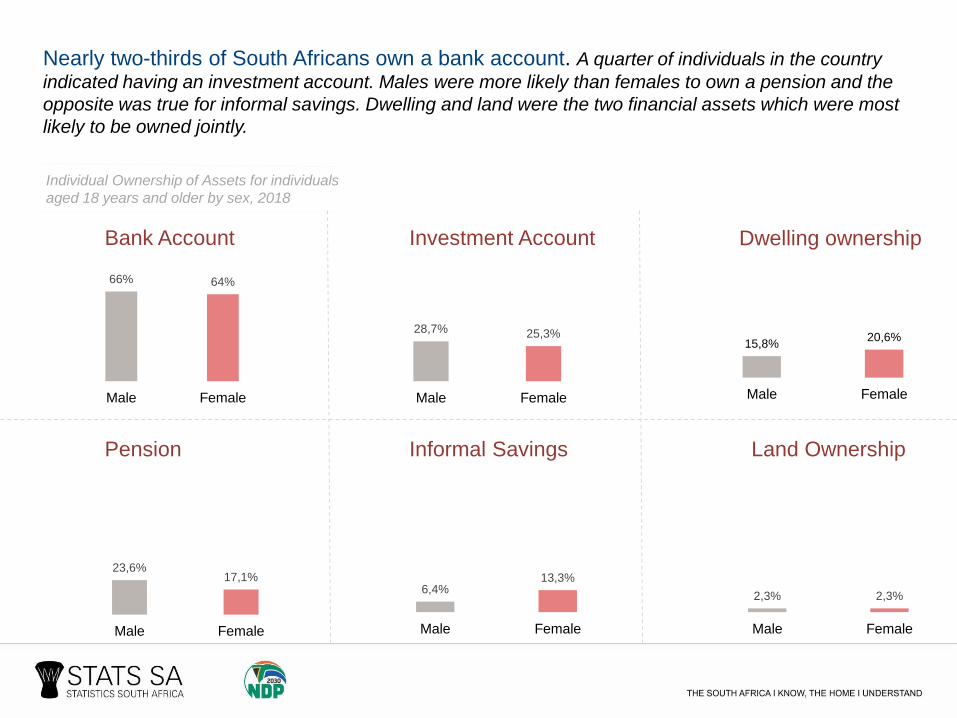
Nearly two-thirds of South Africans own a bank account. A quarter of individuals in the country
indicated having an investment account. Males were more likely than females to own a pension and the
opposite was true for informal savings. Dwelling and land were the two financial assets which were most
likely to be owned jointly.
66% 64%
Male Female
15,8%20,6%
Male Female
28,7% 25,3%
Male Female
23,6%17,1%
Male Female
6,4%13,3%
Male Female
2,3% 2,3%
Male Female
Bank Account Investment Account Dwelling ownership
Pension Informal Savings Land Ownership
Individual Ownership of Assets for individuals
aged 18 years and older by sex, 2018

Extra Source of Food Involvement in agriculture
Nationally, more than three-quarters (78,5%) of households that were involved in
agriculture were involved in an attempt to secure an additional source of food. Agriculture plays an important role in the process of economic development and can contribute
significantly to household food security.
Main source of income
2,5%
4,0%
9,1%
9,3%
17,1%
18,2%
24,7%
29,3%
37,1%
WC
GP
NC
NW
FS
KZN
MP
EC
LP
45,5%
59,9%
49,4%
50,9%
78,7%
71,5%
76,8%
78,6%
88,7%
9,1%
2,7%
9,7%
8,0%
3,4%
1,3%
2,9%
2,6%
1,9%
Percentage distribution of the main
reasons for agricultural involvement by
province, 2018
Education

41,7%
49,8%
47,8%
41,2%
46,7%
43,1%
44,7%
44,8%
37,2%
34,3%
21,8%
21,8%
27,6%
33,9%
30,7%
33,8%
32,5%
34,8%
48,9%
53,7%
3,5%
4,1%
1,8%
3,8%
2,7%
3,3%
3,6%
3,0%
3,2%
3,6%
33,1%
24,4%
22,8%
21,1%
19,9%
19,8%
19,3%
17,4%
10,8%
8,4%
EC
KZN
LP
FS
NW
RSA
MP
NC
GP
WC
Nationally, one-third of children lived with both parents whilst 43 per cent lived with
mothers only. Children in affluent provinces were most likely to live with both parents. Children's living
arrangements was likely to affect their performance at school.
Lived with neither Lived with mother Lived with both Lived with father
Percentage of children living
arrangements, 2018

1,3%
3,5%2,6% 2,3%
3,0%2,4% 2,0%
3,3%
1,2%2,4%
4,4%
8,4%
5,5%
7,7%
10,7%
7,3%
5,5%
7,9%
6,2%
7,4%0,3%
2,8%
1,9%
3,1%
2,4%
1,8%
1,7%
2,2%
1,7%
2,0%
WC EC NC FS KZN NW GP MP LP RSA
Around one-tenth of children in South Africa were orphans. Fewer children were
double orphans. One-tenth of children in Kwazulu-Natal are paternal orphans. This is in line with life
expectancy as women had slightly higher life expectancy than males.
Percentage of children by orphanhood
status and province, 2018
Paternal orphan
Maternal orphan
Double orphan

36,8%
45,2%
38,8%
46,5%
53,9%
54,0%
60,2%
63,2%
57,8%
49,8%
48,3%
43,7%
38,6%
38,5%
37,5%
24,9%
32,2%
22,4%
4,6%
2,2%
8,0%
5,4%
5,1%
4,2%
9,7%
3,7%
4,3%
0,5%
0,9%
1,9%
0,5%
0,0%
1,6%
1,0%
0,0%
1,0%
0,0 10,0 20,0 30,0 40,0 50,0 60,0 70,0 80,0 90,0 100,0
GP
FS
WC
LP
MP
EC
KZN
NW
NC
Chart TitleAt home with another adult
At somebody else’s dwelling
NC
NW
EC
MP
LP
WC
FS
GP
KZN
Children aged 0 - 4 years using
different child care arrangements
(top four) by province, 2018
MAJORITY OF CHILDREN AGED 0─4 ARE STILL KEPT AT HOME WITH PARENTS OR
OTHER GUARDIANS IN MOST PROVINCES.
At home with parent or guardian ECD Centres

Type of ECD stimulation
received by children 0-4, 2018
Nearly half of children have never read a book or drawn with a parent or guardian.
25,9%
32,2%
34,5%
35,1%
43,1%
46,8%
Naming different things with a child
Counting different things with a child
Talking about things you have done witha child
Telling stories with a child
Drawing or colouring with a child
Reading books with a child
Never Often Sometimes
Reading books with a
child

Percentage of those aged 5 – 24
years who attend educational
institution, 2018
There is noticeable representation of learners who are older than the ideal
graduation age in primary and secondary schools.
0%
20%
40%
60%
80%
100%
5 6 7 8 9 10 11 12 13 14 15 16 17 18 19 20 21 22 23 24
TVET
University
Primary School
Secondary School
Pre
Sch
oo
l
Not in
Education
or Training

Main reasons given by persons
aged 7 to 18 years for not attending
an educational institution, 2018
Over a fifth of learners cited a lack of money as the main reason for not attending an
educational institution. Some reasons for not attending an educational institution are particularly
affected by gender.
3,5%
7,5%
7,9%
9,8%
10,8%
13,3%
22,9%
24,2%
Working at home
Education is useless
Family commitments
Completed education
Illness and disability
Other
Poor academic performance
No money for fees
M F
Vast gender disparities in
“family commitment” and
“education is useless”
14.4%0,2%
11,8%3,9%


Upper Secondary
Some Primary
NSC/GRADE 12 CONTINUES ITS UPWARD TREND. The percentage who attained Grade 12
as their highest level of education increased from 21,3% in 2002 to 30,9% in 2018.
Educational attainment for persons
aged 20 years and older , 2002 - 2018
17,4%
8,7%
200
2
200
3
200
4
200
5
200
6
200
7
200
8
200
9
201
0
201
1
201
2
201
3
201
4
201
5
201
6
201
7
201
87,0%
4,3%
200
2
200
3
200
4
200
5
200
6
200
7
200
8
200
9
201
0
201
1
201
2
201
3
201
4
201
5
201
6
201
7
201
8
14,7%
11,4%
20
02
20
03
20
04
20
05
20
06
20
07
20
08
20
09
20
10
20
11
20
12
20
13
20
14
20
15
20
16
20
17
20
18
18,8%
25,5%
20
02
20
03
20
04
20
05
20
06
20
07
20
08
20
09
20
10
20
11
20
12
20
13
20
14
20
15
20
16
20
17
20
18
21,3%
30,9%
20
02
20
03
20
04
20
05
20
06
20
07
20
08
20
09
20
10
20
11
20
12
20
13
20
14
20
15
20
16
20
17
20
18
9,2%
14,3%
20
02
20
03
20
04
20
05
20
06
20
07
20
08
20
09
20
10
20
11
20
12
20
13
20
14
20
15
20
16
20
17
20
18
Completed Primary Lower secondary
NSC/Grade 12 Post School

10,71
10,39
8,75
9,13
10,59
10,73
10,79
17,67
20,96
LP
EC
NC
NW
FS
MP
KZN
WC
GP
21,9%
23,0%
27,1%
28,7%
30,9%
31,9%
33,8%
29,9%
35,9%
LP
EC
NC
NW
FS
MP
KZN
WC
GP
SA
Ave
rage
30
,89
%
SA
Ave
rage
1
4,2
7%
Most provinces are closer to the SA average for obtaining NSC, however still large
disparity in obtaining post school qualifications by province
NSC/Grade 12 Post School
Percentage distribution of educational
attainment for persons aged 20 years and older
by province, 2018

TELECOMMUNICATIONS

Telecommunications access is primarily driven by widespread adoption of cellular
communication. Many households in Northern Cape still experience the digital divide with around
10% with no access at all.
Household access to landlines and
cell phones by Province, 2018
18,4%
6,3%
4,2%
7,1%
5,3%
7,2%
7,8%
3,4%
1,9%
2,3%
4,3%
10,3%
7,6%
3,4%
4,7%
2,7%
1,5%
4,4%
3,6%
1,1%
77,1%
83,1%
88,1%
89,5%
89,9%
90,0%
90,7%
92,1%
94,5%
96,5%
WC
NC
EC
RSA
FS
KZN
GP
NW
LP
MP
Cell and Landline None Cell only

67,4%63,7%
45,0%
17,3%8,0% 1,7%
0,0%
10,0%
20,0%
30,0%
40,0%
50,0%
60,0%
70,0%
80,0%
Metro Urban Rural
Using Mobile Devices
At Home
MOBILE DEVICES HAVE REVOLUTIONIZED INTERNET ACCESS. Access is generally
much higher, although still lacking in rural areas
Access to the Internet at home,
or using mobile devices, 2018

Factors such as where we live, the state of our environment, genetics,
our income and education level, all have considerable impacts on
health
Health

On average, less than 17% of the population have medical aid coverage. Only highly
urbanised provinces of Gauteng and WC have medical aid coverage rates higher than the average
% of individuals who are
members of medical aid schemes
per province, 2018
8,2%
10,0%
12,4%
12,6%
13,5%
16,1%
16,2%
16,4%
23,9%
25,1%
LP
EC
KZN
MP
NW
NC
FS
RSA
GP
WC

PUBLIC FACILITIES STILL FIRST PORT OF CALL FOR THE VAST MAJORITY OF
SOUTH AFRICA. Only highly urbanised provinces of Gauteng and WC have medical aid coverage
rates higher than the average
Due to rounding numbers may not add up to 100%
71,5%
27,1%
0,7% 0,8%
Public Facilities
Private Facilities
Traditional HealerOther
Healthcare facility normally
consulted by household when
someone is ill, 2018

ORPHANHOOD
STATUS HOUSEHOLD
COMPOSITION OWNERSHIP
OF ASSETS
LIVING
ARRANGEMENTS
One-fifth of children did
not live with either their
biological parents while
33,8% lived with both
parents, and 43,1% lived
with their mothers.
Approximately 11,7% of
children were orphaned.
RecapGHS 2018
More than one-quarter
(25,7%) of households
consisted of a single
person, while 62% of
households contained
three or less members.
Nuclear households that is
comprised of parents and
children made up 39,1% of
all households
More than two-thirds
(64,9%) of individuals aged
18 years and older owned
one or more bank
accounts individually or
jointly with others.
Only 5,5% of adults owned
any land, with virtually no
difference between males
and females.
Marriage and cohabitation
are more common among
women than men in the
age group 18-34 years. The
situation is reversed in
older age groups.
Living arrangements raises
challenges of providing basic
services to households, and
maintaining social cohesion.

EDUCATION EDUCATION
RecapGHS 2018
About a quarter of
premature school leavers
charged ‘lack of money’
for not studying.
Family commitments cited
by 14,4% of females and
0,2% of males.
Attendance almost
universal at ages 7-15
years, 25,5% of persons
aged 5–24 not attending
educational institutions
Participation rates at
higher education
institutions are low for
black African and coloured
students.

Ndzi hela kwala!