gene expression profiles of the subcutaneous fat and … · citation: gandhi r, weston a, virtanen...
TRANSCRIPT

Open AccessResearch Article
ArthritisGandhi et al., J Arthritis 2015, S1
http://dx.doi.org/10.4172/2167-7921.S1-002
J Arthritis ISSN: 2167-7921 JAHS, an open access journal Arthritis & Pain
Keywords: Gene expression; Infrapatellar fat pad; Subcutaneous fat; Knee osteoarthritis
IntroductionThere is now compelling evidence that adipose tissue is
metabolically active and that adipose derived metabolic factors can have physiological effects [1,2]. In adults, fat exists primarily as white adipose tissue. This tissue is widely distributed throughout the body with the two most prevalent forms being subcutaneous adipose tissue (SAT) and visceral adipose tissue (VAT).
SAT accounts for the vast majority of all the fat in the body [3,4] and potentially is a major source of adipose derived factors in the systemic circulation [5]. Each type of adipose tissue displays unique phenotypic and genotypic characteristics [6]. Some have suggested that each fat type may have differing developmental lineages that play a role in body fat distribution, obesity and the variety of functional properties of various adipose tissue sites in the body [7]. Previous work has shown that inflammatory hormones secreted by adipocytes and macrophages can significantly affect expression levels of leptin, adiponectin, tumour necrosis factor-α (TNF-α) and interleukin 6 (IL-6) in SAT [1,8-10]. The systemic release of these adipose-derived hormones is thought to be responsible for the low-grade inflammatory state commonly observed in obese individuals [6,11,12].
The link between obesity and osteoarthritis (OA) has long been established [13]. This link is in part believed to be a metabolic one [13], in addition to the recognized impact of increasing mechanical
forces on weight-bearing joints [12]. Many individuals experience OA symptoms in non-weight bearing joints as well [14-16]. Indeed, studies are revealing associations between levels of adipose-derived factors in blood and/or synovial fluid and the presence or severity of osteoarthritis, particularly the knee [17,18].
Osteoarthritis is most prevalent in the knee [15], and association between OA and obesity has been particularly marked for this joint [16]. Thus, the knee likely provides an ideal setting in which to examine any potential role(s) of fat on OA development/progression, particularly as it is the only joint to contain a large intra-articular deposit of adipose tissue. The infrapatellar fat pad (IFP) is an intracapsular and extrasynovial structure, distinguishable from SAT and VAT by its unique location and relative size [19-24].
*Corresponding author: Dr. Rajiv Gandhi, Toronto Western Hospital, East Wing 1-439, 399 Bathurst St, Toronto, Ontario, M5T 2S8, Canada, Tel : 416 603-5642; E-mail: [email protected]
Received June 05, 2015; Accepted June 20, 2015; Published June 30, 2015
Citation: Gandhi R, Weston A, Virtanen C, Takahashi M, Mahomed N, et al. (2015) Gene Expression Profiles of the Subcutaneous Fat and Infrapatellar Fatpad in Individuals with Early and Endstage Knee Osteoarthritis: A Cross-sectional Analysis. J Arthritis S1: 002. doi:10.4172/2167-7921.S1-002
Copyright: © 2015 Gandhi R, et al. This is an open-access article distributed under the terms of the Creative Commons Attribution License, which permits unrestricted use, distribution, and reproduction in any medium, provided the original author and source are credited.
Gene Expression Profiles of the Subcutaneous Fat and Infrapatellar Fatpad in Individuals with Early and Endstage Knee Osteoarthritis: A Cross-sectional AnalysisRajiv Gandhi1*, Amanda Weston1, Carl Virtanen2, Mark Takahashi3, Nizar Mahomed1 and Anthony Perruccio4
1Arthritis Program, Toronto Western Hospital, Division of Orthopaedic Surgery, Toronto Western Hospital, University Health Network, 399 Bathurst St Toronto, Ontario M5T 2S8, Canada2Princess Margaret Genomics Centre, Toronto Medical Discovery Tower, 101 College St Toronto, Ontario M5G1L7, Canada3University Health Network, Hydro Place Building, 700 University Ave 10th floor Suite 1056-14 Toronto, Ontario M7A 2S4, Canada4Arthritis Program, University Health Network, and Institute of Health Policy, Management & Evaluation, University of Toronto, 399 Bathurst St Toronto, Ontario M5T 2S8, Canada
AbstractObjective: Previous research has examined gene expression of the IFP from individuals with early and endstage
knee OA. However, there is little understanding of whether the differential expression that was found is a local effect associated with OA disease severity. The objective of this study was to compare gene expression of the SAT and IFP both within individuals with early and late stage knee OA.
Methods: Knee SAT and corresponding IFP samples were harvested from twenty-nine patients with endstage and five patients with early stage OA at the time of knee surgery. Total RNA was then extracted, labelled and hybridized to Illumina whole genome expression arrays. Arrays were scanned and intensity of hybridization quantified. Filtered data were analyzed to find significantly different expressed genes between the disease stages and fat types.
Results: SAT gene expression demonstrated significantly less differential genes between disease states when compared to the gene expression profiles of IFP tissues between individuals with early and endstage OA. Among those with early stage OA, the SAT and IFP tissues were highly dissimilar at the gene expression level, whereas among those with endstage OA these tissues were comparatively more similar.
Conclusions: Our findings suggest that the effects of OA on the IFP are localized, more so with later disease stages, while changes in the SAT are less prominent. It is unknown whether or not the localized effects of IFP may be a unique contributor to knee OA or a result of systemic changes occurring in the body. Further research which includes longitudinal assessments with larger cohorts is warranted.

Citation: Gandhi R, Weston A, Virtanen C, Takahashi M, Mahomed N, et al. (2015) Gene Expression Profiles of the Subcutaneous Fat and Infrapatellar Fatpad in Individuals with Early and Endstage Knee Osteoarthritis: A Cross-sectional Analysis. J Arthritis S1: 002. doi:10.4172/2167-7921.S1-002
Page 2 of 7
J Arthritis ISSN: 2167-7921 JAHS, an open access journal Arthritis & Pain
Previous work from our group revealed that the IFP from individuals with endstage knee OA had genes that were more highly expressed as compared to individuals with early knee OA, particularly genes encoding regulators of cartilage homeostasis, and factors involved in lipid metabolism and energy homeostasis [25]. However, there is little understanding of whether this differential expression is a local effect associated with OA disease severity. To date, only two studies have compared adipokine expression of the IFP to a reference sample of SAT adipose tissue. However, these studies were limited to individuals with endstage OA only [21,22]. The authors reported a significant increase in the protein levels of IL-6, soluble IL-6 receptor, and leptin in the IFP relative to SAT.
The objective of this study was to compare gene expression of the SAT within individuals with early and late stage knee OA and compare results to our previously reported data on IFP gene expression [25] both within and across stages of OA.
MethodsIndividuals undergoing total knee replacement for osteoarthritis
or arthroscopic knee surgery at the Toronto Western Hospital were recruited into the study. Individuals were eligible if they were 35 years of age or older and did not have any inflammatory arthritis. The study was approved by the Human Subject Review Committee, University Health Network Research Ethics Board; informed consent was obtained from all patients voluntarily.
Collection of tissue samples
IFP samples were collected from 29 subjects with end-stage primary knee OA at the time of their knee replacement surgery under sterile conditions. In addition, IFP samples were harvested from five subjects with early-stage knee OA at the time of their arthroscopic knee surgery for debridement of meniscal tears. Diagnosis of OA was determined by the attending physician based on radiographic images and the Kellgren and Lawrence classification, as well as the criteria provided by the American College of Rheumatology [26,27]. Early-stage knee OA was confirmed intraoperatively based on the Outerbridge classification [28] and defined as grade I or II lesion and by the presence of only partial thickness cartilage defect in any compartment of the knee. Softening and swelling of the cartilage was defined as a grade I lesion, while a partial-thickness defect with fissures on the surface that did not reach the subchondral bone or exceed 1.5 cm in diameter defined as grade II [28]. Samples graded III or IV was classified as end-stage OA [28]. Fissuring to the level of the subcondral bone was graded III, while exposed subcondral bone was graded IV [28]. Corresponding knee SAT samples were obtained from the knee area (from the same location) of each early and end-stage knee OA patient at the time of their respective procedures. All subjects were fasting 12-16 hours prior to sample collection. Fat samples were immediately placed in a solution of RNA later (Ambion) for preservation until analyzed.
Isolation of total RNA
Fat samples from the same location in each fat pad (100 mg) were weighed in sterile 1.5 ml tubes before being homogenized in solution D (4M Guanadinium Thiocyanate, 25 mM Sodium Citrate, 0.5% Sarcosyl and 7.2 µl/ml β-mercaptoethanol). TRIzol reagent (Invitrogen) was then added to each sample before total RNA was isolated following the manufacturer’s protocol. Samples were transferred to an RNeasy Mini column (Qiagen) for sample clean-up before being treated with DNase (Qiagen) for 15 minutes at room temperature. Quantity and
quality of the isolated RNA were determined by running samples on the Nanodrop and Agilent Bioanalyzer 2100, respectively.
Microarray quantification
Total RNA was reverse transcribed to produce first single stranded then second stranded cDNA following manufacturer’s instructions (Illumina TotalPrep Amplification kit, Ambion). After column purification, all samples were quantified using a Nanodrop spectrophotometer. cRNA in appropriate amounts was aliquoted and hybridized to Illumina whole genome expression arrays (Human HT12_v3_r2) overnight at 58°C with rocking. Finally, microarrays were washed, scanned and the resulting images quantified.
Microarray data analysis
Prior to data analysis all samples were quality checked using the Bioconductor [29] and Lumi [30] package in R (version 2.14.1). GeneSpring software (version 12.1, Agilent) was used for all statistical testing and data analysis. Background subtracted intensities for the 48803 probes on the arrays were normalized using a quantile normalization followed by median based normalization. Pre-filtering was performed to remove probes with no expression in any of the groups under consideration (at least 80% of samples having an expression value greater than the 20th percentile). General overall trends in the data were assessed using a two-way, unsupervised hierarchical clustering algorithm employing average linkage rules with a Pearson centered similarity metric on probes showing high overall variability (standard deviation across all samples > 2.0).
Statistical analysis focused on probes that were differentially expressed between disease states (i.e. early vs. endstage) and tissue types (IFP vs. SAT). The dataset was considered as whole with 4 groups: early IFP, endstage IFP, early SAT, and endstage SAT. Differentially expressed genes were identified using a one-way Analysis of Variance with post-hoc Tukey Honest Differences tests (Benjamini Hochberg False Discovery Rate (FDR) threshold of q<0.05). Venn diagrams were used to find exclusive sets of genes for the comparisons of interest. Gene ontology enrichment analysis was done with a hypergeometric test and Benjamini-Yekutieli FDR correction (q<0.2). Pathway analysis was accomplished using the DAVID online tool (EASE Score<0.1) using the following pathway databases: BBID, BIOCARTA, KEGG, and PANTHER [31].
Quantitative PCR
Triplicate reactions on real-time PCR were previously carried out on each of the samples using total RNA for validation of the array data using randomly selected probes, results are previously reported [25]. The reaction was completed using the full velocity SYBR Green qPCR Master Mix (Agilent), using the following primer sequences: LEPTIN: Forward: GTG TGA GCA GTG AGT TAC; Reverse: TAG GTG GTT GTG AGG AT; ADIPONECTIN: Forward: GGA AGG ACT ACT ACT CAA TG; Reverse: CAG CAC TTA GAG ATG GA; PPARG: Forward: AGA CAT TCC ATT CAC AAG A; Reverse: CAG ACA CGA CAT TCA AT; DGAT2: Forward: ACA GAA GTG AGC AAG AAG; Reverse: GAC CAG GAT GAT GAT AG; THRSP: Forward: CCA ATG ATG AGA GCA GAA; Reverse: GTG AAT AGC AAC AGA CAT; ACOT1: Forward: TCA ACA GAA ATC GCA TCA; Reverse: CTC ATT AGC ATA GAA CTC A; FABP5: Forward: GGG AGA GAA GTT TGA AGA A; Reverse: GAG TAC AGG TGA CAT TG; and CD36: Forward: GTT GGA GAC CTG CTT ATC; Reverse: TGC TGT TCA TCA TCA CT [25]. T-tests between the two disease states at the p <0.05 level were used to assess significance of results.
Citation: Gandhi R, Weston A, Virtanen C, Takahashi M, Mahomed N, et al. (2015) Gene Expression Profiles of the Subcutaneous Fat and Infrapatellar Fatpad in Individuals with Early and Endstage Knee Osteoarthritis: A Cross-sectional Analysis. J Arthritis S1: 002. doi:10.4172/2167-7921.S1-002
Page 3 of 7
J Arthritis ISSN: 2167-7921 JAHS, an open access journal Arthritis & Pain
2 fold, CD36 and Leptin. Many of the probes related to inflammation and energy homeostasis did not demonstrate a fold difference greater than plus or minus two.
Overall, there were a greater number of fold differences between these fat types in early stage OA.
DiscussionEvidence suggests that there is a metabolic link between obesity
and OA [13-17,32]. The knee joint is the only joint in which there is localized adipose tissue, recognized also as being metabolically active [20-23,25], and the joint most often affected by OA. While previous
ResultsOur sample of 29 end-stage knee OA subjects had a mean age of
66.9 years (range 44-85, SD 9.6), mean BMI of 33.1 kg/m2 (range 21.5 – 49.3 kg/m2,SD 6.3), and consisted of 14 males. The 5 early-stage OA subjects had a mean age of 42.6 years (range 35-50 years, SD 12.4), mean BMI of 34.1 kg/m2 (range 26.4 – 39.6 kg/m2 SD 6.4), and included two males.
Sample RNA quality was tested using the bioanalyzer and all samples (except one) had a RNA Integrity Number (RIN) of eight or higher were used. Illumina based quality control metrics were used to ensure that sample quality was sufficient for microarray analysis prior to generation of the array data.
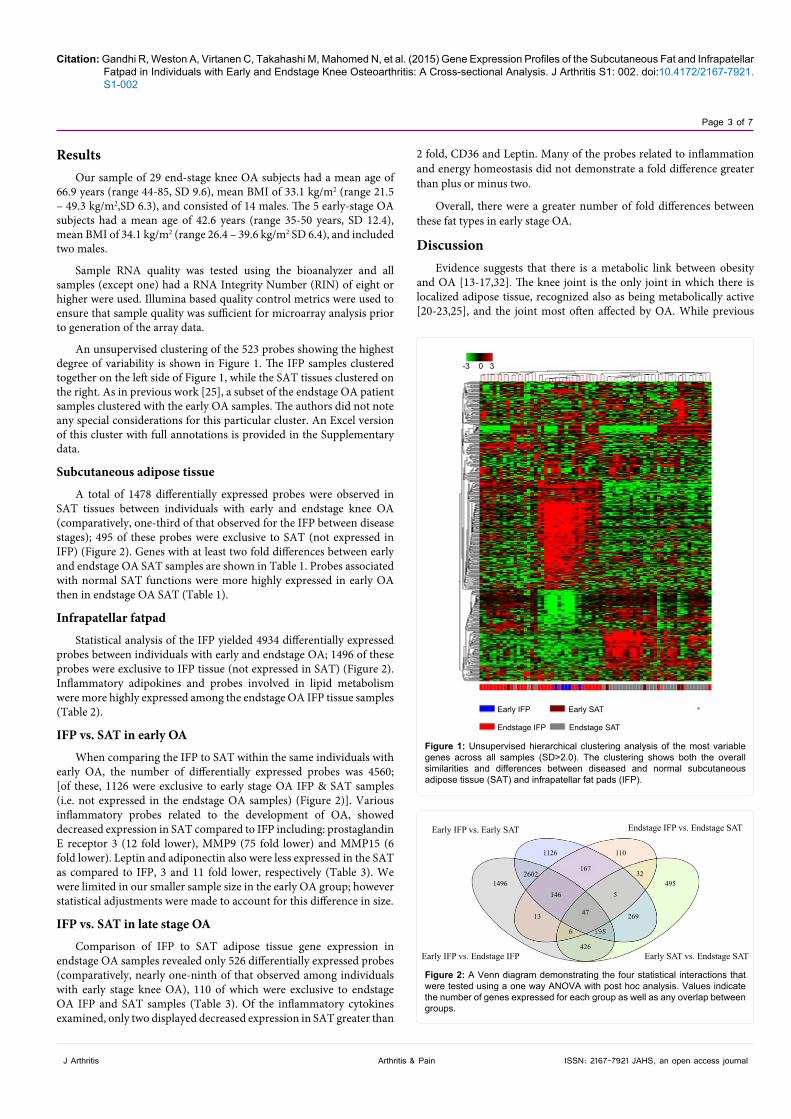
An unsupervised clustering of the 523 probes showing the highest degree of variability is shown in Figure 1. The IFP samples clustered together on the left side of Figure 1, while the SAT tissues clustered on the right. As in previous work [25], a subset of the endstage OA patient samples clustered with the early OA samples. The authors did not note any special considerations for this particular cluster. An Excel version of this cluster with full annotations is provided in the Supplementary data.
Subcutaneous adipose tissue
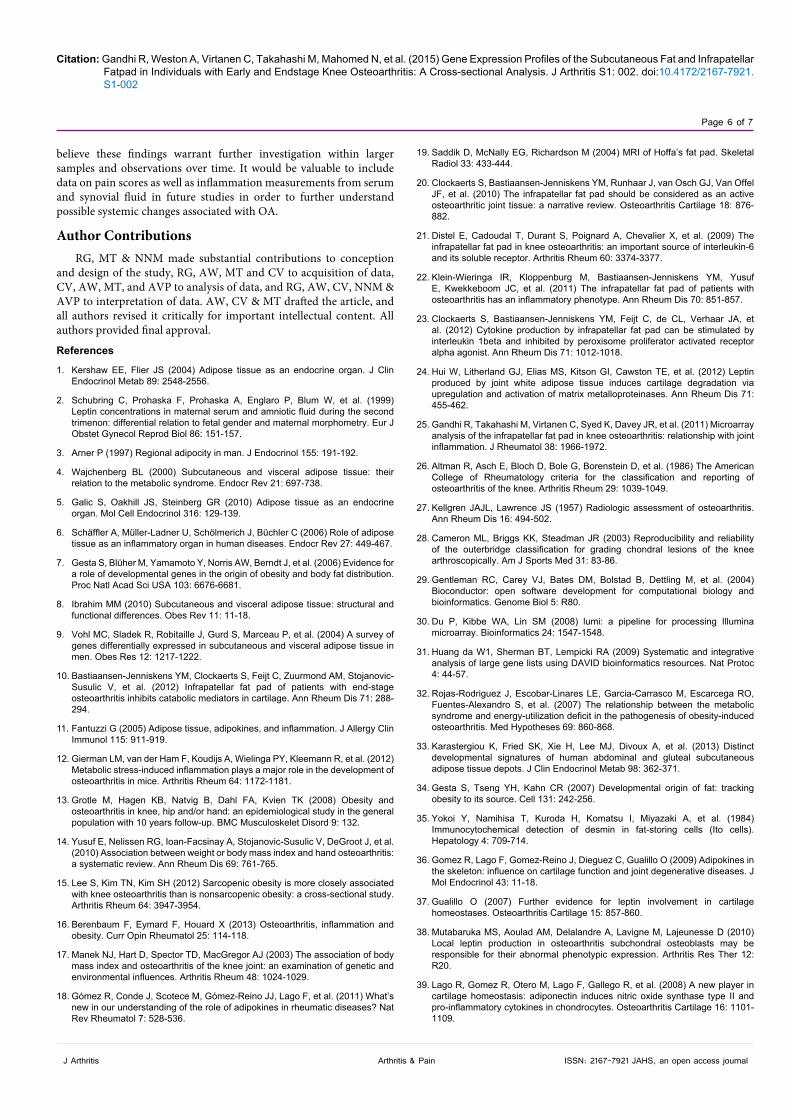
A total of 1478 differentially expressed probes were observed in SAT tissues between individuals with early and endstage knee OA (comparatively, one-third of that observed for the IFP between disease stages); 495 of these probes were exclusive to SAT (not expressed in IFP) (Figure 2). Genes with at least two fold differences between early and endstage OA SAT samples are shown in Table 1. Probes associated with normal SAT functions were more highly expressed in early OA then in endstage OA SAT (Table 1).
Infrapatellar fatpad
Statistical analysis of the IFP yielded 4934 differentially expressed probes between individuals with early and endstage OA; 1496 of these probes were exclusive to IFP tissue (not expressed in SAT) (Figure 2). Inflammatory adipokines and probes involved in lipid metabolism were more highly expressed among the endstage OA IFP tissue samples (Table 2).
IFP vs. SAT in early OA
When comparing the IFP to SAT within the same individuals with early OA, the number of differentially expressed probes was 4560; [of these, 1126 were exclusive to early stage OA IFP & SAT samples (i.e. not expressed in the endstage OA samples) (Figure 2)]. Various inflammatory probes related to the development of OA, showed decreased expression in SAT compared to IFP including: prostaglandin E receptor 3 (12 fold lower), MMP9 (75 fold lower) and MMP15 (6 fold lower). Leptin and adiponectin also were less expressed in the SAT as compared to IFP, 3 and 11 fold lower, respectively (Table 3). We were limited in our smaller sample size in the early OA group; however statistical adjustments were made to account for this difference in size.
IFP vs. SAT in late stage OA
Comparison of IFP to SAT adipose tissue gene expression in endstage OA samples revealed only 526 differentially expressed probes (comparatively, nearly one-ninth of that observed among individuals with early stage knee OA), 110 of which were exclusive to endstage OA IFP and SAT samples (Table 3). Of the inflammatory cytokines examined, only two displayed decreased expression in SAT greater than
-3 0 3
Early IFP
Endstage IFP
Early SAT
Endstage SAT
Figure 1: Unsupervised hierarchical clustering analysis of the most variable genes across all samples (SD>2.0). The clustering shows both the overall similarities and differences between diseased and normal subcutaneous adipose tissue (SAT) and infrapatellar fat pads (IFP).
Early IFP vs. Early SAT
1496
1126
2602
110
167
146
47
5
32495
269
426
6
13
Early IFP vs. Endstage IFP Early SAT vs. Endstage SAT
Endstage IFP vs. Endstage SAT
Figure 2: A Venn diagram demonstrating the four statistical interactions that were tested using a one way ANOVA with post hoc analysis. Values indicate the number of genes expressed for each group as well as any overlap between groups.

Citation: Gandhi R, Weston A, Virtanen C, Takahashi M, Mahomed N, et al. (2015) Gene Expression Profiles of the Subcutaneous Fat and Infrapatellar Fatpad in Individuals with Early and Endstage Knee Osteoarthritis: A Cross-sectional Analysis. J Arthritis S1: 002. doi:10.4172/2167-7921.S1-002
Page 4 of 7
J Arthritis ISSN: 2167-7921 JAHS, an open access journal Arthritis & Pain
work has shown differences in IFP gene expression between early and endstage knee OA [21,25], it is unknown whether difference in gene expression in fat tissue is localized to the joint. This study comparatively assessed the differences in SAT (in the vicinity of the knee joint) gene expression between early and endstage knee OA patients against the gene expression differences of SAT and previous analyzed IFP within the same patients. This novel dataset builds on our previous research of the IFP by providing a whole analysis (rather than two parts) including early and endstage data from both IFP and SAT. The analysis focused on four interactions, with comparisons across and within disease stages. A pathway-based analysis was completed using DAVID and is attached as supplementary data.
Differences observed in gene expression of SAT between disease stages were substantially smaller as compared to differences in IFP (i.e. one-third as many). Although the expression profile of SAT may vary
between certain deposit sites in the body [33], our study observed a larger gene expression difference in early versus endstage OA samples. It is difficult to say whether these changes could be localized or systemic. Early-stage OA SAT samples demonstrated a similar gene expression profile as that of “normal” fat. For example, probes such as collagen type 6 alpha 2 and 5 as well as desmin was more highly expressed (2, 3, and 23 fold respectively) in early stage samples. Collagen type 6 is commonly found in SAT [34], while desmin is a protein that is found to be highly expressed in normal smooth muscle and fat storing cells [35].
Differences in IFP gene expression found between the current early and late stage knee OA samples were in general consistent with previously reported work, minor changes reflect the new analysis performed which also included the SAT early vs. late samples [25]. Adipokines related to inflammation, such as leptin, adiponectin, and prostaglandin E receptor 3, tended to be more highly expressed in the
Probes Absolute Fold Difference RegulationADAM metallopeptidase domain 19 (ADAM19) 2.3 downCollagen, type VI, alpha 2 (COL6A2) 2.2 downCollagen, type VI, alpha 5 (COL4A5) 2.7 downContactin 1 (CNTN1) 6.0 downDesmin (DES) 23.5 downKiller cell lectin-like receptor subfamily C, member 1 (KLRC1) 4.1 downMatrix metallopeptidase 25 (MMP25) 6.1 downComplement regulatory protein (CD46) 2.3 upMatrix metallopeptidase 12 (macrophage elastase) (MMP12) 3.8 up
Table 1: Absolute fold differences in early versus endstage osteoarthritis in subcutaneous adipose tissue (SAT).
Probes Absolute Fold Difference RegulationADAM metallopeptidase domain 10 (ADAM10) 2.6 downADAM metallopeptidase domain 9 (ADAM9) 3.7 downADAM metallopeptidase with thrombospondin type 1 motif, 19 (ADAMTS19) 4.4 downADAM metallopeptidase with thrombospondin type 1 motif, 6 (ADAMTS6) 6.2 downADAM metallopeptidase with thrombospondin type 1 motif, 7 (ADAMTS7) 5.0 downADAMTS-like 2 (ADAMTSL2) 5.4 downADAMTS-like 4 (ADAMTSL4) 2.2 downCollagen, type III, alpha 1 (COL3A1) 2.3 downConnective tissue growth factor (CTGF) 3.1 downInterleukin 6 receptor (IL6R) 4.8 downMatrix metallopeptidase 17 (MMP17) 4.4 downMatrix metallopeptidase 20 (MMP20) 3.2 downADAM metallopeptidase domain 21 (ADAM21) 4.8 upAdiponectin (ADIPOQ) 10.0 upCD36 molecule (thrombospondin receptor) (CD36) 3.3 upCell death-inducing DFFA-like effector a (CIDEA) 6.4 upCell death-inducing DFFA-like effector c (CIDEC) 4.9 upFatty acid binding protein 4, adipocyte (FABP4) 2.8 upFatty acid binding protein 5 (psoriasis-associated) (FABP5) 3.5 upLeptin 2.8 upLeptin Receptor (Lep-R) 9.2 upLipoprotein lipase (LPL) 4.5 upMatrix metallopeptidase 15 (MMP15) 6.2 upMatrix metallopeptidase 28 (MMP28) 3.2 upMatrix metallopeptidase 9 (MMP9) 16.5 upPeroxisome proliferator-activated receptor gamma (PPARG) 3.7 upPhosphoenolpyruvate carboxykinase 1 (PEPCK) 5.9 upProstaglandin E receptor 3 (PTGER3) 10.1 up
Table 2: Absolute fold differences from early to endstage osteoarthritis in infrapatellar fat pad (IFP).

Citation: Gandhi R, Weston A, Virtanen C, Takahashi M, Mahomed N, et al. (2015) Gene Expression Profiles of the Subcutaneous Fat and Infrapatellar Fatpad in Individuals with Early and Endstage Knee Osteoarthritis: A Cross-sectional Analysis. J Arthritis S1: 002. doi:10.4172/2167-7921.S1-002
Page 5 of 7
J Arthritis ISSN: 2167-7921 JAHS, an open access journal Arthritis & Pain
IFP tissue from endstage knee OA patients compared to early knee OA. A greater expression of adipokines such as adiponectin, for example, have been shown to increase levels of matrix metalloproteases (MMPs) [36-38] creating a pro-inflammatory reaction; MMP9 showed a 16.5 fold increase of expression in the endstage IFP samples.
A significant number of differences were observed in the gene expression between IFP and SAT gene expression among those with early stage OA. Several MMPs were more highly expressed in the IFP samples. For example, MMP9 had a75 fold greater expression in the IFP tissue as compared to SAT. MMPs are commonly linked to an increase in adiponectin (11 fold increased expression in IFP) which contributes to an overall inflammatory state that may ultimately disrupt matrix remodelling processes [39,40]. CD36, a scavenger receptor often found on the cell surface of proteins, demonstrated a 7 fold decrease in expression from IFP compared to SAT. This molecule plays a role in fatty acid and glucose metabolism [25,41]. Overall, genes contributing to an increase in the inflammatory state more were highly differentially expressed in the IFP, as compared to SAT, among those with early OA. Whether changes in IFP expression precede OA changes, or vice versa, are unknown and could not be determined from this cross-sectional analysis. Nevertheless, there appears to be local metabolic activity associated with disease presence even at an ‘early’ stage.
Interestingly, when the same comparison between IFP and SAT was made among those with endstage knee OA, the number of expression differences was greatly reduced. Genes involved in fat metabolism and inflammatory processes for example, demonstrated differences of less
than two fold among those with endstage disease. Leptin and CD36, for example, showed only a two-fold difference (greater in the IFP), in contrast to the 3 and 7 fold difference, respectively, among those with early stage disease. Indeed, genes contributing to an inflammatory joint state were in general not highly differentially expressed between IFP and SAT among those with endstage OA, In other words, SAT gene expression was more similar to that of IFP among those with later stage disease. In the only other previous work comparing IFP to SAT fat samples, Distal et al. [21] studied differences in gene expression between IFP and SAT among individuals with endstage knee OA. Consistent with our findings, the authors reported that the majority of cytokines demonstrated similar expressions between the two adipose tissues, with only small fold increases in IL-6 and IL-6 receptor (2 to 3 fold) in IFP tissue and decreased expression of genes related to lipid metabolism in SAT.
Particularly for early stage OA, the generalizability of our findings is affected by the limited sample size. Nevertheless, we did detect significant differences with a very strict 5% false discovery rate. As well the sample size precluded an assessment stratified by BMI, which further research needs to consider. Our findings suggest that the effects of OA on the knee IFP are localized; more so with later disease stages and that SAT gene expression could be affected either locally or even systemically. However, given the cross sectional nature of the study, the evolution of changes and causation over time could not be assessed. Alternatively, whether this represents an overall loss of specialized functionality for the IFP in the presence of disease is unknown. We
IFP vs. SAT in Early OA IFP vs. SAT in Endstage OAProbe Fold change Regulation Fold Change Regulation
ADAM metallopeptidase domain 21 (ADAM21) 4.2 down * -Adiponectin (ADIPOQ) 11.4 down * -CD36 molecule (thrombospondin receptor) (CD36) 7.0 down 2.4 downCell death-inducing DFFA-like effector a (CIDEA) 7.2 down * -Cell death-inducing DFFA-like effector c (CIDEC) 16.4 down * -Fatty acid binding protein 4, adipocyte (FABP4) 3.0 down * -Fatty acid binding protein 5 (psoriasis-associated) (FABP5) 5.9 down * -Leptin 3.3 down 2.3 downLipoprotein lipase (LPL) 6.0 down * -Matrix metallopeptidase 9 (MMP9) 75.6 down * -Matrix metallopeptidase 12 (MMP12) 7.8 down * -Matrix metallopeptidase 15 (MMP15) 6.3 down * -Matrix metallopeptidase 25 (MMP25) 14.0 down * -Matrix metallopeptidase 27 (MMP27) 16.3 down * -Matrix metallopeptidase 28 (MMP28) 2.5 down * -Peroxisome proliferator-activated receptor gamma (PPARG) 4.9 down * -Prostaglandin E receptor 3 (subtype EP3) (PTGER3) 12.4 down * -ADAM metallopeptidase domain 9 (ADAM9) 3.7 up * -ADAM metallopeptidase with thrombospondin type 1 motif, 6 (ADAMTS6) 7.9 up * -
ADAM metallopeptidase with thrombospondin type 1 motif, 19 (ADAMTS19) 7.0 up * -
ADAMTS-like 1 (ADAMTSL1) 4.5 up * -ADAMTS-like 2 (ADAMTSL2) 6.0 up * -ADAMTS-like 4 (ADAMTSL4) 2.2 up * -Connective tissue growth factor (CTGF) 3.4 up * -Matrix metallopeptidase 1 (MMP1) 65.3 up * -Matrix metallopeptidase 20 (MMP20) 3.1 up * -
*Fold change less than ± 2
Table 3: Fold difference regulation in early and endstage osteoarthritis of infrapatellar fat pad (IFP) versus subcutaneous adipose tissue (SAT).
Citation: Gandhi R, Weston A, Virtanen C, Takahashi M, Mahomed N, et al. (2015) Gene Expression Profiles of the Subcutaneous Fat and Infrapatellar Fatpad in Individuals with Early and Endstage Knee Osteoarthritis: A Cross-sectional Analysis. J Arthritis S1: 002. doi:10.4172/2167-7921.S1-002
Page 6 of 7
J Arthritis ISSN: 2167-7921 JAHS, an open access journal Arthritis & Pain
believe these findings warrant further investigation within larger samples and observations over time. It would be valuable to include data on pain scores as well as inflammation measurements from serum and synovial fluid in future studies in order to further understand possible systemic changes associated with OA.
Author ContributionsRG, MT & NNM made substantial contributions to conception
and design of the study, RG, AW, MT and CV to acquisition of data, CV, AW, MT, and AVP to analysis of data, and RG, AW, CV, NNM & AVP to interpretation of data. AW, CV & MT drafted the article, and all authors revised it critically for important intellectual content. All authors provided final approval.
References
1. Kershaw EE, Flier JS (2004) Adipose tissue as an endocrine organ. J Clin Endocrinol Metab 89: 2548-2556.
2. Schubring C, Prohaska F, Prohaska A, Englaro P, Blum W, et al. (1999) Leptin concentrations in maternal serum and amniotic fluid during the second trimenon: differential relation to fetal gender and maternal morphometry. Eur J Obstet Gynecol Reprod Biol 86: 151-157.
3. Arner P (1997) Regional adipocity in man. J Endocrinol 155: 191-192.
4. Wajchenberg BL (2000) Subcutaneous and visceral adipose tissue: their relation to the metabolic syndrome. Endocr Rev 21: 697-738.
5. Galic S, Oakhill JS, Steinberg GR (2010) Adipose tissue as an endocrine organ. Mol Cell Endocrinol 316: 129-139.
6. Schäffler A, Müller-Ladner U, Schölmerich J, Büchler C (2006) Role of adipose tissue as an inflammatory organ in human diseases. Endocr Rev 27: 449-467.
7. Gesta S, Blüher M, Yamamoto Y, Norris AW, Berndt J, et al. (2006) Evidence for a role of developmental genes in the origin of obesity and body fat distribution. Proc Natl Acad Sci USA 103: 6676-6681.
8. Ibrahim MM (2010) Subcutaneous and visceral adipose tissue: structural and functional differences. Obes Rev 11: 11-18.
9. Vohl MC, Sladek R, Robitaille J, Gurd S, Marceau P, et al. (2004) A survey of genes differentially expressed in subcutaneous and visceral adipose tissue in men. Obes Res 12: 1217-1222.
10. Bastiaansen-Jenniskens YM, Clockaerts S, Feijt C, Zuurmond AM, Stojanovic-Susulic V, et al. (2012) Infrapatellar fat pad of patients with end-stage osteoarthritis inhibits catabolic mediators in cartilage. Ann Rheum Dis 71: 288-294.
11. Fantuzzi G (2005) Adipose tissue, adipokines, and inflammation. J Allergy Clin Immunol 115: 911-919.
12. Gierman LM, van der Ham F, Koudijs A, Wielinga PY, Kleemann R, et al. (2012) Metabolic stress-induced inflammation plays a major role in the development of osteoarthritis in mice. Arthritis Rheum 64: 1172-1181.
13. Grotle M, Hagen KB, Natvig B, Dahl FA, Kvien TK (2008) Obesity and osteoarthritis in knee, hip and/or hand: an epidemiological study in the general population with 10 years follow-up. BMC Musculoskelet Disord 9: 132.
14. Yusuf E, Nelissen RG, Ioan-Facsinay A, Stojanovic-Susulic V, DeGroot J, et al. (2010) Association between weight or body mass index and hand osteoarthritis: a systematic review. Ann Rheum Dis 69: 761-765.
15. Lee S, Kim TN, Kim SH (2012) Sarcopenic obesity is more closely associated with knee osteoarthritis than is nonsarcopenic obesity: a cross-sectional study. Arthritis Rheum 64: 3947-3954.
16. Berenbaum F, Eymard F, Houard X (2013) Osteoarthritis, inflammation and obesity. Curr Opin Rheumatol 25: 114-118.
17. Manek NJ, Hart D, Spector TD, MacGregor AJ (2003) The association of body mass index and osteoarthritis of the knee joint: an examination of genetic and environmental influences. Arthritis Rheum 48: 1024-1029.
18. Gómez R, Conde J, Scotece M, Gómez-Reino JJ, Lago F, et al. (2011) What’s new in our understanding of the role of adipokines in rheumatic diseases? Nat Rev Rheumatol 7: 528-536.
19. Saddik D, McNally EG, Richardson M (2004) MRI of Hoffa’s fat pad. Skeletal Radiol 33: 433-444.
20. Clockaerts S, Bastiaansen-Jenniskens YM, Runhaar J, van Osch GJ, Van Offel JF, et al. (2010) The infrapatellar fat pad should be considered as an active osteoarthritic joint tissue: a narrative review. Osteoarthritis Cartilage 18: 876-882.
21. Distel E, Cadoudal T, Durant S, Poignard A, Chevalier X, et al. (2009) The infrapatellar fat pad in knee osteoarthritis: an important source of interleukin-6 and its soluble receptor. Arthritis Rheum 60: 3374-3377.
22. Klein-Wieringa IR, Kloppenburg M, Bastiaansen-Jenniskens YM, Yusuf E, Kwekkeboom JC, et al. (2011) The infrapatellar fat pad of patients with osteoarthritis has an inflammatory phenotype. Ann Rheum Dis 70: 851-857.
23. Clockaerts S, Bastiaansen-Jenniskens YM, Feijt C, de CL, Verhaar JA, et al. (2012) Cytokine production by infrapatellar fat pad can be stimulated by interleukin 1beta and inhibited by peroxisome proliferator activated receptor alpha agonist. Ann Rheum Dis 71: 1012-1018.
24. Hui W, Litherland GJ, Elias MS, Kitson GI, Cawston TE, et al. (2012) Leptin produced by joint white adipose tissue induces cartilage degradation via upregulation and activation of matrix metalloproteinases. Ann Rheum Dis 71: 455-462.
25. Gandhi R, Takahashi M, Virtanen C, Syed K, Davey JR, et al. (2011) Microarray analysis of the infrapatellar fat pad in knee osteoarthritis: relationship with joint inflammation. J Rheumatol 38: 1966-1972.
26. Altman R, Asch E, Bloch D, Bole G, Borenstein D, et al. (1986) The American College of Rheumatology criteria for the classification and reporting of osteoarthritis of the knee. Arthritis Rheum 29: 1039-1049.
27. Kellgren JAJL, Lawrence JS (1957) Radiologic assessment of osteoarthritis. Ann Rheum Dis 16: 494-502.
28. Cameron ML, Briggs KK, Steadman JR (2003) Reproducibility and reliability of the outerbridge classification for grading chondral lesions of the knee arthroscopically. Am J Sports Med 31: 83-86.
29. Gentleman RC, Carey VJ, Bates DM, Bolstad B, Dettling M, et al. (2004) Bioconductor: open software development for computational biology and bioinformatics. Genome Biol 5: R80.
30. Du P, Kibbe WA, Lin SM (2008) lumi: a pipeline for processing Illumina microarray. Bioinformatics 24: 1547-1548.
31. Huang da W1, Sherman BT, Lempicki RA (2009) Systematic and integrative analysis of large gene lists using DAVID bioinformatics resources. Nat Protoc 4: 44-57.
32. Rojas-Rodriguez J, Escobar-Linares LE, Garcia-Carrasco M, Escarcega RO, Fuentes-Alexandro S, et al. (2007) The relationship between the metabolic syndrome and energy-utilization deficit in the pathogenesis of obesity-induced osteoarthritis. Med Hypotheses 69: 860-868.
33. Karastergiou K, Fried SK, Xie H, Lee MJ, Divoux A, et al. (2013) Distinct developmental signatures of human abdominal and gluteal subcutaneous adipose tissue depots. J Clin Endocrinol Metab 98: 362-371.
34. Gesta S, Tseng YH, Kahn CR (2007) Developmental origin of fat: tracking obesity to its source. Cell 131: 242-256.
35. Yokoi Y, Namihisa T, Kuroda H, Komatsu I, Miyazaki A, et al. (1984) Immunocytochemical detection of desmin in fat-storing cells (Ito cells). Hepatology 4: 709-714.
36. Gomez R, Lago F, Gomez-Reino J, Dieguez C, Gualillo O (2009) Adipokines in the skeleton: influence on cartilage function and joint degenerative diseases. J Mol Endocrinol 43: 11-18.
37. Gualillo O (2007) Further evidence for leptin involvement in cartilage homeostases. Osteoarthritis Cartilage 15: 857-860.
38. Mutabaruka MS, Aoulad AM, Delalandre A, Lavigne M, Lajeunesse D (2010) Local leptin production in osteoarthritis subchondral osteoblasts may be responsible for their abnormal phenotypic expression. Arthritis Res Ther 12: R20.
39. Lago R, Gomez R, Otero M, Lago F, Gallego R, et al. (2008) A new player in cartilage homeostasis: adiponectin induces nitric oxide synthase type II and pro-inflammatory cytokines in chondrocytes. Osteoarthritis Cartilage 16: 1101-1109.

Citation: Gandhi R, Weston A, Virtanen C, Takahashi M, Mahomed N, et al. (2015) Gene Expression Profiles of the Subcutaneous Fat and Infrapatellar Fatpad in Individuals with Early and Endstage Knee Osteoarthritis: A Cross-sectional Analysis. J Arthritis S1: 002. doi:10.4172/2167-7921.S1-002
Page 7 of 7
J Arthritis ISSN: 2167-7921 JAHS, an open access journal Arthritis & Pain
40. Murphy G, Knäuper V, Atkinson S, Butler G, English W, et al. (2002) Matrix metalloproteinases in arthritic disease. Arthritis Res 4 Suppl 3: S39-49.
41. Cecil DL, Appleton CT, Polewski MD, Mort JS, Schmidt AM, et al. (2009)
The pattern recognition receptor CD36 is a chondrocyte hypertrophy marker associated with suppression of catabolic responses and promotion of repair responses to inflammatory stimuli. J Immunol 182: 5024-5031.
Submit your next manuscript and get advantages of OMICS Group submissionsUnique features:
• Userfriendly/feasiblewebsite-translationofyourpaperto50world’sleadinglanguages• AudioVersionofpublishedpaper• Digitalarticlestoshareandexplore
Special features:
• 400OpenAccessJournals• 30,000editorialteam• 21daysrapidscholarlyreviewprocess• Quality,quickeditorial,peerreviewandpublicationprocessing• IndexingatPubMed(partial),Scopus,EBSCO,IndexCopernicusandGoogleScholaretc• SharingOption:SocialNetworkingEnabled• Authors,ReviewersandEditorsrewardedwithonlineScientificCredits• Betterdiscountforyoursubsequentarticles
Submityourmanuscriptat:www.omicsonline.org/submission
Citation: Gandhi R, Weston A, Virtanen C, Takahashi M, Mahomed N, et al. (2015) Gene Expression Profiles of the Subcutaneous Fat and Infrapatellar Fatpad in Individuals with Early and Endstage Knee Osteoarthritis: A Cross-sectional Analysis. J Arthritis S1: 002. doi:10.4172/2167-7921.S1-002
Thisarticlewasoriginallypublishedinaspecialissue,Arthritis & Pain handledbyEditor(s).Dr.RostyslavVBubnov,ClinicalHospitalPheophania