geely sweden ab annual report - volvo car group/media/files/v/volvo-cars-ir/result… · volvo car...
TRANSCRIPT

I
geely sweden ab
ANnUAL report
2013

geely sweden ab annual report 2013II
Read moreVisit Volvo Cars at www.volvocars.com and learn more about Volvo Cars’
products and services.
reports are available online at www.volvocars.com/corporate.
About This Reportthe board of directors geely sweden ab, corporate identity number
556798-9966, hereby submit the annual report and consolidated
financial statements for January 1 - december 31, 2013. the Volvo
Car group’s consolidated financial review comprises all information
through page 6 to 62.
this is Volvo Car group ................................................................................................................1
Volvo Cars – 2013 at a glance ...............................................................................................2
Ceo Comments ...................................................................................................................................4
Board of Directors Report ....................................................................................................6
Financial & business summary 2013 ......................................................................7
strategy .............................................................................................................................................8
products & Innovation ........................................................................................................10
production & operations .................................................................................................12
sales development ..............................................................................................................14
board of directors .................................................................................................................16
executive Management .....................................................................................................18
governance .................................................................................................................................20
risks & risk Management .............................................................................................20
subsequent events ..............................................................................................................21
proposed distribution of net income ....................................................................21
Financial Reports
Consolidated Income statements ............................................................................23
Consolidated Comprehensive Income ..................................................................23
Consolidated balance sheets .....................................................................................24
Changes in Consolidated equity ...............................................................................25
Consolidated statement of Cash Flows ..............................................................26
notes to the Consolidated Financial statements ........................................27
Income statements and Comprehensive Income – parent Company .................................................................................................................54
balance sheets – parent Company ........................................................................55
Changes in equity – parent Company ..................................................................56
statement of Cash Flows – parent Company .................................................56
notes to the parent Company Financial statements ...............................57
subsidiaries ................................................................................................................................60
signatures ....................................................................................................................................61
auditors report .......................................................................................................................62
Contact .............................................................................................................................................63
CONTENTS

geely sweden ab annual report 2013 1
Volvo Cars’ history dates back to 1927 when the swedish company
Volvo Car Corporation was founded and the first Volvo car was
launched. Volvo Cars is headquartered in gothenburg (sweden). Volvo
cars are produced in factories in torslanda (sweden), ghent (belgium),
Chengdu (China), Chonqing (China), and Kuala lumpur (Malaysia).
since 2010 Volvo Cars is owned by Zhejiang geely Holding group Co.
ltd. (geely). In 2013 around 2,300 Volvo dealers sold 427,840 cars in
100 countries around the world. as of december 2013, Volvo Car
group employed about 23,200 people.
The TRansFoRmaTion oF VolVo CaRsVolvo Cars is going through a major transformation in line with the
corporate and brand strategy “designed around you” which is all about
the customer and a human centric focus. designed around you is the
foundation of the corporate culture and the strategy sets the objectives
for Volvo Cars to establish itself as a leading brand within the premium
segment. with roots firmly based in its swedish heritage, China is
becoming the second home market of Volvo Cars with extensive com-
mercial and industrial presence. additionally, new vehicle and engine
technology will serve the global market and ensure a premium customer
experience based on safety, contemporary scandinavian design, envi-
ronmental care and clever functionality.
Corporate Objectives• provide cars people want
• be a lean and nimble company
• Have a top tier premium auto brand perception
• be the employer of choice
WhiCh Will leaD To• sales of over 800,000 vehicles globally
• top car industry profitability
Strategic CHANGE THEMES• emphasize profitability and efficiency
• revitalize the Volvo brand with customer centricity throughout
the value chain
• reinforce our product strengths based on focused innovation,
smart architecture and win-win collaboration
• Capture global growth and sourcing potential, leveraging the
presence in China
• secure profitable growth in core segments in europe and north
america
• build a global organization with performance and health, able to
act in a fast, smart and nimble way
This is Volvo Car Group
The Volvo Car Group – Corporate structure
VolVo CaR GRoup inCluDes:• geely sweden ab
• Volvo Car Corporation
• subsidiaries
• Joint venture companies
VolVo CaRs, The opeRaTions, inCluDes:• Volvo Car Corporation
• subsidiaries
• Joint venture companies
• affiliated companies
Joint venture companies are associated companies in which Volvo Car
Corporation holds a voting interest of less or equal to 50 percent.
affiliated companies are companies in close collaboration with Volvo
Car group but owned by another legal entity, for example the Chengdu
manufacturing plant, Zhongjia automobile Manufacturing (Chengdu)
Co., ltd., which is owned by Chinese subsidiaries of the parent
company, shanghai geely Zhaoyuan International Investment Co., ltd..
Zhejiang Geelyholding Group Co., ltd.
shanghai Geely Zhaoyuan international
investment Co., ltd.
Geely sweden holdings aB
Geely Sweden AB
Geely sweden automotive aB
affiliated companies
Volvo Car Group(Consolidation level of all financial communication)
Volvo Cars(the operations)
Volvo Car Corporation
all sales companies, other subsidiaries
& joint venture companies

geely sweden ab annual report 20132
In 2013, Volvo Cars continued its transformation journey and launched
the biggest renewal of the product line up in its history and launching
the new drive-e powertrains. Volvo Car group reported an operating in-
come of seK 1,919 (66) million, with a net income of seK 960 (–542)
million. the result was a step into reaching sustainable profitability
levels, primarily due to the positive second half year.
Volvo Car group managed to turn a loss over the first half of 2013
into a full-year profit due to a positive sales development and cost
focus. retail sales for 2013 was mainly driven by an increase in China
and reached about the same volumes as 2012. wholesale declined
during the first half year following the preparations for the launch of
the renewed models.
In 2013, Volvo Car group further strengthened its long term
funding structure via loan agreements with financial partners and
institutions.
a major renewal of the models was launched into markets around
the world. the first versions of Volvo Cars’ in-house developed, new
four-cylinder drive-e powertrain family were launched and new world-
first safety technologies such as Cyclist detection with full auto brake
were introduced in Volvo cars during 2013.
at the International Motor show (Iaa), in Frankfurt, the global audi-
ence caught a glimpse at what the future holds with the launch of the
Volvo Car Concept Coupé. the concept car was the first of three con-
cept cars showing Volvo Cars’ new design strategy and the possibilities
of Volvo Cars’ in-house developed platform, the new scalable product
architecture (spa). the second concept car, the Volvo Concept XC
Coupé, was previewed in late december ahead of its reveal at the
detroit auto show in early 2014. throughout 2013, the development
of the all-new Volvo XC90, the first car to be based on the scalable
product architecture, continued and is scheduled for a global launch
in 2014.
the industrial expansion in China, financed by geely, is progress-
ing according to plan with the two joint venture companies in daqing
and Zhangjiakou and the plant in Chengdu which went operational in
november 2013.
Volvo cars–2013 at a glance
Key Figures
2013 2012
retail sales 427,840 421,951
China 61,146 41,989
usa 61,233 68,079
eu 20 226,095 227,027
of which sweden 52,260 51,832
rest of world 79,366 84,856
wholesale 419,728 432,950
net revenue, MseK 122,245 124,547
operating income, MseK 1,919 66
net income, MseK 960 –542
operating & investing cash flow, MseK 21 –4,929
ebIt margin 1.6% 0.1%
ebItda, MseK 9,826 8,082
equity ratio 28.1% 28.5%
Average number of employees by region 2013
asia, 6.2%north and south america, 1.8%
sweden, 67.9%
europe excl nordic countries and belgium, 4.3%
belgium, 17.9%
other, 0.4%
nordic countries excl sweden 1.5%
Models by range 2013
s, 17.1%
V, 42.3%
XC, 37.9%
C, 2.7%
RETAIL Sales by region 2013
China, 14.3%
usa, 14.3%
eu20, 52.9%
rest of the world, 18.5%

geely sweden ab annual report 2013 3
• Launch of renewed model range in Geneva
• Launch of the world-first Cyclist Detection
• Improved funding
• Preview of Chinese manufacturing plant in Chengdu
• Start of production of renewed models
• 2013 Global NCAP Innovation Award
• World debut for Volvo Concept Coupé on IAA
• Self-parking car showcase
• Approved manufacturing license in China
• Start of production of Drive-E Powertrains
• Start of production of S60L in Chengdu
• Loan agreement with China Development Bank
Q1
Q2
Q3
Q4

geely sweden ab annual report 20134
2013 was a year of which we can be proud. We reported an oper-ating income of seK 1,919 million for the full year of 2013, which was a significant improvement from the loss of seK 577 million in the first half of the year. This is a good performance consider-ing our first half and i would like to thank all our employees who worked so hard to achieve this.
as I consider 2013, I would like to share some valuable observa-
tions I made during the year, as they feed directly into how Volvo Cars
will continue to develop and grow in 2014 and beyond.
the first observation is that our focus on cost in 2013 has been
an essential factor in returning to profitability. we need this work to
continue in order to improve efficiency and productivity. this focus on
costs needs to be a natural and ongoing part of our culture. stable
profitability is a prerequisite for our future growth and I would like to
emphasise that we will continue to focus on increasing revenues by
manufacturing premium cars. our strategy is one of growth.
sales in China increased to 61,146 cars a raise by 45.6 per cent
compared to 2012, driven by new products, increased marketing activi-
ties and the expansion of the Chinese dealer network.
It is apparent that China is a crucial market and that our position
with our owner is providing us with a deeper insight into the opportuni-
ties to be found in this huge market. this is illustrated by the start of
production at the manufacturing plant in Chengdu, China, in november.
additionally, the engine plant in the Zhangjiakou joint venture com-
menced production of Volvo engines. this rapid build-up would not
have been possible without support from our owner, geely.
last year, we made the largest renewal of the model range in Volvo
Cars’ history, which was an important factor behind the increase in
sales in europe during the second half of 2013, despite tough eco-
nomic conditions.
these developments highlight an important fact - there is a very
healthy appetite for new Volvo cars, which is reassuring considering
the strong pipeline of new models we plan to launch later this year and
thereafter.
this takes me to the united states, where Volvo Cars experienced
a challenging year. overall sales fell by 10.1 per cent to 61,233
cars compared to 2012, partly due to a narrow customer offer. with
new management in place in the us, new models on the way and a
renewed focus on the Volvo brand by our dealers, it is clear that we are
committed to the market. within a few years, we should have solidified
our position in the market and sell more than 100,000 cars in the
united states again.
Innovation remained central to our journey in 2013 and provided
some important insights into how we are going to develop in future.
Volvo Cars’ new, highly-efficient, four-cylinder engine family ‘drive-e’
was launched during the Frankfurt Motor show in september. drive-e
engines provide an exciting driving experience while at the same time
reducing fuel consumption and Co2 emissions. they will replace
all other Volvo engine families in the future and all are prepared for
electrification.
our drive-e engines are proof of the fact that the number of cylin-
ders no longer matters when the same power as a six or eight cylinder
engine can be derived from a four cylinder engine and at the same
time offer much lower emissions and much better fuel economy.
we are also committed to developing autonomous driving. In early
december, Volvo Cars and the swedish government announced a
world-first in autonomous driving. From now until 2017 we will work
towards having 100 self-driving Volvo cars use public roads in everyday
driving conditions around the swedish city of gothenburg, the world’s
first large-scale autonomous driving pilot project. autonomous drive
CEO comments
2013, % 2012, % Change, %-points
January–March 20.4 19.3 1.1
april–June 19.5 18.1 1.4
July–september 17.3 17.1 0.2
october–december 22.5 20.6 1.9
Full year 20.0 18.9 1.1
sweden market shareChina salesChina sales
0
10,000
20,000
30,000
40,000
50,000
60,000
70,000
10,8
81
2012 2013
Q1 Q2 Q3 Q4 Total
13,7
80
10,4
97
14,9
22
9,32
7
14,6
78
11,2
84 17,7
66
41,9
89
61,1
46
Cars

geely sweden ab annual report 2013 5
technologies are a major element in developing safer and more sus-
tainable cars, while these technologies also have many demonstrable
benefits in terms of efficiency and time management.
several Volvo models were recognized for their top safety levels in
2013, among others by the american Insurance Institute for Highway
safety (IIHs). we are committed to keep that position as industry
leader and we are moving ever closer to our safety Vision 2020, which
states that by 2020 no one should be killed or seriously injured in a
new Volvo car. the all-new XC90 that we launch later this year will
feature the first of several next-generation safety and driver support
systems.
Finally, I would like to provide a brief insight into the coming years
at Volvo Cars. the coming year will be a year of growth, with a good five
per cent increase in sales, characterised by a continued strong perfor-
mance in China and a recovery in the us, our two largest markets.
Volvo Cars will in 2014 and thereafter introduce new technologies,
a series of industry-leading innovations and launch the much-anticipat-
ed all-new XC90, the first car to be built on the company’s brand new,
in-house developed spa platform. It will be the first Volvo production
model to carry the company’s new design language, successfully
showcased in the critically-acclaimed Volvo concept cars. In China,
Volvo Cars will build on the successful sales performance in 2013
and aim to continue its growth momentum. the first full year of local
production of the s60l in the Chengdu manufacturing plant as well as
a further expansion of the dealer network should support Volvo Cars’
continued growth in China.
In the longer term, we will continue the transformation journey that we
embarked on in 2010, by launching more new Volvo cars based on
our in-house developed vehicle architectures, featuring cutting-edge
technologies and powered by our industry-leading family of four-
cylinder drive-e powertrains. by taking full control of our own product
development without the need for compromises, Volvo Cars will flourish
as an independent car manufacturer under solid ownership for many
years to come.
Much of the work that has been undertaken at Volvo Cars since
being acquired by geely in 2010 has been leading up to today. 2013
was an important step on this path, and it is essential that we do not
rest on our laurels. 2013 was very challenging and required hard work.
2014 will be equally challenging and will require equally hard work. yet
I am convinced that we have the right strategy and the right people to
take us forward.
gothenburg, april 24 2014
håkan samuelssonpresident & Ceo
Volvo Car group
geely sweden ab annual report 2013board of director’s report6
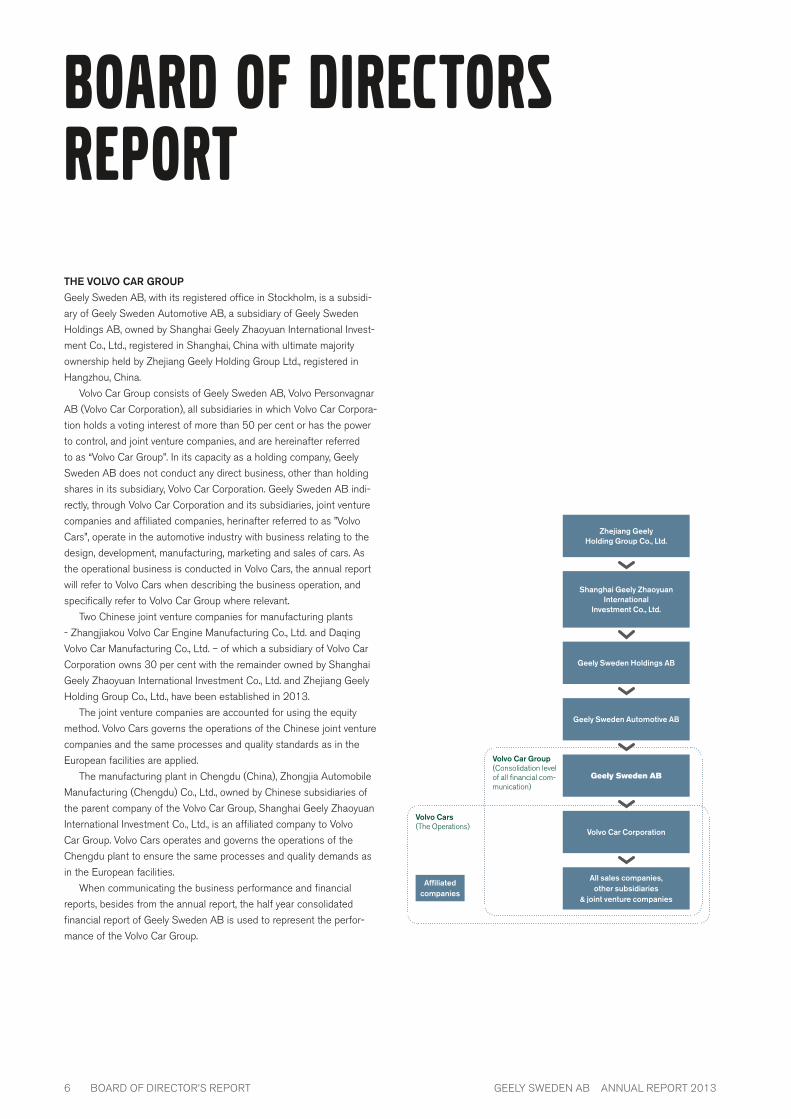
The VolVo Car Groupgeely sweden ab, with its registered office in stockholm, is a subsidi-
ary of geely sweden automotive ab, a subsidiary of geely sweden
Holdings ab, owned by shanghai geely Zhaoyuan international invest-
ment co., ltd., registered in shanghai, china with ultimate majority
ownership held by Zhejiang geely Holding group ltd., registered in
Hangzhou, china.
Volvo car group consists of geely sweden ab, Volvo personvagnar
ab (Volvo car corporation), all subsidiaries in which Volvo car corpora-
tion holds a voting interest of more than 50 per cent or has the power
to control, and joint venture companies, and are hereinafter referred
to as “Volvo car group”. in its capacity as a holding company, geely
sweden ab does not conduct any direct business, other than holding
shares in its subsidiary, Volvo car corporation. geely sweden ab indi-
rectly, through Volvo car corporation and its subsidiaries, joint venture
companies and affiliated companies, herinafter referred to as ”Volvo
cars”, operate in the automotive industry with business relating to the
design, development, manufacturing, marketing and sales of cars. as
the operational business is conducted in Volvo cars, the annual report
will refer to Volvo cars when describing the business operation, and
specifically refer to Volvo car group where relevant.
two chinese joint venture companies for manufacturing plants
- Zhangjiakou Volvo car engine Manufacturing co., ltd. and daqing
Volvo car Manufacturing co., ltd. – of which a subsidiary of Volvo car
corporation owns 30 per cent with the remainder owned by shanghai
geely Zhaoyuan international investment co., ltd. and Zhejiang geely
Holding group co., ltd., have been established in 2013.
the joint venture companies are accounted for using the equity
method. Volvo cars governs the operations of the chinese joint venture
companies and the same processes and quality standards as in the
european facilities are applied.
the manufacturing plant in chengdu (china), Zhongjia automobile
Manufacturing (chengdu) co., ltd., owned by chinese subsidiaries of
the parent company of the Volvo car group, shanghai geely Zhaoyuan
international investment co., ltd., is an affiliated company to Volvo
car group. Volvo cars operates and governs the operations of the
chengdu plant to ensure the same processes and quality demands as
in the european facilities.
when communicating the business performance and financial
reports, besides from the annual report, the half year consolidated
financial report of geely sweden ab is used to represent the perfor-
mance of the Volvo car group.
Board of Directors Report
Zhejiang Geelyholding Group Co., ltd.
Shanghai Geely Zhaoyuan International
Investment Co., ltd.
Geely Sweden holdings aB
Geely Sweden AB
Geely Sweden automotive aB
affiliated companies
Volvo Car Group(consolidation level of all financial com-munication)
Volvo Cars(the operations)
Volvo Car Corporation
all sales companies, other subsidiaries
& joint venture companies

board of director’s reportgeely sweden ab annual report 2013 7
financial & Business summary 2013
2013 was characterized by the introduction of the biggest renewal
programme in Volvo cars’ history. the first half of the year, dealer stock
reduction and phase out of the older models resulted in negative
wholesales in a year on year comparison. after launching the new
models, retail sales increased and reached about the same volumes in
2013 as in 2012, mainly driven by china. retail sales for Volvo cars
increased by 1.4 per cent to 427,840 (421,951) units.
InCome STaTemenTfor Volvo car group net revenue decreased by seK 2,302 million
to seK 122,245 (124,547) million, primarily due to lower wholesale
volumes and negative exchange rate development. gross income
increased by seK 364 million to seK 20,311 (19,947) million mainly
as a result of a positive market and carline mix as well as efficiencies
on material cost. expenses in research & development decreased by
seK 425 million to seK 5,864 (6,289) million. expenses in research &
development are the net of investments and capitalised product devel-
opment costs supporting the product strategy of Volvo cars. operating
margin increased to 1.6 per cent (0.1) following a small decrease of
administrative expenses to seK 5,129 (5,192) million and a decrease
of selling expenses to seK 7,919 (8,642) million. operating income
amounted to seK 1,919 million (66), and net income for the year was
seK 960 million (–542).
BalanCe SheeTintangible assets increased by seK 1,605 million to seK 17,271
(15,666) million linked to investments for spa and drive-e. accounts
receivable increased by seK 883 million to seK 5,618 (4,735) mil-
lion, mainly due to sales growth in china. trade payables increased by
seK 1,006 million which is related to higher production at the end of
2013 compared with the same period 2012. investments in associates
increased by seK 609 million to seK 1,159 million, corresponding to
the establishment of the joint venture companies in china.
total non-current liabilities amounted to seK 24,108 (21,073)
million. in line with the changed accounting principles under ias 19 on
employee benefits, the retirement benefit obligations have decreased
to seK 3,641 million and have been restated accordingly for 2012
to seK 5,492. the provision for post employee benefits was highly
affected by a change in the discount rate. the amendment in account-
ing principles stipulate that the decreased liabilities is to be offset in
the group´s equity and have resulted in a positive change in equity to
24,638 million, with 2012 restated equity value at seK 21,901 million.
during 2013 Volvo car group’s liabilities to financial institutions
increased by seK 5,486 million. in the first quarter, a loan from swed-
ish export credit of seK 1,000 million and the second tranche of eur
107 million of a china development bank (cdb) loan was drawn.
during the autumn, cdb and Volvo car corporation agreed upon a
second loan of usd 800 million of which usd 466 million was drawn
in the fourth quarter of 2013. a revolving credit facility with maturity in
2016 totalling eur 360 million was put into place during 2013, and
remained unutilized.
CaSh Flowcash flow from operating activities was positive with seK 8,861 (2,749)
million. this was seK 6,112 million higher than in 2012, mainly due to
the positive operating income and improved working capital develop-
ment.
investments, mainly on product development, have increased
compared to 2012. cash flow from investing activities was seK –8,840
(–7,678) million. cash flow from operating and investing activities
amounted to seK 21 (–4,929) million and with increased financing
activities throughout the year, cash flow for the period increased to
seK 5,786 (–4,473) million.
BuSIneSS Summaryin china, sales increased by 45.6 per cent compared to 2012 to
61,146 units (41,989). the european markets are still under the im-
pression of the debt crisis and sales for eu20 declined by 0.4 per cent
to 226,095 units (227,027). in the us, Volvo cars sales decreased
with 10.1 per cent to 61,233 (68,079) units.
in 2013, production of the new powertrains, drive-e, started in
skövde and the development of the new platform, scalable product
architecture (spa), continued. spa and drive-e are essential elements
of the transformation of the Volvo brand into a leading premium car
manufacturer with sustainable profitability. construction work continued
in the manufacturing operations, including the torslanda plant, to
prepare for the launch of spa in 2014.
the china expansion continued with the establishment of two joint
venture companies for manufacturing plants in 2013, Zhangjiakou Volvo
car engine Manufacturing co., ltd. and daqing Volvo car Manufactur-
ing co., ltd. of which a subsidiary of Volvo car corporation owns 30 per
cent with the remainder owned by shanghai geely Zhaoyuan interna-
tional investment co., ltd. and Zhejiang geely Holding group co., ltd..
in June 2013, production of the Volvo c70 convertible model at
the uddevalla plant in sweden ceased, and the property was subse-
quently sold.
Volvo car financial services is responsible for managing and devel-
oping the customer finance and insurance offering provided by Volvo
car’s on a global basis. during 2013, the new entity secured financing
for the majority of the new Volvo cars sold in the us. in most of the
larger markets, Volvo cars uses a branded financial and insurance of-
fering through Volvo cars partner banks and insurance companies.
1) eu20 includes sweden, norway, denmark, finland, the netherlands, belgium, luxemburg, france, spain, italy, greece, portugal, the uK, ireland, germany, switzerland, austria, poland, Hungary and the czech republic.

geely sweden ab annual report 2013board of director’s report8
Strategy
after being acquired by Zhejiang geely Holding group ltd., in 2010,
Volvo cars embarked on a new chapter in the company’s history. Volvo
cars started a transformation journey that will establish the company
as a top premium car manufacturer with a strong customer focus, an
independent company under solid and stable ownership and offering
world-class products that people want, based on in-house developed
technology.
Volvo cars’ corporate strategy, designed around you, is based on
the human centric focus that differentiate the brand from other car
companies. the strategy states clear and ambitious objectives and un-
derlines Volvo cars’ commitment of taking control of its future product
development with an in-house developed scalable platform and a new
modular powertrain family. Volvo cars has also set out to leverage its
existing fundamental brand pillars: intuitive innovations, safety, environ-
mental performance and scandinavian design. the long term strategy
which will lead to sales of 800,000 vehicles annually, combined with a
sustainable profitability will be achieved by focusing on the key regions
europe, china and the us.
ReseaRch & development – technological independenceVolvo cars is currently in the process of moving towards technology
independence. since 2010, Volvo cars has been gradually moving
from ford legacy technology to technology developed in-house, based
on Volvo cars’ own prerequisites and without the need for compromise.
this does not just apply to technology completely developed by Volvo
cars, like the spa vehicle architecture or the drive-e engine family,
but also to technology developed through smart collaborations within
geely. an example is the vehicle architecture for future c-segment
cars currently developed by china euro Vehicle technology (ceVt ) in
gothenburg. while the c-segment architecture will serve both future
Volvo and geely automobile cars, the modular nature of the architec-
ture allows for specific solutions that will fulfil the requirements of each
brand, while at the same time, offering economies of scale.
china gRowth planan important element of Volvo cars’ new corporate strategy is the es-
tablishment of china as one of the company’s key markets and setting
up a local headquarter in shanghai.
in order to support the long-term goal of selling 200,000 cars per
year in china, Volvo cars has established a manufacturing footprint
in china. the first plant in china was opened in chengdu in the sum-
mer of 2013, with series production starting in the fourth quarter.
Volvo cars also operates through the newly established joint venture
companies an engine assembly plant in Zhangjiakou, while a second
manufacturing plant is under construction in daqing.
Volvo cars has established a solid dealer network in all major cities
in china. currently the focus is on expanding the network in china’s
smaller cities, many of which represent completely new regional
markets for Volvo cars. in its marketing activities, Volvo cars under-
lines its scandinavian heritage and its leadership in automotive safety.
• Division to stand alone
• Become a leading global premium auto brand
• Independent development of a modular product technology: scalable product architecture
• Independent development of powertrains: drive-e
• China industrial footprint
• Employee culture change: Aspired Culture
the start of the Journey
• Launch of model year 2014, the most extensive renewal of the model range in Volvo cars’ history
• Production and launch of a in-house developed powertrain: drive-e
• Production start in Chengdu
• Launch of a new design strategy: concept coupé
where are we today?
a leading premium brand
2010
2013
2020

board of director’s reportgeely sweden ab annual report 2013 9
Volvo cars also highlights the premium car experience and intuitive
functionality ingrained in its cars and uses its comparative advantage in
areas like cabin-air quality and safety to appeal to chinese consumers
concerned about pollution and the well-being of their families.
FInanCIal STraTeGyVolvo cars long-term objective is to deliver sustainable top car industry
profitability. Volvo cars will continue to invest in new technology and
car models that enable the long term objectives. investments are not
the sole driver behind sustainable growth as focus on cost control
throughout the whole value chain will continue. diversified financing
is important to achieve low financing cost and sustainable financial
partnerships, as well as independence. conservative financial policies
and focused risk management are applied to deliver on the objective of
having a financial risk profile and capital structure that enables invest-
ment grade rating.
SuSTaInaBIlITy, SaFeTy and qualITyVolvo cars’ commitment to the environment covers the entire lifecycle
of the car, from design, engineering and production to useful life, ser-
vice and recycling. sustainability is central to all decisions and invest-
ments; it is key to successful and ethical business. the sustainability
agenda for Volvo cars is described in four dimensions: people, societal,
economic and environmental. together, these four dimensions cover
the work towards a future sustainable mobility.
Volvo cars has a longstanding commitment to being a responsible
corporation with a clear focus on sustainable development through-
out the entire value chain. Volvo cars publishes annual sustainability
reports in line with the international reporting guidelines of the global
reporting initiative (gri).
Volvo cars is committed to developing new technologies that help
create sustainable mobility solutions for the 21st century. both the
spa platform and the drive-e powertrains are prepared for electri-
fication and Volvo cars is a leading actor in bringing electrification
technologies to market, with the V60 plug-in Hybrid being a prominent
example. by coupling the four-cylinder drive-e engines to electrifica-
tion technology, Volvo cars delivers a range of smaller, more intelligent
powertrains that provide performance levels comparable to that of a
larger combustion engine, while at the same time reducing fuel con-
sumption and co2 emissions.
Volvo cars is the leader in automotive safety and remains at the
vanguard of innovation in safety solutions. the company continues to
introduce world-first technologies in automotive safety and con-
stantly pushes boundaries in the journey towards its safety Vision
2020, which states that by 2020 no one should be killed or seriously
injured in a new Volvo. a major element in developing safer and more
sustainable mobility solutions is autonomous drive technologies, which
have many noticeable benefits in terms of safety, efficiency and time
management.
the manufacturing strategy is focusing on four areas: responsive
Manufacturing structure, best practice china ramp-up, world class
new Model introduction and productivity step change & operational
excellence. in line with the strategy, the manufacturing department
also simplified the production system, which will be focused around five
principles: teamwork with involvement, stability through standardisation,
right from me, demand driven flow and continuous improvements.
since 1998 Volvo car corporation has an environmental product
declaration. all businesses have permits covering their operations and
the environmental impact of noise, emissions to air and water, waste
produced and the consumption of energy and chemicals. declaration is
made continuously to both local and national environmental authorities.
all manufacturing operations in which Volvo cars are built have to
comply with the Volvo cars global environmental standard (Vcges).
the Vcges sets standards in a whole range of areas, varying from
waste water treatment over emissions from the paint operations, to
energy consumption and energy efficiency. Vcges is very strict and
puts high demands on Volvo manufacturing sites. therefore the plants
must perform better than what is legally required. the Vcges is also
an important tool in reaching the desired states in the Volvo car group
environmental strategy.
Volvo cars’ global quality standards consist of an extensive series
of requirements processes and demands that ensure that each car
leaving a Volvo plant is of the highest quality. this approach is followed
throughout the whole industrial cycle: from stringent demands on ma-
terials and parts delivered by suppliers to strict controls throughout the
manufacturing process, to extensive quality checks after final assembly.
peopleVolvo cars has a clear vision: to be the world’s most progressive and
desired premium car brand. to reach this - it needs talented people.
that is why Volvo cars has made it a strategic objective to become an
employer of choice that manages to attract the best people available.
when the corporate strategy was formulated, the company decided to
build a global organisation based on a balance between performance
and health. Volvo cars define health as the ability to align, execute
and renew itself faster than its competition. the balance between
performance and health will improve results, credibility and Volvo cars
attractiveness as an employer. the Volvo cars culture is the true ena-
bler to reach these objectives, it is expressed by three cultural values
that all employees live by: passion for customers and cars, Move fast,
aim High and challenge & respect.
since becoming a stand-alone company in 2010, Volvo cars has
made good progress towards its objective to become an employer of
choice. both, in 2012 and 2013, Volvo cars has been listed on the
universum list of the world’s most attractive employers, in which stu-
dents around the globe are asked about their ideal employers. in 2013,
Volvo cars was ranked 49th on the list of most attractive companies
among engineering students in the world’s twelve largest economies.
building a global organisation with performance and health and the
ability to act in a smart and nimble way is the essence of Volvo cars’
people strategy. another important element of becoming and being
an employer of choice is to ensure sustainable profitability. by being
consistently profitable through steady growth and under solid owner-
ship, Volvo cars ensures stability and creates new job opportunities in
the regions it operates.

geely sweden ab annual report 2013board of director’s report10
Products & Innovation– a 2013 review
new produCT launCheS – 2013at the geneva Motor show in March, Volvo cars showed no less than
six renewed cars to the world: a major renewal of the s60, V60, Xc60,
V70, Xc70 and s80 made their world debut in geneva. the new model
range constituted the most extensive development of existing models
in Volvo cars’ history.
part of the launch was a world-first in automotive safety: a technol-
ogy that detects and automatically brakes for cyclists swerving out
in front of the car. the new functionality was an enhancement of the
existing detection and auto brake technology.
another feature launched was the innovative permanent high beam
functionality called active High beam control. the system makes driv-
ing in the dark safer and more comfortable by enabling drivers to use
the high beam continuously, thanks to an ingenious mechanism that
prevents dazzling of oncoming drivers by shading out only as much of
the beam as necessary.
in 2013, Volvo cars also launched its new sensus connect info-
tainment and connectivity system. the existing user interface called
sensus was extended with the option to add intuitive all-new technol-
ogy that enables connectivity and internet in the car. drivers go online
either via a car-mounted 3g/4g dongle or a personal mobile phone.
the system also has a voice-activation system, while it is also possible
to share a wifi network with everyone in the car.
drive-e powertrainsthe drive-e powertrains, showcased during the iaa in september are
available in petrol and diesel versions and are currently offered in six
Volvo models, with a further roll-out planned for 2014. among the first
drive-e engines on the market was the t6 with 306 horse powers
(hp) and the new 8-speed automatic, which made the s60 t6 the first
car in its segment to deliver over two horsepower per gram co2 from
a combustion engine only. another notable drive-e variant is the d4,
which in an s60 makes it the first car in the premium d-segment with
co2 emissions under 100 g/km, delivering 181 hp.
new design language and Spa possibilities showcased in Volvo Concept Coupéalso making its world debut in frankfurt was the Volvo concept coupé,
the first of three concept cars to showcase Volvo cars’ new design di-
rection and to demonstrate the capabilities of the company’s in-house
developed scalable product architecture (spa), on which the first
new model to be launched is the all-new Xc90 in 2014. inspired by
contemporary, progressive scandinavian lifestyle and design as well as
iconic elements from the past, both the first and the second concept
car - the Volvo Xc concept coupé, shown in detroit in January 2014
- generated a lot of positive attention in the media and won several
awards.
the concept car also includes a new approach to Volvo cars’ human-
centric user experience. a large portrait touch-screen in the centre
console interacts with an adaptive digital display and head-up display
in front of the driver. the petrol plug-in hybrid driveline in the Volvo
concept coupé reflects Volvo cars’ strategy to use electrification to
create the most powerful versions in the new four-cylinder drive-e
engine family.
InnoVaTIon and nexT GeneraTIon TeChnoloGy – 2013 next-generation safety and support featuresduring a media event in July, Volvo cars demonstrated a number of
user-friendly safety and support technologies that will be introduced in
the all-new Volvo Xc90. among the technologies shown was pedes-
trian detection in darkness, which makes the detection and braking
for other vehicles, pedestrians and cyclists work effectively also when
driving in dusk or at night.
the all-new Xc90 can also be equipped with adaptive cruise con-
trol with steering assistance. the feature helps the driver stay in the
lane and follow the rhythm of the traffic by automatically following the
vehicle ahead. road edge and barrier detection, also with steer assist,
will be introduced in future models produced on the spa platform.
‘drive me’ – Self-driving cars for sustainable mobilityVolvo cars publicly demonstrated an ingenious autonomous parking
concept during the summer 2013. the smart, driverless car parks by
itself as well as interacts safely with other cars and pedestrians in the
car park. the autonomous parking technology will be part of the ‘drive
Me’ autonomous driving pilot project that takes place in gothenburg in
2017, which was announced in early december 2013. ‘drive Me’ is a
joint initiative between Volvo cars and swedish government authorities,
in which 100 self-driving Volvo cars will use public roads in everyday
driving conditions, in what will be the world’s first large-scale autono-
mous driving pilot project.
the aim with the pilot project is to acquire a deep and broad
understanding of the requirements of autonomous driving in rela-
tion to infrastructure, driver interaction and how other drivers react on
autonomous cars. this unique collaboration between authorities and
industry, positions sweden and Volvo cars as leaders in the develop-
ment of future mobility.
new experimental electrification technologiesthroughout 2013, Volvo cars worked with a number of experiments in
the field of electrification, as part of the company’s constant drive to
further develop its electrification technologies. one example is Volvo
cars’ participation in an advanced research project studying the possi-
bilities of inductive, cordless charging for electric vehicles. the results,
published in october, showed that this technology for transferring
board of director’s reportgeely sweden ab annual report 2013 11
energy via an electromagnetic field has a promising future. a Volvo
c30 electric test car could be fully charged in around 2.5 hours, by
placing the car on top of an electromagnetic field in a charging base
station.
in another project, Volvo engineers developed a revolutionary con-
cept for lightweight structural energy storage components that could
improve the energy usage of future electrified vehicles. the mate-
rial, consisting of carbon fibres, nanostructured batteries and super
capacitors, offers lighter energy storage that requires less space in the
car, cost effective structure options and is eco-friendly. the research
project took place over 3.5 years and resulted in energy-storing car
panels on a Volvo s80 experimental car.
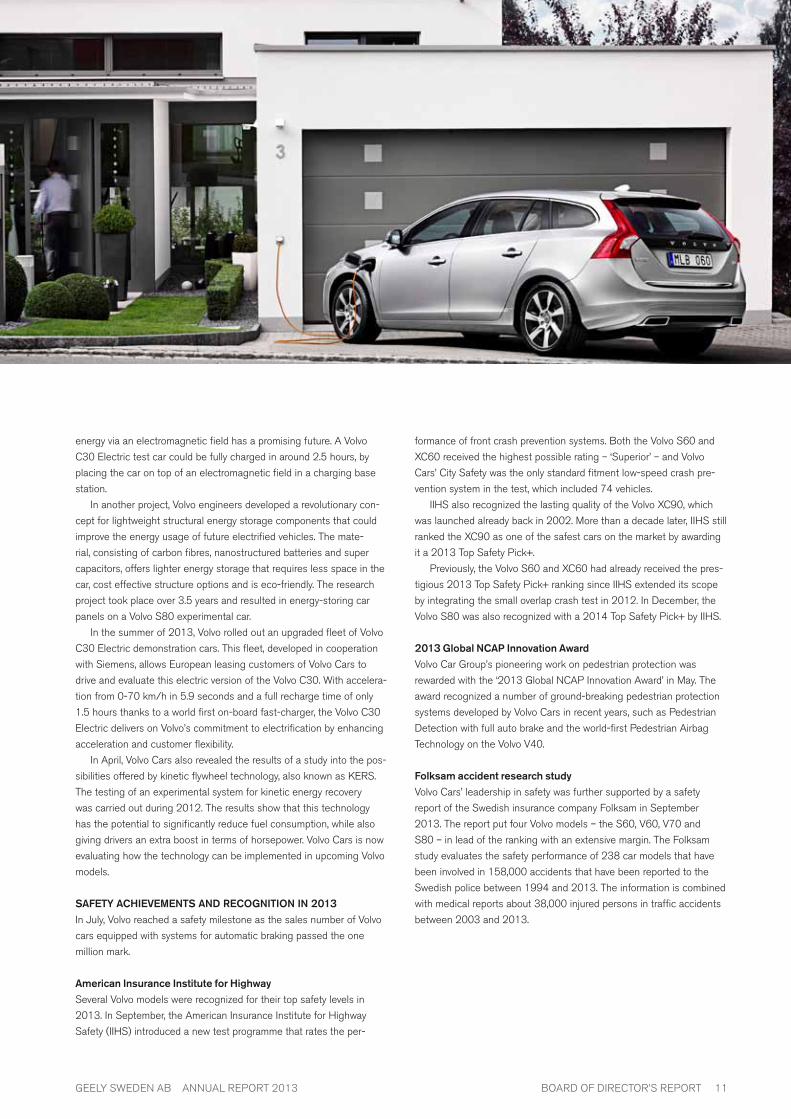
in the summer of 2013, Volvo rolled out an upgraded fleet of Volvo
c30 electric demonstration cars. this fleet, developed in cooperation
with siemens, allows european leasing customers of Volvo cars to
drive and evaluate this electric version of the Volvo c30. with accelera-
tion from 0-70 km/h in 5.9 seconds and a full recharge time of only
1.5 hours thanks to a world first on-board fast-charger, the Volvo c30
electric delivers on Volvo’s commitment to electrification by enhancing
acceleration and customer flexibility.
in april, Volvo cars also revealed the results of a study into the pos-
sibilities offered by kinetic flywheel technology, also known as Kers.
the testing of an experimental system for kinetic energy recovery
was carried out during 2012. the results show that this technology
has the potential to significantly reduce fuel consumption, while also
giving drivers an extra boost in terms of horsepower. Volvo cars is now
evaluating how the technology can be implemented in upcoming Volvo
models.
SaFeTy aChIeVemenTS and reCoGnITIon In 2013in July, Volvo reached a safety milestone as the sales number of Volvo
cars equipped with systems for automatic braking passed the one
million mark.
american Insurance Institute for highwayseveral Volvo models were recognized for their top safety levels in
2013. in september, the american insurance institute for Highway
safety (iiHs) introduced a new test programme that rates the per-
formance of front crash prevention systems. both the Volvo s60 and
Xc60 received the highest possible rating – ‘superior’ – and Volvo
cars’ city safety was the only standard fitment low-speed crash pre-
vention system in the test, which included 74 vehicles.
iiHs also recognized the lasting quality of the Volvo Xc90, which
was launched already back in 2002. More than a decade later, iiHs still
ranked the Xc90 as one of the safest cars on the market by awarding
it a 2013 top safety pick+.
previously, the Volvo s60 and Xc60 had already received the pres-
tigious 2013 top safety pick+ ranking since iiHs extended its scope
by integrating the small overlap crash test in 2012. in december, the
Volvo s80 was also recognized with a 2014 top safety pick+ by iiHs.
2013 Global nCap Innovation award Volvo car group’s pioneering work on pedestrian protection was
rewarded with the ‘2013 global ncap innovation award’ in May. the
award recognized a number of ground-breaking pedestrian protection
systems developed by Volvo cars in recent years, such as pedestrian
detection with full auto brake and the world-first pedestrian airbag
technology on the Volvo V40.
Folksam accident research studyVolvo cars’ leadership in safety was further supported by a safety
report of the swedish insurance company folksam in september
2013. the report put four Volvo models – the s60, V60, V70 and
s80 – in lead of the ranking with an extensive margin. the folksam
study evaluates the safety performance of 238 car models that have
been involved in 158,000 accidents that have been reported to the
swedish police between 1994 and 2013. the information is combined
with medical reports about 38,000 injured persons in traffic accidents
between 2003 and 2013.

geely sweden ab annual report 2013board of director’s report12
ChIna: STarT oF VolVo produCTIon In ChenGduin november, series production of Volvo vehicles started at the geely
owned manufacturing plant in chengdu. the first car built in chengdu
is the Volvo s60l, a long wheel base version of the Volvo s60. the
start of production in the chengdu plant was an important milestone
in Volvo cars’ transformation journey and a further cornerstone in the
establishment of an industrial footprint in china.
in 2013, Volvo cars also started operations at the engine plant in
Zhangjiakou, while work on the establishment of the vehicle manufactur-
ing plant in daqing continued.
Sweden: Spa InVeSTmenTS, STarT oF produCTIon oF drIVe-e powerTraInSat the swedish operations in torslanda and olofström, work continued
to make the plants ready for the production of cars built on the spa
architecture. as part of the significant investments in the new spa and
drive-e projects that were announced late 2012, construction of a new
body shop in the torslanda vehicle plant in gothenburg, sweden was
completed during the second half of 2013. in May, Volvo cars’ engine
plant in skövde, sweden started the production of the company’s new,
in-house developed drive-e powertrain family. the new petrol and
diesel engines were introduced in a number of car lines in 2013 and
will be fully rolled out through 2015.
BelGIum: STronG year For GhenT planTin January, Volvo cars’ manufacturing plant in ghent, belgium celebrat-
ed a milestone as the plant’s fifth-millionth car rolled off the assembly
line. the ghent plant started operations in 1965 and currently employs
around 4,500 people. the fifth-millionth car was a diesel variant of the
successful Volvo V40. in total, Volvo car gent produced over 253,000
cars in 2013, with the majority being Xc60 and V40 models.
GloBal STandardS For SuSTaInaBle, hIGh-qualITy Car produCTIon all plants are following the global environmental standards set out in
the Volvo cars global environmental standard (Vcges). the waste
water treatment plant in chengdu is designed with both chemical and
biological treatment steps before the water is released to a municipal
waste water treatment facility. the Vcges also aims to reduce water
consumption and to implement a global water protection standard in
all plants. in terms of emissions to air, which are mostly caused by paint
operations, the chengdu plant is designed to perform better than the
average car factory in europe. the paint operations in the chengdu
plant are based on the use of mainly water-based paints and the state-
of-the-art paint application equipment used in torslanda and ghent.
Volvo cars strives to find a climate-neutral energy supply for all
its global operations and to continuously reduce the total energy
consumption. all the electricity used in the company’s european
operations is certified hydro- and wind-powered electricity. Volvo
cars has decades of experience of energy efficiency, such as energy
management, energy monitoring and lean energy principles which are
implemented in all plants.
in china, the supply of renewable energy is still under development,
but it is expected to grow strongly in the years to come. Volvo cars fol-
lows this development closely and aims to contribute to the shift from
traditional means of energy to renewable sources of energy.
Production & Operations
Production numbers per manufacturing/assembly site
Gothenburg Ghent Chengdu1) Uddevalla2) Chongqing3) Malaysia Total 2013 Total 2012
s40 – 6,507
s60/s60l 20,874 35,124 1,856 418 58,272 65,634
s80 7,565 225 7,790 11,549
s80l 3,752 3,752 5,529
V40 80,961 455 81,416 32,526
V40cc 24,138 167 24,305 2,579
V50 – 22,625
V60 56,568 415 56,983 55,161
V70 25,166 25,166 32,030
Xc60 113,056 569 113,625 113,252
Xc70 23,974 23,974 26,274
Xc90 23,491 180 23,671 29,841
c30 – 18,079
c70 4,059 4,059 7,811
Total 157,638 253,279 1,856 4,059 3,752 2,429 423,013 429,397
1) the manufacturing plant in chengdu (china) is owned by chinese subsidiaries of the parent company of the Volvo car group, shanghai geely Zhaoyuan international investment co., ltd.
2) the uddevalla plant was closed in June 2013.3) Manufacturing performed in a factory owned by changah automotive co ltd, ford Motor company and Mazda automotive co., ltd.

board of director’s reportgeely sweden ab annual report 2013 13
geely sweden ab annual report 2013board of director’s report14
Car InduSTry deVelopmenT Global car industry developmentoverall, global gross domestic product (gdp) growth stabilized at 2.5%
in 2013. growth in the us improved from 1.1% in the first quarter to
3.6% in the third – followed by a relapse in the fourth quarter because
of the temporary us government shutdown in october. overall, car
sales rebounded as the economy, job creation and housing markets
improved.
the positive global development was partly offset by another
weak year in europe. Most northern european markets saw feeble but
positive growth in 2013, whilst growth in all the southern european
economies was negative. one quarter of european pre-crisis car sales
volumes was lost between 2007 and 2013, with car sales during this
period virtually collapsing in the southern part of the continent. pre-
crisis volumes will not be reached for several years still. at the same
time, structural changes within the industry increase complexity further.
the overcapacity in europe is still unsolved with plant utilisation for
more than half of the top 100 plants below break-even; emerging mar-
ket demand now outstrips developed market demand and a changing
regulatory environment is placing additional cost on manufacturers.
in the bric countries, with the exception of russia, economic
growth either stabilized or increased. china’s economic growth hit a
low point of 6.1% in the first quarter and then accelerated to 9.1% in
the third quarter. chinese car sales continued to increase with sedan
models accounting for the main volumes but with sport utility vehicles
(suV) models showing the strongest growth..
Global trendsdemand for new cars in large developed markets such as the us
remains quite healthy, but the shift away from larger cars to smaller,
more fuel efficient models continues. this indicates that consumers
remain financially constrained and that fuel efficiency is becoming a
key factor when it comes to deciding which car to buy. at the same
time, consumers in larger emerging markets such as brazil, russia,
india and china are seeking bigger and more luxurious cars, especially
suVs. crucially, however, they are also demanding fuel efficiency and
environmental friendliness. Hybrid and electric cars are unlikely to
satisfy this demand in the short term and this has raised interest in
optimising and downsizing the internal combustion engine, possibly in
line with electrification.
outlookin china, growth will continue to develop strongly as increasing dispos-
able income makes cars affordable. in the long term, car sales in the
us are expected to be back at pre-crisis level by 2016, while europe
faces a new normal with car sales staying below pre-crisis levels for
the foreseeable future. the automotive industry has shown itself to
be resilient and open to change during economic uncertainty. but the
way in which it handles the twin pressure of economic and structural
change will define its longer term future.
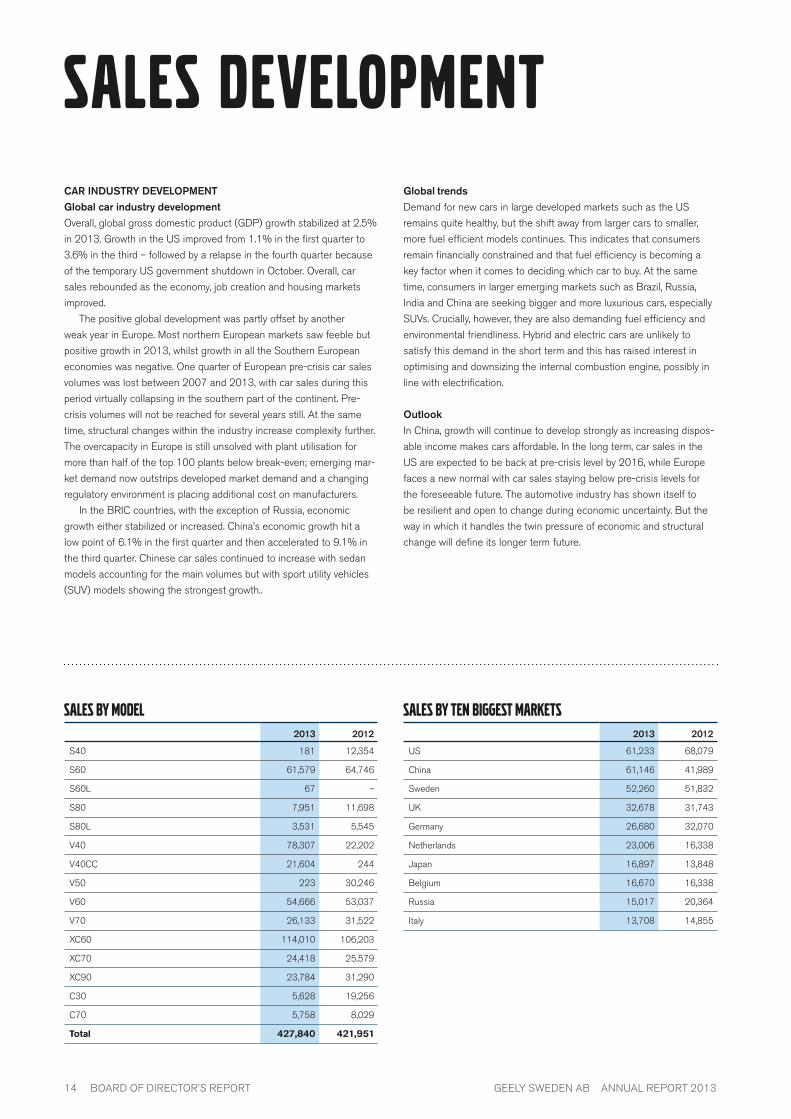
Sales Development
sales by model2013 2012
s40 181 12,354
s60 61,579 64,746
s60l 67 –
s80 7,951 11,698
s80l 3,531 5,545
V40 78,307 22,202
V40cc 21,604 244
V50 223 30,246
V60 54,666 53,037
V70 26,133 31,522
Xc60 114,010 106,203
Xc70 24,418 25,579
Xc90 23,784 31,290
c30 5,628 19,256
c70 5,758 8,029
Total 427,840 421,951
SALES BY ten biggest markets2013 2012
us 61,233 68,079
china 61,146 41,989
sweden 52,260 51,832
uK 32,678 31,743
germany 26,680 32,070
netherlands 23,006 16,338
Japan 16,897 13,848
belgium 16,670 16,338
russia 15,017 20,364
italy 13,708 14,855

board of director’s reportgeely sweden ab annual report 2013 15
retail sales in 2013in 2013 the market development in the automotive sector was strong
in china as well as in the us. china grew by 14.5 per cent compared
to 2012, from 14.972 million units to 17.145 million units. the us
market, characterised by high levels of discounts and competitive of-
fers, increased by 8.4 per cent to 15.520 (14.313) million units.
the economies in southern europe contracted, whilst almost all of
central and northern europe saw weak, but positive growth. in europe
(eu20), the total car market declined by 2.1 per cent to 12.004
(12.265) million units in 2013. a positive exception was the uK, where
the total car market grew by 10.8 per cent to 2.264 (2.045) million
units.
Volvo Cars retail salesVolvo cars reported retail sales for 2013 of 427,840 (421,951) units,
an increase of 1.4 per cent following significant growth in china and
flat sales in the mature european markets, partly offset by decreas-
ing sales in the us. the Volvo Xc60 was the best-selling model with
114,010 (106,203) sold units, followed by the V40 and the s60. sales
for the V40 model reached sales volumes of 78,307 units, while the
V40 cross country model recorded additional sales of 21,604 units.
the launch of the renewed models supported the sales develop-
ment in europe, which also built on the ongoing success of the Volvo
V40 and V60 plug-in Hybrid. Helped by strong demand for these two
models, overall sales in the netherlands increased by 40.8 per cent.
the netherlands is now Volvo cars sixth largest market.
in Sweden, Volvo cars defended its position as market leader in
sweden with a small year-on-year increase of 0.8 per cent to 52,260
(51,832) cars. the market share was strengthened to 20 per cent and
four models were on the top-ten list of best-selling car models. the
Volvo V70 once again ended the year as sweden’s most-sold car, while
the Volvo V60, Xc60 and V40 were other top sellers in the country.
China sales increased by 45.6 per cent compared to 2012, sell-
ing 61,146 cars. the increase was driven by new product launches,
increased marketing and the expansion of the dealer network. demand
for Volvo cars safety offer and premium cabin air quality were major
drivers behind the success of the Volvo s60 and Xc60, while the first
full year of Volvo V60 sales also underlined the popularity of the estate
model with sales of 6,554 cars. the Volvo V40 was launched in china
in the first quarter of 2013 and was the third best-selling Volvo model
in china, behind the Xc60 and s60.
Volvo cars experienced a challenging year in the uS, but the
market remains important. sales fell by 10.1 per cent to 61,233 cars
compared to 2012, partly due to the phase-out of the c30 and c70
models and a later introduction of the renewed model programme,
while demand for the Volvo Xc60 and s60 was strong and both
models sold better than in 2012. Just before the end of the year, Volvo
cars introduced the V60 to the american market, which together with
the refreshed model range and new drive-e powertrains is expected to
stabilize Volvo cars sales in the american market in 2014.
Japanese sales grew by 22 per cent to 16,897 cars, a level last
achieved in the late 1990s. other well-performing markets in asia
were Taiwan with an increase of 4.6 per cent to 4,364 cars and South Korea with an increase of 11.5 per cent to 1,965 cars.
Industry development (total passenger vehicles registered)1)
‘000 2013 2012 Change, %
china2) 17,145 14,972 14.5
usa2) 15,520 14,313 8.4
eu 20 12,004 12,265 –2.1
of which sweden 270 280 –3.7
rest of the world 17,489 17,676 –1.1
Retail Sales
Number of cars sold 2013 2012 Change, %
china 61,146 41,989 45.6
usa 61,233 68,079 –10.1
eu 20 226,095 227,027 –0.4
of which sweden 52,260 51,832 0.8
rest of the world 79,366 84,856 –6.5
ToTal 427,840 421,951 1.4
Market share1)
% 2013 2012 Change, %–points
china2) 0.36 0.33 0.03
usa2) 0.40 0.47 –0.07
eu 20 1.90 1.87 0.03
of which sweden 20.01 18.86 1.15
rest of the world 0.33 0.35 –0.02
1) source: polk2) preliminary data for china and us.
geely sweden ab annual report 2013board of director’s report16
Volvo car corporation is a subsidiary of geely sweden ab. the opera-
tional business is conducted in Volvo car corporation and its subsidiar-
ies. the board of directors of Volvo car corporation consists of 13
members, with two deputy members from the trade union side.
Volvo car corporation welcomed two new members to the board of
directors in 2013. carl-peter forster (formerly bMw, opel, tata) joined
the board in January and former iKea ceo Mikael ohlsson took up a
board position in october.
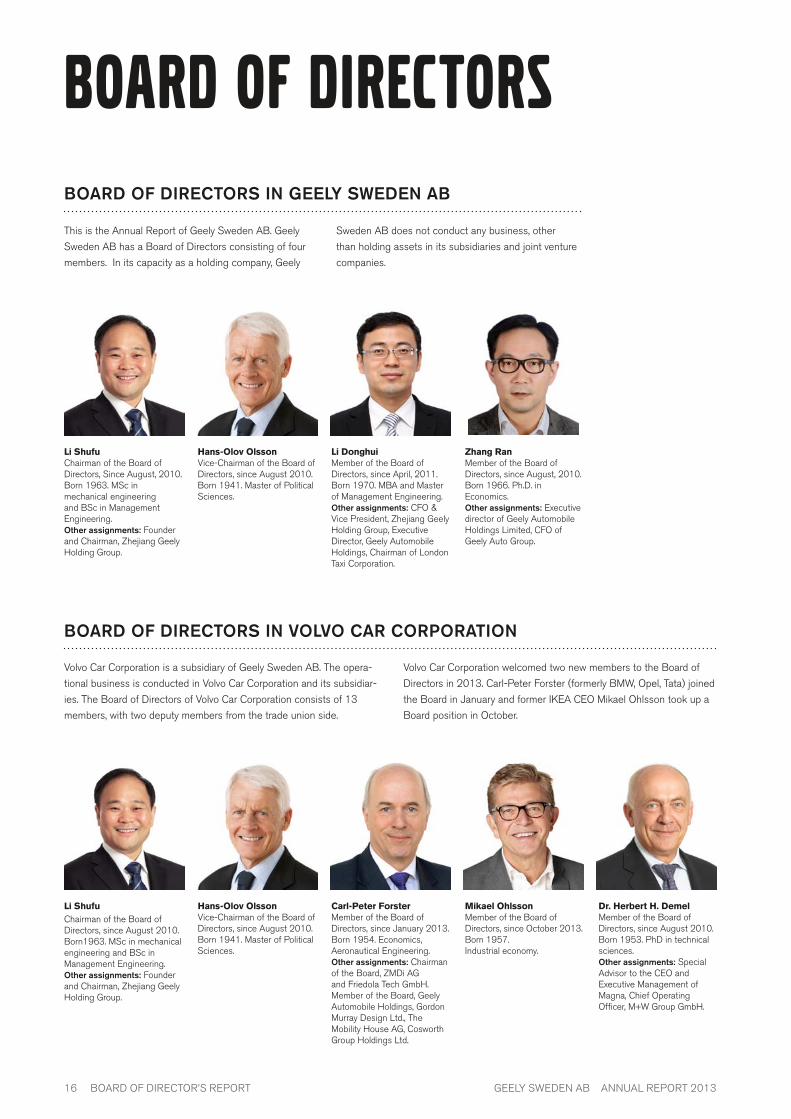
this is the annual report of geely sweden ab. geely
sweden ab has a board of directors consisting of four
members. in its capacity as a holding company, geely
sweden ab does not conduct any business, other
than holding assets in its subsidiaries and joint venture
companies.
Board oF dIreCTorS In Geely Sweden aB
Li Shufuchairman of the board of directors, since august, 2010.born 1963. Msc in mechanical engineering and bsc in Management engineering.other assignments: founder and chairman, Zhejiang geely Holding group.
Hans-Olov OlssonVice-chairman of the board of directors, since august 2010.born 1941. Master of political sciences.
Li DonghuiMember of the board of directors, since april, 2011.born 1970. Mba and Master of Management engineering.other assignments: cfo & Vice president, Zhejiang geely Holding group, executive director, geely automobile Holdings, chairman of london taxi corporation.
Zhang RanMember of the board of directors, since august, 2010.born 1966. ph.d. in economics. other assignments: executive director of geely automobile Holdings limited, cfo of geely auto group.
Board of directors
Board oF dIreCTorS In VolVo Car CorporaTIon
Li Shufuchairman of the board of directors, since august 2010.born1963. Msc in mechanical engineering and bsc in Management engineering.other assignments: founder and chairman, Zhejiang geely Holding group.
Hans-Olov OlssonVice-chairman of the board of directors, since august 2010.born 1941. Master of political sciences.
Carl-Peter ForsterMember of the board of directors, since January 2013.born 1954. economics, aeronautical engineering.other assignments: chairman of the board, ZMdi ag and friedola tech gmbH. Member of the board, geely automobile Holdings, gordon Murray design ltd., the Mobility House ag, cosworth group Holdings ltd.
Mikael OhlssonMember of the board of directors, since october 2013.born 1957. industrial economy.
Dr. Herbert H. DemelMember of the board of directors, since august 2010.born 1953. phd in technical sciences.other assignments: special advisor to the ceo and executive Management of Magna, chief operating officer, M+w group gmbH.

board of director’s reportgeely sweden ab annual report 2013 17
Board oF dIreCTorS In VolVo Car CorporaTIon ConT.
Lone Fønss SchrøderMember of the board of directors, since august 2010.born 1960. Msc in law and an Msc in economics.other assignments: Vice chairman and audit committee, saXo bank. Member of the board and audit committee, aker solution asa, Member of the board and chairman of the audit committee nKt a/s and Valmet oy amo.
Dr. Peter ZhangMember of the board of directors, since december 2010.born 1966. phd in economics.other assignments: regional Managing director, north asia, g4s plc.
Winnie Kin Wah FokMember of the board of directors, since august 2010.born 1956. bachelor degree in commerce.other assignments: senior advisor of faM, Member of the board of directors: g4s plc., Kemira oyj, skandinaviska enskilda banken ab, Hopu investments co. ltd.
Li DonghuiMember of the board of directors, since april 2011.born 1970. Mba and Master of Management engineering.other assignments: cfo & Vice president, Zhejiang geely Holding group, executive director, geely automobile Holdings, chairman of london taxi corporation.
Håkan Samuelssonceo and Member of the board of directors, since august 2010. born 1951.Msc in Mechanical engineering.other assignments: chairman of scandlines gmbH, board member Kihlstedt & dueholm.
union representatives
Glenn Bergströmunion representative in the board of directors appointed by if Metall, since 2009.employed by Volvo cars: 1974birth year: 1955
Marko Peltonenunion representative in the board of directors, appointed by if Metall, since 2006.employed by Volvo cars: 1989birth year: 1965
Sören Carlssonunion representative in the board of directors, appointed by unionen, since 2010.employed by Volvo cars: 1985birth year: 1964
Björn Ohlssondeputy union representative appointed, by akademikerna Volvo cars, since 2009.employed by Volvo cars: 1981birth year: 1963
Magnus Sundemodeputy union representative, appointed by if Metall, since 2008.employed by Volvo cars: 1979birth year: 1954

geely sweden ab annual report 2013board of director’s report18
executive management
Håkan Samuelssonpresident & ceo, since october, 2012.born 1951. Msc in Mechanical engineering.previous positions: chairman & ceo, Man ag, executive board Member development/ production, scania group.
Hans Oscarssonchief financial officer, since august 2013.born 1965. Master degree of finance.previous positions: Various positions within finance, Volvo cars.
Lex Kerssemakerssenior Vice president, product strategy & Vehicle line Management, since January, 2011.born 1960. automotive business Management.previous positions: president, Volvo car overseas corp. senior Vice president, brand, business & product strategy, Vice president global Marketing, Volvo cars, gothenborg.
Peter Mertenssenior Vice president, research & development, since april, 2011.born 1961. phd in production and industrial engineering.previous positions: Jaguar cars plc/tata Motors india, Head of corporate Quality Member of the management board of tata automotive and Jaguar/landrover carsglobal Vehicle line executive, compact cars, general Motors.
Alain Vissersenior Vice president Marketing, sales and customer service, since July, 2013.born 1963. Master of business administration.previous positions: board member at opel/Vauxhall. chief Marketing officer at gM europe.
Lars Danielsonsenior Vice president, Volvo cars china operations, since March, 2013.born 1949. b.a. in Mathematics and computer science.previous positions: Vice president, Volvo cars Manufacturing asia, shanghai. general Manager, Volvo cars torslanda (Vct), gothenburg. Vice president Manufacturing, saab automobile, trollhättan.
Volvo car corporation is managed by the executive Management team,
(eMt) with twelve members, led by the ceo and overseen by the board
of directors of Volvo car corporation. besides from managing Volvo car
corporation the executive Management team also set out the direc-
tions for the operations in the rest of the businesses in Volvo cars.
in february 2013, lars danielson was appointed senior Vice
president Volvo car china operations in May, Volvo cars announced the
formation of a new global purchasing and Manufacturing function. lars
wrebo, until then senior Vice president Manufacturing, was appointed
head of the new unit. alain Visser, from opel, took up the position as
senior Vice president, Marketing, sales & customer service in July.
Hans oscarsson, who had a key role during Zhejiang geely Holding
group ltd.’s acquisition of Volvo car group and has been with the com-
pany since 1990, was appointed as chief financial officer in august.
exeCuTIVe manaGemenT Team In VolVo Car CorporaTIon

board of director’s reportgeely sweden ab annual report 2013 19
exeCuTIVe manaGemenT Team In VolVo Car CorporaTIon ConT.
Lars Wrebosenior Vice president, purchasing & Manufacturing, since april, 2012.born 1961. Master of science.previous positions: executive Vice president, production & logistics. Member of the executive board Man trucks & bus, Munich germany, senior Vice president, chassis and cab production, scania, södertälje, sweden. Managing director, scania production angers s.a.s., angers, france.
Björn Sällströmsenior Vice president, Humanresources, since 1 March 2007.born 1954. pedagogical and behavioural science.previous positions: senior Vice president luvata international, england, senior Vice president Hr cardo ab, sweden, senior Vice president Hr Mölnlycke Health care ab, sweden.
Paul Welandersenior Vice president, Quality and customer satisfaction, since april 1, 2011.born 1958. Master of science in Mechanical engineering.previous positions: acting as senior Vice president, product development, senior Vice president, Quality and customer satisfaction, Volvo cars, executive Vice president, aftersales business unit, Volvo cars of north america.
Maria Hembergsenior Vice president group legal and general counsel, since March 2012.born 1964. Master of law.previous positions: legal counsel, ab sKf, lawyer, senior associate Mannheimer swartling, legal counsel, sca Hygine products ab.
Thomas Ingenlathsenior Vice president design, since July, 2012.born 1964.Master of arts.previous positions: design director of the Volkswagen group design studio potsdam, design director of skoda design.
Anders Kärrbergacting senior Vice presidentcorporate communications,since january 2014.born 1959.Master of science, Mechanical engineering.previous positions: Vice president, government affairs, Volvo cars group, director, environment - Vehicle engineering r&d, Volvo cars group, director, environment affairs, ab Volvo.

geely sweden ab annual report 2013board of director’s report20
Governance
Risks & risk management
Volvo cars promotes the value of sound corporate governance, charac-
terized by high standards when it comes to transparency, reliability and
ethical values.
Volvo cars is managed by the executive Management team, (eMt)
with twelve members, led by the ceo and overseen by the board of
directors of Volvo car corporation. the board of directors of Volvo car
corporation consists of 13 members, with two deputy members from
the trade union side. the directors of the board are proposed by the
shareholders nomination committee, including a proposed remunera-
tion to the directors. at the annual shareholders meeting, the board
of directors and the external auditors, are elected or re-elected on an
annual basis. the majority of the board members are independent of
Volvo cars and of the independent board members at least two shall
further be independent of the shareholders.
the board of directors of Volvo car corporation has assigned an audit
committee to oversee the corporate governance, financial reporting, risks
and the compliance with external and internal regulations. the board of
directors has also assigned a compensation committee to determine the
remunerations to the ceo and the eMt members. in 2013, the board of
directors of Volvo car corporation held six ordinary meetings.
InTernal ConTrol oVer FInanCIal reporTInGVolvo cars primarily builds its internal control principles around the
recommendations of the committee of sponsoring organisations of
the treadway commission (coso). group internal control, includ-
ing a local network with internal control coordinators, aims to ensure
compliance with directives, policies and legal requirements. the audit
committee is informed about the result of the work performed by the
internal control function.
in addition there is an internal audit department with the assign-
ment to perform an independent audit of the governance process,
monitor the management of risks and ensure that systems of internal
control are adequate and effective. internal audit reports to the audit
committee. the internal audit plan is approved by the board of Volvo
car corporation, and results from the audits are communicated to the
audit committee and management.
risks are a natural element in all business activities. in order to achieve
its short and long-term objectives, risk management is part of the daily
business at Volvo cars. the risks of Volvo cars are broadly categorised
into strategic, operational, financial and compliance risks.
STraTeGIC rISKSVolvo cars has established an enterprise risk Management (erM)
system following iso 31000 standard. amongst others this includes a
formal risk assessment process. on a regular basis all functions within
Volvo cars report strategic short term and medium term risks and
mitigation activities. the erM system is governed by the enterprise
risk committee. the complete risk list is updated continuously by the
organization. at each board of directors meeting and audit com-
mittee meeting the current status is presented. in addition to these
updates the executive Management team receives quarterly informa-
tion. strategic risks include, but are not limited to: political decisions,
conflicts, changed customer patterns, and the economy’s effect on
demand. other examples of strategic risks result from sustainability
megaforces like population growth, urbanization, resource scarcity
and climate change. Volvo cars is continuously working on mitigating
identified risks. besides risk mitigation, two of the focus areas for erM
in 2014 are to further improve the dialogue about strategic risks within
the organization and to increase the effectiveness of the current risk
management processes.
operaTIonal rISKS operational risks include for example production disruptions, it risks,
supplier dependence, and price fluctuations of raw material or compo-
nents. operational risks are managed by operations. certain cross-
functional risks, such as corporate responsibility, business continuity,
security, it security and insurable risks are centrally coordinated. risk
management is embedded in various process controls of the opera-
tions such as decision tollgates and approval levels.
the group insurance policy stipulates how the management of the
insurable risks shall be handled and how insurance programmes shall
be procured in order to protect Volvo cars from unforeseen losses.
FInanCIal rISKSin the operations, Volvo cars is exposed to various types of financial
risks, such as currency risk, interest rate risk, liquidity risk, credit risk
and commodity price risk. the board of directors has approved a
group treasury policy for Volvo cars describing how the financial risks
shall be managed and controlled. the management of the financial
risks is centralised to Volvo car group’s group treasury function.
further information on financial risk management is available in note
21 - financial risks and financial instruments.
ComplIanCe rISKScompliance risks are corporate legal and business ethical risks, includ-
ing corruptive business practices, anti-competitive behaviour as well as
data privacy and export control matters. the corporate compliance &
ethics office has the overall responsibility for the development, imple-
mentation and maintenance of the corporate compliance programs
within Volvo cars including the Volvo cars code of conduct, corporate
policies and directives.
board of director’s reportgeely sweden ab annual report 2013 21
subsequent events
Proposed distribution of net income
SuBSequenT eVenTSin detroit and geneva, the Volvo concept Xc coupé and the Volvo con-
cept estate demonstrated more of what to expect from the all-new
Xc90, which will be launched later in 2014 .
during 2013, Volvo cars took a decision to insource the assembly
business for headliner and tunnel consoles of Johnson controls inc. in
torslanda and gent respectively, in order to strengthen the value chain
and provide efficiency benefits. the agreements in relation to the
insourcing were signed in March 2014, but are conditional upon the
approval from the relevant competition authorities.
the shanghai Volvo car research and development co., ltd. is a
joint venture company that has been established in china in January
2014. the purpose of the new joint venture is to engage in services sup-
porting the production and sales of Volvo cars in china.
in february 2014 Volvo cars made the decision to investigate the inter-
est from external parties to acquire the business performed in the floby
manufacturing plant.
during the chinese state Visit in belgium in april 2014 the chinese
president Xi Jinping and Mme peng liyuan, and King philippe and
Queen Mathilde of belgium visited the Volvo cars’ production plant in
ghent.
The parent companythe following funds are at the disposal of the annual general Meeting
(agM):
share premium reserve seK 5,509,350,000
shareholders’ contribution seK 293,083,620
net profit brought forward seK 2,091,642,513
net loss for the year seK –57,610,024
at the disposal of the agM seK 7,836,466,109
the board proposes the following allocation of funds:
carried forward seK 7,836,466,109
for the results and financial position in general of the parent company,
geely sweden ab and Volvo car group, reference should be made to
the following financial statements.

Consolidated Financial statements
Consolidated Income statements ..............................................................................23
Consolidated Comprehensive income ...................................................................23
Consolidated Balance Sheets ......................................................................................24
Changes in Consolidated Equity .................................................................................25
Consolidated Statement of Cash Flows .................................................................26
Notes to the Consolidated Financial statements
Note 1 – Accounting Principles ...................................................................................27
Note 2 – Critical Accounting Estimates and judgements .......................33
Note 3 – Net Revenue ........................................................................................................35
Note 4 – Operating Expenses ......................................................................................35
Note 5 – Related Parties ...................................................................................................35
Note 6 – Audit Fees ..............................................................................................................36
Note 7 – Other Operating Income and Expenses .........................................36
Note 8 – Leasing .....................................................................................................................36
Note 9 – Employees and Remuneration ...............................................................37
Note 10 – Depreciation and Amortisation ..........................................................38
Note 11 – Government Grants .....................................................................................38
Note 12 – Financial Income ...........................................................................................38
Note 13 – Financial Expenses ......................................................................................38
Note 14 – Investments in Associates .....................................................................38
Note 15 – Taxes .......................................................................................................................40
Note 16 – Intangible Assets ..........................................................................................41
Note 17 – Tangible Assets ..............................................................................................42
Note 18 – Other Non-Current Assets ....................................................................42
Note 19 – Inventories ..........................................................................................................42
Note 20 – Accounts Receivable and Other Current Assets ..................42
Note 21 – Financial Risks and Financial Instruments ................................43
Note 22 – Marketable securities and cash and cash equivalents ....48
Note 23 – Equity ......................................................................................................................48
Note 24 – Post Employment Benefits ....................................................................49
Note 25 – Current and other non-current Provisions .................................52
Note 26 – Other non - current Liabilities .............................................................52
Note 27 – Other Current Liabilities ..........................................................................52
Note 28 – Pledged Assets ..............................................................................................52
Note 29 – Contingent Liabilities .................................................................................53
Note 30 – Cash Flow statements................................................................................53
Note 31 – Changes in Accounting Principles ..................................................53
Parent Company Financial statements
Income Statements and Comprehensive Income – Parent Company ..................................................................................................................54
Balance Sheets – Parent Company ..........................................................................55
Changes in Equity – Parent Company ....................................................................56
Statement of Cash Flows – Parent Company ...................................................56
Notes to the Parent Company Financial statements
Note 1 – Accounting Principles ...................................................................................57
Note 2 – Related Parties ...................................................................................................57
Note 3 – Audit Fees ..............................................................................................................58
Note 4 – Remuneration to the Board of Directors ........................................58
Note 5 – Financial Income and Expenses ...........................................................58
Note 6 – Taxes ...........................................................................................................................58
Note 7 – Participation in Subsidiary .........................................................................59
Note 8 – Pledged Assets .................................................................................................59
Note 9 – Cash Flow Statement .....................................................................................53
Subsidiaries .........................................................................................................................................60
Contents Financial Report
22 GEELy SwEDEN AB ANNUAL REPORT 2013

SEK million Note 2013 2012
Net revenue 3 122,245 124,547
Cost of sales 4 –101,934 –104,600
Gross income 20,311 19,947
Research and development expenses 4, 16 –5,864 –6,289
Selling expenses 4 –7,919 –8,642
Administrative expenses 4, 6 –5,129 –5,192
Other operating income 7 1,509 1,032
Other operating expenses 7 –1,168 –814
Share of income in associates 14 179 24
Operating income 5, 8, 9, 10, 11 1,919 66
Financial income 12 87 120
Financial expenses 13 –874 –1,180
Income before tax 1,132 –994
Income tax 15 –172 452
Net income 960 –542
Net income attributable to
Owners of the parent company 960 –592
Non-controlling interests – 50
960 –542
SEK million Note 2013 2012
Net income for the year 960 –542
Other comprehensive income, net of income tax
Items that will not be reclassified susequently to income statement:
Remeasurements of provisions for post-employment benefits 1,735 –98
Items that may be reclassified susequently to income statement:
Translation difference on foreign operations –160 –324
Translation difference of hedge instruments of net investments in foreign operations –100 48
Change in cash flow hedge reserve 23 9 138
1,484 –236
Total comprehensive income for the year 2,444 –778
Total comprehensive income attributable to
Owners of the parent company 2,444 –828
Non–controlling interests – 50
2,444 –778
CONSOLIDATED INCOME STATEMENTS
CONSOLIDATED COMPREHENSIVE INCOME
23GEELy SwEDEN AB ANNUAL REPORT 2013

SEK million Note Dec 31, 2013 Dec 31, 2012
ASSETS
Non-current assets
Intangible assets 16 17,271 15,666
Property, plant and equipment 8, 17 25,653 25,654
Assets held under operating leases 8, 17 4,145 3,542
Investments in associates 14 1,159 550
Other long-term securities holdings 10 10
Deferred tax assets 15 2,165 1,820
Other non-current assets 18 1,077 734
Total non-current assets 51,480 47,976
Current assets
Inventories 19 12,161 11,812
Accounts receivable 5, 20 5,618 4,735
Current tax assets 97 87
Other current assets 20 2,781 2,587
Marketable securities 22 88 –
Cash and cash equivalents 22 15,372 9,607
Total current assets 36, 117 28,828
TOTAL ASSETS 87,597 76,804
EQUITY & LIABILITIES
Equity 23
Equity attributable to owners of the parent company 24,638 21,901
Total equity 24,638 21,901
Non-current liabilities
Provisions for post-employment benefits 24 3,641 5,492
Deferred tax liabilities 15 1,759 1,556
Other non-current provisions 25 5,463 5,911
Liabilities to credit institutions 26 12,033 7,057
Other non-current liabilities 26 1,212 1,057
Total non-current liabilities 24,108 21,073
Current liabilities
Current provisions 25 8,169 7,182
Liabilities to credit institutions 820 310
Advance payments from customers 317 187
Trade payables 13,632 12,626
Current tax liabilities 658 365
Other current liabilities 27 15,255 13,160
Total current liabilities 38,851 33,830
TOTAL EQUITY & LIABILITIES 87,597 76,804
CONSOLIDATED BALANCE SHEETS
24 GEELy SwEDEN AB ANNUAL REPORT 2013

SEK millionShare
CapitalShare
premium
Other contributed
capitalTranslation differences
Other reserves
Retained earnings
Attributable to owners
of the parent
Non- controlling
interest Total
Balance at January 1, 2012 (as previously reported) 1,000 5,509 1,127 –302 – 15,026 22,360 288 22,648
Effect of changes in accounting policies – – – – –1,483 –1,483 – –1,483
Balance at January 1, 2012 (restated) 1,000 5,509 1,127 –302 13,543 20,877 288 21,165
Net income for the year – – – – – –592 –592 50 –542
Other comprehensive income
Remeasurements of provision for post-employment benefits – – – – – –126 –126 – –126
Translation difference on foreign operations – – – –324 – – –324 – –324
Translation difference of hedge instruments for net investments in foreign operations – – – 61 – – 61 – 61
Change in cash flow hedge reserve recognised in other comprehensive income – – – – 177 – 177 – 177
Tax attributable to items recognised in other comprehensive income – – – –13 –39 28 –24 – –24
Other comprehensive income – – – –276 138 –98 –236 – –236
Total comprehensive income – –276 138 –690 –828 50 –778
Transactions with owners
Unconditional shareholder’s contribution – – 1,779 – – – 1,779 – 1,779
Acquisition of remaining shares in non-controlling interest 1) – – – – – 75 75 –333 –258
Other changes – – – – – –2 –2 –5 –7
Transactions with owners – – 1,779 – – 73 1,852 –338 1,514
Balance at December 31, 2012 1,000 5,509 2,906 –578 138 12,926 21,901 – 21,901
Net income for the year – – – – – 960 960 – 960
Other comprehensive income
Remeasurements of provision for post-employment benefits – – – – – 2,190 2,190 – 2,190
Translation difference on foreign operations – – – –160 – – –160 – –160
Translation difference of hedge instruments of net investments in foreign operations – – – –128 – – –128 – –128
Change in cash flow hedge reserve recognised in other comprehensive income – – – – 12 – 12 – 12
Tax attributable to items recognised in other comprehensive income – – – 28 –3 –455 –430 – –430
Other comprehensive income – – – –260 9 1,735 1,484 – 1,484
Total comprehensive income – – – –260 9 2,695 2,444 – 2,444
Transactions with owners
Unconditional shareholder’s contribution – – 293 – – – 293 – 293
Transactions with owners – – 293 – – – 293 – 293
Balance at December 31, 2013 1,000 5,509 3,199 –838 147 15,621 24,638 – 24,6381 ) Acquisition of remaining shares in Pininfarina Sverige AB (Volvo Car Uddevalla AB).
CHANGES IN CONSOLIDATED EQUITY
25GEELy SwEDEN AB ANNUAL REPORT 2013
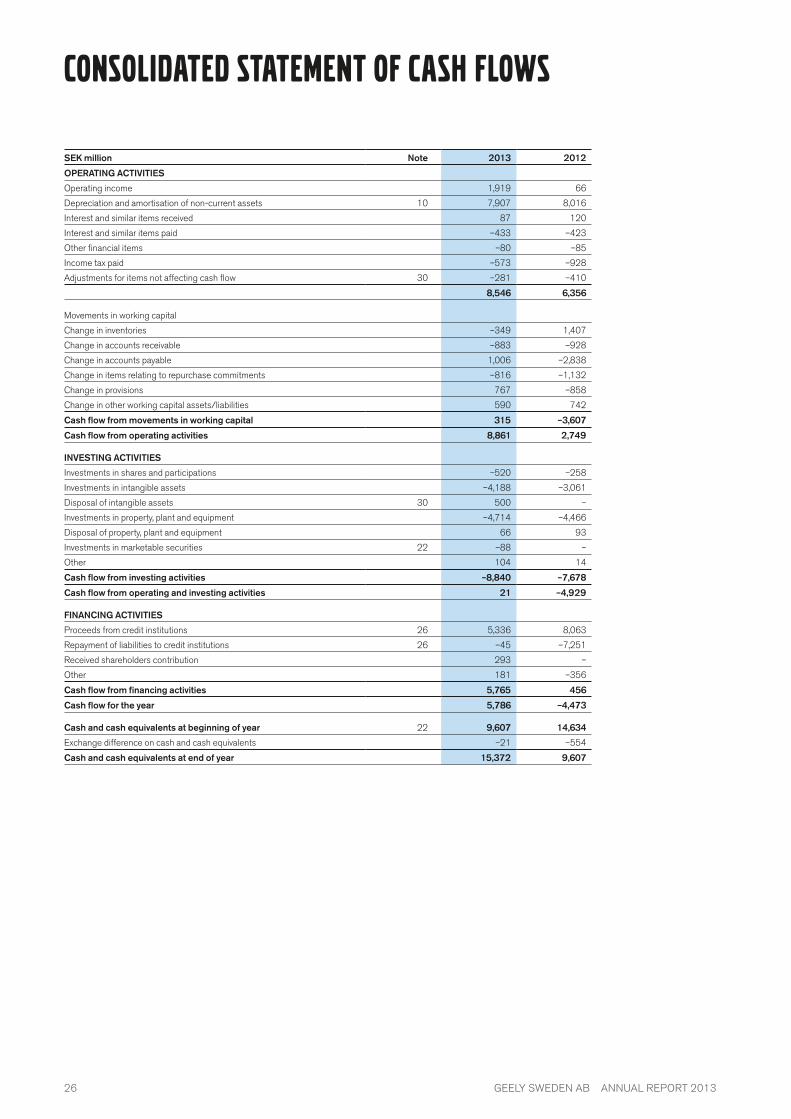
SEK million Note 2013 2012
OPERATING ACTIVITIES
Operating income 1,919 66
Depreciation and amortisation of non-current assets 10 7,907 8,016
Interest and similar items received 87 120
Interest and similar items paid –433 –423
Other financial items –80 –85
Income tax paid –573 –928
Adjustments for items not affecting cash flow 30 –281 –410
8,546 6,356
Movements in working capital
Change in inventories –349 1,407
Change in accounts receivable –883 –928
Change in accounts payable 1,006 –2,838
Change in items relating to repurchase commitments –816 –1,132
Change in provisions 767 –858
Change in other working capital assets/liabilities 590 742
Cash flow from movements in working capital 315 –3,607
Cash flow from operating activities 8,861 2,749
INVESTING ACTIVITIES
Investments in shares and participations –520 –258
Investments in intangible assets –4,188 –3,061
Disposal of intangible assets 30 500 –
Investments in property, plant and equipment –4,714 –4,466
Disposal of property, plant and equipment 66 93
Investments in marketable securities 22 –88 –
Other 104 14
Cash flow from investing activities –8,840 –7,678
Cash flow from operating and investing activities 21 –4,929
FINANCING ACTIVITIES
Proceeds from credit institutions 26 5,336 8,063
Repayment of liabilities to credit institutions 26 –45 –7,251
Received shareholders contribution 293 –
Other 181 –356
Cash flow from financing activities 5,765 456
Cash flow for the year 5,786 –4,473
Cash and cash equivalents at beginning of year 22 9,607 14,634
Exchange difference on cash and cash equivalents –21 –554
Cash and cash equivalents at end of year 15,372 9,607
CONSOLIDATED STATEMENT OF CASH FLOWS
26 GEELy SwEDEN AB ANNUAL REPORT 2013
NOTE 1 – ACCOUNTING PRINCIPLES
Basis of preparationThese are the second financial statements for Geely Sweden AB and its
subsidiaries (Volvo Car Group) that have been prepared in compliance
with the International Financial Reporting Standards (IFRS) issued by
the International Accounting Standards Board (IASB), as adopted by the
European Union. This Annual Report is prepared in accordance with IAS
1 Presentation of Financial Statements and the Swedish Companies
Act. In addition, RFR 1 Supplementary Rules for Groups has been
applied, which is issued by the Swedish Financial Reporting Board. RFR
1 specifies mandatory additions to the IFRS disclosure requirements in
accordance with the Swedish Annual Accounts Act. As from 2012 with
a restatement of comparison year 2011, Volvo Car Group has applied
IFRS in its financial statements.
The consolidated financial statements have been prepared on the
historical cost basis except for certain financial instruments that are car-
ried at fair value, as explained in the accounting policies below. Prepar-
ing the financial reports in compliance with IFRS requires that Manage-
ment make judgements and estimates as well as assumptions that
affect the application of accounting principles and amounts recognised.
The areas involving a higher degree of judgement or complexity, or areas
where assumptions and estimates have significant impact on the con-
solidated financial statements are disclosed in Note 2 - Critical account-
ing estimates and judgements.
The parent company applies the same accounting principles as the
consolidated Volvo Car Group, except in the cases specified in the sec-
tion entitled notes to the parent company’s financial statements. As
required by IAS 1, Volvo Car Group companies apply uniform accounting
rules, irrespective of national legislation, as defined in the Volvo Car
Group Finance Manual, which is in compliance with IFRS. The principles
stated below have been applied consistently for all periods, unless oth-
erwise indicated below. For new accounting standards the application
follows the rules in each particular standard. For information on new
standards, see the section on new and amended standards adopted by
the Volvo Car Group.
Basis of ConsoLiDationThe consolidated accounts have been prepared based on the principles
set forth in IAS 27 - Consolidated and separate financial statements.
Volvo Car Group includes Geely Sweden AB and its subsidiary Volvo Car
Corporation AB. Volvo Car Group also includes all of Volvo Car Corpora-
tion AB’s subsidiaries, which means the companies in which Volvo Car
Corporation directly or indirectly owns more than 50 per cent of the vot-
ing rights of the shares or in any other way holds power to control. Sub-
sidiaries are fully consolidated from the date on which control is trans-
ferred to the group. They are deconsolidated from the date that control
ceases. IFRS 3 - Business combinations, is applied on acquisitions.
Non-controlling interests, that is equity in a subsidiary not attribut-
able to the parent company, are recognised as a separate item in con-
solidated equity. In the consolidated income statement, the share of the
year’s earnings belonging to non-controlling interest is included in net
income. Separate disclosure of the portion belonging to non-controlling
interests is provided. For more information refer to note 14- Investments
in Associates.
Balances and transactions with Shanghai Geely Zhaoyuan International
Investment Co. Ltd and its subsidiaries, companies that are not part of
the Volvo Car Group, are classified in the consolidated financial state-
ments as balances and transactions with related companies.
subsidiariesThe group applies the acquisition method to account for business com-
binations. The value of the acquired net assets is determined by measur-
ing acquired assets and liabilities and contingent liabilities at fair value
on the date of acquisition. In business combinations where the cost of
acquisition exceeds the fair value of the acquired identifiable net assets,
the difference is accounted for as goodwill. If the acquisition cost is less
than the final fair value of the net assets and the acquisition is deter-
mined to be a bargain purchase, the difference is recognised directly as
income in the income statement. Acquisition-related costs are expensed
as incurred. Inter-company transactions, balances and unrealised gains
or losses on transactions between group companies are eliminated.
associated companies and jointly controlled entitiesAssociated companies are companies in which Volvo Car Group has a
significant but not controlling influence, which generally is when Volvo
Car Group holds between 20 and 50 per cent of shares, but it also
includes investments with less participation if significant influence is
proven. Joint ventures refer to companies in which Volvo Car Group,
through contractual cooperation together with one or more parties, has
a joint control over the operational and financial management. Invest-
ments in associated companies and jointly controlled entities are
reported in accordance with the equity method and are initially recog-
nized at acquisition cost. The group’s share of post-acquisition profit or
loss is recognised in the income statement, and its share of post-acqui-
sition movements in other comprehensive income is recognised in other
comprehensive income with a corresponding adjustment to the carrying
amount of the investment. When the group’s share of losses in an asso-
ciate equals or exceeds its interest in the associate, the group does not
recognise further losses unless it has incurred legal or constructive obli-
gations or made payments on behalf of the associate or jointly con-
trolled entity.
foreign currencytranslation of foreign group entitiesVolvo Car Group’s functional currency is the Swedish krona (SEK). The
functional currency of each Volvo Car Group company is determined
based on the primary economic environment in which it operates. Volvo
Car Group’s and Geely Sweden AB’s presentation currency is SEK.
When preparing the consolidated financial statements, balance sheet
and income statements for all group entities whose functional currency
is not SEK are translated into Volvo Car Group’s presentation currency
using the procedures below, except for subsidiaries in hyperinflationary
economies. Currently none of the entities within Volvo Car Group oper-
ates in a hyperinflationary economy.
- Assets and liabilities are translated at the exchange rates at the
respective year end closing rate.
- Income and expenses are translated at the monthly exchange rates
reported in the income statement and statement of other comprehen-
sive income.
NOTES TO THE CONSOLIDATED FINANCIAL STATEMENTSAll amounts are in MSEK unless otherwise stated.
Amounts in brackets refer to the preceding year.
27GEELy SWEdEN AB ANNUAL REPORT 2013

- All translation differences that arise when translating the financial
statements of subsidiaries outside Sweden are recognised as a sepa-
rate item under other comprehensive income in the statement of other
comprehensive income, without affecting income, until the disposal of
the subsidiary.
transactions and balance sheet items in foreign currencyTransactions in foreign currencies are translated to the functional cur-
rency at the exchange rate on the day of the transaction. Monetary
assets and liabilities in foreign currencies are translated to the functional
currency at the exchange rate at the respective year end (closing rate).
Exchange rate differences arising from translation of currencies are
reported in the income statement, except when deferred in other com-
prehensive income as qualifying cash flow hedges and net investment
hedges. Operationally derived exchange gains and losses are shown
under other operating income and other operating expenses respec-
tively. Financially derived exchange gains and losses are shown as finan-
cial income and financial expenses. The main exchange rates applied
are shown in the table below:
eXCHanGe rates
average rate Close rate
Country Currency 2013 2012 2013 2012
China CNy 1,06 1,07 1,07 1,05
Euro zone EUR 8,65 8,71 8,89 8,59
Great Britain GBP 10,19 10,71 10,64 10,50
United states USd 6,53 6,75 6,46 6,52
Russia RUB 0,21 0,22 0,20 0,21
aCCountinG prinCipLesrevenue recognition Volvo Car Group’s recognised net revenue mainly consists of sales of
goods and services. Net revenue is reduced by discounts and returned
goods. Revenue from the sale of goods is recognised when substantially
all risks and rewards are transferred to the customer (generally dealers
and distributors). However, if the sale of vehicles is combined with a
repurchase agreement, the transactions are accounted for as operating
lease contracts. Revenues related to an operating lease arrangement
are recognised straight-line over the lease period and the asset is rec-
ognised as an asset under operating lease in the balance sheet. Reve-
nue from sale to an external party, subject to a subsequent issuance of a
residual value guarantee to an independent financing provider, is recog-
nised at the time of sale and a provision is made for the estimated resid-
ual value risk, provided that significant risks related to the vehicle has
been transferred to the customer. When extended services have been
contractually agreed with the customer in addition to the sale of a vehi-
cle, such as warranty extensions over a fixed period, the related revenue
is recorded on a linear basis in the income statement over the contract
period.
Interest income is reported as it is earned. The calculation is made on
the basis of the return on underlying assets in accordance with the
effective interest method. dividend income is recognised when the right
to receive dividend is obtained. Royalties are recognized in accordance
with the substance of the relevant agreement, generally on an accrual
basis.
Leases Any lease agreements in which the risks and rewards associated with
ownership have been essentially transferred to the related company are
classified as a finance lease. Other leased assets where ownership is
retained by the lessor are classified as operating leases.
Volvo Car Group as lessorVolvo Car Group currently has no finance leases as a lessor per the clos-
ing date. Transactions that include repurchase obligations or residual
value guarantees, and for which significant risks remain with Volvo Car
Group, are carried as operating leases. Operating leases are carried as
Assets held under operating leases among tangible assets. Revenue
from operating leases is recognised on a straight-line basis over the
leasing period. depreciation of the asset occurs on a straight-line basis
under the terms of the commitment and the amounts are adjusted to
conform to the estimated realisable value when the commitment expires.
The estimated realisable value at the commitment termination is evalu-
ated continuously. Principles related to repurchase obligations are fur-
ther explained in the section Revenue recognition.
Volvo Car Group as lesseeIn the case of finance leases, the asset is recognised at the inception of
the lease period as a current or non-current asset at the lower of fair
value or the present value of the minimum lease payments. The asset is
depreciated using the straight-line method over the asset’s useful life or
over the term of the lease if this is shorter. The commitment to pay future
lease payments are discounted to net present value and recorded as a
current or non-current liability in the balance sheet. The lease payments
made are allocated between amortisation of liabilities and interest
expense. For operating leases, i.e., when the risks and rewards associ-
ated with the ownership of the asset have not been transferred to Volvo
Car Group, lease and rental payments are expensed as arised on a
straight-line basis over the lease contract period.
An arrangement that is not in the legal form of a lease is accounted
for as a lease if it is dependent on the use of a specific asset or assets
and the arrangement conveys a right to use the asset.
Government grantsA government grant is recognised when there is reasonable assurance
that Volvo Car Group will comply with the conditions attached to the
grant and that the grant will be received. Government grants are
recorded in the financial statements in accordance with their purpose,
either as reduction of expense or a reduction of the cost of the capital
investment. Government grants are recognised in the income statement
on a systematic basis over the periods necessary to match them with the
related expenses that they are intended to compensate. Government
grants related to assets are deducted from the carrying amount of the
asset and are recognized in the Income statement over the life of a
depreciable asset as a reduced depreciation expense. In cases where
the received government grant is not intended to compensate any
expenses or acquisition of assets the grant is recognised as other
income. Government grants for future expenses are recorded as
deferred income.
income taxes Volvo Car Group’s tax expense consists of current tax and deferred tax.
Taxes are recognised in the income statement except when the underly-
28 GEELy SWEdEN AB ANNUAL REPORT 2013

ing transaction is recognised directly in equity or other comprehensive
income, whereupon related taxation is also recognised in equity or other
comprehensive income.
Current tax is tax that must be paid or will be received for the current
year. Current tax also includes adjustments to current tax attributable to
previous periods.
deferred tax is calculated according to the balance sheet method for all
temporary differences that arise between the tax-related value and the
carrying amount of assets and liabilities. deferred tax assets and liabili-
ties are measured at the nominal amount and at the tax rates that are
expected to apply when the asset is realised or the liability is settled,
using the tax rates and tax rules that have been enacted or substantively
enacted at the balance sheet date. deferred tax assets relating to
deductible temporary differences and loss carryforwards are recognised
to the extent it is probable that they will be utilised in the future. deferred
tax assets and deferred tax liabilities are offset when they are attribut-
able to the same taxation authority on either the same taxable entity or
different taxable entities where there is an intention to settle the bal-
ances on a net basis and the affected company has a legally enforce-
able right to offset tax assets against tax liabilities. Tax laws in Sweden
and in certain other countries allow companies to defer tax payments
through allocation to untaxed reserves. These items are treated as tem-
porary differences in the consolidated balance sheet where the untaxed
reserves are divided between deferred tax liability and equity. In the con-
solidated income statement an allocation to or withdrawal from, untaxed
reserves is divided between deferred taxes and net income for the year.
Classification of current and non-current assets and liabilitiesAn asset is classified as a current asset when it is held primarily for the
purpose of trading, is expected to be realised within twelve months after
the balance sheet date or consists of cash or cash equivalents, provided
it is not subject to any restrictions. All other assets are classified as non-
current assets. A liability is classified as a current liability when it is held
primarily for the purpose of trading or is expected to be settled within
twelve months after the balance sheet date. All other liabilities are clas-
sified as non-current liabilities.
intangible assetsAn intangible asset is recognised when the asset is identifiable, the
Volvo Car Group controls the asset, and it is expected to yield future
economic benefits. Intangible assets comprise product development,
licences and patents, trademarks, dealer network and investments in IT
systems and software. Intangible assets such as trademarks and dealer
networks are normally identified and measured at fair value in connec-
tion with business combinations.
Both acquired and internally generated intangible assets, other than
research and development expenses, are recognised at acquisition cost,
less accumulated depreciation and any impairment loss. When applica-
ble, internal costs directly related to the development of intangible
assets are included in the value of the intangible asset. Borrowing costs
are included in the cost of assets that take substantial period of time to
get ready. Subsequent expenditure on intangible assets increases the
cost only if it is likely that the Volvo Car Group will have future economic
benefit from the subsequent expenditure. All other subsequent expendi-
ture is recognised as an expense in the period in which it is incurred.
Capitalised product development costsVolvo Car Group’s research and development activities are divided into a
concept phase and a product development phase. Research costs dur-
ing the concept phase are charged to the income statement as they
arise. development costs for new products, production systems and
software are capitalised at manufacturing cost beginning on the date
when it is probable that the development expenditure will generate
future economic benefits. development costs are capitalised to the
extent that attributable costs can be measured reliably and both techni-
cal feasibility and successful marketing are assured. If the conditions for
capitalisation are not met, the costs are recognized in the Income state-
ment as expenses in the period they occur. Capitalised development
costs comprise all expenditures that can be directly attributed to the
development phase and that serves to prepare the asset for use, includ-
ing development related overhead and borrowing cost.
development costs previously recognised as an expense are not rec-
ognised as an asset in a subsequent period.
amortisation methods for intangible assetsIntangible assets with finite useful life are amortised on a straight-line
basis in the Income statement over their respective expected economic
life and are tested for impairment whenever there is an indication that
the intangible asset may be impaired. The amortisation period for con-
tractual rights such as licenses does not exceed the contract period.
Trademarks are assumed to have indefinite useful lives since the Volvo
Car Group has the right and the intention to continue to use the trade-
marks for the foreseeable future and the useful life cannot be assessed
why no amortisation is made. dealer network is estimated to have a use-
ful life of 30 years based on the fact that it has been proven historically
to have had a stable basis of dealers.
The useful lives are to a large extent based on historical experience,
expected application as well as other individual characteristics of the
asset. The following useful lives are applied:
dealer network 30 years
Software, mainframe 8 years
Product development costs 3–10 years
Patents, licences and similar rights 3–10 years
Software, PC 3 years
Amortisation is included in cost of sales, selling or administrative
expenses depending on where the assets have been used.
property, plant and equipmentThe Volvo Car Group applies the cost method for measurement of tangi-
ble assets. Cost includes expenditure that can be directly attributed to
the acquisition. Borrowing costs are included in the acquisition value of
an asset that takes substantial period of time to get ready for its
intended use or sale, a so called qualifying asset. Tangible assets are
recognised at acquisition cost, less accumulated depreciation and
potential impairment loss.
Subsequent expenditure on property, plant and equipment increases the
acquisition value only if it is probable that the Volvo Car Group will have
future economic benefit from the subsequent expenditure. The carrying
amount of the replaced part is derecognised. All other repairs and main-
tenance are charged to the income statement during the financial
period in which they are incurred.
29GEELy SWEdEN AB ANNUAL REPORT 2013

Depreciation methods for tangible assetsdepreciation according to plan is based on the acquisition value. Tangi-
ble assets are systematically depreciated over the expected economic
life of the asset.
Each part of an item of property, plant and equipment, with a cost
that is significant in relation to the total cost of the item, is depreciated
separately when the useful life for the part differs from the useful life of
the other parts of the item. Land is assumed to have an indefinite useful
life and is not depreciated.
A review of the useful lives applied in the Group has been done dur-
ing the year. As a result of this review the useful lives for certain types of
machinery and equipment have been adjusted from december 1, 2013.
For further information regarding the effect on depreciations refer to
Note 17 - Tangible assets.
The following useful lives are applied:
Buildings (whereof frames 50 years) 14.5–50 years
Land improvements 30 years
Machinery 8–30 years (previously 14,5–25 years)
Equipment 3–20 years (previously 5–14,5 years)
impairment of assetsThe carrying amounts of intangible and tangible assets as well as all
shareholding investments are tested regularly to assess whether there is
an indication of impairment. Intangible assets that have an indefinite
useful life are tested for impairment annually or whenever there is an
indication of decline in value. The carrying amount of tangible assets
with definite useful lives is tested whenever events or changes in cir-
cumstances indicate that the value of the asset is reduced and there
might be an impairment loss. For these assets as well as assets with an
indefinite useful life, the asset’s recoverable amounts are calculated. The
recoverable amount is the higher of an asset’s fair value less costs to
sell or value in use. Value in use is defined as the present value of the
future cash flows expected to be derived from an asset. For the purpose
of assessing impairment, assets are grouped in one cash-generating
unit (CGU).
When an indication is confirmed, an impairment loss is recognized to
the extent that the carrying amount exceeds its recoverable amount.
Previously recognised impairment loss is reversed if reasons for the ear-
lier impairment no longer exist. An impairment loss is reversed only to
the extent that the asset’s carrying amount after reversal does not
exceed the carrying amount, net of amortisation, which would have been
reported if no impairment loss had been recognized in prior years.
financial assets and liabilitiesFinancial instruments are any form of contract that gives rise to a finan-
cial asset in one company and a financial liability or equity instrument in
another company. Financial assets in the consolidated balance sheet
encompass interest-bearing receivables, trade receivables, other finan-
cial assets, derivative assets and cash and cash equivalents. derivative
instruments include forwards, options and swaps used primarily to cover
risks relating to exchange rate, exposure to interest rate risks and price
fluctuations on electricity. Financial liabilities in the consolidated balance
sheet mostly consist of trade payables, loans and derivative liabilities.
recognition and Measurement of financial assets and liabilitiesFinancial assets and liabilities are recognised in the balance sheet when
the Volvo Car Group becomes a party to the contractual terms and con-
ditions. Receivables are recognised in the balance sheet when Volvo Car
Group has a contractual right to receive payment and liabilities are rec-
ognised when the counterparty has performed and there is a contractual
obligation to pay. Financial assets and liabilities are reported on settle-
ment date, with the exception of derivative instruments, which are
reported on the trade date.
Financial assets are initially recognised at fair value plus transaction
costs except for those financial assets carried at fair value through profit
or loss. Financial assets carried at fair value through profit or loss are ini-
tially recognised at fair value, and transaction costs are expensed in the
income statement. Loans and receivables are subsequently measured at
amortised cost. Accounts receivable are recognised at the amount
expected to be received, i.e. after deduction of bad debts allowance. A
bad debt allowance has incurred when there has been a triggering event
for the customer’s inability to pay. The bad debts on accounts receivable
are recognised as operating expenses. Amortised cost is calculated
using the effective interest method, where any premiums or discounts
and directly attributable costs and revenue are capitalised over the con-
tract period using the effective interest rate. Fair value is generally deter-
mined by reference to official market quotes. When market quotes are
not available the fair value is determined using generally accepted valua-
tion methods such as discounted future cash flows.
Borrowings are initially recognized at fair value net of transaction
costs incurred. After initial recognition, borrowings are valued at amor-
tised cost using the effective interest method.
Classification of financial assets and liabilitiesThe Group classifies its financial assets in the following categories; finan-
cial assets at fair value through profit and loss, loans and receivables,
financial liabilities through profit and loss and other financial liabilities.
Classification takes place at initial recognition. Exceptions from these
principles apply to financial instruments included in hedge accounting,
which are described further in the section “Hedge accounting”.
financial assets carried at fair value through profit or lossA financial asset is assigned to this category if it is held for trading.
derivative instruments with a positive market value are assigned to this
category, unless they are included in hedge accounting. Changes in fair
value of these instruments are recognised in the income statement.
Based on the purpose of the contract, changes in fair value are reported
either under operating income or as financial income/expense. deriva-
tives with positive fair values (unrealised gains) are recognised as other
current assets.
Loans and receivablesNon-derivative financial assets with fixed or determinable payments that
are not quoted in an active market, for example accounts receivable and
loan receivables, are assigned to this category. Cash and cash equiva-
lents are also assigned to this category. Loans and receivables are car-
ried at amortised cost except for accounts receivable that have a short
duration and are therefore valued at nominal value without discounting
to net present value. The nominal value for these short term items will
reflect the fair value.
30 GEELy SWEdEN AB ANNUAL REPORT 2013

financial liabilities at fair value through profit and lossderivative instruments with a negative fair value are assigned to this cat-
egory, unless they are included in hedge accounting. Changes in the fair
values of these instruments are recognised in the income statement.
Based on the purpose of the contract, changes in fair value are reported
either under operating income or as financial income/expense. deriva-
tives with negative fair values (unrealised losses) are recognised as
other current liabilities.
other financial liabilitiesThis category includes financial liabilities not held for trading, trade pay-
ables as well as borrowings and repurchase commitments.
Derecognition of financial assets and liabilitiesA financial asset or a portion of a financial asset is derecognised in the
balance sheet when all significant risks and benefits linked to the asset
have been transferred to a third party. Where Volvo Car Group concludes
that all significant risks and benefits have not been transferred, the por-
tion of the financial assets corresponding to Volvo Car Group’s continu-
ous involvement is recognised.
Invoiced sales are sometimes subject to contracts for factoring with
a third party (bank or financial institution). This enables Volvo Car Group
to receive payment for its accounts receivable within a few days after
billing and thus free liquidity at an earlier stage. If the criteria for
derecognition of accounts receivable are not fulfilled, the receivable
remains on the balance sheet. A financial liability or a portion of a finan-
cial liability is derecognised from the balance sheet when the obligation
in the contract has been fulfilled or cancelled or has expired.
For further information regarding financial instruments refer to Note
21 - Financial risks and financial instruments.
Hedge accountingHedge accounting is adopted for derivative instruments that are
included in a documented hedge relationship. For hedge accounting to
be applied, a direct connection between the hedge and the hedged item
is required. Further, it is necessary for the hedge to protect the risk as
effectively as intended, that the effectiveness of the measure can be
demonstrated at all times to be sufficiently high through effectiveness
testing, and that hedging documentation has been prepared. Volvo Car
Group apply hedge accounting starting from April 1, 2012 for derivate
instruments related to hedging of currency risk in future commercial
cash flows. Volvo Car Group also applies hedge accounting of net
investments in foreign operations from december 2012.
Hedge accounting is applied for derivative instruments that were
acquired for the purpose of hedging expected future commercial cash
flows in foreign currencies against currency rate risks. A cash flow
hedge is a hedge held to reduce the risk of an impact on profit or loss
from foreign exchange changes in cash flow relating to a future transac-
tion. In cash flow hedge accounting, the derivative is recognised in the
balance sheet at fair value, and changes in the fair value is recognised
under other comprehensive income and accumulated in the hedge
reserve in equity. Amounts that have been recognised in the hedge
reserve in equity are recognised in the income statement in the same
period as the payment flows reach the income statement. The hedging
relationship is regularly tested up until its maturity date. If the identified
relationships are no longer deemed effective, the fluctuation in fair value
on the hedging instrument from the last period the instrument was con-
sidered effective is recognised in the income statement. If the hedged
transaction is no longer expected to occur, the hedge’s accumulated
changes in value are immediately transferred from other comprehensive
income to the income statement and are included in operating income.
Hedging of net investments in foreign operations refers to hedges
held to reduce the effect of changes in the value of a net investment in a
foreign operation due to changes in foreign exchange rates. The foreign
currency gains and losses on hedging instruments are recognised under
other comprehensive income. In the event of a divestment, the accumu-
lated result from the hedge is immediately transferred from the hedge
reserve in equity to the income statement. For further information
regarding accounting treatment related to foreign currency see section
“Foreign currency” above. See also Note 21- Financial risks and finan-
cial instruments for more information regarding financial instruments.
inventoryInventories of raw material, consumables and supplies, semi-manufac-
tured goods, work in progress, finished goods and goods for resale are
reported in inventories and carried at the lower of actual cost, less
deductions for any obsolescence, and net realisable value at the report-
ing date. Costs of inventories comprise costs of purchase, production
charges and other expenditures incurred in bringing the inventories to
their present location and condition. The cost of inventories of similar
assets is established using the first-in, first-out method (FIFO) and is
based on the standard cost method. The standard costs are updated
annually and adjustments are made at the turn of the model year. Net
realisable value is calculated as the selling price in the ordinary course
of business less estimated costs of completion and selling costs. For
groups of similar products a group valuation method is applied. Physical
stock counts are carried out annually or more often where appropriate in
order to verify the records.
Cash and cash equivalentsCash and cash equivalents consist of cash and bank balances as well as
short-term liquid investments with a maturity of maximum 90 days,
which are subject to an insignificant risk of fluctuations in value. Cash
and cash equivalents are stated at nominal value.
employee benefit obligationsVolvo Car Group has both defined contribution plans and defined benefit
plans. Under a defined contribution plan, Volvo Car Group pays fixed
contributions into a separate legal entity and will have no legal obligation
to pay further contributions if the fund does not hold sufficient assets to
pay all employee benefits. The contributions are recognised as
employee benefit expenses in the income statement when earned by
the employee. The assets of the plans are held separately from those of
Volvo Car Group in funds under the control of trustees.
A defined benefit plan is a pension plan that defines the amount of
post-employee benefit an employee will receive upon retirement, usually
dependent on one or more factors such as age, years of service and
compensation. Volvo Car Group has the obligation for the future bene-
fits. For the funded defined benefits plans, the assets have been sepa-
rated, with the majority invested in pension foundations.
The pension provision or asset recognised in the balance sheet in
respect of defined benefit pension plans is the present value of the
31GEELy SWEdEN AB ANNUAL REPORT 2013

defined benefit obligation at the balance sheet date less the fair value of
plan assets. Prepaid contributions are recognised as an asset to the
extent that a cash refund or reduction in future payments is available.
The calculation of the present value of defined benefit pension
undertakings is performed according to the Projected Unit Credit
method, which also considers future earnings. The calculation is per-
formed annually by independent actuaries. The present value of the
defined benefit obligation is determined by discounting the estimated
future cash outflows using interest rates of high-quality corporate and
government bonds that are denominated in the currency in which the
benefits will be paid, and that have terms to maturity approximating to
the terms of the related pension liability. The discount rate for the Swed-
ish pension obligation is determined by reference to mortgage bonds.
The most important actuarial assumptions are stated in Note 24 - Post
employment benefits.
Actuarial gains and losses arising from experience adjustments and
changes in actuarial assumptions are charged or credited to equity in
other comprehensive income in the period in which they arise.
Past service costs are recognized immediately in the income state-
ment when the settlement occurs.
Interest cost and expected return on assets is calculated on a net
basis by applying the discount rate used to measure the defined benefit
obligation to the net defined benefit liability (asset).
Termination benefits are payable when employment is terminated by
the group before the normal retirement date, or whenever an employee
accepts voluntary redundancy in exchange for these benefits. The group
recognizes termination benefits at the earlier of the following dates: (a)
when the group can no longer withdraw the offer of those benefits; and
(b) when the entity recognizes costs for a restructuring that is within the
scope of IAS 37 and involves payment of termination benefits.
provisionsProvisions are recognized in the balance sheet when a legal or con-
structive obligation exist as a result of a past event and it is deemed
more likely than not that an outflow of resources will be required to settle
the obligation and the amount can be reliably estimated. The amount
recognized as provision is the best estimate of the expenditure required
to settle the present obligation at the balance sheet date. Provisions are
regularly reviewed and adjusted as further information becomes avail-
able or circumstances change.
If the effect is material, non-current provisions are recognized at
present value by discounting the expected future cash flows at a pre-tax
rate reflecting current market assessments of the time value of money.
The discount rate does not reflect such risks that are taken into consid-
eration in the estimated future cash flow.
Revisions to estimated cash flows (both amount and likelihood) are
allocated as operating cost. Changes to present value due to the pas-
sage of time and revisions of discount rates to reflect prevailing current
market conditions are recognised as a financial cost.
Warranty provisions include the Group’s cost of satisfying the cus-
tomers with specific contractual warranty obligations, as well as other
costs not covered by contractual commitments. All warranty provisions
are recognised at the sale of the vehicles or spare parts. The initial cal-
culations of the reserves are based on historical warranty statistics con-
sidering known quality improvements, costs for remedy of defaults etc.
The provisions for campaigns booked at point of sale are adjusted as
campaign decisions for specific quality problems are made. On a quar-
terly basis the provisions are adjusted to reflect latest available data
such as actual spend, exchange rates, discounting rates etc. The provi-
sions are reduced by virtually certain warranty reimbursements from
suppliers.
Contingent liabilitiesWhen a commitment does not meet the criteria for recognition of a liabil-
ity or provision in the balance sheet it may be disclosed as a contingent
liability. These possible obligations derive from past events and their
existence will be confirmed only when one or several uncertain future
events, which are not entirely within the Volvo Car Group’s control, take
place or fail to take place. A contingent liability could also exist for a pres-
ent obligation where an outflow of resources is not likely or when the
amount of the obligation cannot be measured with sufficient reliability.
CHanGes in aCCountinG poLiCY anD DisCLosuresnew and amended standards adopted by the groupthe following standards have been adopted by the group for the first time for the financial year beginning on 1 January 2013 and have a material impact on the group:IAS 19 was amended in June 2011 and effective from January 1 2013
with retrospective application. The changes on the Group’s accounting
policies relates to the accounting for changes in defined benefit obliga-
tions and plan assets. The amendments require the recognition of
changes in defined obligations and in fair value of plan assets when they
occur, and hence eliminate the “corridor approach” previously used by
Volvo Car Group and accelerate the recognition of past service costs.
The amendments has resulted in all actuarial gains and losses to be rec-
ognised immediately through other comprehensive income in order for
the net pension asset or liability recognised in the consolidated balance
sheet to reflect the full value of the plan deficit or surplus.
The impact of the new revised IAS 19 has changed the balance
sheet liability due to the removal of the corridor where the unrecognised
net actuarial loss and the unrecognised past service cost have disap-
peared with an increase to the pension liability as a consequence. Inter-
est cost and expected return on assets have been replaced with a net
interest amount that is calculated by applying the discount rate used to
measure the defined benefit obligation to the net defined benefit liability
(asset).
See note 31- Changes of accounting principles for the impact on the
financial statements as a result of the amended IAS 19.
the following standards have been adopted by the group but have no material impact on the group:Amendment to IAS 1, Financial statement presentation regarding other
comprehensive income. The main change is a requirement to group
items presented in ‘other comprehensive income’ (OCI) on the basis of
whether they are potentially reclassifiable to profit or loss.
Amendment to IFRS 7, ‘Financial instruments: disclosures’, on asset
and liability offsetting. New disclosures are included in Note 21- Finan-
cial risks and financial instruments.
IFRS 13, ‘Fair value measurement’, aims to improve consistency and
reduce complexity by providing a precise definition of fair value and a
single source of fair value measurement and disclosure requirements for
use across IFRSs. For further information regarding financial instru-
ments refer to Note 21 - Financial risks and financial instruments.
32 GEELy SWEdEN AB ANNUAL REPORT 2013

new standards and interpretations not yet adopted by the GroupWhen preparing the consolidated financial statements as of december
31, 2013, a number of standards, interpretations and amendments have
been published, but have not yet become effective. None of these is
expected to have a significant effect on the consolidated financial state-
ments of the Group except those stated below. The following is a prelim-
inary assessment of the effect that the implementation of these stan-
dards and interpretations could have on Volvo Car Group’s financial
statements.
ifrs 10 – Consolidated financial statementsIFRS 10 is based on existing principles by identifying the concept of
control as the determining factor for assessment of whether a company
should be included in the consolidated financial statements. The stan-
dard provides additional guidance to assist in the determination of con-
trol where this is difficult to assess. Volvo Car Group intends to adopt
IFRS 10 for the year beginning January 1, 2014. A high level assess-
ment shows that there are no significant effects for Volvo Car Group.
ifrs 11 – Joint arrangementsIFRS 11 provides guidance for the accounting of joint arrangements by
focusing on the rights and obligations of the arrangement, rather than
its legal form. Joint arrangements are divided into two categories – joint
operations and joint ventures. In joint operations each joint venture
accounts for the assets, liabilities, revenues and expenses relating to its
interest in the joint arrangement. In joint ventures, each joint venture
shall account for its interest using the equity method. Volvo Car Group
intends to adopt IFRS 11 for the year beginning January 1, 2014. A high
level assessment shows that there are no significant effects for Volvo
Car Group.
ifrs 12 – Disclosure of interests in other entities IFRS 12 is a new and comprehensive standard on disclosure require-
ments for all forms of interests in other entities, including joint arrange-
ments, associates and structured entities. Volvo Car Group intends to
adopt IFRS 12 for the year beginning January 1, 2014. Volvo Car Group
will be affected by extended disclosure requirements in the financial
statements of 2014.
Other changes in standards and interpretations that enter into force
on January 1 2014 or subsequently are not expected to have any
impact on the Group.
NOTE 2 – CRITICAL ACCOUNTING ESTIMATES AND JUDGEMENTS Preparation of the financial statements in accordance with IFRS requires
the company’s executive management and Board of directors to make
estimations and assessments as well as to make assumptions that
affect application of the accounting policies and the reported assets, lia-
bilities, income and expenses. The estimates are based on historical
experience and assumptions that are deemed reasonable and realistic
in the circumstances. The results of these estimations and assessments
are then used to establish the reported values of assets and liabilities
that are not otherwise clearly documented from other sources. The
actual outcome may differ from these estimates and assessments. The
estimates and underlying assumptions are reviewed on a regular basis.
Changes are recognised in the period of the change and future periods
if the change affects both. The estimations and assessments described
below are those that are deemed to be the most important for an under-
standing of Volvo Car Group’s financial reports, taking into account the
degree of materiality and uncertainty. Changes in estimates used in
these and other items could have a material impact on Volvo Car Group’s
financial statements.
impairment of non-current assets The Volvo Car Group has substan-
tial values reported in the balance sheet regarding non-current assets.
Property, plant and equipment and intangible assets are depreciated on
a straight-line basis over their estimated useful lives; refer to Note 1 -
Accounting principles. Management regularly reassesses the useful life
of all significant assets. The carrying amounts of non-current assets are
tested for impairment in accordance with the accounting policies
described in Note 1 to the consolidated accounts, Accounting princi-
ples. An impairment is recognised if the carrying value of the asset
exceeds the recoverable amount. The recoverable amount is the higher
of the asset’s net selling price and its value in use. For these calcula-
tions, certain estimations must be made regarding future cash flows,
required return on investments and other adequate assumptions. The
estimated future cash flows are based on assumptions that represent
management’s best estimate of the economic conditions that will exist
during the asset’s remaining lifetime, and are based on internal business
plans or forecasts.
Future cash flows are determined on the basis of the long-term plan-
ning, which is approved by Management and which is valid at the date of
conduction of the impairment test. This planning is based on expecta-
tions regarding future market share, the market growth as well as the
products’ profitability.
revenue recognition When Volvo Car Group has entered into a resid-
ual value guarantee in relation to a vehicle sale, there may be a question
of judgement regarding whether or not significant risks and rewards of
ownership have been transferred to the customer. If the previous
assessment of retained risk by Volvo Car Group is proven to be incorrect
and it is instead determined that significant risks are retained by Volvo
Car Group, revenue in the coming period will decline and instead be dis-
tributed over several reporting periods. Refer to Note 1 - Accounting
principles for a description of Volvo Car Group’s revenue recognition pol-
icy relating to operating lease contracts.
residual value risk In the course of its operations, Volvo Car Group is
exposed to residual value risks through sales combined with repurchase
agreements and sales to external rental company subject to residual
value guarantees. Residual value risks are reflected in different ways in
the consolidated financial statements depending on the extent to which
the risk remains with the Group. In cases where significant risks pertain-
ing to vehicles remain with Volvo Car Group, the vehicles are generally
recognised in the balance sheet as Assets under operating leases.
Accumulated depreciation on these vehicles reduces the value of the
vehicles from their original acquisition value to their expected residual
value, being the estimated net realisable value, at the end of the lease
term. The depreciations are charged on a straight-line basis over the
term of the commitment. Vehicles sold to an external party, subject to a
subsequent issuance of a residual value guarantee to an independent
financing provider, are derecognised from the balance sheet in cases
33GEELy SWEdEN AB ANNUAL REPORT 2013
where no significant risks remain with Volvo Car Group. A provision is
made for the residual value risk related to the guarantee based upon
estimations of the used products’ future net realisable values. The esti-
mated net realisable value of the products at the end of the commitment
is monitored individually on a continuing basis and is estimated by evalu-
ating recent auction values, future price deterioration due to expected
change of market conditions, marketing incentive plans, vehicle quality
data and repair and reconditioning costs etc. High inventories in the
vehicle industry and low demand may have a negative impact on the
prices of new and used vehicles. A decline in prices of our vehicles may
negatively affect the consolidated income.
Warranty The recognition and measurement of provisions for product
warranties is generally connected with estimates. Estimated costs for
product warranties are charged to cost of sales when the products are
sold. Estimated warranty costs include contractual warranty, warranty
campaigns (recalls and buy-backs) and warranty cover in excess of con-
tractual warranty or campaigns, which is accepted as a matter of policy
or normal practice in order to maintain a good business relation with the
customer. Warranty provisions are estimated based on historical claims
statistics and the warranty period. Quality index improvements based on
historical patterns have been reflected in all categories of warranty.
Refunds from suppliers that decrease Volvo Car Group’s warranty costs
are recognised to the extent these are considered to be virtually certain.
employee benefit obligations The value of pension obligations for
defined benefit obligations is determined through actuarial calculations
based on assumptions about the discount rate, future salary increases,
inflation, mortality rates and demographic conditions. Every change in
these assumptions affects the calculated value of the post-employee
benefits obligations. The discount rate, which is the most critical
assumption, is based on market return on high-quality corporate and
government bonds that are denominated in which the benefits will be
paid and with maturities corresponding to the related pension liability. A
lower discount rate increases the present value of post-employee bene-
fits obligations and their cost while a higher discount rate has the
reverse effect. due to changing market and economic conditions, the
underlying key assumptions may differ from actual developments and
may lead to significant changes in pension and other post-employment
benefit obligations. For further information on pension provisions, see
Note 24 - Post employment benefits.
inventoriesIn situations where the net realizable value is lower than cost, a valuation
allowance is recognised for inventory obsolescence. The total inventory
value, net of inventory obsolescence allowance, was 12,161 (11,812)
whereof value adjustment reserve –191 (–247) as of december 31,
2013.
Deferred tax assets The calculation of deferred tax assets requires
assumptions to be made with regard to the level of future taxable
income and the timing of recovery of deferred tax assets. These
assumptions take account of forecast operating results and the impact
on earnings of the reversal of taxable temporary differences. The mea-
surement of deferred tax assets is subject to uncertainty and the actual
result may diverge from these judgements due for example to future
changes in business climate and altered tax laws. An assessment is
made at each closing date of the likelihood that the deferred tax asset
will be utilised. If needed the carrying amount of the deferred tax asset
will be altered. The judgements that have been made may affect net
income both positively and negatively. Further information is provided in
Note 15 - Taxes.
Legal proceedings Companies within Volvo Car Group are involved in
legal proceedings covering a range of different matters, which are pend-
ing in various jurisdictions. These include, but are not limited to, commer-
cial disputes such as alleged breach of contract, insufficient supplies of
goods or services, product liability, patent infringement or infringement
of other intangible rights. The various matters raised are often of a diffi-
cult and complex nature and often legally complicated. It is therefore dif-
ficult to predict the final outcome of such matters. The companies within
Volvo Car Group work closely with legal advisors and other experts in the
various matters in each jurisdiction. A provision is made when it is deter-
mined that an adverse outcome is more likely than not and the amount
of the loss can be reasonably estimated. In instances where these crite-
ria are not met, a contingent liability has been disclosed provided the risk
qualifies as such liability.
tax processes Volvo Car Group is also, like other global companies, at
times involved in tax processes of varying scope and in various stages.
These tax processes are evaluated regularly and provisions are made
according to the accounting principles, i.e., when it is more likely than not
that additional tax must be paid and the outcome can be reliably esti-
mated. If it is not probable that the additional tax will be paid but the risk
is more than remote, such amounts are shown as contingent liabilities.
34 GEELy SWEdEN AB ANNUAL REPORT 2013
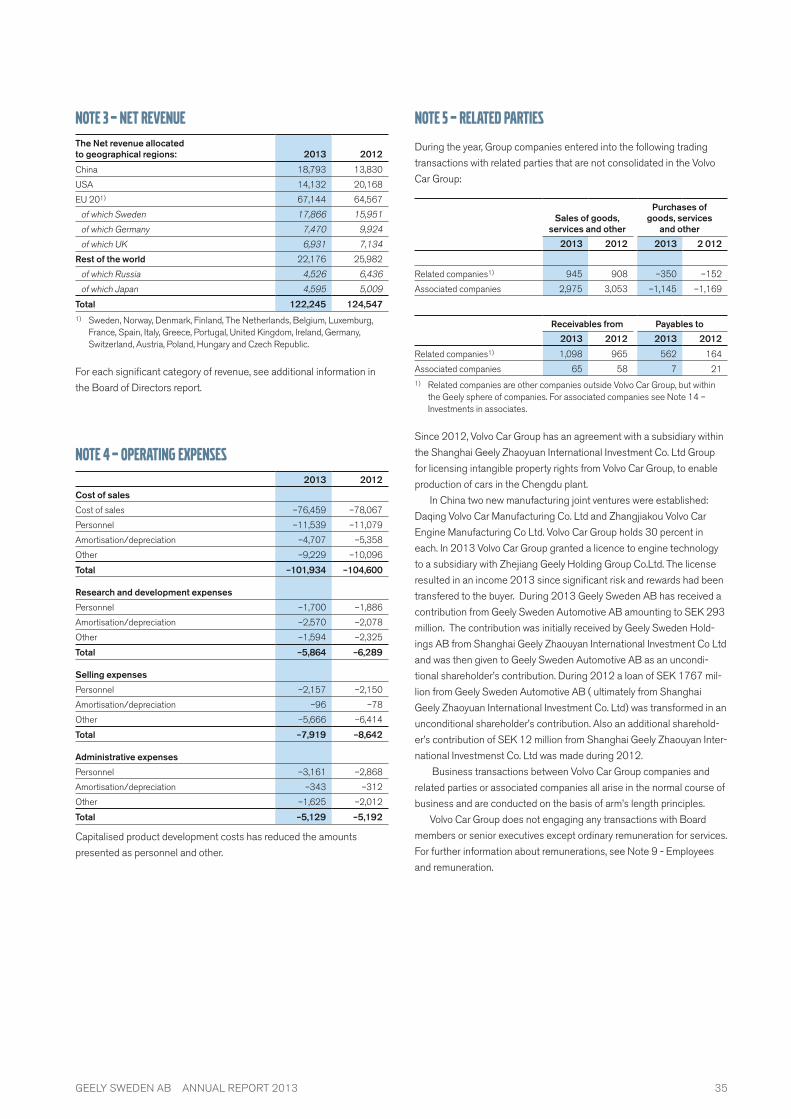
NOTE 3 – NET REVENUE
The Net revenue allocated to geographical regions: 2013 2012
China 18,793 13,830
USA 14,132 20,168
EU 201) 67,144 64,567
of which Sweden 17,866 15,951
of which Germany 7,470 9,924
of which UK 6,931 7,134
Rest of the world 22,176 25,982
of which Russia 4,526 6,436
of which Japan 4,595 5,009
Total 122,245 124,5471) Sweden, Norway, Denmark, Finland, The Netherlands, Belgium, Luxemburg,
France, Spain, Italy, Greece, Portugal, United Kingdom, Ireland, Germany, Switzerland, Austria, Poland, Hungary and Czech Republic.
For each significant category of revenue, see additional information in
the Board of Directors report.
NOTE 4 – OPERATING EXPENSES
2013 2012
Cost of sales
Cost of sales –76,459 –78,067
Personnel –11,539 –11,079
Amortisation/depreciation –4,707 –5,358
Other –9,229 –10,096
Total –101,934 –104,600
Research and development expenses
Personnel –1,700 –1,886
Amortisation/depreciation –2,570 –2,078
Other –1,594 –2,325
Total –5,864 –6,289
Selling expenses
Personnel –2,157 –2,150
Amortisation/depreciation –96 –78
Other –5,666 –6,414
Total –7,919 –8,642
Administrative expenses
Personnel –3,161 –2,868
Amortisation/depreciation –343 –312
Other –1,625 –2,012
Total –5,129 –5,192
Capitalised product development costs has reduced the amounts
presented as personnel and other.
NOTE 5 – RELATED PARTies
During the year, Group companies entered into the following trading
transactions with related parties that are not consolidated in the Volvo
Car Group:
Sales of goods, services and other
Purchases of goods, services
and other
2013 2012 2013 2 012
Related companies1) 945 908 –350 –152
Associated companies 2,975 3,053 –1,145 –1,169
Receivables from Payables to
2013 2012 2013 2012
Related companies1) 1,098 965 562 164
Associated companies 65 58 7 211) Related companies are other companies outside Volvo Car Group, but within
the Geely sphere of companies. For associated companies see Note 14 – Investments in associates.
Since 2012, Volvo Car Group has an agreement with a subsidiary within
the Shanghai Geely Zhaoyuan International Investment Co. Ltd Group
for licensing intangible property rights from Volvo Car Group, to enable
production of cars in the Chengdu plant.
In China two new manufacturing joint ventures were established:
Daqing Volvo Car Manufacturing Co. Ltd and Zhangjiakou Volvo Car
Engine Manufacturing Co Ltd. Volvo Car Group holds 30 percent in
each. In 2013 Volvo Car Group granted a licence to engine technology
to a subsidiary with Zhejiang Geely Holding Group Co.Ltd. The license
resulted in an income 2013 since significant risk and rewards had been
transfered to the buyer. During 2013 Geely Sweden AB has received a
contribution from Geely Sweden Automotive AB amounting to SEK 293
million. The contribution was initially received by Geely Sweden Hold-
ings AB from Shanghai Geely Zhaouyan International Investment Co Ltd
and was then given to Geely Sweden Automotive AB as an uncondi-
tional shareholder’s contribution. During 2012 a loan of SEK 1767 mil-
lion from Geely Sweden Automotive AB ( ultimately from Shanghai
Geely Zhaoyuan International Investment Co. Ltd) was transformed in an
unconditional shareholder’s contribution. Also an additional sharehold-
er’s contribution of SEK 12 million from Shanghai Geely Zhaouyan Inter-
national Investmenst Co. Ltd was made during 2012.
Business transactions between Volvo Car Group companies and
related parties or associated companies all arise in the normal course of
business and are conducted on the basis of arm’s length principles.
Volvo Car Group does not engaging any transactions with Board
members or senior executives except ordinary remuneration for services.
For further information about remunerations, see Note 9 - Employees
and remuneration.
35GEELy SwEDEN AB ANNUAL REPORT 2013

NOTE 6 – AUDIT FEES
2013 2012
Deloitte
Audit fees –22 –24
Audit-related fees –3 –3
Tax services –1 –2
Other services –9 –11
Total –35 –40
Audit fees involve audit of the Annual Report, financial accounts and
the administration by the Board of Directors and the Managing Director.
The audit also includes advice and assistance as a result of the observa-
tions made in connection with the audit.
Audit-related fees refer to other assignments to ensure quality in the
financial statements including consultations on reporting requirements
and internal control.
Tax services include tax-related consultancy.
All other work performed by the auditor is defined as other services.
NOTE 7 – OTHER OPERATING INCOME AND EXPENSES
2013 2012
Other operating income
Licences 323 73
Foreign exchange gain 775 104
Technology transfer – 590
Other 411 265
Total 1,509 1,032
2013 2012
Other operating expenses
Amortisation and depreciation of intangible and tangible assets –191 –191
Restructuring costs –60 –49
Royalty –351 –
Property tax –65 –67
Other –501 –507
Total –1,168 –814
NOTE 8 – LEASING
VOlVO CAR GROuP AS leSSOROperational lease contracts are recognised as non-current assets in
assets held under operating leases in the balance sheet and mainly
relate to vehicles sold with repurchase agreements. The difference
between the original sales price and the repurchase price is recognised
in the income statement as revenue on a straight-line basis over the
lease term. The remaining lease revenue yet to be recognised in income
is presented as part of current and non-current liabilities in the balance
sheet, see Note 26 – Other non-current liabilities and Note 27 – Other
current liabilities. The repurchase obligation is considered to be a finan-
cial liability and is presented as part of current and non-current liabilities.
Volvo Car Group does currently not have any finance lease engage-
ments as a lessor.
Future lease revenue of operating lease contracts Rental income 2013 2012
No later than 1 year 549 493
Later than 1 year and no later than 5 years 420 393
Later than 5 years – –
Total 969 886
VOlVO CAR GROuP AS leSSeeOperating lease contractsThe operating lease contracts Volvo Car Group holds are mainly
contracts for premises and office equipment around the world. Also
some production equipment such as forklifts for the factories are under
operating lease contracts.
Operating lease expenses 2013 2012
Minimum lease payments –934 –819
Contingent rents –47 –46
Less subleases 15 27
Total –966 –838
Operating lease commitments per Dec 31, 2013
Minimum lease
paymentsless
subleases Total
Present value of operating lease
commitments less subleases
– No later than 1 year 901 26 875 857
– Later than 1 year and no later than 5 years 1,885 104 1,781 1,587
– Later than 5 years 2,158 164 1,994 1,417
Total 4,944 294 4,650 3,861
Finance lease contractsVolvo Car Group holds finance lease contracts for production equipment
and some buildings used in production. The assets will be owned by
Volvo Car Group at the end of the lease contracts at no additional cost.
All leases are fixed terms with fixed payments.
36 GEELy SwEDEN AB ANNUAL REPORT 2013

Finance lease assetsBuildings and land
Machinery and equipment
Acquisition cost
Balance at January 1, 2012 72 1,682
Additions 23 –
Divestments and disposals – –6
Effect of foreign currency exchange differences –3 –
Balance at December 31, 2012 92 1,676
Divestments and disposals –2 –
Effect of foreign currency exchange differences –3 –
Balance at December 31, 2013 87 1,676
Accumulated depreciation
Balance at January 1, 2012 –37 –1,277
Depreciation expense –4 –180
Divestments and disposals – 6
Balance at December 31, 2012 –41 –1,451
Divestments and disposals –7 –95
Balance at December 31, 2013 –48 –1 546
Net balance at December 31, 2012 51 225
Net balance at December 31, 2013 39 130
Gross finance lease liabilities – minimum lease payments
Dec 31, 2013
Dec 31, 2012
– No later than 1 year 33 34
– Later than 1 year and no later than 5 years 122 134
– Later than 5 years 6 30
Total 161 198
Future finance charges on finance leases –22 –34
Present value of finance lease liabilities 139 164
The present value of finance lease liabilities is as follows:
Gross finance lease liabilities – minimum lease payments
Dec 31, 2013
Dec 31, 2012
– No later than 1 year 25 24
– Later than 1 year and no later than 5 years 109 112
– Later than 5 years 5 28
Total 139 164
The finance lease liabilities are included in the financial statement as:
Dec 31, 2013
Dec 31, 2012
Other current liabilities (Note 27) 25 24
Other non-current liabilities (Note 26) 114 140
Total 139 164
NOTE 9 – EMPLOYEES AND REMUNERATION
Average number of employees by region: 2013
Of whom women 20124)
Of whom women
Sweden 15,786 23% 15,458 22%
Nordic countries other than Sweden 342 29% 360 17%
Belgium 4,171 12% 4,155 11%
Europe other than the Nordic countries and Belgium 991 39% 984 40%
North and South America 421 23% 419 23%
Asia 1,432 33% 1,406 53%
Other countries 99 35% 99 37%
Total for Volvo Car Group 23,242 22% 22,881 22%
Number of Board members and senior executives1)
Dec 31, 2013
Of whom women
Dec 31, 2012
Of whom women
Parent company 4 0% 4 0%
Subsidiaries 98 (218)
18% (20%)
105 (209)
12% (22%)
Total for Volvo Car Group
102 (218)
109 (209)
2013 2012
Salaries and other remunerations, total for Volvo Car Group
Wages and salaries,
other remune-
rations
Social security
expenses (of which pension
expenses)
Wages and salaries,
other remune-
rations
Social security
expenses (of which pension
expenses)
Parent company 6 2 (–) 10 3 (–)
Subsidiaries 11,087 4,808 (2,194)
9,989 4,319 (2,021)
Total for Volvo Car Group
11,093 4,810 (2,194)
9,999 4,322 (2,021)
2013 2012
Salaries and other remunera-tion to the Board2), CeO, excecutive management team (eMT)3) and other employees
Wages and salaries,
other remunera-
tions (of which
variable salaries)
Social security
expenses (of which pension
expenses)
Wages and salaries,
other remunera-
tions (of which
variable salaries)
Social security
expenses (of which pension
expenses)
Board, Chief Executive Officer and EMT
194 (34)
108 (33)
145 (7)
103 (32)
Other employees
10,899 4,702 (2,161)
9,854 4,219 (1,989)
Total for Volvo Car Group
11,093 (34)
4,810 (2,194)
9,999 (7)
4,322 (2,021)
1) Senior excecutives are defined as key personnel within the subsidiaries. 2) The Board includes all board members in the subsidiaries within Volvo Car
Group.3) The Excecutive management team (EMT) consists of the CFO and key
management personnel other than board members. For further information regarding EMT, see Board of Directors’ report.
4) Previous year has been adjusted.
Volvo Car Group’s outstanding post-employee benefits obligations to
the Board members, Chief Executive Officer and EMT amount to SEK
113 million (101).
The notice period for a member of EMT is maximum 12 months in
case of termination by Volvo Car Corporation. Furthermore the employee
is, in that case, entitled to severance pay calculated based on the fixed
salary, during a period of maximum 12 months. During 2013, 3 (4)
37GEELy SwEDEN AB ANNUAL REPORT 2013

members of EMT, including the CFO, left the Volvo Car Group.
Remunerations during the notice period and severance pay amounted to
SEK 21 million (38), excluding social expenses.
INCeNTIVe PROGRAMMeSVolvo Car Group has two global incentive programmes; a short term
incentive programme (STI) including all employees and a long term
incentive programme for Executives and Senior Managers (LTI). The
design and payout of the programmes are subject to the Board of Direc-
tors’ annual approval.
The purpose of the STI-programme is to strengthen global alignment
among employees around Volvo Car Group’s vision, objectives and
strategies and to encourage all employees to achieve and exceed the
business plan targets in order to reach the long term targets.
The purpose of the LTI-programme is to attract, motivate and retain
key competence within Volvo Car Group. The LTI-programme is based on
calculated market value of Volvo Car Group.
NOTE 10 – DEPRECIATION AND AMORTISATION
Operating income includes depreciation and amortisation as specified below: 2013 2012
Software –265 –275
Capitalised product development cost –1,165 –711
Other intangible assets –1,263 –1,273
Buildings and land –471 –465
Machinery & equipment –3,772 –4,102
Assets under operating leases –971 –1,190
Total –7,907 –8,016
Depreciation and amortisation according to plan by function: 2013 2012
Cost of sales1) –4,707 –5,358
Research and development expenses –2,570 –2,078
Selling expenses –96 –78
Administrative expenses –343 –312
Other income and expense –191 –190
Total –7,907 –8,0161) Of which impairment loss SEK 7 million (50).
NOTE 11 – GOVERNMENT GRANTS
Volvo Car Group receives grants mainly from the Swedish Government.
Grants are also received in Belgium and from the EU. In 2013, the
government grants received amounted to SEK 81million (65) and the
government grants realised in the income statement amounted to SEK
76 million (116).
NOTE 12 – FINANCIAL INCOME
2013 2012
Interest income on bank deposits 87 120
Total 87 120
NOTE 13 – FINANCIAL EXPENSES
2013 2012
Net foreign exchange loss on financing activities –82 –151
Interest effect from the measurement of repurchase obligations –197 –172
Interest on loans from related companies – –218
Other interest expenses –333 –179
Other financial expenses –262 –333
Effect of changes in accounting policies – –127
Total –874 –1,180
NOTE 14 – INVESTMENTS IN ASSOCIATES
2013 2012
Share of income in associates 179 24
Total 179 24
Share of income in associates is specified below: 2013 2012
V2 Plug-In Hybrid Vehicle Partnership HB1) 114 –4
Volvofinans Bank AB2) 39 15
Other companies 26 13
Total 179 24
Dec 31, 2013
Dec 31, 2012
At beginning of the year/acquired acquisition value 550 340
Share of net income 179 24
Capital contribution (+)/repayment (-) V2 Plug-In Hybrid Vehicle Partnership HB1) –85 263
Investment in Daqing Volvo Car Manufacturing Co.Ltd3) 133 –
Investment in Zhangjiakou Volvo Car Engine Manufacturing Co Ltd 4) 387 –
Dividends –5 –14
Reclassification from previous year negative participation1) – –63
Total 1,159 550
38 GEELy SwEDEN AB ANNUAL REPORT 2013

Volvo Car Group’s carrying amount on investments in associates: Corp. ID no.
Country of incorporation % interest held Dec 31, 2013 Dec 31, 2012
Volvo Trademark Holding AB 556567-0428 Sweden 50 5 6
Volvohandelns PV-Försäljnings AB 556430-4748 Sweden 36 9 8
Volvohandelns PV-Försäljnings KB 916839-7009 Sweden 37 10 7
VCC Tjänstebilar KB 969673-1950 Sweden 37 2 2
VCC Försäljnings KB 969712-0153 Sweden 37 1 1
Göteborgs Tekniska College AB 556570-6768 Sweden 26 2 2
V2 Plug-In Hybrid Vehicle Partnership HB1) 969741-9175 Sweden 50 226 196
Volvofinans Bank AB2) 556069-0967 Sweden 10 337 303
IUC i Olofström AB 556263-1217 Sweden 18 – –
First Rent a Car AB 556434-7820 Sweden 45 52 24
Volvo Event Management Corporation 444517742 Belgium 33 1 1
Daqing Volvo Car Manufacturing Co.Ltd3) 100000400012348 China 30 133 –
Zhangjiakou Volvo Car Engine Manufacturing Co.Ltd4) 100000400012356 China 30 381 –
Carrying amount, participation in associates 1,159 550
The share of voting power corresponds to holdings in per cent as per
above.
For practical reasons, some of the associates are included in the
consolidated financial statements with a certain time lag, normally
one month.
1) V2 Plug-In Hybrid Vehicle Partnership HB is a joint venture, however reported in accordance with the equity method since none of the holding companies, Volvo Cars PHEV Holding AB and Vattenfall PHEV Holding AB, has the decision-making power over the operation. During 2013 V2 Plug-In Hybrid Vehicle Partnership HB received a shareholders’ contribution of SEK14 million (263) from Volvo Cars PHEV Holding AB. During 2013 V2 Plug-in Hybrid Vehi-cle Partnership HB provided a repayment of SEK 99 million (0) to Volvo Cars PHEV Holding AB. As per December 31, 2013 the total equity of V2 Plug-In Hybrid Vehicle Partnership HB amounted to SEK 233 million (403).
2) Volvo Car Group holds 10 per cent of the equity shares of Volvofinans Bank AB and due to significant volume transactions and board representation, Volvo Car Group exercises significant influence on the operations which qualifies for the use of the equity method. As per December 31, 2013 the total adjusted equity of Volvofinans Bank AB amounted to SEK 3,431 million ( 3,065).
3) Volvo Car Group holds 30 percent of Daqing Volvo Car Manufacturing Co.Ltd. The company is reported according to the equity method due to the ownership share. In 2013 the Daquing Volvo Car Manufacturing Co.Ltd received a share-holder contribution of SEK 133 million from Volvo Car Group. As per December 31, 2013 the total equity in Daqing Volvo Car Manufacturing Co Ltd amounted to SEK 444 million (-).
4) Volvo Car Group holds 30 percent of Zhangjiakou Volvo Car Engine Manu-facturing Co Ltd. The company is reported according to the equity method due to the ownership share. In 2013 the Zhangjiakou Volvo Car Engine Manufac-turing Co ltd received a shareholder contribution of SEK 387 million from Volvo Car Group. As per December 31, 2013 the total equity in Zhangjiakou Volvo Car Engine Manufacturing Co Ltd amounted to SEK 1,274 million (-).
39GEELy SwEDEN AB ANNUAL REPORT 2013

NOTE 15 – TAXES
Income tax recognised in income statement 2013 2012
Current income tax for the period –867 –610
Current income tax for previous years 15 20
Deferred taxes 680 1,042
Total –172 452
Information regarding current year tax expense compared to tax expense based on the applicable Swedish tax rate 2013 2012
Income before tax for the year 1,132 –994
Tax according to applicable Swedish tax rate1) –249 261
Capital gains or losses, non-taxable – 4
Effect of different tax rates –90 –1
Tax effect on deferred tax due to change of tax rate – 153
Utilisation of previously unrecognised tax losses –10 17
Revaluation of previously non-valued losses and other temporary differences 161 –
Other 16 18
Total –172 452
1 ) As from January1, 2013 the Swedish tax rate has been changed from 26,3% to 22%.
Income tax recognised directly in equity 2013 2012
Deferred tax
Tax effects on cash flow hedge reserve 3 39
Tax effect of remeasurement of provisions for post employment benefits 455 –28
Tax effects on translation difference, hedge instruments of net investments in foreign operations –28 13
Total 430 24
Specification of deferred tax assetsDec 31,
2013Dec 31,
2012
Goodwill arising from the purchase of the net assets of a business 333 360
Provision for employee benefits 769 1,146
Unutilised tax loss carry-forwards 4,067 3,174
Reserve for unrealised income in inventory 364 363
Provision for warranty 271 160
Other temporary differences 542 588
Total deferred tax assets 6,346 5,791
Netting of assets/liabilities –4,181 –3,971
Total deferred tax assets, net 2,165 1,820
Specification of deferred tax liabilitiesDec 31,
2013Dec 31,
2012
Fixed assets 5,873 5,511
Other temporary differences 67 16
Total deferred tax liabilities 5,940 5,527
Netting of assets/liabilities –4,181 –3,971
Total deferred tax liabillities, net 1,759 1,556
Deferred tax assets and deferred tax liabilities are offset when the item
relates to income taxes levied by the same taxation authority on either
the same taxable entity or different taxable entities which intend either
to settle current tax liabilities and assets on a net basis, or to realise the
assets and settle the liabilities simultaneously.
Deferred tax assets are only accounted for to the extent there are
taxable temporary differences or other factors that convincingly indicate
there will be sufficient future taxable profit. The main part of losses
carried forward is related to jurisdictions where temporary differences
exceed losses carried forward and where periods of utilisation are
in definite.
Deferred tax that may arise on distribution of remaining unrestricted
earnings of foreign subsidiaries has not been booked, hence they can
be distributed free of tax or Volvo Car Group may consider them perma-
nently reinvested in the subsidiaries.
Changes in deferred tax assets and liabilities during the reporting period
Dec 31, 2013
Dec 31, 2012
Net book value of deferred taxes at January 1 264 –735
Deferred tax income/expense recognised through income statement 681 1,042
Change in deferred taxes recognised directly in equity –430 –24
Exchange rate impact –109 –19
Net book value of deferred taxes at December 31 406 264
Unutilised tax-loss carryforwards expire as followsDec 31,
2013Dec 31,
2012
Due date
2014 – –
2015 – –
2016 – 14
2017 – 14
2018 25 –
2019- 18,023 14,525
Total 18,048 14,553
Significant tax loss carry forwards are related to countries with long or
indefinite periods of utilisation. Of the total unused tax loss carry for-
wards, SEK 0 million (SEK 99 million), relates to unused tax losses for
which no deferred tax asset is recognised in the statement of financial
position.
40 GEEly SwEDEN Ab ANNUAl REPORT 2013

NOTE 16 – INTANGIBLE ASSETS
SoftwareCapitalised productdevelopment cost1) ,2) Trademark
Other intangibleassets3) Total
Acquisition cost
balance at January 1, 2012 3,615 3,287 3,598 9,045 19,545
Additions 504 2,591 – 1 3,096
Divestments and disposals –446 – – – –446
Effect of foreign currency exchange differences –3 – – –4 –7
Balance at December 31, 2012 3,670 5,878 3,598 9,042 22,188
Additions 208 4,089 – – 4,297
Divestments and disposals –41 –1 – – –42
Effect of foreign currency exchange differences 8 – – –4 4
Balance at December 31, 2013 3,845 9,966 3,598 9,038 26,447
Accumulated amortisation and impairment
balance at January 1, 2012 –2,399 –279 – –2,027 –4,705
Amortisation expense –275 –711 – –1,273 –2,259
Divestments and disposals 440 – – – 440
Effect of foreign currency exchange differences 2 – – – 2
Balance at December 31, 2012 –2,232 –990 – –3,300 –6,522
Amortisation expense –265 –1,165 –1,263 –2,693
Divestments and disposals 45 1 – – 46
Effect of foreign currency exchange differences –9 – – 2 –7
Balance at December 31, 2013 –2,461 –2,154 – –4,561 –9,176
Net balance at December 31, 2012 1,438 4,888 3,598 5,742 15,666
Net balance at December 31, 2013 1,384 7,812 3,598 4,477 17,2711) Volvo Car Group has capitalised borrowing costs related to product development of SEK 108 million (38). A capitalisation rate of 4,8 % (5,4%) was used to determine the
amount of borrowing costs eligible for capitalisation.2) During 2013 additional areas of product development activities are reflected in the capitalised figures.3) Other intangible assets refers to licences, dealer network, patents and similar rights.
Intangible assets with indefinite useful lives, ie Trademark, and other
intangible assets not yet ready for use, are tested for impairment annu-
ally as well as if there are any indications of need for impairment. Assets
with definite useful lives are tested if there are any indications of need
for impairment. An impairment test is made by calculating the recover-
able value. If the recoverable value is less than the carrying value, the
asset’s recoverable value is impaired. The recoverable amounts are
based on a discounted cash flow model, with Volvo Car Group as one
single Cash Generating Unit. Management’s business plans and volume
programmes for 2014–2022 are used as a basis for the calculation. A
discount rate of 11.1% (11.1%) has been used. In 2013 the operating
cash flow exceeded the carrying amount, and no impairment loss was
recognised.
41GEEly SwEDEN Ab ANNUAl REPORT 2013
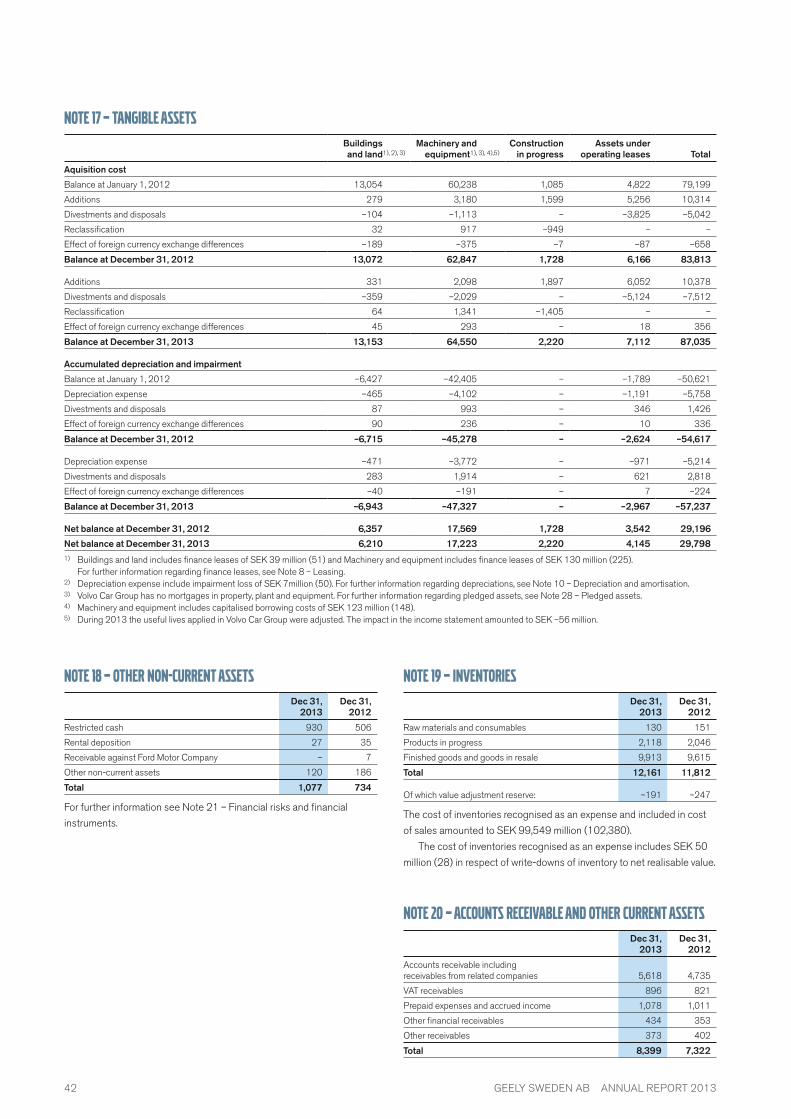
NOTE 17 – TANGIBLE ASSETS
Buildings and land1), 2), 3)
Machinery and equipment1), 3), 4),5)
Construction in progress
Assets under operating leases Total
Aquisition cost
balance at January 1, 2012 13,054 60,238 1,085 4,822 79,199
Additions 279 3,180 1,599 5,256 10,314
Divestments and disposals –104 –1,113 – –3,825 –5,042
Reclassification 32 917 –949 – –
Effect of foreign currency exchange differences –189 –375 –7 –87 –658
Balance at December 31, 2012 13,072 62,847 1,728 6,166 83,813
Additions 331 2,098 1,897 6,052 10,378
Divestments and disposals –359 –2,029 – –5,124 –7,512
Reclassification 64 1,341 –1,405 – –
Effect of foreign currency exchange differences 45 293 – 18 356
Balance at December 31, 2013 13,153 64,550 2,220 7,112 87,035
Accumulated depreciation and impairment
balance at January 1, 2012 –6,427 –42,405 – –1,789 –50,621
Depreciation expense –465 –4,102 – –1,191 –5,758
Divestments and disposals 87 993 – 346 1,426
Effect of foreign currency exchange differences 90 236 – 10 336
Balance at December 31, 2012 –6,715 –45,278 – –2,624 –54,617
Depreciation expense –471 –3,772 – –971 –5,214
Divestments and disposals 283 1,914 – 621 2,818
Effect of foreign currency exchange differences –40 –191 – 7 –224
Balance at December 31, 2013 –6,943 –47,327 – –2,967 –57,237
Net balance at December 31, 2012 6,357 17,569 1,728 3,542 29,196
Net balance at December 31, 2013 6,210 17,223 2,220 4,145 29,7981) buildings and land includes finance leases of SEK 39 million (51) and Machinery and equipment includes finance leases of SEK 130 million (225).
For further information regarding finance leases, see Note 8 – leasing.2) Depreciation expense include impairment loss of SEK 7million (50). For further information regarding depreciations, see Note 10 – Depreciation and amortisation.3) Volvo Car Group has no mortgages in property, plant and equipment. For further information regarding pledged assets, see Note 28 – Pledged assets.4) Machinery and equipment includes capitalised borrowing costs of SEK 123 million (148).5) During 2013 the useful lives applied in Volvo Car Group were adjusted. The impact in the income statement amounted to SEK –56 million.
NOTE 18 – OTHER NON-CURRENT ASSETS
Dec 31, 2013
Dec 31, 2012
Restricted cash 930 506
Rental deposition 27 35
Receivable against Ford Motor Company – 7
Other non-current assets 120 186
Total 1,077 734
For further information see Note 21 – Financial risks and financial
instruments.
NOTE 19 – INVENTORIES
Dec 31, 2013
Dec 31, 2012
Raw materials and consumables 130 151
Products in progress 2,118 2,046
Finished goods and goods in resale 9,913 9,615
Total 12,161 11,812
Of which value adjustment reserve: –191 –247
The cost of inventories recognised as an expense and included in cost
of sales amounted to SEK 99,549 million (102,380).
The cost of inventories recognised as an expense includes SEK 50
million (28) in respect of write-downs of inventory to net realisable value.
NOTE 20 – ACCOUNTS RECEIVABLE AND OTHER CURRENT ASSETS
Dec 31, 2013
Dec 31, 2012
Accounts receivable including receivables from related companies 5,618 4,735
VAT receivables 896 821
Prepaid expenses and accrued income 1,078 1,011
Other financial receivables 434 353
Other receivables 373 402
Total 8,399 7,322
42 GEEly SwEDEN Ab ANNUAl REPORT 2013

NOTE 21 – FINANCIAL RISKS AND FINANCIAL INSTRUMENTS
In its operations, Volvo Car Group is exposed to various types of financial
risks such as currency risk, interest rate risk, credit risk, commodity price
risk, refinancing risk and liquidity risk.
Volvo Car Group treasury function is responsible for management
and control of the financial risks. The management of financial risks is
governed by Volvo Car Group treasury policy which is approved by the
board of Directors and is subject to annual approval. The Policy is
focused on minimizing the negative effects from fluctuating financial
markets on Volvo Car Group’s financial earnings.
FINANCIAl INSTrUMeNTS – ClASSIFICATIONFinancial instruments are divided into three levels depending on the
market information available.
• level 1: level 1 inputs are quoted prices (unadjusted) in active
markets for identical assets or liabilities that the entity can access at
the measurement date.
• level 2: level 2 inputs are inputs other than quoted prices included
within level 1 that are observable for the asset or liability, either
directly or indirectly.
• level 3: level 3 inputs are unobservable inputs for the asset or liability.
All derivative financial instruments that Volvo Car Group holds as at
December 31, 2013 belong to level 2. No transfers between the levels
of the fair value hierarchy have occurred during the year. Financial assets
and liabilities are measured at amortised cost or fair value depending on
their initial classification. Fair value is defined as the price that would be
received to sell an asset or paid to transfer a liability in an orderly trans-
action between market participants at the measurement date. Amor-
tised cost is calculated using the effective interest method, where any
premiums or discounts and directly attributable costs and revenue are
capitalied over the contract period using the effective interest rate. Fair
value is generally determined by reference to official market quotes.
when market quotes are not available the fair value is determined using
generally accepted valuation methods such as discounted future cash
flows.
The fair value of a financial asset or liability reflects non-performance
risk including the counterparty’s credit risk for an asset and an entity’s
own credit risk for a liability. For Volvo Car Group this only applies to
derivatives and marketable securities since no other classes of assets
and liabilities are recorded at fair value. Volvo Car Group has chosen to
use PD (Probability of Default ) of the counterparty to adjust the positive
market value on derivatives and marketable securities. Own credit risk is
adjusted for by taking an average of the PD of a peer group of auto man-
ufacturers.
Aging analysis of accounts receivable and receivables from related companies
2013 Not due
1–30 days
overdue
30–90 days
overdue>90 days overdue Total
Accounts receivable gross 4,782 242 15 651 5,690
Provision doubtful accounts receivable –8 – –29 –35 –72
Accounts receivable net 4,774 242 –14 616 5,618
2012
Accounts receivable gross 4,245 131 166 334 4,876
Provision doubtful accounts receivable – – –5 –136 –141
Accounts receivable net 4,245 131 161 198 4,735
Accounts receivable amounting to SEK 5,618 million (4,735) includes provision for doubtful accounts receivable of SEK 72 million (141).
Change in provision for doubtful accounts receivable is as follows: 2013 2012
balance at January 1 141 131
Additions 24 58
Reversals –83 –44
write-offs –10 –3
Translation difference – –1
Balance at December 31 72 141
43GEEly SwEDEN Ab ANNUAl REPORT 2013

The table below shows Volvo Car Groups financial assets and liabilities at fair value
December 31, 2013 level 1 level 2 level 3 Total
Derivative instruments for hedging of currency risk in future commercial cash flows – 393 – 393
Electricity hedges – 18 – 18
Marketable securities – 88 – 88
Total assets – 499 – 499
Derivative instruments for hedging of currency risk in future commercial cash flows – 167 – 167
Derivative instruments for hedging of currency risk related to financial assets and liabilities – 70 – 70
Electricity hedges – 70 – 70
Total liabilities – 307 – 307
December 31, 2012
Derivative instruments for hedging of currency risk in future commercial cash flows – 326 – 326
Electricity hedges – 16 – 16
Total assets – 342 – 342
Derivative instruments for hedging of currency risk in future commercial cash flows – 119 – 119
Derivative instruments for hedging of currency risk and interest rate risk related to financial assets and liabilities – 39 – 39
Electricity hedges – 91 – 91
Total liabilities – 249 – 249
Financial assets and liabilities by category
Finacial instruments at fair value through profit or loss
December 31, 2013Instruments
held for trading
Derivatives used in hedge
accountingloans and
receivablesFinancial liabilities at amortised cost TOTAl Fair Value
Other non-current assets1) – – 1,054 – 1,054 1,054
Accounts receivable – – 5,618 – 5,618 5,618
Derivative assets 58 353 – – 411 411
Marketable securities 88 – – – 88 88
Other current assets1) – – 260 – 260 260
Cash and cash equivalents – – 15,372 – 15,372 15,372
Total assets 146 353 22,304 – 22,803 22,803
Other long-term liabilities1) – – – 792 792 792
liabilities to credit institutions – – – 12,853 12,853 12,853
Trade payables – – – 13,632 13,632 13,632
Derivative liabilities 143 164 – – 307 307
Other current liabilities1) – – – 3,460 3,460 3,460
Total liabilities 143 164 – 30,737 31,044 31,044
December 31, 2012
Other non-current assets1) – – 658 – 658 658
Accounts receivable – – 4,735 – 4,735 4,735
Derivative assets 55 287 – – 342 342
Other current assets1) – – 297 – 297 297
Cash and cash equivalents – – 9,607 – 9,607 9,607
Total assets 55 287 15,297 – 15,639 15,639
Other long-term liabilities1) – – – 676 676 676
liabilities to credit institutions – – – 7,367 7,367 7,367
Trade payables – – – 12,626 12,626 12,626
Derivative liabilities 140 109 – – 249 249
Other current liabilities1) – – – 2,896 2,896 2,896
Total liabilities 140 109 – 23,565 23,814 23,8141) Pre-payments, accruals, statutory receivables and liabilities are excluded, as this analysis is required only for financial instruments.
No financial assets and liabilities are offset in the balance sheet.
Derivative contracts are subject to master netting agreements (ISDA)
and the carrying amount of derivative assets that are not offset in the
balance amount to SEK 411 (342) million and the carrying amount of
the related derivative liabilities amount to SEK –307 million (–249).
No collateral has been received or posted. The carrying amount essen-
tially equals the fair value for all current items. For liabilities to credit
institutions, the carrying amount is a good estimate of the fair value
since this item mainly consists of loans that have a short interest fixing
term. For aging analysis regarding accounts receivable refer to Note 20
– Accounts receivable and other current assets. For aging analysis
regarding liabilities to credit institutions refer to Note 26 – Other non-
current liabilities. Trade payables are for the most part due within 60
days.
44 GEEly SwEDEN Ab ANNUAl REPORT 2013

Nominal amounts and fair values of derivative instruments
Derivative instruments for hedging of currency risk related to financial assets and liabilities
Dec 31, 2013 Dec 31, 2012
Nominal amount
Fair Value
Nominal amount
Fair Value
Foreign exchange swaps
– receivable position1) 39 – – –
– payable position2) 8,552 –70 3,568 –18
Forward contracts
– receivable position1) – – – –
– payable position2) – – 2,576 –21
Subtotal 8,591 –70 6,144 –39
Derivative instruments for hedging of currency risk in future commercial cash flows
Foreign exchange swaps
– receivable position1) 6,643 111 3,439 84
– payable position2) 5,968 –117 901 –6
Forward contracts
– receivable position1) 13,203 215 5,598 178
– payable position2) 3,904 –39 4,642 –103
Currency options
– receivable position1) 8,915 67 5,312 64
– payable position2) 853 –11 5,549 –10
Subtotal 39,486 226 25,441 207
electricity hedges
– receivable position1) –104 18 –80 16
– payable position2) 422 –70 517 –91
Subtotal 318 –52 437 –75
Total 48,395 104 32,022 931) Financial instruments included in the balance sheet under other current assets.2) Financial instruments included in the balance sheet under other current
liabilities.
CUrreNCy rISk MANAGeMeNTThe currency exposure arises from the production in various countries,
procurement and the mix of sales currencies and has a direct impact on
the Volvo Car Group’s operating income, balance sheet and cash flow as
well as the long-term competitiveness.
The currency risk is related to:
• expected future cash flows from sales and purchase in foreign
currencies (transaction risk)
• changes in value of loans and investments (translation risk)
• net assets and liabilities of foreign subsidiaries (translation risk)
Transaction riskThe sales to different markets in combination with purchases in different
currencies determine the transaction exposure.
Sales to markets other than Sweden generate transaction exposure.
For the majority of the sales Volvo Car Corporations’ invoices to national
sales companies are in local currencies. The total currency inflow was
distributed between EUR 25 (23)%, SEK 19 (18)%, CNy 15 (11)%,
USD 13 (18)%, GbP 6 (5)%, RUb 4 (5)% and other currencies 18
(20)%. The major part of the production is in the plants in Sweden and
belgium at cost mainly in EUR and SEK. The total currency outflow was
split into EUR 47 (50)%, SEK 30 (29)%, CNy 5 (4)%, JPy 5 (4) and
other currencies 13 (13)%.
The policy for transaction risk management states that up to 80 per
cent of the future expected cash flows in the coming 15 months can be
hedged with adequate financial instruments: options, forwards or com-
bined instruments with maturities matching expected timing of cash
flows. Hedging of cash flows with maturity more than 15 months
requires a board of Directors’ decision.
The currency exposure is expressed in terms of Cash Flow at Risk
(CFaR), which is the maximum loss at a 95 per cent confidence level in
one year. The CFaR is dependent on the cash flow forecast for the com-
ing 15 months, market volatility and correlations. The CFaR at year end
for the cash flows in one year, excluding hedges, was approximately SEK
3 billion. Another way of expressing the currency sensitivity in revenue
and cost in foreign currencies is to say that during 2013, a one per cent
change in SEK against major currencies, excluding currency hedges,
has a net impact on operating income of approximately SEK 127 million.
A steering model with a benchmark level of CFaR is decided and a
stipulated mandate to deviate from that benchmark is given to Group
Treasury.
Forward contracts and options are used to reduce the currency risk
in expected future cash flows from sales and purchase in foreign curren-
cies. At year end 39 (38) per cent of the forecasted cash flows in foreign
currencies the coming 15 months was hedged and during 2013 the
average hedge level has been 35 (32) per cent. The transaction expo-
sure in the Group, measured as Cash Flow at Risk (CFaR) based on 15
months net cash flows, is reduced by 46 per cent as of end December
2013.
Maturities of cash flow hedges (forwards and call options), in millions, local currency
Maturity eUr USD GBP CNy NOk rUB AUD CHF CAD PlN CZk
0–6 months 1,420 –664 –182 –4,188 –300 –6,348 –98 –86 –62 –62 –100
7–12 months 109 –308 – –1,000 – –2,047 –20 – –16 – –
>12 months – – – – – – – – – – –
Total 1,529 –972 –182 –5,188 –300 –8,395 –118 –86 –78 –62 –100
The average duration of the portfolio was 3 months (5 months). The fair value of the outstanding derivatives as at December 31, 2013 amounted to
SEK 226 million (207).
45GEEly SwEDEN Ab ANNUAl REPORT 2013

Hedge accountingHedge accounting is applied for cash flow hedging of currency risk and
for net investment of foreign operations. Gains and losses on the effec-
tive portions of derivatives designated under cash flow hedge account-
ing and net investment of foreign operations are recognized in other
comprehensive income.
The highly probable forecast transactions in foreign currencies that
are hedged are expected to occur at various dates during the next 15
months. Gains and losses recognized in the hedge reserve in equity on
forward foreign exchange contracts as at December 31, 2013 are
recognized in the income statement in the periods when the hedged
forecast transaction affects the income statement.
based on cash flow hedging portfolio, a one per cent change in the
Swedish krona (SEK) against major currencies has a net impact of SEK
39 million on other comprehensive income.
The cash flow hedge reserve in shareholders’ equity as at December
31, 2013 amounts to SEK 189 million (177) before tax. The ineffective-
ness in the cash flow hedges that has affected net income amounts to
SEK 4 million (–4). The hedge reserve for net investment of foreign
operations as at December 31, 2013 amounts to SEK –68 million (61)
before tax. No ineffectiveness has affected net income for 2013 and
2012.
Fair value of derivatives for cash flow hedging 2013 2012
Hedge reserve 189 177
recognised in other comprehensive income 189 177
Time value in options 37 29
Ineffective contracts – –8
Non hedge accounting – 9
recognised in other operating income and expenses 37 30
Fair value of financial instruments for hedging of net investment of foreign operations
Hedge reserve –68 61
recognised in other comprehensive income –68 61
Total fair value 158 268
Net gains/losses on derivative financial instruments recognised in the income statement
Net gains/losses recognised in other income and expenses 2013 2012
Gains/ losses on commercial currency hedges 836 –287
Total 836 –287
Translation riskTranslation risk in Volvo Car Group relates to the net assets in foreign
subsidiaries. This exposure can generate a positive or negative impact
on Group earnings or change the value of equity.
MSek eUr CNy GBP AUD USD Other Total
Investments in Foreign Operations 4,510 1,928 483 472 –118 1,016 8,291
Translation exposure 4,510 1,928 483 472 –118 1,016 8,291
A one per cent change in the Swedish krona against major currencies
has a net impact of approximately SEK 83 million. The translation risk is
primarily covered by matching the currency composition of debt with the
composition of assets. Part of the investments in operations in the Euro
zone is used for hedge accounting. The residual translation risk is part of
the strategic risk management and is not hedged with financial instru-
ments, the translation effect is recognized in equity.
Total translation effect of net investments in foreign operations was
SEK –160 million (–324). This effect does not impact the income state-
ment but is recognized in equity.
Volvo Car Group uses EUR 420 million of the EUR 922 million debt
to reduce the translation exposure on net investments in EUR. The cur-
rency gains or losses from the translation of the net investments in oper-
ations in EUR used for hedge accounting are recognized in other com-
prehensive income.
The currency risk arising from the part of the external debt of EUR
922 million that has not been used to hedge the net investments in EUR
is managed by currency swaps. Currency gains or losses from the cur-
rency swaps are recognized in the income statement and offset the cur-
rency gains or losses from the residual part of the loan.
The translation effect arising from the external debt of USD 466
million is naturally hedged by the translation effect on internal net receiv-
ables in USD, effects are recognized in the income statement.
Net gains/losses on derivative financial instruments recognised in the income statement 2013 2012
Net gains/ losses reported in financial income and expenses
Gains/ losses on foreign exchange swaps for hedging of external debt 141 –166
Gains/losses on foreign exchange swaps for liquidity hedging 54 –47
Gains/ losses on interest-rate swaps – 6
Total 195 –207
CAPITAl STrUCTUreVolvo Car Group treasury policy stipulates that the medium term objec-
tive is to have a capital structure that enables the company to deliver
according to the requirements in the business plan. The longer term
objective is to have a capital structure that enables investment grade
rating; currently Volvo Car Group has no external rating. The equity ratio
as per December 31, 2013 is 28 (29) per cent.
FUNDING AND lIqUIDITy rISk MANAGeMeNTlong term fundingAll draw down on new loans is evaluated against future liquidity needs
and investment plans. Volvo Car Group should for the coming 12 months
at any given time have available committed financing for investments
and maturing loans. To limit the risk of refinancing, debt maturing over
the next 12 months should not exceed 25 per cent of total debt. less
than 50 per cent of the long term debt should be re-financeable within 3
years.
During first quarter of 2013 a second tranche of EUR 107 million
was drawn from China Development bank (CDb) and in February 2013
46 GEEly SwEDEN Ab ANNUAl REPORT 2013

Volvo Car Group signed a new loan with Svensk Exportkredit of SEK
1,000 million, with maturity in 2016.
In the fourth quarter 2013, a new loan agreement for USD 800
million was signed with CDb, with maturity in 2021. In November USD
466 million was drawn. The loan will support Volvo Car Group in further
developing the product program. The majority of the remaining USD 334
million is expected to be drawn during 2014. The amortisation structure
and terms of this loan agreement are similar to the loan agreement of
EUR 922 million.
The outstanding amount of long term funding for Volvo Car Group as
per year end 2013 was SEK 11 919 (6 917) million. Remaining credit
duration of the outstanding facilities was 4.8 years.
Outstanding loans are shown below.
Funding CurrencyCommitted
Facilities Utilized Available Maturity
bank loan EUR 922 922 – 2020
bank loan USD 800 466 334 2021
bank loan SEK 1,000 1,000 – 2016
The repayment structure of outstanding long term funding is shown
below.
In relation to all external loans there are information undertakings
and covenants according to lMA (loan Market Association) standards.
These are monitored and calculated quarterly to fulfil the terms and con-
ditions stated in the financial agreements. Covenants are based on stan-
dard ratios such as EbITDA and Net debt.
liquidity risk managementliquidity risk is the risk that Volvo Car Group is unable to meet ongoing
financial obligations on time. In order to meet seasonal volatility in cash
requirements, Volvo Car Group shall always have committed back up
facilities or free cash available corresponding to 5 per cent or more of
net revenue. The rolling 12 months cash flow forecasts are the basis for
the risk assessment of the liquidity risk management.
As at December 31, 2013, Volvo Car Group had cash and cash
equivalents of SEK 15,372 million (9,607), approximately 13 (8) per
cent of net revenue.
Volvo Car Group has a revolving credit facility of 360 MEUR with a
bank group of six banks with maturity in 2016. The purpose of the
arrangement is to serve as back up facility. During 2013, the facility has
remained undrawn. Including backup facilities Volvo Car Group have 15
per cent as liquidity reserve.
INTereST rATe rISk MANAGeMeNTChanges in the interest rate levels will impact Volvo Car Group’s net
financial income/expense or the value of financial assets and liabilities.
The return on cash and cash equivalents, short term investments and
credit facilities are impacted by changes in the interest rates. The
exposure can be either direct from interest rate bearing debt or indirect
through leasing or other financing arrangements.
As at December 31, 2013, Volvo Car Group’s interest-bearing assets
consisted of cash in the form of cash at bank, short term deposits and
marketable securities. The average interest fixing term on these assets
was less than one month. The average interest fixing term on outstand-
ing loans was less than 6 months. The average cost of borrowing was
4.8 (5.4) per cent. A 100 basis points change in market interests would
have an impact of SEK 93 million (27) on interest expenses.
According to the policy the interest rate risk in Volvo Car Group’s net
cash position has a benchmark duration of 6 months. The policy allows a
deviation of –6/+3 months from the benchmark. At year end the dura-
tion was 5 (2) months.
COMMODITy PrICe rISk MANAGeMeNTChanges in commodity prices impact Volvo Car Group’s cash flow and
earnings. Volvo Car Group has large procurement volumes in steel,
aluminum, resin and rubber. Commodity price risk is managed both in
strategic (medium to long-term) and operating (short to medium-term)
levels of transaction risk. The strategic commodity price risk arises from
procurement mix of commodities and the impact on our long term
competitiveness. The management of the strategic commodity price risk
means primarily price management in the procurement contract using
price contract clauses or similar constructions and fixed prices with
suppliers. A one per cent change in the prices of commodities has an
impact on operating income of approximately SEK 73 million.
Volvo Car Group manages the changes in prices for electricity by
using forward contracts. The hedging is managed by Vattenfall Power
Management Ab on discretionary account with certain risk limits
decided by Volvo Car Group.
maturity profile of external loans
0
3,000
6,000
9,000
12,000
1,5000
Outstanding loans 2012Outstanding loans 2013
million SEK equivalent
2013 2014 2015 2016 2017 2018 2019 2020 2021
loan repayment structure
2013 2014 2015 2016 2017 2018 2019 2020 2021
loan Repayment Structure 2013 0 137 389 2,002 1,668 2,335 2,531 2,182 813
loan Repayment Structure 2012 0 105 455 766 1,154 1,544 1,609 1,285 0
47GEEly SwEDEN Ab ANNUAl REPORT 2013

Net gains/losses on derivative financial instruments recognised in the income statement 2013 2012
Net gains/losses recognised in operating income and expenses
Gains/losses on electricity hedges 22 –5
Total 22 –5
CreDIT rISk MANAGeMeNTVolvo Car Group’s credit risk focus mainly in counterparty risk in financial
market transactions, investments of cash surplus and counterparty risk
in connection with customer and dealer financing.
Financial counterparties The maximum amount exposed to financial
credit risk is the total of bank accounts, deposits with banks and market
value of outstanding derivatives. The maximum amount exposed to
credit risk for financial instruments is best represented by their carrying
amounts, see table ‘Financial assets and liabilities by category‘ in this
note. Investments of cash surplus are made in the money and capital
markets. All investments must meet the requirements of low credit risk
and high liquidity. All counterparties used for investments and derivative
transactions have credit rating A or better from one of the well-estab-
lished credit rating institutions and ISDA agreements are in place with all
counterparties used for derivative transactions which is required accord-
ing to Volvo Car Group treasury policy. limits are set and limit usage is
followed up for the Volvo Car Group treasury counterparties and depos-
its are diversified between relationship banks. Subsidiaries’ bank bal-
ances are diversified in order to limit credit risk.
Dealers, importers and other counterpartiesFor the credit risk in customer and dealer financing, the objective is to
have a sound and balanced credit portfolio and to engage in credit moni-
toring by means of detailed procedures which include follow-up and
repossession. In cases where the credit risk is considered unsatisfactory
a letter of credit or other instruments are used. The maximum amount
exposed to credit risk is the carrying amount of accounts receivable, see
table ‘Financial assets and liabilities by category’ in this note. For quanti-
fication of credit risk in accounts receivable refer to Note 20 – Accounts
receivable and other current assets.
NOTE 22 – MARKETABLE SECURITIES AND CASH AND CASH EQUIVALENTS
Marketable securities
Dec 31, 2013 Dec 31, 2012
Commercial paper 88 –
Total short-term investments 88 –
The investment has a term of more than three months from acquisition
date.
Cash and cash equivalents
Dec 31, 2013 Dec 31, 2012
Cash in banks 11,223 8,482
bank deposits 4,149 1,125
Total 15,372 9,607
Cash and Cash equivalents includes SEK 1,047 million (878) where lim-
itations exist, mainly liquid funds where exchange controls or other legal
restrictions apply. It is not possible to immediatly use the liquid funds in
other parts of Volvo Car Group, however there is normally no limitation
for use in the Group’s operation in the respective country.
NOTE 23 – EQUITY
The Share Capital of Geely Sweden Ab consists of 1,000,000,000
shares fully paid with a par value of 1 SEK and with voting rights of one
vote per share.
The Share premium relates to the business combination, through
contribution in kind.
Other Contributed Capital consists of contribution from Shanghai
Geely Zhaoyuan International Investment Co. ltd. The contribution was
initially received by Geely Sweden Holdings Ab from Shanghai Geely
Zhaoyuan International Investment Co. ltd. and was then given to Geely
Sweden Automotive Ab and thereafter to Geely Sweden Ab as an
unconditional shareholders’contribution.
The hedge reserve consists of the change in fair value of commercial
cash flow hedging instruments in cases where hedge accounting is
applied according to IAS 39, Financial Instruments: Recognition and
Measurement.
The currency translation reserve comprises all exchange rate
differences resulting from the translation of financial reports of foreign
operations that have prepared their financial reports in a currency other
than Volvo Car Group’s reporting currency. The parent company and
Volvo Car Group present their financial reports in Swedish kronor (SEK).
retained earnings comprises net income for the year and preceding
years.
Non-controlling interest refers to the share of equity that belongs to
external interests without a controlling influence.
Total equity consists of the sum of equity attributable to the owners of
the parent company and equity attributable to non-controlling interests.
At year end 2013 the Volvo Car Group’s total equity amounted to SEK
24,638 million (21,901-restated).
Change in other reserves 2013 2012
balance at January 1 138 –
Change in fair value of currency risk derivatives during the year 189 –160
Currency risk contracts recognised in the income statement1) –177 337
Tax attributable to items recognised in other comprehensive income –3 –39
Balance at December 31 147 1381) Included in the income statement under other operating income/expenses.
48 GEEly SwEDEN Ab ANNUAl REPORT 2013

Total of which Sweden of which Belgium Total of which Sweden of which Belgium
Financial year ending on Dec 31, 2013 Dec 31, 2013 Dec 31, 2013 Dec 31, 2012 Dec 31, 2012 Dec 31, 2012
Principal actuarial assumptions
weighted-average assumptions to determine benefit obligations
Discount rate 3.89% 4.00% 3.15% 3.52% 3.50% 3.05%
Rate of salary increase 3.20% 3.00% 3.17% 3.10% 3.00% 3.17%
Rate of price inflation 2.13% 2.00% 2.00% 2.08% 2.00% 2.00%
Rate of pension increases 2.16% 2.00% N/A 2.11% 2.00% N/A
weighted-average assumptions to determine net pension cost
Discount rate 3.52% 3.50% 3.06% 3.80% 3.50% 4.42%
Expected long-term rate of return on plan assets – – – 4.99% 4.75% 5.00%
Rate of salary increase 3.09% 3.00% 3.18% 3.52% 3.50% 3.17%
Rate of price inflation 2.08% 2.00% 2.00% 2.09% 2.00% 2.00%
Rate of pension increases 2.10% 2.00% N/A 2.12% 2.00% N/A
Mortality:
Assumptions regarding future mortality experience are set based on actuarial advice in accordance with published statistics and experience in each
territory. Mortality assumptions for Sweden are based on the same assumption recommended by the Financial Supervisory Authority (FFFS 2007:31),
a generational-based table but with one year “age set-back” i.e. a 65-year-old would have the life expectancy of a 64-year-old.
NOTE 24 – POST EMPLOYMENT BENEFITS
Volvo Car Group has various schemes for post-employment benefits,
mainly relating to pension plans. Other benefits can in some locations
include disability, life insurance and health benefits. Pension plans are
classified either as defined contribution or defined benefit plans. Volvo
Car Group has both defined contribution and defined benefit plans.
DeFINeD CONTrIBUTION PlANSUnder a defined contribution plan, Volvo Car Group pays fixed contri-
butions into a separate entity outside Volvo Car Group and will have no
future financial obligations. The contributions are recognised as
employee benefit expense in the income statement.
DeFINeD BeNeFIT PlANSDefined benefit plans are all plans that are not classified as defined
contribution plans. A defined benefit plan is a pension plan where the
employee will receive a defined pension benefit upon retirement, usually
dependent on factors such as age, years of service and compensation.
Volvo Car Group has defined benefit plans for qualifying employees in
some subsidiaries and the largest plans are in Sweden and belgium.
The largest plan overall is the Swedish ITP 2 plan which is a collectively
agreed pension plan for white collar employees. ITP 2 is a final salary-
based plan.
For the defined benefit plans operated, Volvo Car Group has the
obligation for the future benefits. Volvo Car Group’s defined benefit
plans are secured in three ways: as a liability in the balance sheet, assets
held in separate pension funds or funded through insurance payments.
The “funded through insurance payments” plans are defined benefit
plans accounted for as defined contribution plans. These plans in
Sweden are secured with the mutual insurance company Alecta.
The portion secured through insurance with Alecta refers to a
defined benefit plan that comprises several employers and is reported
according to a pronouncement by the Swedish Financial Reporting
board, UFR 3. For 2013, Volvo Car Group did not have access to the
information to report it´s proportinate share of the plan´s obligations,
assets under management and cost, that would make it possible to
report this plan as a defined benefit plan. The ITP 2 pension plan, which
is secured through insurance with Alecta, is therefore reported as a
defined contribution plan.
The collective funding ratio is of the market value of Alecta’s assets
as a percentage of the insurance obligations calculated according to
Alecta’s actuarial methods and assumptions, which do not conform to
IAS 19. The collective funding ratio should normally be allowed to vary
between 125 and 155 percent. At year end 2013, Alecta’s surplus in
the form of the collective funding ratio amounted to 148 percent (129).
In case local legal requirements exist, funded or unfunded plans are
credit insured with an external party.
49GEEly SwEDEN Ab ANNUAl REPORT 2013

Total of which Sweden of which Belgium Total of which Sweden of which Belgium
Financial year ending on Dec 31, 2013 Dec 31, 2013 Dec 31, 2013 Dec 31, 2012 Dec 31, 2012 Dec 31, 2012
Change in defined benefit obligation
Defined benefit obligation at beginning of year 14,602 9,866 1,908 13,492 9,342 1,529
Service cost 588 385 125 473 312 110
Interest expense 507 338 59 501 323 65
Cash flows –371 –217 –80 –369 –206 –91
Remeasurements –1,494 –1,806 266 655 87 356
Effect of changes in foreign exchange rates 80 – 68 -150 – –61
Benefit obligation at end of year 13,912 8,566 2,346 14,602 9,858 1,908
Change in fair value of plan assets
Fair value of plan assets at beginning of year 9,184 5,913 1,182 8,397 5,484 1,052
Interest income 335 207 41 318 192 49
Cash flows 90 – 61 100 – 62
Remeasurements 637 264 266 469 237 60
Effect of changes in foreign exchange rates 56 – 42 –100 – –41
Fair value of plan assets at end of year 10,302 6,384 1,592 9,184 5,913 1,182
Amounts recognised in the statement of financial position
Defined benefit obligation 13,912 8,565 2,346 14,602 9,866 1,908
Fair value of plan assets 10,302 6,384 1,592 9,184 5,913 1,182
Funded status 3,610 2,181 754 5,418 3,953 726
Net liability (asset) 3,610 2,181 754 5,418 3,953 726
Components of defined benefit cost
Service cost 588 385 125 472 312 109
Net interest cost 172 131 19 183 131 17
Remeasurements of Other long Term benefits 62 – 60 – – –
Administrative expenses and taxes 8 – – 6 – –
Total pension cost for defined benefit plans 830 516 204 661 443 126
Pension cost for defined contribution plans 1,480 1,321 123 1,324 1,187 116
Total pension cost recognised in Income Statement 2,310 1,837 327 1,985 1,630 242
Remeasurements (recognosed in OCI) –2,194 –2,070 –60 126 –142 297
Effect of changes in demographic assumptions 16 – – 11 – –
Effect of changes in financial assumptions –1,730 –1,748 –6 455 – 240
Effect of experience adjustments 157 –58 212 129 95 117
(Return) on plan assets (excluding interest income) –637 –264 –266 –469 –237 –60
Total defined benefit cost recognized in Income Statement and OCI –1,364 –1,554 144 787 301 423
50 GEEly SwEDEN Ab ANNUAl REPORT 2013

Total of which Sweden of which Belgium Total of which Sweden of which Belgium
Financial year ending on Dec 31, 2013 Dec 31, 2013 Dec 31, 2013 Dec 31, 2012 Dec 31, 2012 Dec 31, 2012
Net defined benefit liability (asset) reconciliation
Net defined benefit liability (asset) at the beginning of the year 5,418 3,953 726 5,094 3,858 477
Defined benefit cost included in P&l 830 515 203 661 443 126
Total remeasurements included in OCI –2,194 –2,070 –60 126 –142 297
Cash Flows –469 –217 –141 –474 –206 –153
Employer contributions –183 – –105 –205 – –118
Employer direct benefit payments –286 –217 –36 –269 –206 –35
Effect of changes in foreign exchanges rates 25 – 26 11 – –21
Total defined benefit liability (asset) as of end of year 3,610 2,181 754 5,418 3,953 726
Defined benefit obligation
Defined benefit obligation by participant status
Actives 8,038 4,247 2,166 8,408 5,164 1,712
Vested deferreds 2,489 1,809 122 2,864 2,182 144
Retirees 3,385 2,509 58 3,330 2,520 52
Total 13,912 8,565 2,346 14,602 9,866 1,908
History of experience gains and losses 2013 2012
Defined benefit obligation 13,912 14,602
Fair value of plan assets 10,302 9,184
Deficit/(surplus) 3,610 5,418
Difference between the expected and actual return on plan assets
Amount –637 –469
Per centage of plan assets –6% –5%
Experience (gain)/loss on plan liabilities – –
Amount 158 130
Per centage of present value of plan liabilities 1% 1%
Plan assets
Fair value of plan assets 2013
Of which with a
quoted market price
Cash and cash equivalents 333 5
Equity instruments 2,262 931
Debt instruments 2,791 609
Real estate 9 –
Investment funds 3,243 178
Other 1,664 308
Total 10,302 2,031
The responsibility for governance of the pension plans and the plan
assets lies with the Company and Volvo Personvagnar’s Pension Fund.
Volvo Personvagnar’s Pension Fund is managed internally on the basis
of capital preservation strategy and the risk profile is set accordingly. The
investment horizon is long-term and the asset allocation ensures that
the investment portfolios are well diversified.
risksThere are mainly three categories of risks related to defined benefit obli-
gations and pension plans. The first category relates to risks affecting
the actual pension payments. Increased longevity and inflation of salary
and pensions are the principle risks that may increase the future pen-
sion payments, and hence, increase the pension obligation. The second
category relates to investment return. Pension plan assets are invested
in a variety of financial instruments and are exposed to market fluctua-
tions. Poor investment return may reduce the value of investments and
render them insufficient to cover future pension payments. The final cat-
egory relates to measurement and affects the acounting for pensions.
The discount rate used for measuring the present value of the obligation
may fluctuate which impacts the valuation of the defined benefit obliga-
tion. The discount rate also impacts the size of the interest income and
expense that is reported in the Financial items and the service cost. The
risk related to pension obligations, e.g., mortality exposure discount rate
and inflation, are monitored on an ongoing basis.
below is the sensitivity analysis for the main financial assumption and
the potential impact on the present value of the defined benefit obliga-
tion on the major plans.
Sensitivity analysis on defined benefit obligation Total
Discount rate +0,5% –1,000
Discount rate –0,5% 1,000
51GEEly SwEDEN Ab ANNUAl REPORT 2013

NOTE 25 – CURRENT AND OTHER NON–CURRENT PROVISIONS
Warranties Service contractsOther sales generated
obligations Other provisions Total
Balance at January 1, 2013 5,001 3,313 3,302 1,477 13,093
Provided for during year 3,210 3,044 7,668 7,043 20,965
Utilised during year –2,928 –3,193 –7,123 –6,246 –19,490
Reversal of unutilised amounts –531 – –86 –185 –802
Translational differences and other –58 –82 13 –8 –134
Balance at December 31, 2013 4,694 3,082 3,774 2,081 13,632
Of which current 1,993 879 3,774 1,523 8,169
Of which non–current 2,701 2,203 – 558 5,463
For additional information regarding accounting principles for provisions, see Note 1 – Accounting principles and Note 2 – Critical accounting esti-
mates and judgements..
NOTE 26 – OTHER NON - CURRENT LIABILITIES
Dec 31, 2013
Dec 31, 2012
Liabilities to credit institutions and finance lease contracts
Liabilities to credit institutions 11,919 6,917
Liabilities related to finance lease contracts 114 140
Total 12,033 7,057
LiaBiLiTieS TO creDiT inSTiTuTiOnSLiabilities to credit institutions mature until 2021 (2020). The average
cost of borrowing paid 2013 amounted to 4.8% (5.4%). In 2013 the
shares of Geely Sweden AB and Volvo Car Corporation were pledged for
the liabilities to credit institutions of SEK 10,919 million (In 2012 the
libilities for which a share pledge was provided amounted to SEK 6,917
milion).
Dec 31, 2013
Dec 31, 2012
Other long-term liabilities
Liabilities related to repurchase agreements 745 627
Deferred leasing revenue 420 393
Effect of remeasurement of other long-term liabilities for payroll taxes – –12
Other liabilities 47 49
Total 1,212 1,057
Dec 31, 2013
Dec 31, 2012
repayment structure of liabilities to credit institutions
1–5 years 8,924 2,480
Over 5 years 2,995 4,437
Total 11,919 6,917
exposure of interest rate changes related to liabilities to credit institutions
6 months or less 11,919 6,917
1–5 years – –
Total 11,919 6,917
The carrying amounts of Volvo car Group’s liabilities to credit institutions are denominated in the following currencies:
Dec 31, 2013
Dec 31, 2012
EUR 7,964 6,917
USD 2,955 –
SEK 1,000 –
Total 11,919 6,917
Volvo car Group has the following undrawn borrowing facilities:
Floating rate
– Expiring within one year 2,159 919
- Expiring after one year but within five years 3,202 -
Total 5,361 919
NOTE 27 – OTHER CURRENT LIABILITIES
Dec 31, 2013
Dec 31, 2012
Accrued expenses and prepaid income 5,624 5,306
Liabilities related to repurchase agreements 3,460 2,896
Personnel related liabilities 2,906 2,592
VAT liabilities 1,475 934
Hedging instruments 308 249
Deferred leasing revenue 549 493
Other liabilities 933 690
Total 15,255 13,160
NOTE 28 – PLEDGED ASSETS
Dec 31, 2013
Dec 31, 2012
Shares in subsidiaries 14,844 16,662
Restricted cash 930 507
Inventory 486 –
Other pledged assets 1 1
Total 16,261 17,170
52 GEELy SwEDEN AB ANNUAL REPORT 2013

NOTE 29 – CONTINGENT LIABILITIES
Dec 31, 2013
Dec 31, 2012
Investment commitments in contractual manufacturer 266 349
Share of packaging supply in logistic company – 208
Guarantees to insurance company FPG 116 112
Legal claims 113 –
Other contingent liabilities1) 70 39
Total 565 7081) Apart from the above contingent liabilities, there are other commitments and
guarantees that are not recognised since the likelihood of an outflow of resources is very low. Legal proceedings are further explained in note 2 - Critical accounting estimates and judgements.
NOTE 30 – CASH FLOW STATEMENTS
2013 2012
adjustments for items not affecting cash flow consist of:
Capital gains/losses on sale of tangible and intangible assets 33 36
Share of income in associates –179 –24
Interest effect from the measurement of repurchase obligations –197 –172
Shareholders’contribution to associates offset against invoiced services –14 –263
Effect of changes in accounting policies – –48
Other non-cash items 76 61
Total –281 –410
Acquisition of the remaining shares in Pininfarina Sverige AB (Volvo Car
Uddevalla AB) is classified as an investing activity and is included in
“Investments in shares and participation”.
Sale of intagible assets relates to a sale of technology of a Volvo
platform to Geely Group Ltd Co. The sale was recognised in the Income
statement in 2012 and payment was received during 2013, which has
affected this year’s cash flow from investing activities by 500 MSEK.
NOTE 31 – cHANGES IN ACCOUNTING PRINCIPLES
The revised employee benefit standard IAS 19 introduces changes to
the recognition, measurement, presentation and disclosure of post-
employment benefits. The standard also requires net interest expense/
income to be calculated as the product of the net defined benefit liabil-
ity/asset and the discount rate as determined at the beginning of the
year. The effect of this is to remove the previous concept of recognizing
an expected return on plan assets.
The new principles have been adopted retrospectively as stated
below:
impact of changes in accounting policy on the consolidated income statement
SeK millionDec 31,
2012adopt
iaS 19Dec 31, 2012
(restated)
Gross income 19,947 – 19,947
Operating expenses/income –19,929 48 –19,881
Operating income 18 48 66
Financial expenses/income –933 –127 –1,060
income before tax –915 –79 –994
Income tax 435 17 452
net income –480 –62 –542
impact of changes in accounting policy on the consolidated statement of comprehensive income
SeK millionDec 31,
2012adopt
iaS 19Dec 31, 2012
(restated)
Net income for the year –480 –62 –542
Other comprehensive income, net of income tax
Items that will not be reclassified susequently to income state-ment: – –98 –98
Items that may be reclassified susequently to income state-ment: –138 –138
–618 –160 –778
Total comprehensive income for the year –618 –160 –778
Total comprehensive income attributable to
Owners of the parent company –668 –160 –828
Non-controlling interests 50 – 50
Total –618 –160 –778
Cont. note 31
impact of changes in accounting policy on the consolidated balance sheet
SeK million Jan 1, 2012 adopt iaS 19Jan 1, 2012
(restated) Dec 31, 2012 adopt iaS 19Dec 31, 2012
(restated)
assets
Deferred tax assets 1,636 103 1,739 1,701 118 1,820
Non current assets 44,582 – 44,582 46,156 – 46,156
Total non-current assets 46,218 103 46,321 47,857 118 47,976
Total current assets 34,242 – 34,242 28,829 – 28,829
Total assets 80,460 103 80,563 76,686 118 76,804
equity & liabilities
Total equity 22,648 –1,483 21,165 23,544 –1,643 21,901
Provisions for post employee benefits 2,846 2,298 5,144 2,948 2,545 5,493
Deferred tax liabilities 2,790 –316 2,474 1,902 –346 1,556
Non-current liabilities 15,433 –396 15,037 14,462 –438 14,024
Total non-current liabilities 21,069 1,586 22,655 19,312 1,761 21,073
Total current liabilities 36,743 – 36,743 33,830 – 33,830
Total equity & liabilities 80,460 103 80,563 76,686 118 76,804
53GEELy SwEDEN AB ANNUAL REPORT 2013

SEK million Note 2013 2012
Other income 15 51
Gross income 15 51
Administrative expenses 3 –13 –13
Other operating income 1 –
Other operating expenses –2 –142
Operating income 4 1 –104
Financial income 5 30 500
Financial expenses 5 –103 –742
Income before tax –72 –346
Appropriation to tax allocation reserve – 12
Income tax 6 14 43
Net income –58 –291
Other comprehensive income and net income are consistent since there are no items in other comprehensive income.
INCOME STATEMENTS AND COMPREHENSIVE INCOME – PARENT COMPANY
54 geely sweden Ab AnnUAl RePORT 2013
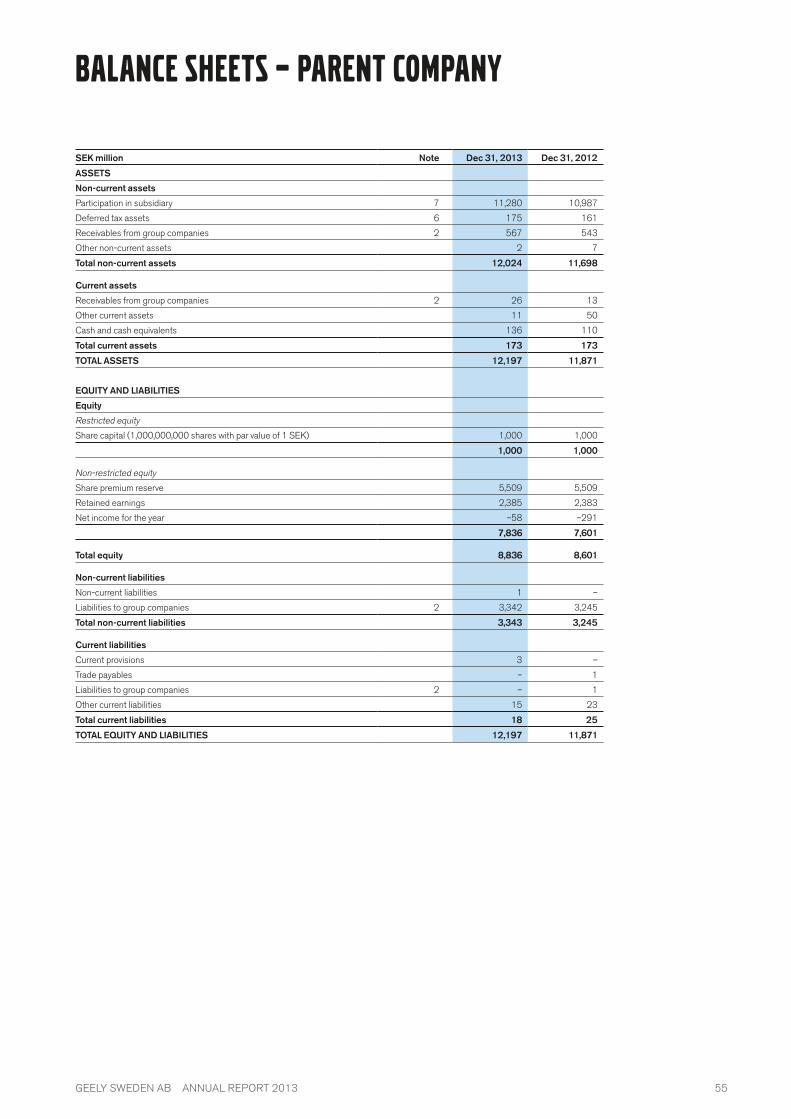
SEK million Note Dec 31, 2013 Dec 31, 2012
ASSETS
Non-current assets
Participation in subsidiary 7 11,280 10,987
deferred tax assets 6 175 161
Receivables from group companies 2 567 543
Other non-current assets 2 7
Total non-current assets 12,024 11,698
Current assets
Receivables from group companies 2 26 13
Other current assets 11 50
Cash and cash equivalents 136 110
Total current assets 173 173
TOTAL ASSETS 12,197 11,871
EQUITY AND LIABILITIES
Equity
Restricted equity
share capital (1,000,000,000 shares with par value of 1 seK) 1,000 1,000
1,000 1,000
non-restricted equity
share premium reserve 5,509 5,509
Retained earnings 2,385 2,383
net income for the year –58 –291
7,836 7,601
Total equity 8,836 8,601
Non-current liabilities
non-current liabilities 1 –
liabilities to group companies 2 3,342 3,245
Total non-current liabilities 3,343 3,245
Current liabilities
Current provisions 3 –
Trade payables – 1
liabilities to group companies 2 – 1
Other current liabilities 15 23
Total current liabilities 18 25
TOTAL EQUITY AND LIABILITIES 12,197 11,871
BALANCE SHEETS – PARENT COMPANY
55geely sweden Ab AnnUAl RePORT 2013

Restricted equity Non-restricted equity
SEK million Share CapitalShare premium
reserveOther contributed
capital Retained earnings Total Total equity
Balance at January 1, 2012 1,000 5,509 1,127 –523 6,113 7,113
Net income – – – –291 –291 –291
Transactions with owners
Unconditional shareholder’s contribution – – 1,779 – 1,779 1,779
Balance at December 31, 2012 1,000 5,509 2,906 –814 7,601 8,601
Net income – – – –58 –58 –58
Transactions with owners
Unconditional shareholder’s contribution – – 293 – 293 293
Balance at December 31, 2013 1,000 5,509 3,199 –872 7,836 8,836
CHANGES IN EQUITY – PARENT COMPANY
STATEMENT OF CASH FLOWS– PARENT COMPANY
SEK million Note 2013 2012
OPERATING ACTIVITIES
Operating income 1 –104
Interest and similar items received – 243
Interest and similar items paid – –236
Adjustments for items not affecting cash flow 9 5 141
6 44
Movements in working capital
Change in other current receivable 28 61
Change in accounts payable –1 –
Change in provisions 4 –
Change in provisions working capital liabilities –9 –13
Cash flow from movements in working capital 22 48
Cash flow from operating activities 28 92
SEK million Note 2013 2012
INVESTING ACTIVITIES
Investments in shares and participations –293 –13
Cash flow from investing activities –293 –13
Cash flow from operating and investing activities –265 79
FINANCING ACTIVITIES
Proceeds from borrowings – 1,337
Repayments of borrowings – –1,362
Received shareholders contribution 293 12
Cash flow from financing activities 293 –13
Cash flow for the year 28 66
Cash and cash equivalents at beginning of year 110 47
exchange difference on cash and cash equivalents –2 –3
Cash and cash equivalents at end of year 136 110
56 geely sweden Ab AnnUAl RePORT 2013

NOTE 1 – ACCOUNTING PRINCIPLES
The parent company has been prepared in compliance with Swedish
Annual Accounts Act and Recommendation RFR 2, Accounting for
Legal Entities of the Swedish Financial Reporting Board. There are no
effects of the transition. RFR 2 implies that the parent company in the
Annual Report of a legal entity shall apply all International Financial
Reporting Standards and interpretations approved by the EU as far as
this is possible within the framework of the Annual Accounts Act and
taking into account the connection between reporting and taxation.
The operation of the parent company consist for the most part of
share ownership in Group companies and financing. Volvo Car Group’s
accounting principles apply except for the following areas:
Income taxesDue to the relationship between accounting and taxation, the deferred
tax liability on untaxed reserves are included in the untaxed reserves.
shares In subsIdIarIesThe shares in subsidiaries are accounted for according to the acquisition
cost method. Acquisition-related costs directly atttributable to the acqui-
sition are capitalised as part of the participation in Geely Sweden AB.
Investments are carried at cost and only dividends are accounted for in
the income statement. An impairment test is performed annually and
write-downs are made when permanent decline in value is established.
FInancIal assetsFinancial assets that are intended as a long-term investment are carried
at cost. Impairment tests are conducted annually and impairment losses
are recognised if it is likely that a decline in value is permanent.
Transaction costs directly attributable to the acquisition of Volvo Car
Corporation in 2010 have been accounted for as an increase in the
carrying amount of the shares.
hedgIngThe parent company hedges future interest flows related to assets and
liabilities. When hedging future interest flows, hedging instruments are
not revalued at the exchange rate fluctuations. Instead the entire effect
of changes in exchange rates is recognised in the income statement
when the hedging instrument matures.
In cases where the parent company holds derivative financial instru-
ments not used for hedging receivables and liabilities in foreign currency
or interest flows associated with these, they are reported at the lower of
cost and net realisable value.
equItyIn accordance with the Swedish Annual Accounts Act, the equity is split
between restricted and non-restricted equity.
shareholders’ contrIbutIonShareholders’ contributions are recognised in shares in subsidiaries
and as such they are subject to impairment testing.
NOTE 2 – related parties
During the year, the parent company entered into the following transactions with related parties:
Part of sales to related parties Part of purchases from related parties
2013 2012 2013 2012
Companies within the Volvo Car Group 100% 100% 71% 43%
receivables from liabilities to
2013 2012 2013 2012
Companies within the Volvo Car Group 592 556 3,342 3,246
Geely Sweden Holdings AB 1 – – –
– whereof short-term 26 13 – 1
593 556 3,342 3,246
Of the total receivables from related parties, SEK 594 million (556) is
due within five years. Of the total liabilities to related parties SEK 3,342
million (3,246) is due within five years.
Business transactions between the parent company and related
parties all arise in the normal course of business and are conducted on
the basis of arm’s length principles.
During 2013 the company has received an unconditional share-
holders’ contribution from Geely Sweden Automotive AB amounting to
SEK 293 million (1,779). The contribution was initially received by Geely
Sweden Holding AB from Shanghai Geely Zhaoyuan International
Investment Co Ltd and was then given to Geely Sweden Automotive AB
as an unconditional shareholders’ contribution.
Volvo Car Group does not engage in any transactions with Board
members or senior executives except ordinary remunerations for ser-
vices. For further information regarding remunerations, see Note 9 –
Employees and remuneration in the consolidated statements.
NOTES TO THE parent company FINANCIAL STATEMENTSAll amounts are in SEK million unless otherwise stated.
Amounts in brackets refer to the preceding year.
57GEELy SWEDEN AB ANNUAL REPORT 2013
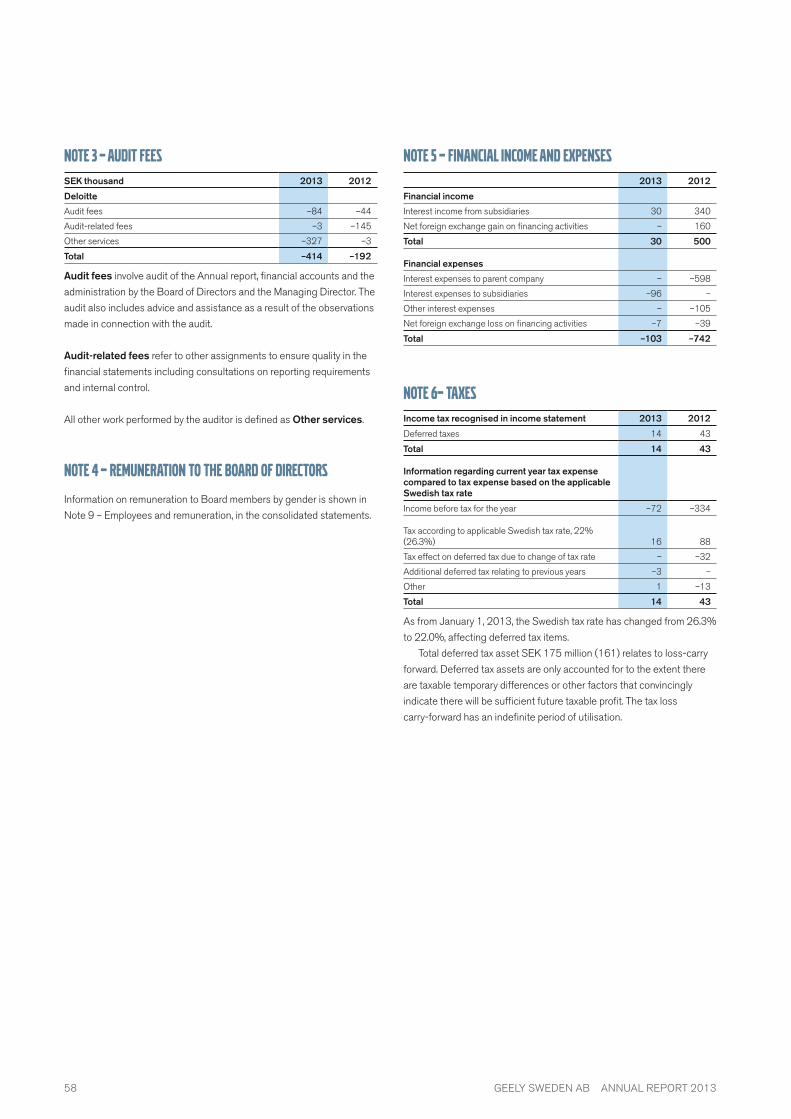
NOTE 3 – AUDIT FEES
seK thousand 2013 2012
deloitte
Audit fees –84 –44
Audit-related fees –3 –145
Other services –327 –3
total –414 –192
audit fees involve audit of the Annual report, financial accounts and the
administration by the Board of Directors and the Managing Director. The
audit also includes advice and assistance as a result of the observations
made in connection with the audit.
audit-related fees refer to other assignments to ensure quality in the
financial statements including consultations on reporting requirements
and internal control.
All other work performed by the auditor is defined as other services.
NOTE 4 – REMUNERATION TO THE BOARD OF DIRECTORS
Information on remuneration to Board members by gender is shown in
Note 9 – Employees and remuneration, in the consolidated statements.
NOTE 5 – FINANCIAL INCOME AND EXPENSES
2013 2012
Financial income
Interest income from subsidiaries 30 340
Net foreign exchange gain on financing activities – 160
total 30 500
Financial expenses
Interest expenses to parent company – –598
Interest expenses to subsidiaries –96 –
Other interest expenses – –105
Net foreign exchange loss on financing activities –7 –39
total –103 –742
NOTE 6– TAXES
Income tax recognised in income statement 2013 2012
Deferred taxes 14 43
total 14 43
Information regarding current year tax expense compared to tax expense based on the applicable swedish tax rate
Income before tax for the year –72 –334
Tax according to applicable Swedish tax rate, 22% (26.3%) 16 88
Tax effect on deferred tax due to change of tax rate – –32
Additional deferred tax relating to previous years –3 –
Other 1 –13
total 14 43
As from January 1, 2013, the Swedish tax rate has changed from 26.3%
to 22.0%, affecting deferred tax items.
Total deferred tax asset SEK 175 million (161) relates to loss-carry
forward. Deferred tax assets are only accounted for to the extent there
are taxable temporary differences or other factors that convincingly
indicate there will be sufficient future taxable profit. The tax loss
carry-forward has an indefinite period of utilisation.
58 GEELy SWEDEN AB ANNUAL REPORT 2013

NOTE 7 – PARTICIPATION IN SUBSIDIARY
dec 31, 2013
dec 31, 2012
At beginning of the year/acquired acquisition value 10,987 10,974
Shareholders´contribution 293 13
total 11,280 10,987
geely sweden ab’s investments in subsidiaries: corp. Id no. registered office no. of shares % interest held
book value dec 31, 2013
book value dec 31, 2012
Volvo Car Corporation 556074-3089 Göteborg 1,000,000,000 100 11,280 10,987
The share of voting power corresponds to holdings in per cent as per above.
NOTE 8 – PLEDGED ASSETS
dec 31, 2013
dec 31, 2012
Shares in Volvo Car Corporation 11,280 10,987
total 11,280 10,987
Pledged shares in subsidiaries per December 31, 2013 refer to a
loan in Volvo Car Corporation.
NOTE 9 – CASH FLOW STATEMent
Adjustments for items not affecting cash flow consist of:
2013 2012
Reversal of transaction costs in connction with refi-nancing – 38
Unrealised foreign exchange losses - 103
Other non-cash items 5 -
5 141
59GEELy SWEDEN AB ANNUAL REPORT 2013
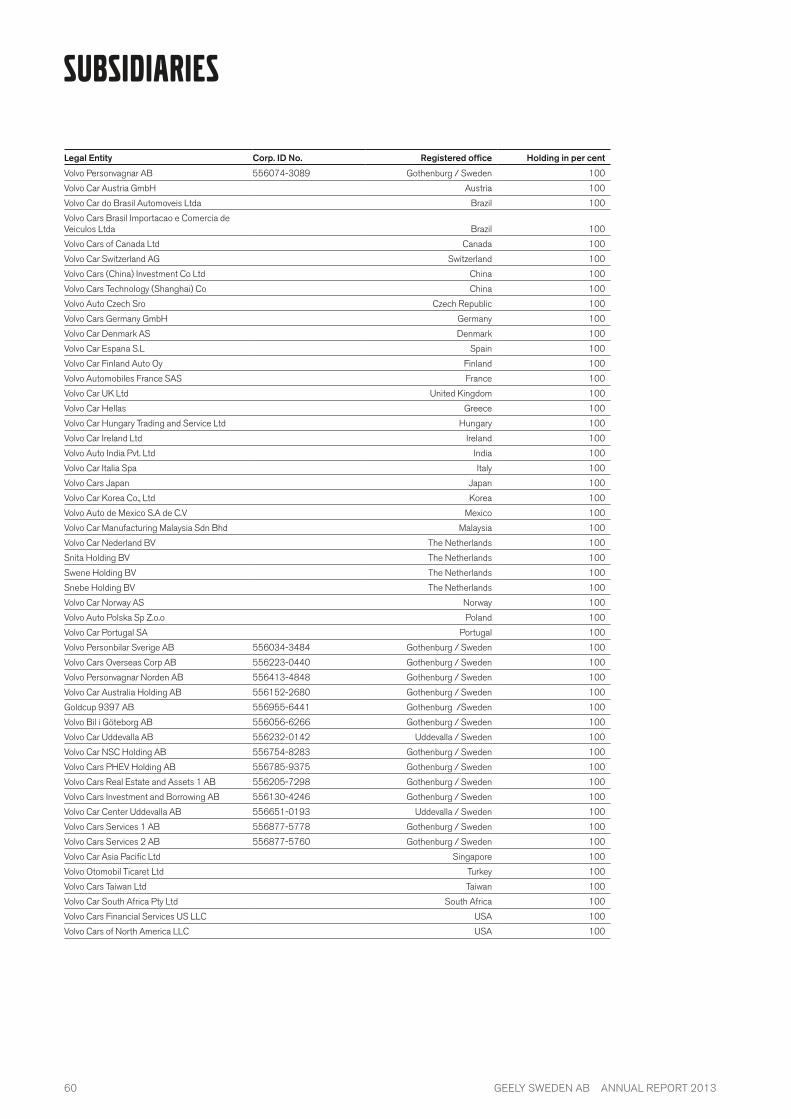
Legal Entity Corp. ID No. Registered office Holding in per cent
Volvo Personvagnar AB 556074-3089 Gothenburg / Sweden 100
Volvo Car Austria GmbH Austria 100
Volvo Car do Brasil Automoveis Ltda Brazil 100
Volvo Cars Brasil Importacao e Comercia de Veiculos Ltda Brazil 100
Volvo Cars of Canada Ltd Canada 100
Volvo Car Switzerland AG Switzerland 100
Volvo Cars (China) Investment Co Ltd China 100
Volvo Cars Technology (Shanghai) Co China 100
Volvo Auto Czech Sro Czech Republic 100
Volvo Cars Germany GmbH Germany 100
Volvo Car Denmark AS Denmark 100
Volvo Car Espana S.L Spain 100
Volvo Car Finland Auto Oy Finland 100
Volvo Automobiles France SAS France 100
Volvo Car UK Ltd United Kingdom 100
Volvo Car Hellas Greece 100
Volvo Car Hungary Trading and Service Ltd Hungary 100
Volvo Car Ireland Ltd Ireland 100
Volvo Auto India Pvt. Ltd India 100
Volvo Car Italia Spa Italy 100
Volvo Cars Japan Japan 100
Volvo Car Korea Co., Ltd Korea 100
Volvo Auto de Mexico S.A de C.V Mexico 100
Volvo Car Manufacturing Malaysia Sdn Bhd Malaysia 100
Volvo Car Nederland BV The Netherlands 100
Snita Holding BV The Netherlands 100
Swene Holding BV The Netherlands 100
Snebe Holding BV The Netherlands 100
Volvo Car Norway AS Norway 100
Volvo Auto Polska Sp Z.o.o Poland 100
Volvo Car Portugal SA Portugal 100
Volvo Personbilar Sverige AB 556034-3484 Gothenburg / Sweden 100
Volvo Cars Overseas Corp AB 556223-0440 Gothenburg / Sweden 100
Volvo Personvagnar Norden AB 556413-4848 Gothenburg / Sweden 100
Volvo Car Australia Holding AB 556152-2680 Gothenburg / Sweden 100
Goldcup 9397 AB 556955-6441 Gothenburg /Sweden 100
Volvo Bil i Göteborg AB 556056-6266 Gothenburg / Sweden 100
Volvo Car Uddevalla AB 556232-0142 Uddevalla / Sweden 100
Volvo Car NSC Holding AB 556754-8283 Gothenburg / Sweden 100
Volvo Cars PHEV Holding AB 556785-9375 Gothenburg / Sweden 100
Volvo Cars Real Estate and Assets 1 AB 556205-7298 Gothenburg / Sweden 100
Volvo Cars Investment and Borrowing AB 556130-4246 Gothenburg / Sweden 100
Volvo Car Center Uddevalla AB 556651-0193 Uddevalla / Sweden 100
Volvo Cars Services 1 AB 556877-5778 Gothenburg / Sweden 100
Volvo Cars Services 2 AB 556877-5760 Gothenburg / Sweden 100
Volvo Car Asia Pacific Ltd Singapore 100
Volvo Otomobil Ticaret Ltd Turkey 100
Volvo Cars Taiwan Ltd Taiwan 100
Volvo Car South Africa Pty Ltd South Africa 100
Volvo Cars Financial Services US LLC USA 100
Volvo Cars of North America LLC USA 100
Subsidiaries
60 GEELy SwEDEN AB ANNUAL REPORT 2013

Signatures
Stockholm, April 24 2014
Li Shufu Hans-Olov Olsson Chairman of the Board Board member
Zhang Ran Li Donghui Board member Board member
Our audit report was submitted, April 24 2014
Deloitte AB
Jan NilssonAuthorized Public Accountant
61GEELy SwEDEN AB ANNUAL REPORT 2013
AUDITOR’S REPORT
To the annual meeting of the shareholders of Geely Sweden ABCorporate identity number 556798-9966This is a translation of the Swedish language original in the events of
any differences between this translation and the Swedish original the
latter shall prevail.
REpORT ON THE ANNuAL ACCOuNTS AND CONSOLIDATED ACCOuNTS we have audited the annual accounts and consolidated accounts of
Geely Sweden AB for the financial year 2013-01-01 – 2013-12-31.
Responsibilities of the Board of Directors for the annual accounts and consolidated accountsThe Board of Directors are responsible for the preparation and fair
presentation of these annual accounts in accordance with the Annual
Accounts Act and of the consolidated accounts in accordance with
International Financial Reporting Standards, as adopted by the EU, and
the Annual Accounts Act, and for such internal control as the Board of
Directors determine is necessary to enable the preparation of annual
accounts and consolidated accounts that are free from material mis-
statement, whether due to fraud or error.
Auditor’s responsibilityOur responsibility is to express an opinion on these annual accounts and
consolidated accounts based on our audit. we conducted our audit in
accordance with International Standards on Auditing and generally
accepted auditing standards in Sweden. Those standards require that
we comply with ethical requirements and plan and perform the audit to
obtain reasonable assurance about whether the annual accounts and
consolidated accounts are free from material misstatement.
An audit involves performing procedures to obtain audit evidence
about the amounts and disclosures in the annual accounts and consoli-
dated accounts. The procedures selected depend on the auditor’s
judgement, including the assessment of the risks of material misstate-
ment of the annual accounts and consolidated accounts, whether due to
fraud or error. In making those risk assessments, the auditor considers
internal control relevant to the company’s preparation and fair presenta-
tion of the annual accounts and consolidated accounts in order to
design audit procedures that are appropriate in the circumstances, but
not for the purpose of expressing an opinion on the effectiveness of the
company’s internal control. An audit also includes evaluating the appro-
priateness of accounting policies used and the reasonableness of
accounting estimates made by the Board of Directors, as well as evalu-
ating the overall presentation of the annual accounts and consolidated
accounts.
we believe that the audit evidence we have obtained is sufficient and
appropriate to provide a basis for our audit opinions.
OpinionsIn our opinion, the annual accounts have been prepared in accordance
with the Annual Accounts Act and present fairly, in all material respects,
the financial position of the parent company as of 31 December 2013
and of its financial performance and its cash flows for the year then
ended in accordance with the Annual Accounts Act. The consolidated
accounts have been prepared in accordance with the Annual Accounts
Act and present fairly, in all material respects, the financial position of
the group as of 31 December 2013 and of their financial performance
and cash flows for the year then ended in accordance with International
Financial Reporting Standards, as adopted by the EU, and the Annual
Accounts Act. The statutory administration report is consistent with the
other parts of the annual accounts and consolidated accounts.
we therefore recommend that the annual meeting of shareholders
adopt the income statement and balance sheet for the parent company
and the group.
REpORT ON OTHER LEGAL AND REGuLATORy REquIREmENTS In addition to our audit of the annual accounts and consolidated
accounts, we have also audited the proposed appropriations of the com-
pany’s profit or loss and the administration of the Board of Directors of
Geely Sweden AB for the financial year 2013-01-01 – 2013-12-31.
Responsibilities of the Board of DirectorsThe Board of Directors is responsible for the proposal for appropriations
of the company’s profit or loss, and the Board of Directors are responsi-
ble for administration under the Companies Act.
Auditor’s responsibilityOur responsibility is to express an opinion with reasonable assurance on
the proposed appropriations of the company’s profit or loss and on the
administration based on our audit. we conducted the audit in accord-
ance with generally accepted auditing standards in Sweden.
As a basis for our opinion on the Board of Directors’ proposed
appropriations of the company’s profit or loss, we examined whether the
proposal is in accordance with the Companies Act.
As a basis for our opinion concerning discharge from liability, in
addition to our audit of the annual accounts and consolidated accounts,
we examined significant decisions, actions taken and circumstances of
the company in order to determine whether any member of the Board of
Directors is liable to the company. we also examined whether any
member of the Board of Directors has, in any other way, acted in
contravention of the Companies Act, the Annual Accounts Act or the
Articles of Association.
we believe that the audit evidence we have obtained is sufficient and
appropriate to provide a basis for our opinions.
Opinionswe recommend to the annual meeting of shareholders that the profit
be appropriated in accordance with the proposal in the statutory
administration report and that the members of the Board of Directors be
discharged from liability for the financial year.
Gothenburg, April 24 2014
Deloitte AB
Signature on the Swedish original
Jan NilssonAuthorized Public Accountant
GEELy SwEDEN AB ANNUAL REPORT 201362

VOLVO CAR GROUP FINANCIAL REPORT JAN–DEC 2013IV
definitions
Comparative figures:The equivalent period is
shown in brackets
Retail Sales:Sales to end customers
Wholesales:Sales to dealers
information and contactyou are welcome to contact us:
Nils Mösko, Vice President, Head of Investor Relations.
[email protected], +46-(0)31-59 22 55.
For media queries, please contact:
David Ibison, Corporate Spokesman.
[email protected], +46-(0)31-59 22 39.
Volvo Car Group Headquarters
50400 – HA2S
SE-405 31 Gothenburg, Sweden
www.volvocars.com