volvo car group/media/files/v/volvo-cars-ir/... · volvo car ab (publ.) indirectly, through volvo...
TRANSCRIPT
Volvo Car GROUPInterim report second quarter and first six months 2018
2 OF 27
VOLVO CAR GROUP
INTERIM REPORT SECOND QUARTER AND FIRST SIX MONTHS 2018VOLVO CAR AB (PUBL.) (556810–8988) INTERIM REPORT SECOND QUARTER AND FIRST SIX MONTHS 2018, GOTHENBURG JULY 18TH 2018
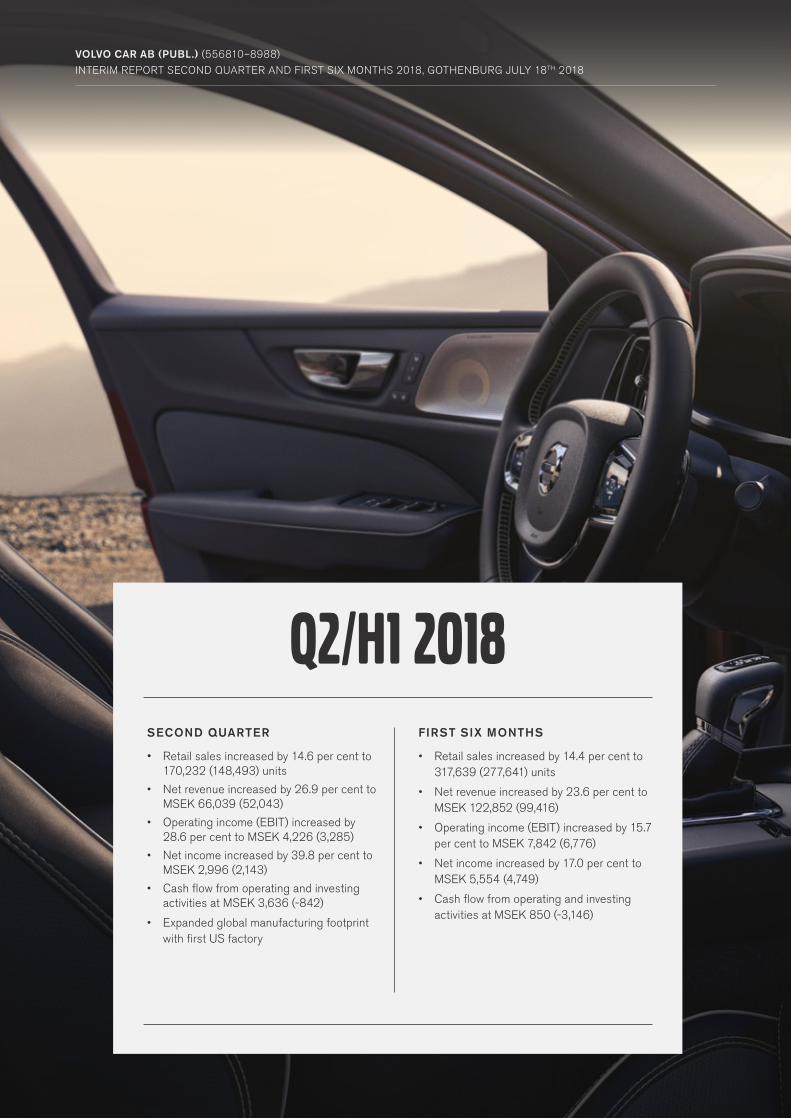
SECOND QUARTER
• Retail sales increased by 14.6 per cent to 170,232 (148,493) units
• Net revenue increased by 26.9 per cent to MSEK 66,039 (52,043)
• Operating income (EBIT) increased by 28.6 per cent to MSEK 4,226 (3,285)
• Net income increased by 39.8 per cent to MSEK 2,996 (2,143)
• Cash flow from operating and investing activities at MSEK 3,636 (-842)
• Expanded global manufacturing footprint with first US factory
FIRST SIX MONTHS
• Retail sales increased by 14.4 per cent to 317,639 (277,641) units
• Net revenue increased by 23.6 per cent to MSEK 122,852 (99,416)
• Operating income (EBIT) increased by 15.7 per cent to MSEK 7,842 (6,776)
• Net income increased by 17.0 per cent to MSEK 5,554 (4,749)
• Cash flow from operating and investing activities at MSEK 850 (-3,146)
q2/H1 2018
3 OF 27
VOLVO CAR GROUP
INTERIM REPORT SECOND QUARTER AND FIRST SIX MONTHS 2018
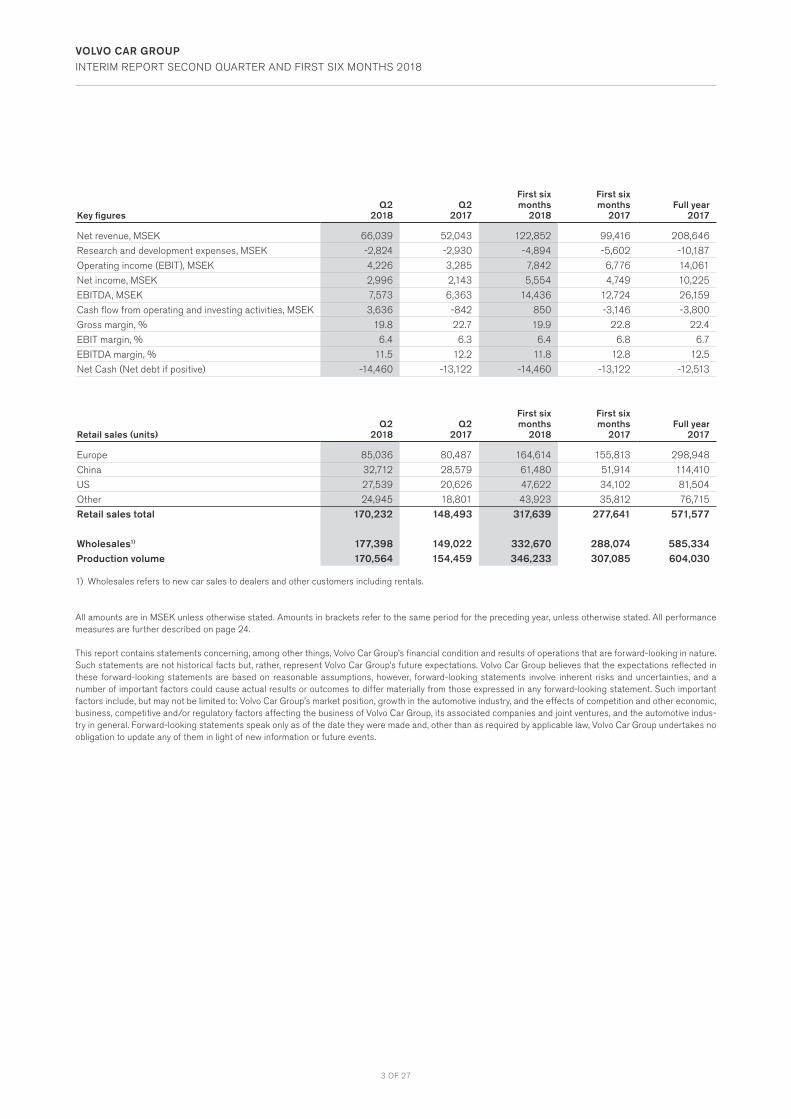
Key figuresQ2
2018Q2
2017
First six months
2018
First six months
2017Full year
2017
Net revenue, MSEK 66,039 52,043 122,852 99,416 208,646
Research and development expenses, MSEK -2,824 -2,930 -4,894 -5,602 -10,187
Operating income (EBIT), MSEK 4,226 3,285 7,842 6,776 14,061
Net income, MSEK 2,996 2,143 5,554 4,749 10,225
EBITDA, MSEK 7,573 6,363 14,436 12,724 26,159
Cash flow from operating and investing activities, MSEK 3,636 -842 850 -3,146 -3,800
Gross margin, % 19.8 22.7 19.9 22.8 22.4
EBIT margin, % 6.4 6.3 6.4 6.8 6.7
EBITDA margin, % 11.5 12.2 11.8 12.8 12.5
Net Cash (Net debt if positive) -14,460 -13,122 -14,460 -13,122 -12,513
Retail sales (units)Q2
2018Q2
2017
First six months
2018
First six months
2017Full year
2017
Europe 85,036 80,487 164,614 155,813 298,948
China 32,712 28,579 61,480 51,914 114,410
US 27,539 20,626 47,622 34,102 81,504
Other 24,945 18,801 43,923 35,812 76,715
Retail sales total 170,232 148,493 317,639 277,641 571,577
Wholesales1) 177,398 149,022 332,670 288,074 585,334Production volume 170,564 154,459 346,233 307,085 604,030
1) Wholesales refers to new car sales to dealers and other customers including rentals.
All amounts are in MSEK unless otherwise stated. Amounts in brackets refer to the same period for the preceding year, unless otherwise stated. All performance measures are further described on page 24.
This report contains statements concerning, among other things, Volvo Car Group’s financial condition and results of operations that are forward-looking in nature. Such statements are not historical facts but, rather, represent Volvo Car Group’s future expectations. Volvo Car Group believes that the expectations reflected in these forward-looking statements are based on reasonable assumptions, however, forward-looking statements involve inherent risks and uncertainties, and a number of important factors could cause actual results or outcomes to differ materially from those expressed in any forward-looking statement. Such important factors include, but may not be limited to: Volvo Car Group’s market position, growth in the automotive industry, and the effects of competition and other economic, business, competitive and/or regulatory factors affecting the business of Volvo Car Group, its associated companies and joint ventures, and the automotive indus-try in general. Forward-looking statements speak only as of the date they were made and, other than as required by applicable law, Volvo Car Group undertakes no obligation to update any of them in light of new information or future events.
4 OF 27
VOLVO CAR GROUP
INTERIM REPORT SECOND QUARTER AND FIRST SIX MONTHS 2018
Car volumes increased by more than 14 per cent during the first half year. The US increased by close to 40 per cent, China 18 per cent and Europe 6 per cent. In all markets, our new 90 and 60 cars are driving this growth.
Reflecting a continued consumer demand shift toward SUVs, the XC60 has been our best-selling model for years and the new version has continued that trend. The new XC40 made its debut in the European and US markets, and has been very well received. In the US, the XC40 combined with our new direct-to-consumers subscription offering, Care by Volvo, has seen good demand and is also attracting new younger consumers to our brand.
We launched the S60 in June at the inauguration of our plant in Charleston, South Carolina, US. It will be the first car to be pro-duced in the US. Now we have manufacturing sites in all three regions, we have the flexibility and capacity we need to grow fur-ther. All our plants are part of a global production structure - pro-ducing both for the domestic market and international export, which is more important than ever given ongoing trade discus-sions on tariffs.
Our relationship with the consumers is being redefined through M, the new brand from Volvo Car Mobility, as well as Care by Volvo. Volvo Cars can now offer mobility solutions and access to cars as the modern consumer wants it – we provide Freedom to Move in a personal, sustainable and safe way.
As the world of mobility evolves, we firmly believe that being open and collaborative is the best way to leverage our invest-ments. Polestar and our strategic affiliates Lynk & Co and Zenuity will give us the advantage that comes with scale, R&D synergies and we can increase speed to market. This is our way forward.
ceo COMMENT
Volvo Cars has had a strong first half year selling more cars than ever before. During the period we have launched the S60, as well as opened a plant in the US, creating a truly global footprint for the first time. All that has been done while growing revenue by around 25 per cent and increasing our profits.
With this in mind, we recently announced new longer term ambitions to position our company as a leading player in the rap-idly changing automotive business by the middle of next decade. Our ambitions are that half of the car volume built should be fully electric, 30 per cent to be autonomous driving and half to be delivered through subscription services, building over 5 million direct consumer relationships. All this combined with premium profitability and a continued superior growth.
The robust first half year performance places Volvo Cars firmly on course to report another record full year.
Håkan SamuelssonPresident and CEO
5 OF 27
VOLVO CAR GROUP
INTERIM REPORT SECOND QUARTER AND FIRST SIX MONTHS 2018
VOLVO CAR GROUP INTERIM REPORT SECOND QUARTER AND FIRST SIX MONTHS 2018
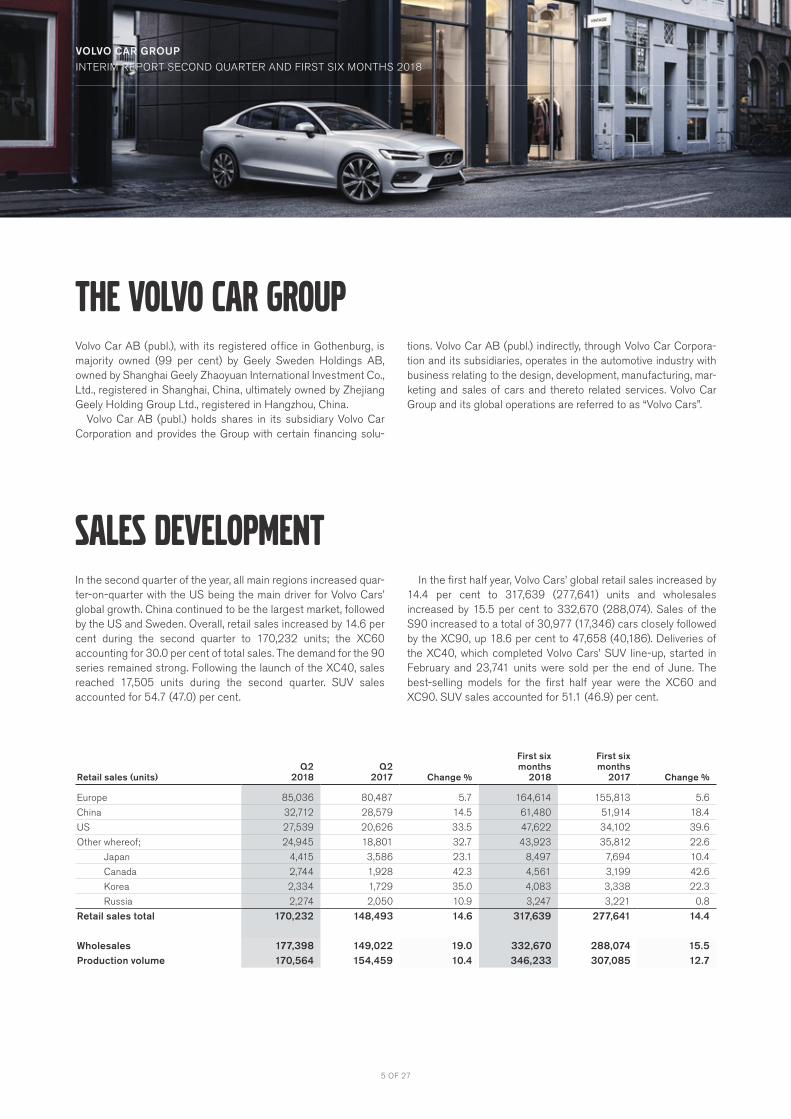
Volvo Car AB (publ.), with its registered office in Gothenburg, is majority owned (99 per cent) by Geely Sweden Holdings AB, owned by Shanghai Geely Zhaoyuan International Investment Co., Ltd., registered in Shanghai, China, ultimately owned by Zhejiang Geely Holding Group Ltd., registered in Hangzhou, China.
Volvo Car AB (publ.) holds shares in its subsidiary Volvo Car Corporation and provides the Group with certain financing solu-
tions. Volvo Car AB (publ.) indirectly, through Volvo Car Corpora-tion and its subsidiaries, operates in the automotive industry with business relating to the design, development, manufacturing, mar-keting and sales of cars and thereto related services. Volvo Car Group and its global operations are referred to as “Volvo Cars”.
In the second quarter of the year, all main regions increased quar-ter-on-quarter with the US being the main driver for Volvo Cars’ global growth. China continued to be the largest market, followed by the US and Sweden. Overall, retail sales increased by 14.6 per cent during the second quarter to 170,232 units; the XC60 accounting for 30.0 per cent of total sales. The demand for the 90 series remained strong. Following the launch of the XC40, sales reached 17,505 units during the second quarter. SUV sales accounted for 54.7 (47.0) per cent.
In the first half year, Volvo Cars’ global retail sales increased by 14.4 per cent to 317,639 (277,641) units and wholesales increased by 15.5 per cent to 332,670 (288,074). Sales of the S90 increased to a total of 30,977 (17,346) cars closely followed by the XC90, up 18.6 per cent to 47,658 (40,186). Deliveries of the XC40, which completed Volvo Cars’ SUV line-up, started in February and 23,741 units were sold per the end of June. The best-selling models for the first half year were the XC60 and XC90. SUV sales accounted for 51.1 (46.9) per cent.
The Volvo Car Group
Sales development
Retail sales (units)Q2
2018Q2
2017 Change %
First six months
2018
First six months
2017 Change %
Europe 85,036 80,487 5.7 164,614 155,813 5.6
China 32,712 28,579 14.5 61,480 51,914 18.4
US 27,539 20,626 33.5 47,622 34,102 39.6
Other whereof; 24,945 18,801 32.7 43,923 35,812 22.6
Japan 4,415 3,586 23.1 8,497 7,694 10.4
Canada 2,744 1,928 42.3 4,561 3,199 42.6
Korea 2,334 1,729 35.0 4,083 3,338 22.3
Russia 2,274 2,050 10.9 3,247 3,221 0.8
Retail sales total 170,232 148,493 14.6 317,639 277,641 14.4
Wholesales 177,398 149,022 19.0 332,670 288,074 15.5Production volume 170,564 154,459 10.4 346,233 307,085 12.7
6 OF 27
VOLVO CAR GROUP
INTERIM REPORT SECOND QUARTER AND FIRST SIX MONTHS 2018
EuropeIn the first half year, the performance of the passenger car market in Europe remained positive recording 2.8 per cent growth. West-ern Europe’s growth has retreated from recent highs but remained positive supported by monetary stimulus, better access to credit and reduced fiscal headwinds. The exception was the UK due to ongoing uncertainties related to Brexit. In the second quarter, Volvo Cars’ retail sales increased by 5.7 per cent to 85,036 (80,487) units. A major part of the sales growth was driven by demand in Sweden, as well as Netherlands and Italy. Growth was supported by strong XC40 demand which reached 10,351 units as well as XC90 sales of 8,128 units. Sales of the V60 also grew by 18.3 per cent to 11,242 units. Overall, Volvo Cars’ saw sales growth in all major European markets with the exception of the UK.
In the first half year, Volvo Cars’ retail sales in Europe increased by 5.6 per cent compared to same period last year. The Swedish market continued to account for a significant proportion of Volvo Cars’ European sales, with sales of 43,102 (38,724) units, reflect-ing growth of 11.3 per cent. Sales in the Netherlands increased by 42.2 per cent to 8,963 (6,303) units compared to the same period last year. Consumer demand for the new XC40 as well as higher demand for the V90 helped improve sales. Sales in Bel-gium and France both grew by 10.0 and 9.3 per cent respectively. The decline in Italy is reflective of the first quarter which was in line with the market performance, mainly due to fewer working days.
ChinaDuring the first half year, the Chinese passenger car market grew by 3.7 per cent. Strong consumer appetite for vehicles in the sedan segment helped drive growth within the premium segment.
Quarter-on-quarter, demand for our products resulted in con-tinued momentum in China with retail sales growth of 14.5 per cent. The S90 was the major contributor to unit sales, going from 4,529 in second quarter 2017 to 8,846 units in the same period 2018. The XC60 and XC90 also reached higher sales volumes of 11,476 (10,453) units and 3,513 (2,649) units respectively. The S90 and XC60 cars are both locally produced, with the latter just reaching full momentum during the second quarter of this year.
In the first half of the year, retail sales grew by 18.4 per cent to 61,480 (51,914) units. Growth was driven by higher demand for the S90 as well as the XC90 cars, both of which account for almost 40 per cent of Volvo Cars’ sales in China.
USIn the first half year, total sales of passenger cars in the US mar-ket increased by 1.9 per cent. Economic growth has rebounded and is expected to continue strengthening throughout the year. Demand in the US is mainly focused on - and driven by - the light trucks segment. The SUV market increased by 10.1 per cent as growth in the small-size SUV sector continues. Quarter-on-quarter Volvo Cars’ retail sales increased by 33.5 per cent to 27,539 (20,626). Sales in the US was mainly driven by strong demand of all three SUVs in Volvo Cars’ portfolio.
In the first half of the year, retail sales increased by 39.6 per cent to 47,622 (34,102) units, all three SUVs being the main driver for demand.
OtherQuarter-on-quarter retail sales contributed with a strong 32.7 per cent increase to 24,945 (18,801) units, with Japan, Canada, Korea and Russia being the biggest markets. Growth in Japan was driven by SUV sales which grew almost three-fold to 1,657 units, mainly on the XC60 on back of the Car of the Year recogni-tion received in the first quarter this year. Sales in Canada grew 42.3 per cent to 2,744 units, with Korea and Russia closely behind.
In the first half year, retail sales increased by 22.6 per cent to 43,923 units. Demand for the XC60 was the main driver behind the increase, growing by 40.3 per cent to 13,131 units. Japan, Canada, Korea and Russia were the fastest growing markets.
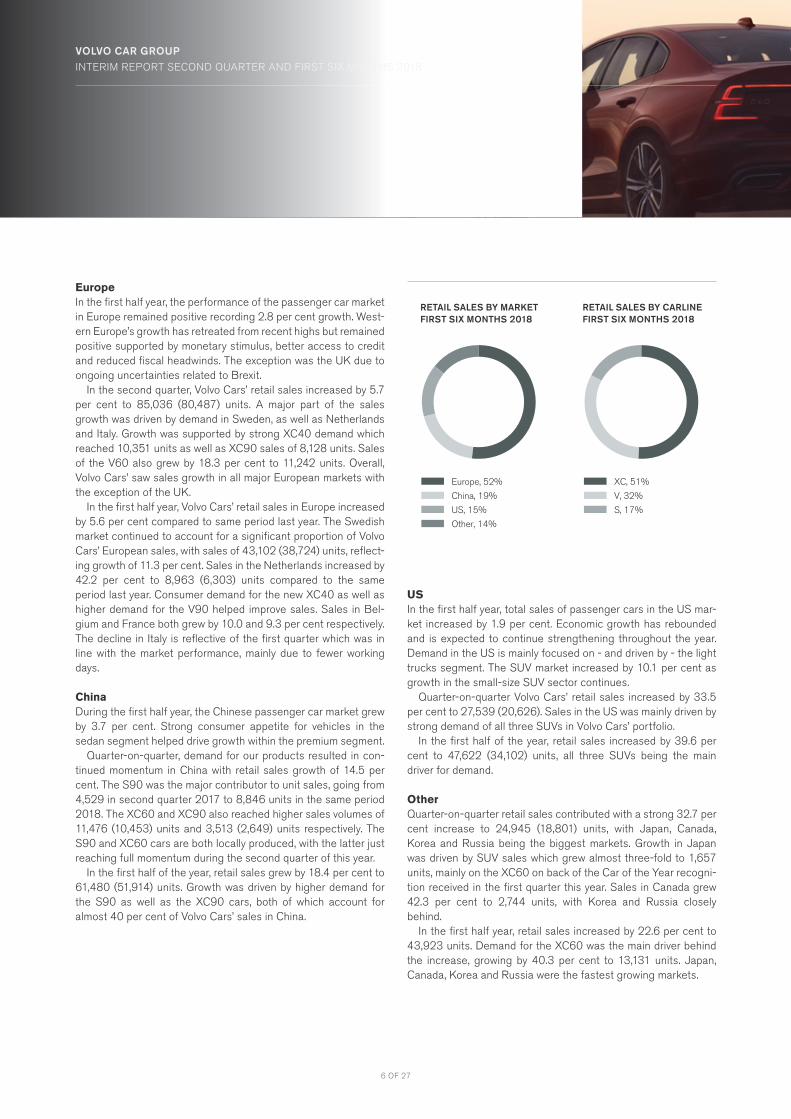
RETAIL SALES BY MARKET FIRST SIX MONTHS 2018
RETAIL SALES BY CARLINE FIRST SIX MONTHS 2018
Other, 14%
US, 15%
China, 19%
Europe, 52%
S, 17%
V, 32%
XC, 51%
VOLVO CAR GROUP INTERIM REPORT SECOND QUARTER AND FIRST SIX MONTHS 2018
7 OF 27
VOLVO CAR GROUP
INTERIM REPORT SECOND QUARTER AND FIRST SIX MONTHS 2018
VOLVO CAR GROUP INTERIM REPORT SECOND QUARTER AND FIRST SIX MONTHS 2018
Top 10Retail sales by market (units)
Q2 2018
Q2 2017
First six months
2018
First six months
2017
China 32,712 28,579 61,480 51,914
US 27,539 20,626 47,622 34,102
Sweden 23,008 21,008 43,102 38,724
UK 11,696 11,800 23,213 24,481
Germany 11,012 10,698 19,799 19,697
Belgium 5,195 5,085 11,157 10,147
Italy 4,875 4,457 9,039 9,266
France 4,667 4,345 9,293 8,501
Japan 4,415 3,586 8,497 7,694
Netherlands 4,048 3,634 8,963 6,303
Retail sales by model (units)Q2
2018Q2
2017
First six months
2018
First six months
2017
XC60/XC60 Classic 50,999 48,807 90,784 89,950
XC90 24,696 21,016 47,658 40,186
V40/V40 Cross Country 19,381 25,008 41,588 48,554
XC40 17,505 - 23,741 -
V90/V90 Cross Country 15,743 15,595 31,450 26,650
S90 15,259 10,018 30,977 17,346
V60/V60 Cross Country 14,642 14,139 27,635 28,485
S60/S60 Cross Country 12,007 13,848 23,806 26,171
Other (discontinued models) - 62 - 299
Total 170,232 148,493 317,639 277,641
VOLVO CAR GROUP INTERIM REPORT SECOND QUARTER AND FIRST SIX MONTHS 2018

8 OF 27
VOLVO CAR GROUP
INTERIM REPORT SECOND QUARTER AND FIRST SIX MONTHS 2018
SECOND QUARTER 2018
First US manufacturing plant inauguratedDelivering on Volvo Cars’ global manufacturing strategy, “Build where you sell”, the expanded manufacturing footprint estab-lished the company as a truly global car manufacturer with plants in all three major sales regions. Production of the new S60 starts
in the fall of 2018, and from 2021 next generation XC90s will be built here, both models destined both for the domestic US market and international export. The US manufacturing operations will create around 4,000 new jobs at the Charleston site over the coming years, approximately 1,500 will be employed this year.
Significant events
Other eventsThe new S60 launchedAs part of our core business of launching and building premium cars, as well as delivering new mobility solutions, production of the new model starts at the new US plant in the fall of 2018. Following the ambition to increase sales related to subscription services, customers can in addition to buying a car, also access the new S60 by Care by Volvo.
Further sustainability commitments announced As a means to further progress towards Volvo Cars’ sustainabil-ity commitments, new ambitions have been formalised so that global use of single use plastic will be reduced, and in some areas removed completely. Further Volvo Cars announced its ambition that from 2025, at least 25 per cent of the plastics used in every newly launched Volvo car will be made from recy-cled material.
Credit rating upgradedIn May, the rating agency Moody’s upgraded its corporate credit rating for Volvo Cars to Ba1 from Ba2, with a stable outlook.
Summary of events first quarter 2018• Lynk & Co cars to be produced at Volvo Cars Ghent plant• Launch of the new V60• XC60 World Car of the Year and XC40 European Car of the Year
2018• Technology start-up investment fund launched• First manufacturing plant became climate neutral• Volvo Cars named one of the World’s Most Ethical Companies®
• Changes to the Volvo Cars Board of Directors
VOLVO CAR GROUP INTERIM REPORT SECOND QUARTER AND FIRST SIX MONTHS 2018
9 OF 27
VOLVO CAR GROUP
INTERIM REPORT SECOND QUARTER AND FIRST SIX MONTHS 2018
Income Statement (MSEK)Q2
2018Q2
2017
Net revenue 66,039 52,043
Gross income 13,061 11,807
Operating income (EBIT) 4,226 3,285
EBITDA 7,573 6,363
Income before tax 3,887 2,960
Net income 2,996 2,143
Research and development (MSEK)Q2
2018Q2
2017
Research and development spending -3,751 -4,051
Capitalised development costs 1,983 2,247
Amortisation and depreciation of Research and development 1) -1,056 -1,126
Research and development expenses -2,824 -2,930
1) Includes amortisation of capitalised development cost and a portion of depreciation of other intangible assets.
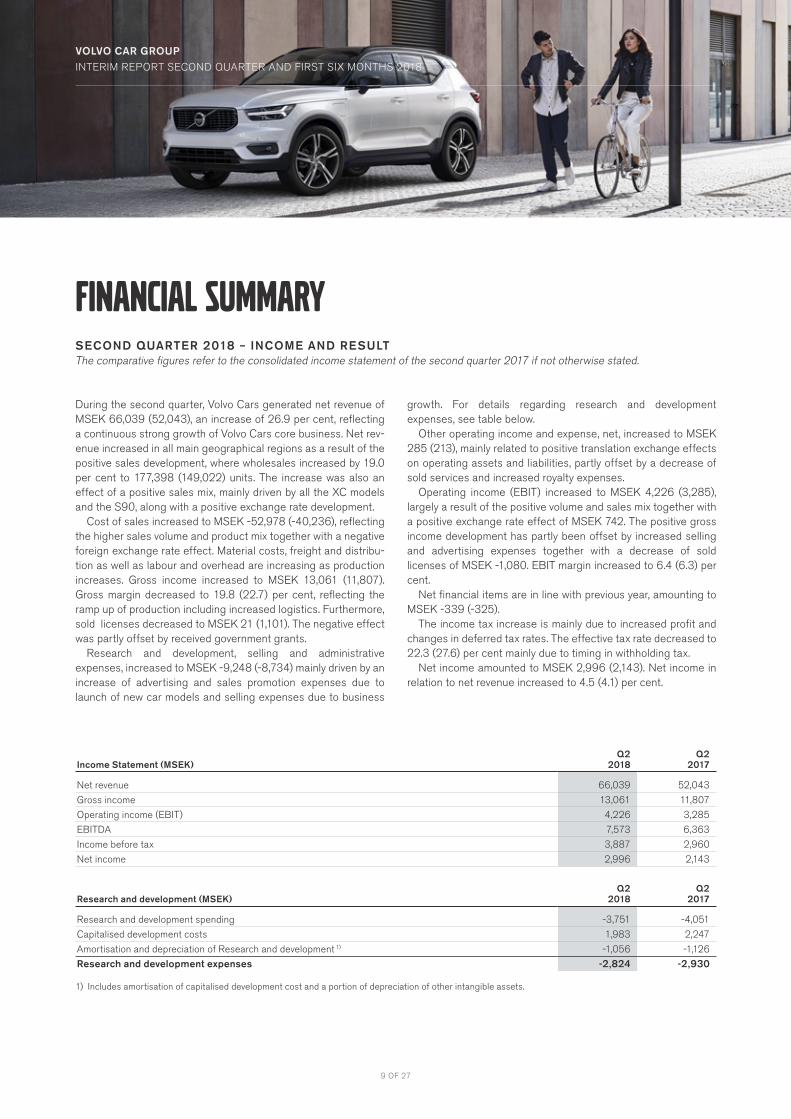
During the second quarter, Volvo Cars generated net revenue of MSEK 66,039 (52,043), an increase of 26.9 per cent, reflecting a continuous strong growth of Volvo Cars core business. Net rev-enue increased in all main geographical regions as a result of the positive sales development, where wholesales increased by 19.0 per cent to 177,398 (149,022) units. The increase was also an effect of a positive sales mix, mainly driven by all the XC models and the S90, along with a positive exchange rate development.
Cost of sales increased to MSEK -52,978 (-40,236), reflecting the higher sales volume and product mix together with a negative foreign exchange rate effect. Material costs, freight and distribu-tion as well as labour and overhead are increasing as production increases. Gross income increased to MSEK 13,061 (11,807). Gross margin decreased to 19.8 (22.7) per cent, reflecting the ramp up of production including increased logistics. Furthermore, sold licenses decreased to MSEK 21 (1,101). The negative effect was partly offset by received government grants.
Research and development, selling and administrative expenses, increased to MSEK -9,248 (-8,734) mainly driven by an increase of advertising and sales promotion expenses due to launch of new car models and selling expenses due to business
growth. For details regarding research and development expenses, see table below.
Other operating income and expense, net, increased to MSEK 285 (213), mainly related to positive translation exchange effects on operating assets and liabilities, partly offset by a decrease of sold services and increased royalty expenses.
Operating income (EBIT) increased to MSEK 4,226 (3,285), largely a result of the positive volume and sales mix together with a positive exchange rate effect of MSEK 742. The positive gross income development has partly been offset by increased selling and advertising expenses together with a decrease of sold licenses of MSEK -1,080. EBIT margin increased to 6.4 (6.3) per cent.
Net financial items are in line with previous year, amounting to MSEK -339 (-325).
The income tax increase is mainly due to increased profit and changes in deferred tax rates. The effective tax rate decreased to 22.3 (27.6) per cent mainly due to timing in withholding tax.
Net income amounted to MSEK 2,996 (2,143). Net income in relation to net revenue increased to 4.5 (4.1) per cent.
Financial summarySECOND QUARTER 2018 – INCOME AND RESULTThe comparative figures refer to the consolidated income statement of the second quarter 2017 if not otherwise stated.
VOLVO CAR GROUP INTERIM REPORT SECOND QUARTER AND FIRST SIX MONTHS 2018

10 OF 27
VOLVO CAR GROUP
INTERIM REPORT SECOND QUARTER AND FIRST SIX MONTHS 2018
Income Statement (MSEK)
First six months
2018
First six months
2017
Net revenue 122,852 99,416
Gross income 24,487 22,656
Operating income (EBIT) 7,842 6,776
EBITDA 14,436 12,724
Income before tax 7,325 6,204
Net income 5,554 4,749
Research and development (MSEK)
First six months
2018
First six months
2017
Research and development spending -6,592 -7,527
Capitalised development costs 3,830 4,081
Amortisation and depreciation of Research and development 1) -2,132 -2,156
Research and development expenses -4,894 -5,602
1) Includes amortisation of capitalised development cost and a portion of depreciation of other intangible assets.
Drivers behind the income and result for the first six months are similar to those in the second quarter.
Volvo Cars generated net revenue of MSEK 122,852 (99,416), an increase of 23.6 per cent, reflecting a continuous strong growth of Volvo Cars core business. Net revenue increased in all main geographical regions as a result of the positive sales devel-opment, where wholesales increased by 15.5 per cent to 332,670 (288,074) units. The increase was also an effect of a positive sales mix, mainly driven by all the XC models and the S90, along with a positive exchange rate development.
Cost of sales increased to MSEK -98,365 (-76,760), reflecting the higher sales volume and product mix together with a negative foreign exchange rate effect. Material costs, freight and distribu-tion as well as labour and overhead are increasing as production increases. Gross income increased to MSEK 24,487 (22,656). Gross margin decreased to 19.9 (22.8) per cent, reflecting the ramp up of production including increased logistics and negative exchange rate effects. Furthermore, sold licenses decreased to MSEK 48 (1,311). The negative effect was partly offset by received government grants.
Research and development, selling and administrative expenses increased to MSEK -17,047 (-16,335). The increase is mainly driven by an increase of advertising and sales promotion expenses due to launch of new car models and advertising campaigns
together with an increase of selling expenses due to business growth. Administrative and Research and development expenses have partly been offset by received government grants. For details regarding Research and development expenses, see table below.
Other operating income and expense, net, decreased to MSEK 242 (391), mainly related to a decrease of sold services and increased royalty expenses partly offset by positive translation exchange effects on operating assets and liabilities.
Operating income (EBIT) increased to MSEK 7,842 (6,776), largely a result of the positive volume and sales mix. The positive gross income development has partly been offset by increased advertising, sales and promotion expenses, selling expenses together with a decrease of sold licenses of MSEK -1,263. The exchange rate effect had a limited impact amounting to MSEK 105. EBIT margin decreased to 6.4 (6.8) per cent.
Net financial items amounted to MSEK -517 (-572), mainly related to decreased interest expenses and positive exchange rate effects.
The income tax increase is mainly related to increased profit and changes in deferred tax rates. The effective tax rate amounted to 24.0 (23.4) per cent which is in line with previous year.
Net income amounted to MSEK 5,554 (4,749). Net income in relation to net revenue decreased to 4.5 (4.8) per cent.
FIRST SIX MONTHS 2017 – INCOME AND RESULTThe comparative figures refer to the consolidated income statement of the first six months 2017 if not otherwise stated.
VOLVO CAR GROUP INTERIM REPORT SECOND QUARTER AND FIRST SIX MONTHS 2018
11 OF 27
VOLVO CAR GROUP
INTERIM REPORT SECOND QUARTER AND FIRST SIX MONTHS 2018
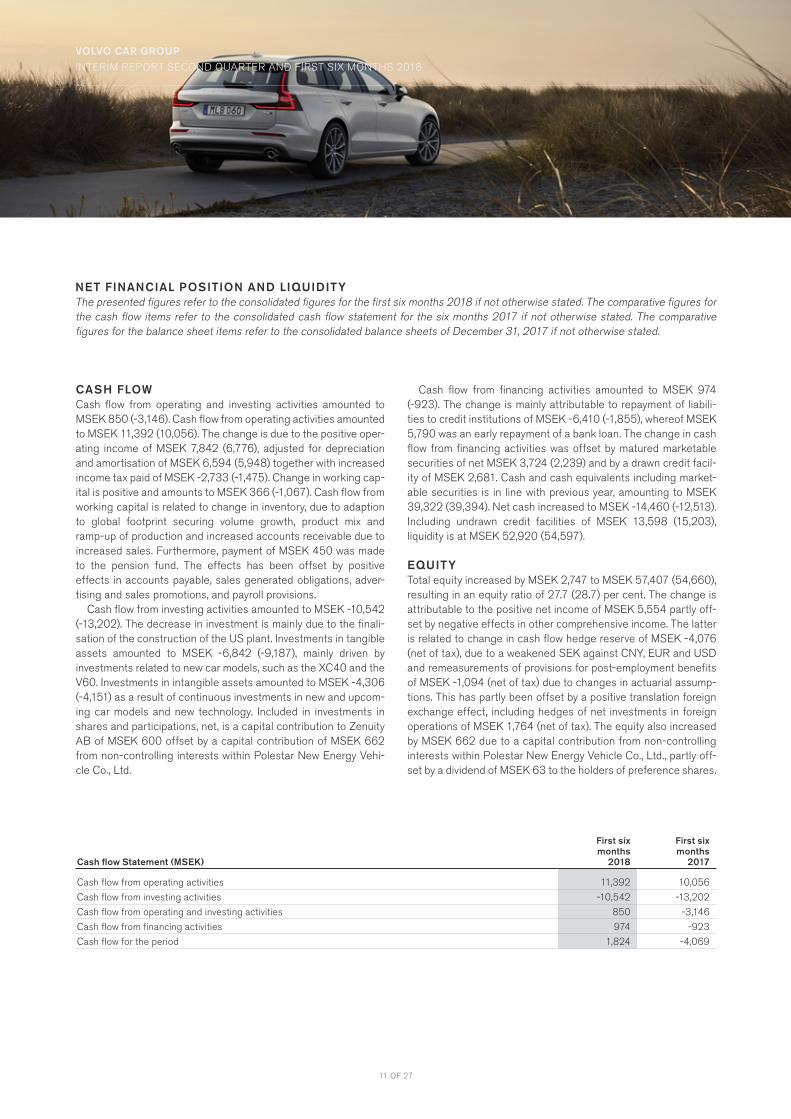
CASH FLOWCash flow from operating and investing activities amounted to MSEK 850 (-3,146). Cash flow from operating activities amounted to MSEK 11,392 (10,056). The change is due to the positive oper-ating income of MSEK 7,842 (6,776), adjusted for depreciation and amortisation of MSEK 6,594 (5,948) together with increased income tax paid of MSEK -2,733 (-1,475). Change in working cap-ital is positive and amounts to MSEK 366 (-1,067). Cash flow from working capital is related to change in inventory, due to adaption to global footprint securing volume growth, product mix and ramp-up of production and increased accounts receivable due to increased sales. Furthermore, payment of MSEK 450 was made to the pension fund. The effects has been offset by positive effects in accounts payable, sales generated obligations, adver-tising and sales promotions, and payroll provisions.
Cash flow from investing activities amounted to MSEK -10,542 (-13,202). The decrease in investment is mainly due to the finali-sation of the construction of the US plant. Investments in tangible assets amounted to MSEK -6,842 (-9,187), mainly driven by investments related to new car models, such as the XC40 and the V60. Investments in intangible assets amounted to MSEK -4,306 (-4,151) as a result of continuous investments in new and upcom-ing car models and new technology. Included in investments in shares and participations, net, is a capital contribution to Zenuity AB of MSEK 600 offset by a capital contribution of MSEK 662 from non-controlling interests within Polestar New Energy Vehi-cle Co., Ltd.
Cash flow from financing activities amounted to MSEK 974 (-923). The change is mainly attributable to repayment of liabili-ties to credit institutions of MSEK -6,410 (-1,855), whereof MSEK 5,790 was an early repayment of a bank loan. The change in cash flow from financing activities was offset by matured marketable securities of net MSEK 3,724 (2,239) and by a drawn credit facil-ity of MSEK 2,681. Cash and cash equivalents including market-able securities is in line with previous year, amounting to MSEK 39,322 (39,394). Net cash increased to MSEK -14,460 (-12,513). Including undrawn credit facilities of MSEK 13,598 (15,203), liquidity is at MSEK 52,920 (54,597).
EQUITYTotal equity increased by MSEK 2,747 to MSEK 57,407 (54,660), resulting in an equity ratio of 27.7 (28.7) per cent. The change is attributable to the positive net income of MSEK 5,554 partly off-set by negative effects in other comprehensive income. The latter is related to change in cash flow hedge reserve of MSEK -4,076 (net of tax), due to a weakened SEK against CNY, EUR and USD and remeasurements of provisions for post-employment benefits of MSEK -1,094 (net of tax) due to changes in actuarial assump-tions. This has partly been offset by a positive translation foreign exchange effect, including hedges of net investments in foreign operations of MSEK 1,764 (net of tax). The equity also increased by MSEK 662 due to a capital contribution from non-controlling interests within Polestar New Energy Vehicle Co., Ltd., partly off-set by a dividend of MSEK 63 to the holders of preference shares.
NET FINANCIAL POSITION AND LIQUIDITYThe presented figures refer to the consolidated figures for the first six months 2018 if not otherwise stated. The comparative figures for the cash flow items refer to the consolidated cash flow statement for the six months 2017 if not otherwise stated. The comparative figures for the balance sheet items refer to the consolidated balance sheets of December 31, 2017 if not otherwise stated.
VOLVO CAR GROUP INTERIM REPORT SECOND QUARTER AND FIRST SIX MONTHS 2018
Cash flow Statement (MSEK)
First six months
2018
First six months
2017
Cash flow from operating activities 11,392 10,056
Cash flow from investing activities -10,542 -13,202
Cash flow from operating and investing activities 850 -3,146
Cash flow from financing activities 974 -923
Cash flow for the period 1,824 -4,069
12 OF 27
VOLVO CAR GROUP
INTERIM REPORT SECOND QUARTER AND FIRST SIX MONTHS 2018
SIGNIFICANT EVENTS AFTER THE REPORTING PERIODThere are no significant events after the reporting period.
RISKS AND UNCERTAINTY FACTORSRisks are a natural element in all business activities, risk mitiga-tion as well. As an example, our reaction to higher tariffs is to adjust prices in certain markets, reallocate vehicles to other mar-kets, as well as reallocate production. In order to achieve Volvo Cars’ short and long-term objectives, enterprise risk management is part of the daily activities at Volvo Cars. For a more in-depth analysis of risks, see the Volvo Car Group Annual Report 2017 page 104.
Volvo Cars is present on the bond market and is continuously considering various capital market options that may or may not include possible listings.
EMPLOYEESDuring the second quarter of 2018, Volvo Car Group employed on average 41,700 (34,200) full-time employees. Furthermore, the Group employed on average 2,500 (4,300) consultants. The total increase relates mainly to higher production volumes, the ramp up in China, the construction of the Charleston plant in the US, con-tinuous development of future technologies such as electrifica-tion and autonomous driving, as well as continuous development of current and future car models.
PARENT COMPANYThe parent company conducts no operations and has no employ-ees. The income statements and balance sheets for the parent company are presented on page 19.
VOLVO CAR GROUP INTERIM REPORT SECOND QUARTER AND FIRST SIX MONTHS 2018
OUTLOOK 2018
Revenue growthWe expect the worldwide passenger car market to grow and the premium segment to continue to develop positively. Volvo Cars expects continued growth in rev-enue and retail sales supported by our renewed prod-uct portfolio.
Operating incomeWe expect profits to remain strong.
InvestmentsThe US plant construction and the launch of the V60 and S60 are in their finalising phases; capital expend-iture is predicted to be lower compared to 2017.
13 OF 27
VOLVO CAR GROUP
INTERIM REPORT SECOND QUARTER AND FIRST SIX MONTHS 2018
14 OF 27
VOLVO CAR GROUP
INTERIM REPORT SECOND QUARTER AND FIRST SIX MONTHS 2018
CONSOLIDATED INCOME STATEMENTS
MSEK Note Q2
2018Q2
2017
First six months
2018
First six months
2017Full year
2017
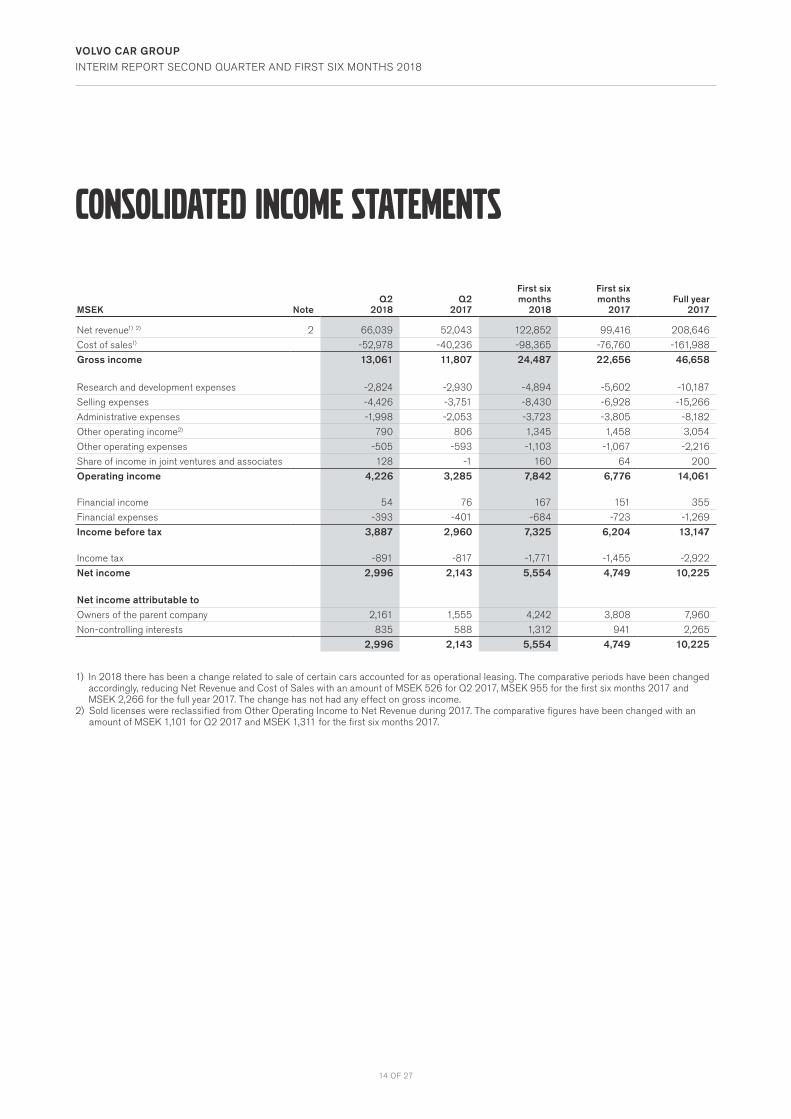
Net revenue1) 2) 2 66,039 52,043 122,852 99,416 208,646
Cost of sales1) -52,978 -40,236 -98,365 -76,760 -161,988
Gross income 13,061 11,807 24,487 22,656 46,658
Research and development expenses -2,824 -2,930 -4,894 -5,602 -10,187
Selling expenses -4,426 -3,751 -8,430 -6,928 -15,266
Administrative expenses -1,998 -2,053 -3,723 -3,805 -8,182
Other operating income2) 790 806 1,345 1,458 3,054
Other operating expenses -505 -593 -1,103 -1,067 -2,216
Share of income in joint ventures and associates 128 -1 160 64 200
Operating income 4,226 3,285 7,842 6,776 14,061
Financial income 54 76 167 151 355
Financial expenses -393 -401 -684 -723 -1,269
Income before tax 3,887 2,960 7,325 6,204 13,147
Income tax -891 -817 -1,771 -1,455 -2,922
Net income 2,996 2,143 5,554 4,749 10,225
Net income attributable toOwners of the parent company 2,161 1,555 4,242 3,808 7,960
Non-controlling interests 835 588 1,312 941 2,265
2,996 2,143 5,554 4,749 10,225
1) In 2018 there has been a change related to sale of certain cars accounted for as operational leasing. The comparative periods have been changed accordingly, reducing Net Revenue and Cost of Sales with an amount of MSEK 526 for Q2 2017, MSEK 955 for the first six months 2017 and MSEK 2,266 for the full year 2017. The change has not had any effect on gross income.
2) Sold licenses were reclassified from Other Operating Income to Net Revenue during 2017. The comparative figures have been changed with an amount of MSEK 1,101 for Q2 2017 and MSEK 1,311 for the first six months 2017.
15 OF 27
VOLVO CAR GROUP
INTERIM REPORT SECOND QUARTER AND FIRST SIX MONTHS 2018
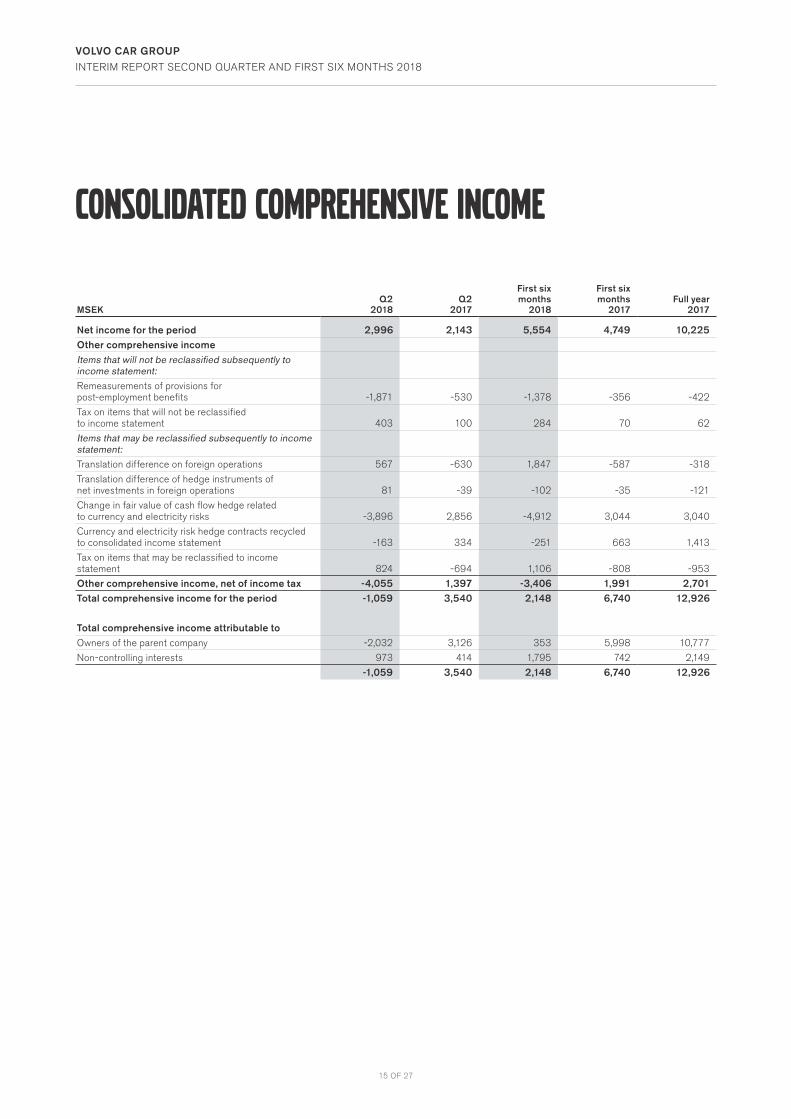
CONSOLIDATED COMPREHENSIVE INCOME
MSEKQ2
2018Q2
2017
First six months
2018
First six months
2017Full year
2017
Net income for the period 2,996 2,143 5,554 4,749 10,225Other comprehensive incomeItems that will not be reclassified subsequently to income statement:Remeasurements of provisions for post-employment benefits -1,871 -530 -1,378 -356 -422
Tax on items that will not be reclassified to income statement 403 100 284 70 62
Items that may be reclassified subsequently to income statement:Translation difference on foreign operations 567 -630 1,847 -587 -318
Translation difference of hedge instruments of net investments in foreign operations 81 -39 -102 -35 -121
Change in fair value of cash flow hedge related to currency and electricity risks -3,896 2,856 -4,912 3,044 3,040
Currency and electricity risk hedge contracts recycled to consolidated income statement -163 334 -251 663 1,413
Tax on items that may be reclassified to income statement 824 -694 1,106 -808 -953
Other comprehensive income, net of income tax -4,055 1,397 -3,406 1,991 2,701Total comprehensive income for the period -1,059 3,540 2,148 6,740 12,926
Total comprehensive income attributable toOwners of the parent company -2,032 3,126 353 5,998 10,777
Non-controlling interests 973 414 1,795 742 2,149
-1,059 3,540 2,148 6,740 12,926
16 OF 27
VOLVO CAR GROUP
INTERIM REPORT SECOND QUARTER AND FIRST SIX MONTHS 2018
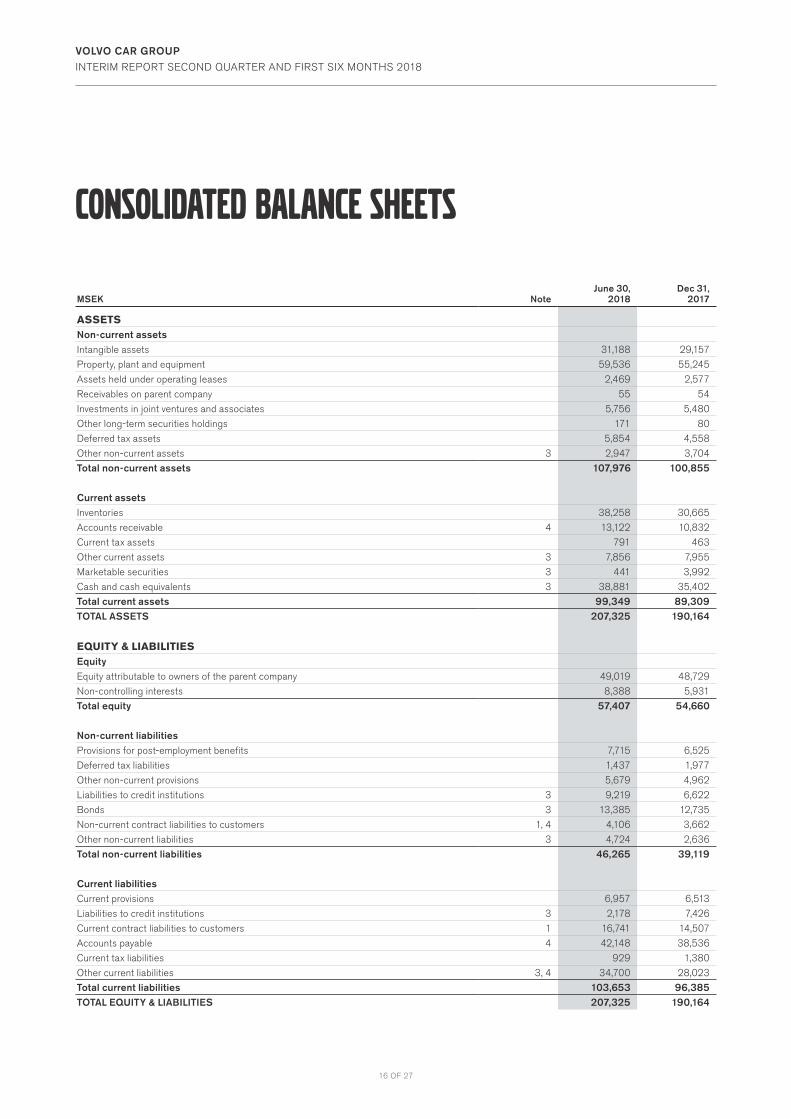
CONSOLIDATED BALANCE SHEETS
MSEK NoteJune 30,
2018Dec 31,
2017
ASSETSNon-current assetsIntangible assets 31,188 29,157
Property, plant and equipment 59,536 55,245
Assets held under operating leases 2,469 2,577
Receivables on parent company 55 54
Investments in joint ventures and associates 5,756 5,480
Other long-term securities holdings 171 80
Deferred tax assets 5,854 4,558
Other non-current assets 3 2,947 3,704
Total non-current assets 107,976 100,855
Current assetsInventories 38,258 30,665
Accounts receivable 4 13,122 10,832
Current tax assets 791 463
Other current assets 3 7,856 7,955
Marketable securities 3 441 3,992
Cash and cash equivalents 3 38,881 35,402
Total current assets 99,349 89,309TOTAL ASSETS 207,325 190,164
EQUITY & LIABILITIESEquityEquity attributable to owners of the parent company 49,019 48,729
Non-controlling interests 8,388 5,931
Total equity 57,407 54,660
Non-current liabilitiesProvisions for post-employment benefits 7,715 6,525
Deferred tax liabilities 1,437 1,977
Other non-current provisions 5,679 4,962
Liabilities to credit institutions 3 9,219 6,622
Bonds 3 13,385 12,735
Non-current contract liabilities to customers 1, 4 4,106 3,662
Other non-current liabilities 3 4,724 2,636
Total non-current liabilities 46,265 39,119
Current liabilitiesCurrent provisions 6,957 6,513
Liabilities to credit institutions 3 2,178 7,426
Current contract liabilities to customers 1 16,741 14,507
Accounts payable 4 42,148 38,536
Current tax liabilities 929 1,380
Other current liabilities 3, 4 34,700 28,023
Total current liabilities 103,653 96,385TOTAL EQUITY & LIABILITIES 207,325 190,164
17 OF 27
VOLVO CAR GROUP
INTERIM REPORT SECOND QUARTER AND FIRST SIX MONTHS 2018
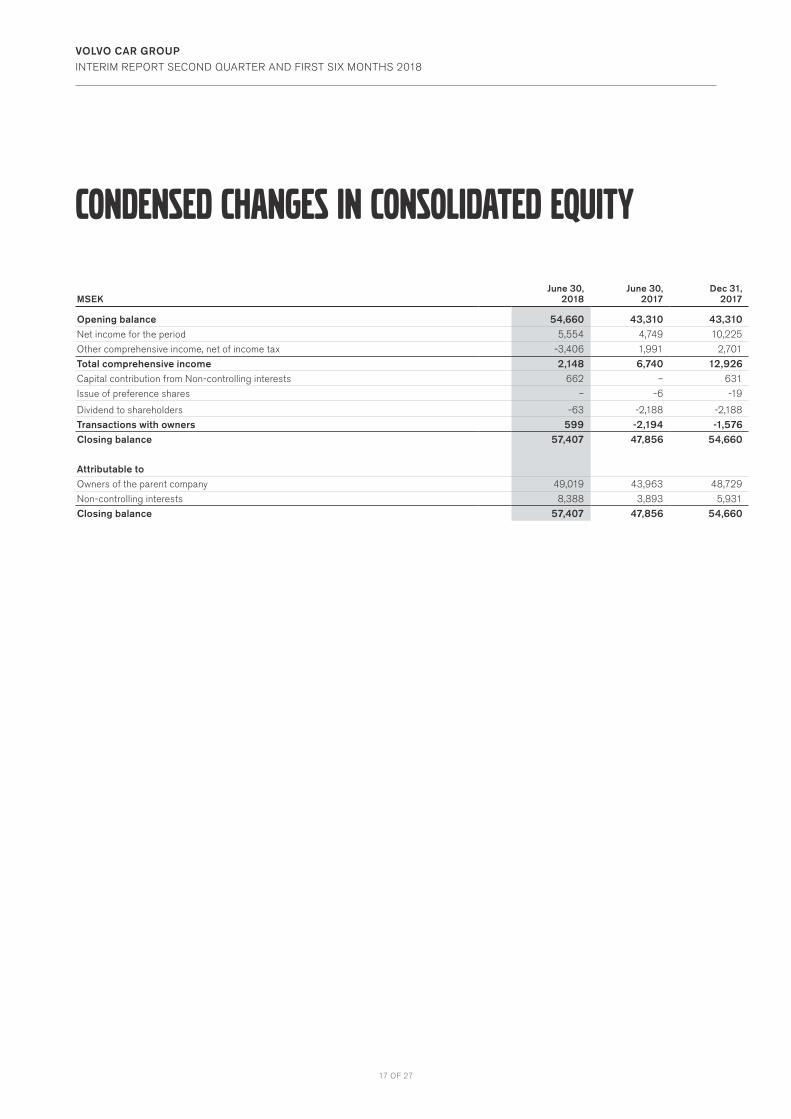
CONDENSED CHANGES IN CONSOLIDATED EQUITY
MSEKJune 30,
2018June 30,
2017Dec 31,
2017
Opening balance 54,660 43,310 43,310Net income for the period 5,554 4,749 10,225
Other comprehensive income, net of income tax -3,406 1,991 2,701
Total comprehensive income 2,148 6,740 12,926Capital contribution from Non-controlling interests 662 – 631
Issue of preference shares – -6 -19
Dividend to shareholders -63 -2,188 -2,188
Transactions with owners 599 -2,194 -1,576Closing balance 57,407 47,856 54,660
Attributable to Owners of the parent company 49,019 43,963 48,729
Non-controlling interests 8,388 3,893 5,931
Closing balance 57,407 47,856 54,660
18 OF 27
VOLVO CAR GROUP
INTERIM REPORT SECOND QUARTER AND FIRST SIX MONTHS 2018
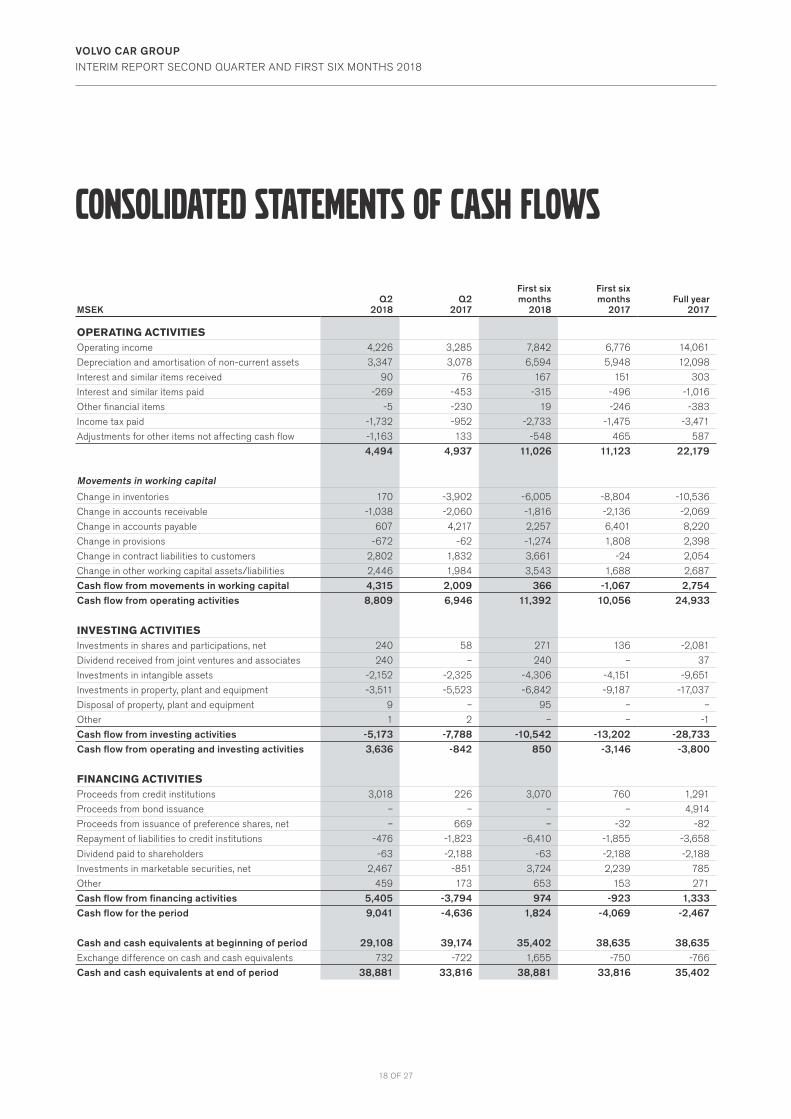
CONSOLIDATED STATEMENTS OF CASH FLOWS
MSEKQ2
2018Q2
2017
First six months
2018
First six months
2017Full year
2017
OPERATING ACTIVITIESOperating income 4,226 3,285 7,842 6,776 14,061
Depreciation and amortisation of non-current assets 3,347 3,078 6,594 5,948 12,098
Interest and similar items received 90 76 167 151 303
Interest and similar items paid -269 -453 -315 -496 -1,016
Other financial items -5 -230 19 -246 -383
Income tax paid -1,732 -952 -2,733 -1,475 -3,471
Adjustments for other items not affecting cash flow -1,163 133 -548 465 587
4,494 4,937 11,026 11,123 22,179
Movements in working capital
Change in inventories 170 -3,902 -6,005 -8,804 -10,536
Change in accounts receivable -1,038 -2,060 -1,816 -2,136 -2,069
Change in accounts payable 607 4,217 2,257 6,401 8,220
Change in provisions -672 -62 -1,274 1,808 2,398
Change in contract liabilities to customers 2,802 1,832 3,661 -24 2,054
Change in other working capital assets/liabilities 2,446 1,984 3,543 1,688 2,687
Cash flow from movements in working capital 4,315 2,009 366 -1,067 2,754Cash flow from operating activities 8,809 6,946 11,392 10,056 24,933
INVESTING ACTIVITIESInvestments in shares and participations, net 240 58 271 136 -2,081
Dividend received from joint ventures and associates 240 – 240 – 37
Investments in intangible assets -2,152 -2,325 -4,306 -4,151 -9,651
Investments in property, plant and equipment -3,511 -5,523 -6,842 -9,187 -17,037
Disposal of property, plant and equipment 9 – 95 – –
Other 1 2 – – -1
Cash flow from investing activities -5,173 -7,788 -10,542 -13,202 -28,733Cash flow from operating and investing activities 3,636 -842 850 -3,146 -3,800
FINANCING ACTIVITIESProceeds from credit institutions 3,018 226 3,070 760 1,291
Proceeds from bond issuance – – – – 4,914
Proceeds from issuance of preference shares, net – 669 – -32 -82
Repayment of liabilities to credit institutions -476 -1,823 -6,410 -1,855 -3,658
Dividend paid to shareholders -63 -2,188 -63 -2,188 -2,188
Investments in marketable securities, net 2,467 -851 3,724 2,239 785
Other 459 173 653 153 271
Cash flow from financing activities 5,405 -3,794 974 -923 1,333Cash flow for the period 9,041 -4,636 1,824 -4,069 -2,467
Cash and cash equivalents at beginning of period 29,108 39,174 35,402 38,635 38,635Exchange difference on cash and cash equivalents 732 -722 1,655 -750 -766
Cash and cash equivalents at end of period 38,881 33,816 38,881 33,816 35,402
19 OF 27
VOLVO CAR GROUP
INTERIM REPORT SECOND QUARTER AND FIRST SIX MONTHS 2018
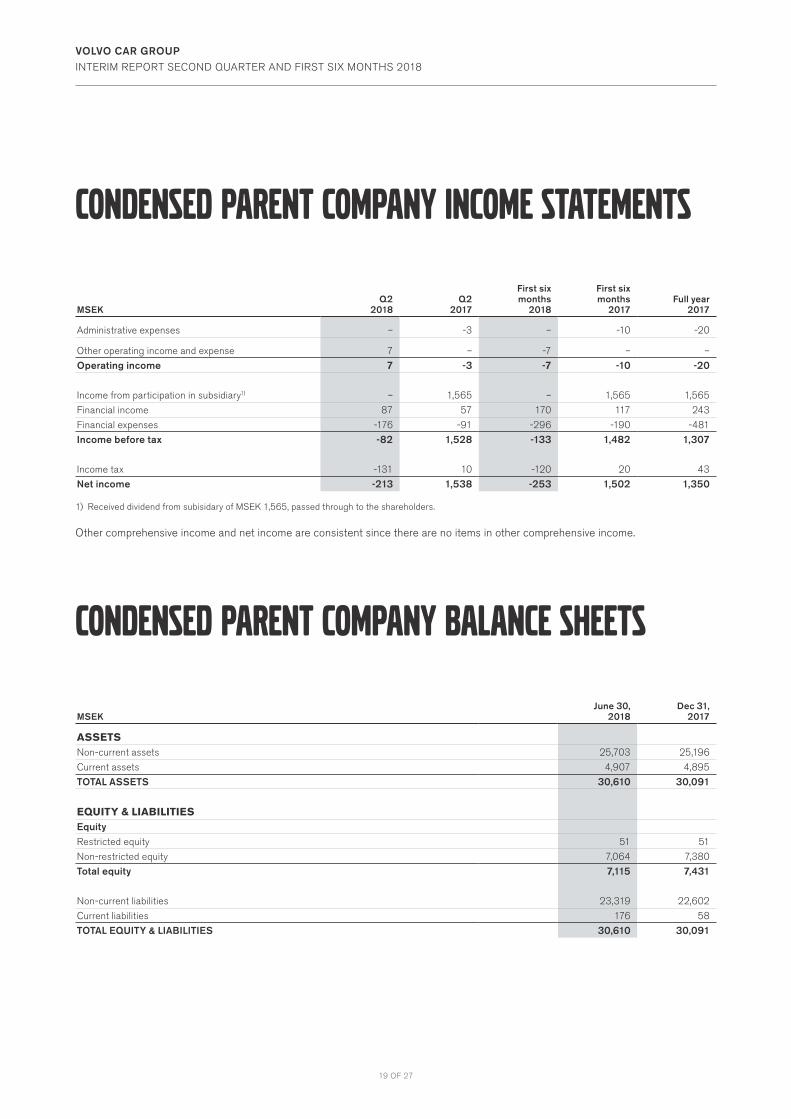
CONDENSED PARENT COMPANY INCOME STATEMENTS
CONDENSED PARENT COMPANY BALANCE SHEETS
MSEKQ2
2018Q2
2017
First six months
2018
First six months
2017Full year
2017
Administrative expenses – -3 – -10 -20
Other operating income and expense 7 – -7 – –
Operating income 7 -3 -7 -10 -20
Income from participation in subsidiary1) – 1,565 – 1,565 1,565
Financial income 87 57 170 117 243
Financial expenses -176 -91 -296 -190 -481
Income before tax -82 1,528 -133 1,482 1,307
Income tax -131 10 -120 20 43
Net income -213 1,538 -253 1,502 1,350
1) Received dividend from subisidary of MSEK 1,565, passed through to the shareholders.
Other comprehensive income and net income are consistent since there are no items in other comprehensive income.
MSEK June 30,
2018Dec 31,
2017
ASSETSNon-current assets 25,703 25,196
Current assets 4,907 4,895
TOTAL ASSETS 30,610 30,091
EQUITY & LIABILITIESEquityRestricted equity 51 51
Non-restricted equity 7,064 7,380
Total equity 7,115 7,431
Non-current liabilities 23,319 22,602
Current liabilities 176 58
TOTAL EQUITY & LIABILITIES 30,610 30,091
20 OF 27
VOLVO CAR GROUP
INTERIM REPORT SECOND QUARTER AND FIRST SIX MONTHS 2018
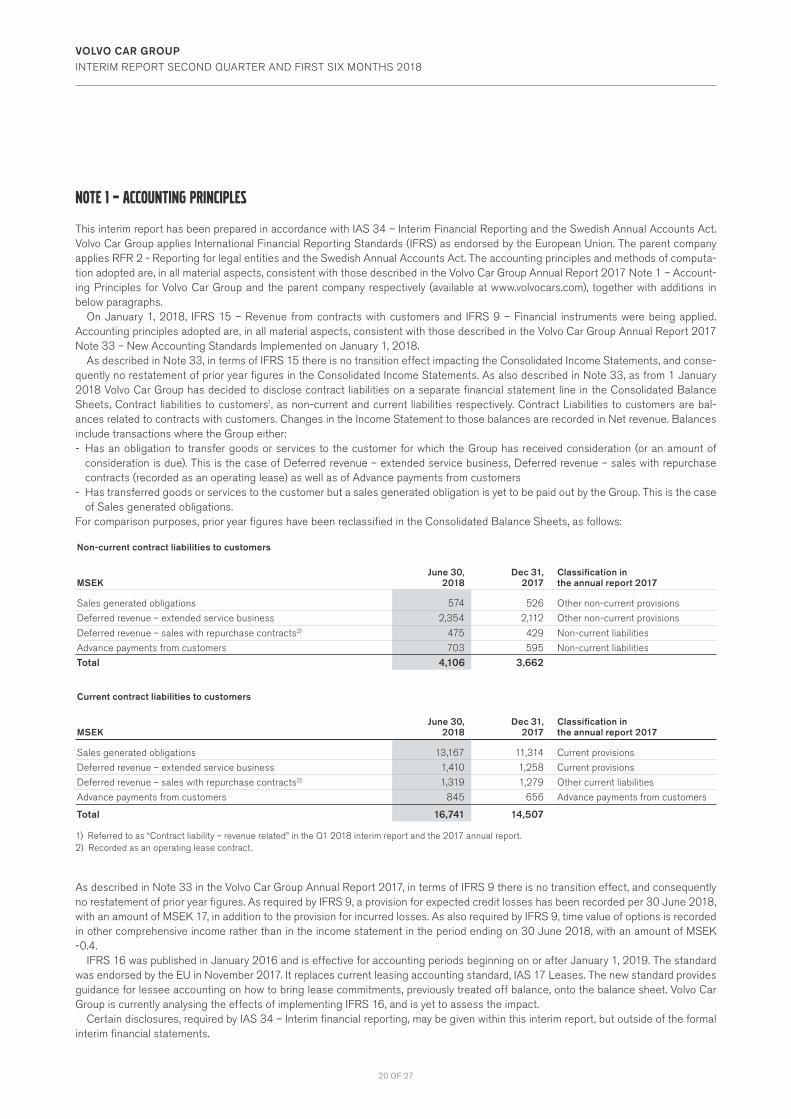
NOTE 1 – ACCOUNTING PRINCIPLES
This interim report has been prepared in accordance with IAS 34 – Interim Financial Reporting and the Swedish Annual Accounts Act. Volvo Car Group applies International Financial Reporting Standards (IFRS) as endorsed by the European Union. The parent company applies RFR 2 - Reporting for legal entities and the Swedish Annual Accounts Act. The accounting principles and methods of computa-tion adopted are, in all material aspects, consistent with those described in the Volvo Car Group Annual Report 2017 Note 1 – Account-ing Principles for Volvo Car Group and the parent company respectively (available at www.volvocars.com), together with additions in below paragraphs.
On January 1, 2018, IFRS 15 – Revenue from contracts with customers and IFRS 9 – Financial instruments were being applied. Accounting principles adopted are, in all material aspects, consistent with those described in the Volvo Car Group Annual Report 2017 Note 33 – New Accounting Standards Implemented on January 1, 2018.
As described in Note 33, in terms of IFRS 15 there is no transition effect impacting the Consolidated Income Statements, and conse-quently no restatement of prior year figures in the Consolidated Income Statements. As also described in Note 33, as from 1 January 2018 Volvo Car Group has decided to disclose contract liabilities on a separate financial statement line in the Consolidated Balance Sheets, Contract liabilities to customers1, as non-current and current liabilities respectively. Contract Liabilities to customers are bal-ances related to contracts with customers. Changes in the Income Statement to those balances are recorded in Net revenue. Balances include transactions where the Group either:- Has an obligation to transfer goods or services to the customer for which the Group has received consideration (or an amount of
consideration is due). This is the case of Deferred revenue – extended service business, Deferred revenue – sales with repurchase contracts (recorded as an operating lease) as well as of Advance payments from customers
- Has transferred goods or services to the customer but a sales generated obligation is yet to be paid out by the Group. This is the case of Sales generated obligations.
For comparison purposes, prior year figures have been reclassified in the Consolidated Balance Sheets, as follows:
Non-current contract liabilities to customers
MSEK
June 30,
2018
Dec 31,
2017Classification in the annual report 2017
Sales generated obligations 574 526 Other non-current provisions
Deferred revenue – extended service business 2,354 2,112 Other non-current provisions
Deferred revenue – sales with repurchase contracts2) 475 429 Non-current liabilities
Advance payments from customers 703 595 Non-current liabilities
Total 4,106 3,662
Current contract liabilities to customers
MSEK
June 30,
2018
Dec 31,
2017Classification in the annual report 2017
Sales generated obligations 13,167 11,314 Current provisions
Deferred revenue – extended service business 1,410 1,258 Current provisions
Deferred revenue – sales with repurchase contracts2) 1,319 1,279 Other current liabilities
Advance payments from customers 845 656 Advance payments from customers
Total 16,741 14,507
1) Referred to as “Contract liability – revenue related” in the Q1 2018 interim report and the 2017 annual report.2) Recorded as an operating lease contract.
As described in Note 33 in the Volvo Car Group Annual Report 2017, in terms of IFRS 9 there is no transition effect, and consequently no restatement of prior year figures. As required by IFRS 9, a provision for expected credit losses has been recorded per 30 June 2018, with an amount of MSEK 17, in addition to the provision for incurred losses. As also required by IFRS 9, time value of options is recorded in other comprehensive income rather than in the income statement in the period ending on 30 June 2018, with an amount of MSEK -0.4.
IFRS 16 was published in January 2016 and is effective for accounting periods beginning on or after January 1, 2019. The standard was endorsed by the EU in November 2017. It replaces current leasing accounting standard, IAS 17 Leases. The new standard provides guidance for lessee accounting on how to bring lease commitments, previously treated off balance, onto the balance sheet. Volvo Car Group is currently analysing the effects of implementing IFRS 16, and is yet to assess the impact.
Certain disclosures, required by IAS 34 – Interim financial reporting, may be given within this interim report, but outside of the formal interim financial statements.
21 OF 27
VOLVO CAR GROUP
INTERIM REPORT SECOND QUARTER AND FIRST SIX MONTHS 2018
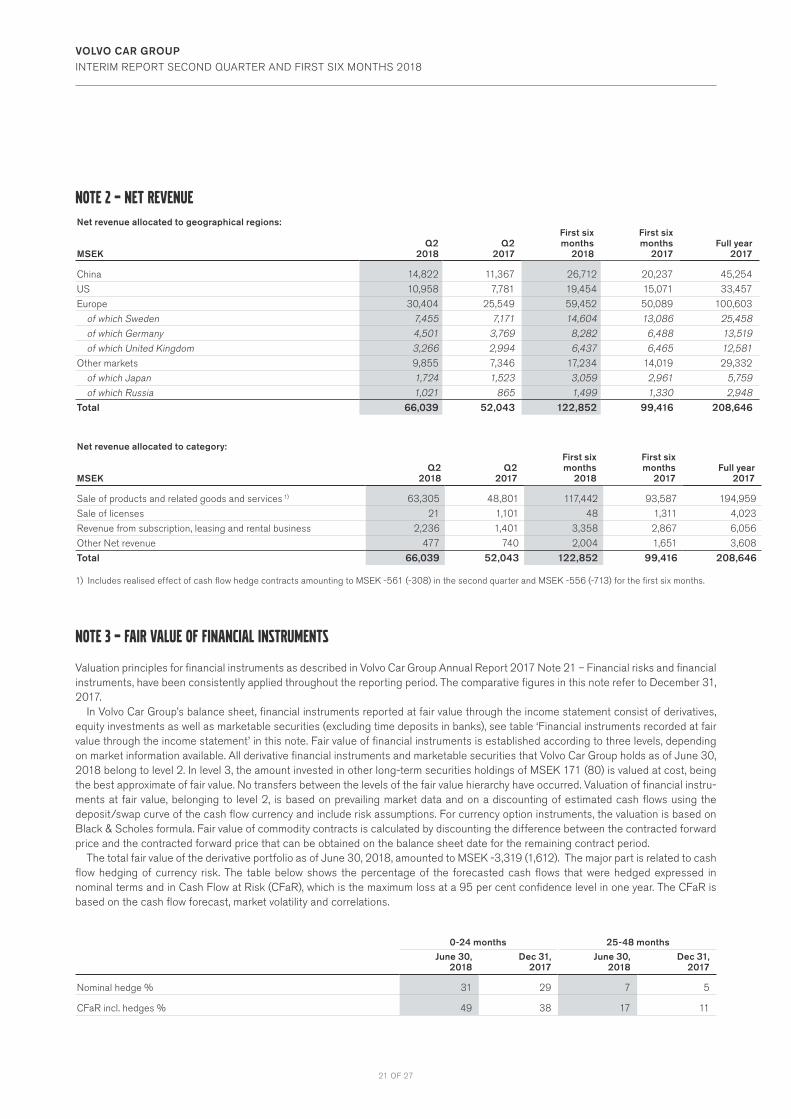
NOTE 2 – net revenueNet revenue allocated to geographical regions:
MSEKQ2
2018Q2
2017
First six months
2018
First six months
2017Full year
2017
China 14,822 11,367 26,712 20,237 45,254
US 10,958 7,781 19,454 15,071 33,457
Europe 30,404 25,549 59,452 50,089 100,603
of which Sweden 7,455 7,171 14,604 13,086 25,458 of which Germany 4,501 3,769 8,282 6,488 13,519 of which United Kingdom 3,266 2,994 6,437 6,465 12,581Other markets 9,855 7,346 17,234 14,019 29,332
of which Japan 1,724 1,523 3,059 2,961 5,759 of which Russia 1,021 865 1,499 1,330 2,948Total 66,039 52,043 122,852 99,416 208,646
Net revenue allocated to category:
MSEKQ2
2018Q2
2017
First six months
2018
First six months
2017Full year
2017
Sale of products and related goods and services 1) 63,305 48,801 117,442 93,587 194,959
Sale of licenses 21 1,101 48 1,311 4,023
Revenue from subscription, leasing and rental business 2,236 1,401 3,358 2,867 6,056
Other Net revenue 477 740 2,004 1,651 3,608
Total 66,039 52,043 122,852 99,416 208,646
1) Includes realised effect of cash flow hedge contracts amounting to MSEK -561 (-308) in the second quarter and MSEK -556 (-713) for the first six months.
NOTE 3 – FAIR VALUE OF FINANCIAL INSTRUMENTS
Valuation principles for financial instruments as described in Volvo Car Group Annual Report 2017 Note 21 – Financial risks and financial instruments, have been consistently applied throughout the reporting period. The comparative figures in this note refer to December 31, 2017.
In Volvo Car Group’s balance sheet, financial instruments reported at fair value through the income statement consist of derivatives, equity investments as well as marketable securities (excluding time deposits in banks), see table ‘Financial instruments recorded at fair value through the income statement’ in this note. Fair value of financial instruments is established according to three levels, depending on market information available. All derivative financial instruments and marketable securities that Volvo Car Group holds as of June 30, 2018 belong to level 2. In level 3, the amount invested in other long-term securities holdings of MSEK 171 (80) is valued at cost, being the best approximate of fair value. No transfers between the levels of the fair value hierarchy have occurred. Valuation of financial instru-ments at fair value, belonging to level 2, is based on prevailing market data and on a discounting of estimated cash flows using the deposit/swap curve of the cash flow currency and include risk assumptions. For currency option instruments, the valuation is based on Black & Scholes formula. Fair value of commodity contracts is calculated by discounting the difference between the contracted forward price and the contracted forward price that can be obtained on the balance sheet date for the remaining contract period.
The total fair value of the derivative portfolio as of June 30, 2018, amounted to MSEK -3,319 (1,612). The major part is related to cash flow hedging of currency risk. The table below shows the percentage of the forecasted cash flows that were hedged expressed in nominal terms and in Cash Flow at Risk (CFaR), which is the maximum loss at a 95 per cent confidence level in one year. The CFaR is based on the cash flow forecast, market volatility and correlations.
0-24 months 25-48 months
June 30, 2018
Dec 31,2017
June 30, 2018
Dec 31,2017
Nominal hedge % 31 29 7 5
CFaR incl. hedges % 49 38 17 11
22 OF 27
VOLVO CAR GROUP
INTERIM REPORT SECOND QUARTER AND FIRST SIX MONTHS 2018
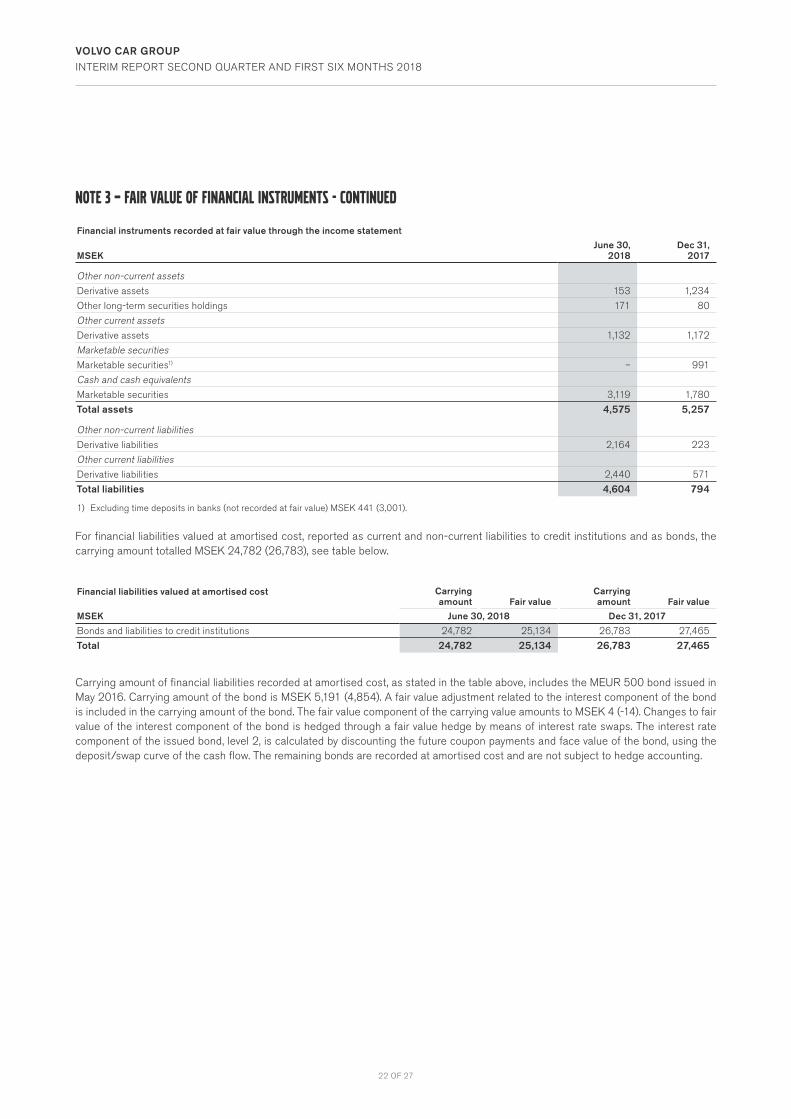
NOTE 3 – FAIR VALUE OF FINANCIAL INSTRUMENTS - continued
Financial instruments recorded at fair value through the income statement
MSEKJune 30,
2018Dec 31,
2017
Other non-current assetsDerivative assets 153 1,234
Other long-term securities holdings 171 80
Other current assetsDerivative assets 1,132 1,172
Marketable securitiesMarketable securities1) – 991
Cash and cash equivalentsMarketable securities 3,119 1,780
Total assets 4,575 5,257
Other non-current liabilitiesDerivative liabilities 2,164 223
Other current liabilitiesDerivative liabilities 2,440 571
Total liabilities 4,604 794
1) Excluding time deposits in banks (not recorded at fair value) MSEK 441 (3,001).
For financial liabilities valued at amortised cost, reported as current and non-current liabilities to credit institutions and as bonds, the carrying amount totalled MSEK 24,782 (26,783), see table below.
Financial liabilities valued at amortised cost Carrying amount Fair value
Carrying amount Fair value
MSEK June 30, 2018 Dec 31, 2017
Bonds and liabilities to credit institutions 24,782 25,134 26,783 27,465
Total 24,782 25,134 26,783 27,465
Carrying amount of financial liabilities recorded at amortised cost, as stated in the table above, includes the MEUR 500 bond issued in May 2016. Carrying amount of the bond is MSEK 5,191 (4,854). A fair value adjustment related to the interest component of the bond is included in the carrying amount of the bond. The fair value component of the carrying value amounts to MSEK 4 (-14). Changes to fair value of the interest component of the bond is hedged through a fair value hedge by means of interest rate swaps. The interest rate component of the issued bond, level 2, is calculated by discounting the future coupon payments and face value of the bond, using the deposit/swap curve of the cash flow. The remaining bonds are recorded at amortised cost and are not subject to hedge accounting.
23 OF 27
VOLVO CAR GROUP
INTERIM REPORT SECOND QUARTER AND FIRST SIX MONTHS 2018
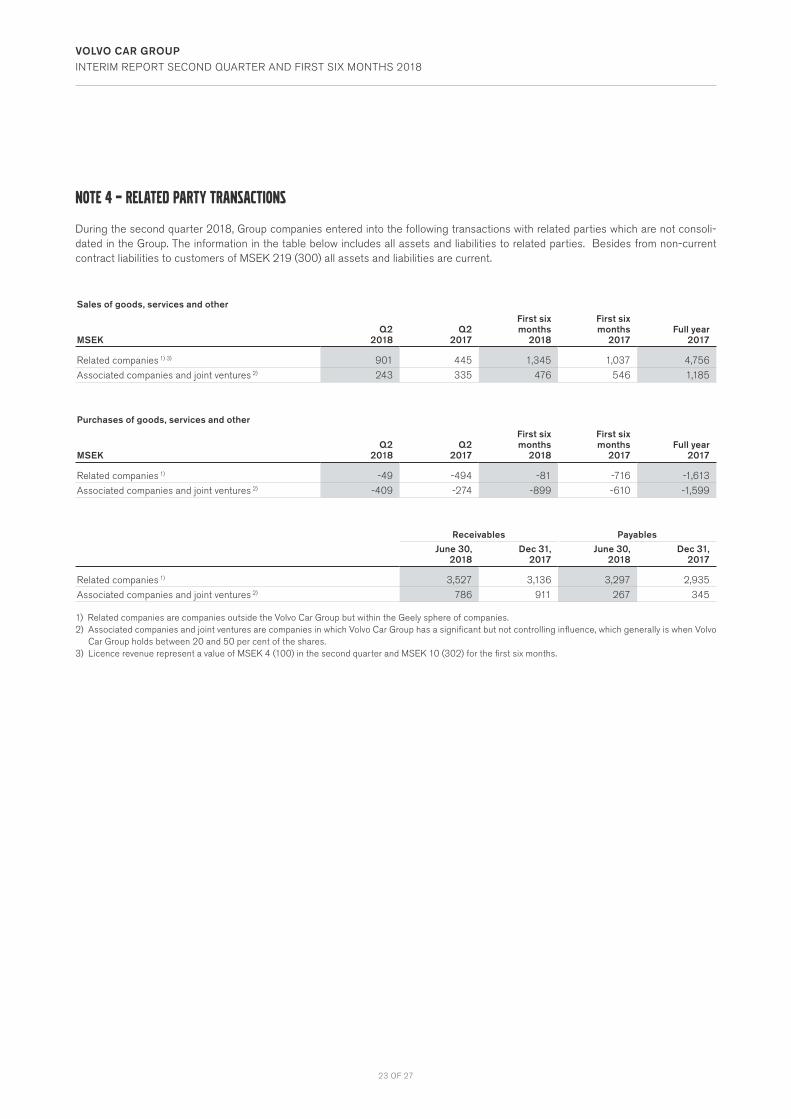
NOTE 4 – RELATED PARTY TRANSACTIONS
During the second quarter 2018, Group companies entered into the following transactions with related parties which are not consoli-dated in the Group. The information in the table below includes all assets and liabilities to related parties. Besides from non-current contract liabilities to customers of MSEK 219 (300) all assets and liabilities are current.
Sales of goods, services and other
MSEKQ2
2018Q2
2017
First six months
2018
First six months
2017Full year
2017
Related companies 1) 3) 901 445 1,345 1,037 4,756
Associated companies and joint ventures 2) 243 335 476 546 1,185
Purchases of goods, services and other
MSEKQ2
2018Q2
2017
First six months
2018
First six months
2017Full year
2017
Related companies 1) -49 -494 -81 -716 -1,613
Associated companies and joint ventures 2) -409 -274 -899 -610 -1,599
Receivables Payables
June 30, 2018
Dec 31,2017
June 30, 2018
Dec 31,2017
Related companies 1) 3,527 3,136 3,297 2,935
Associated companies and joint ventures 2) 786 911 267 345
1) Related companies are companies outside the Volvo Car Group but within the Geely sphere of companies. 2) Associated companies and joint ventures are companies in which Volvo Car Group has a significant but not controlling influence, which generally is when Volvo
Car Group holds between 20 and 50 per cent of the shares.3) Licence revenue represent a value of MSEK 4 (100) in the second quarter and MSEK 10 (302) for the first six months.
24 OF 27
VOLVO CAR GROUP
INTERIM REPORT SECOND QUARTER AND FIRST SIX MONTHS 2018
GENERAL DEFINITIONS
Volvo Car Group and Volvo CarsVolvo Car AB (publ.), Volvo Car Corporation and all its subsidiaries.
Joint venture companiesJoint ventures refer to companies in which Volvo Car Group, through contractual cooperation together with one or more parties, has a joint control over the operational and financial management.
Gross marginGross margin is Gross income as a percentage of Net revenue and represents the percent of total Net revenue that Volvo Cars retains after incurring the direct costs associated with producing the goods and services sold.
EBITEBIT represents earnings before interest and taxes. EBIT is syn-onymous with operating income which measures the profit Volvo Car Group generates from its operations.
EBIT marginEBIT margin is EBIT as a percentage of Net revenue and meas-ures Volvo Car Group’s operating efficiency.
EBITDAEBITDA represents earnings before interest, taxes, depreciations and amortisation, and is another measurement of the operating performance. It measures the profit Volvo Car Group generate from its operations without effect from previous periods capitali-sation levels.
EBITDA marginEBITDA margin is EBITDA in percentage of Net revenue.
Equity ratioTotal equity divided by total assets, is a measurement of Volvo Car Group’s long-term solvency and financial leverage.
Net cash/net debtNet cash/net debt is an indicator of Volvo Car Group’s ability to meet its financial obligations. It is represented by liabilities to credit institutions, bonds and other interest-bearing non- current liabilities, less cash and cash equivalents and marketable securi-ties. If negative, the performance measure is referred to as net cash and if positive the performance measure is referred to as net debt.
LiquidityLiquidity consist of cash and cash equivalents, undrawn credit facilities and marketable securities.
Retail salesRetail sales refer to sales to end customers (including a portion of cars used as customer loaner and demo cars) and is a relevant measure of the demand for Volvo Cars from an end customer point of view.
EuropeEurope is defined as EU28+EFTA.
Passenger carsPassenger cars are vehicles with at least four wheels, used for the transport of passengers, and comprising no more than eight seats in addition to the driver’s seat.
Performance measures disclosed in the interim report are those that are deemed to give a relevant view of Volvo Car Group’s financial performance for a reader of the interim report. For a reconciliation of performance measures, refer to page 25.
DEFINITIONS OF PERFORMANCE MEASURES
25 OF 27
VOLVO CAR GROUP
INTERIM REPORT SECOND QUARTER AND FIRST SIX MONTHS 2018
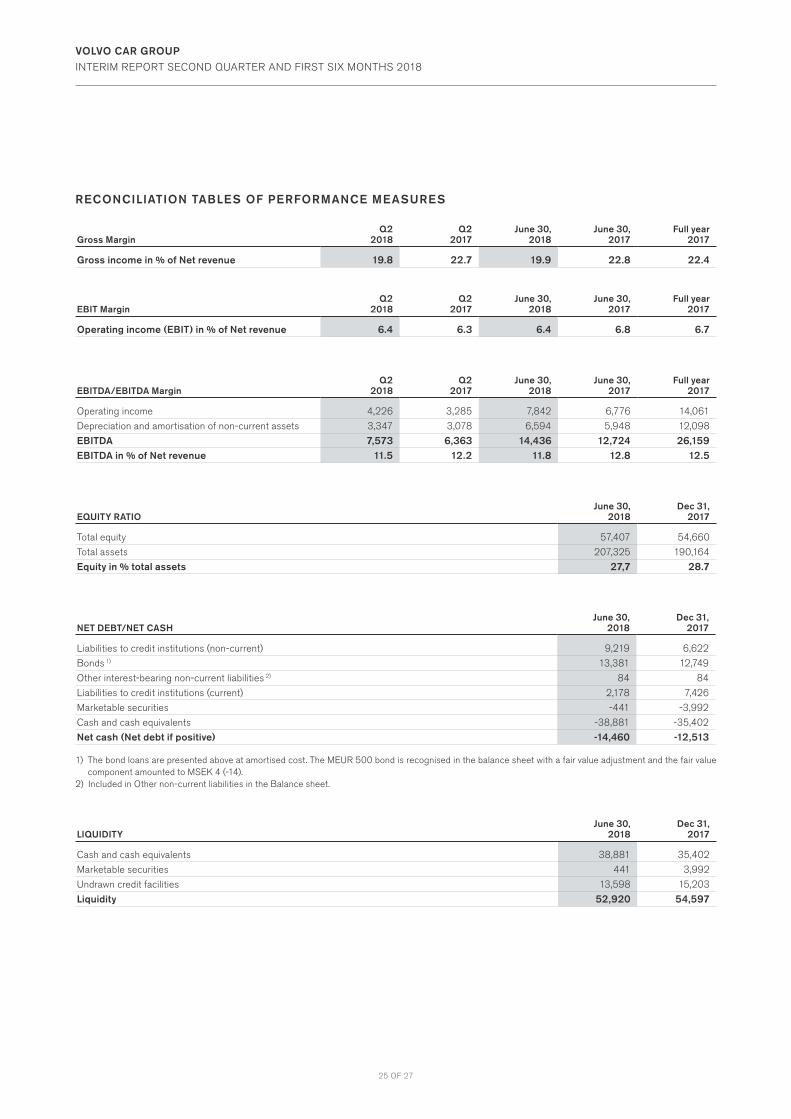
RECONCILIATION TABLES OF PERFORMANCE MEASURES
Gross MarginQ2
2018Q2
2017June 30,
2018June 30,
2017Full year
2017
Gross income in % of Net revenue 19.8 22.7 19.9 22.8 22.4
EBIT MarginQ2
2018Q2
2017June 30,
2018June 30,
2017Full year
2017
Operating income (EBIT) in % of Net revenue 6.4 6.3 6.4 6.8 6.7
EBITDA/EBITDA MarginQ2
2018Q2
2017June 30,
2018June 30,
2017Full year
2017
Operating income 4,226 3,285 7,842 6,776 14,061
Depreciation and amortisation of non-current assets 3,347 3,078 6,594 5,948 12,098
EBITDA 7,573 6,363 14,436 12,724 26,159EBITDA in % of Net revenue 11.5 12.2 11.8 12.8 12.5
EQUITY RATIOJune 30,
2018Dec 31,
2017
Total equity 57,407 54,660
Total assets 207,325 190,164
Equity in % total assets 27,7 28.7
NET DEBT/NET CASH June 30,
2018Dec 31,
2017
Liabilities to credit institutions (non-current) 9,219 6,622
Bonds 1) 13,381 12,749
Other interest-bearing non-current liabilities 2) 84 84
Liabilities to credit institutions (current) 2,178 7,426
Marketable securities -441 -3,992
Cash and cash equivalents -38,881 -35,402
Net cash (Net debt if positive) -14,460 -12,513
1) The bond loans are presented above at amortised cost. The MEUR 500 bond is recognised in the balance sheet with a fair value adjustment and the fair value component amounted to MSEK 4 (-14).
2) Included in Other non-current liabilities in the Balance sheet.
LIQUIDITYJune 30,
2018Dec 31,
2017
Cash and cash equivalents 38,881 35,402
Marketable securities 441 3,992
Undrawn credit facilities 13,598 15,203
Liquidity 52,920 54,597
26 OF 27
VOLVO CAR GROUP
INTERIM REPORT SECOND QUARTER AND FIRST SIX MONTHS 2018
CONTACT
Nils MöskoVice President, Head of Investor Relations+46-(0)31–59 21 [email protected]
Volvo Car Group Headquarters405 31 Gothenburgwww.volvocars.com
The President and Chief Executive Officer certifies that the interim report gives a fair view of the performance of the business, position and income statements of Volvo Car AB (publ.) and Volvo Car Group, and describes the principal risks and uncertainties to which Volvo Car AB (publ.) and the Volvo Car Group is exposed.
Gothenburg, July 18th, 2018
Håkan SamuelssonPresident and Chief Executive Officer
REVIEW REPORT
IntroductionWe have reviewed the condensed interim financial information (interim report) of Volvo Car AB (publ.) as of June 30, 2018 and the six-month period then ended. The Board of Directors and the President are responsible for the preparation and presentation of this interim report in accordance with IAS 34 and the Annual Accounts Act. Our responsibility is to express a conclusion on this interim report based on our review.
Scope of ReviewWe conducted our review in accordance with the International Standard on Review Engagements ISRE 2410, Review of Interim Financial Information Performed by the Independent Auditor of the Entity. A review consists of making inquiries, primarily of persons responsible for financial and accounting matters, and applying analytical and other review procedures. A review has a different focus and is substan-tially less in scope than an audit conducted in accordance with ISA and other generally accepted auditing practices. The procedures performed in a review do not enable us to obtain a level of assurance that would make us aware of all significant matters that might be identified in an audit. Therefore, the conclusion expressed based on a review does not give the same level of assurance as a conclusion expressed based on an audit.
ConclusionBased on our review, nothing has come to our attention that causes us to believe that the interim report is not, in all material respects, prepared for the Group in accordance with IAS 34 and the Annual Accounts Act, and for the Parent Company in accordance with the Annual Accounts Act.
Gothenburg, July 18, 2018Deloitte AB
Jan Nilsson Authorized Public Accountant