ge global research - aiche | the global home of … global research ge energy university of...
TRANSCRIPT
1 R. Perry
02/22/2013
GE Global Research Robert Perry February 22, 2013
2 R. Perry
2/22/2013
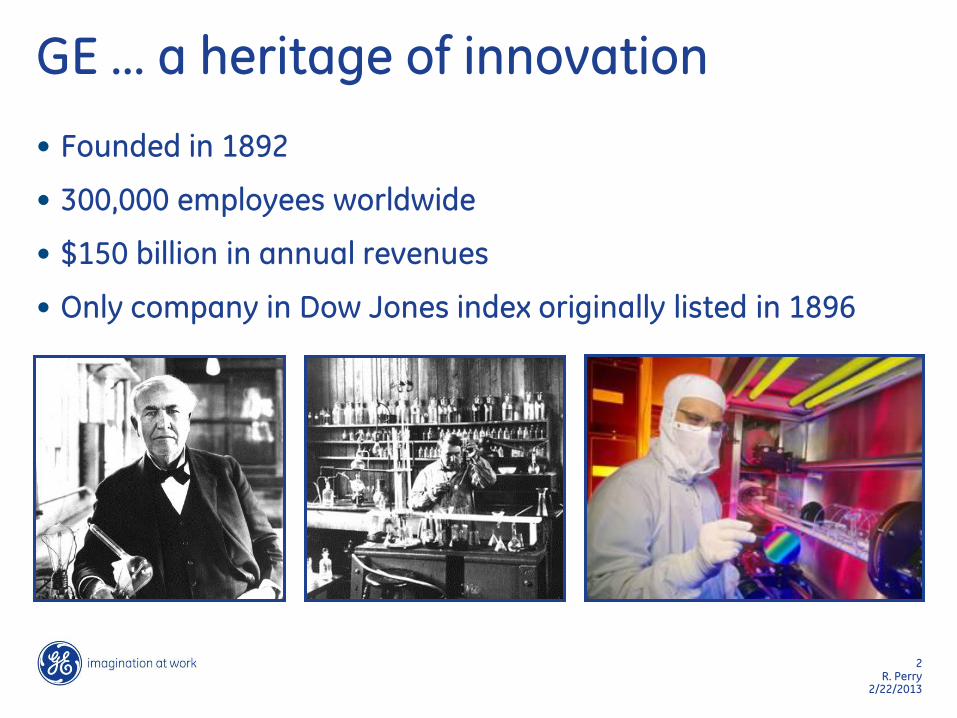
GE … a heritage of innovation
• Founded in 1892
• 300,000 employees worldwide
• $150 billion in annual revenues
• Only company in Dow Jones index originally listed in 1896
3 R. Perry
2/22/2013
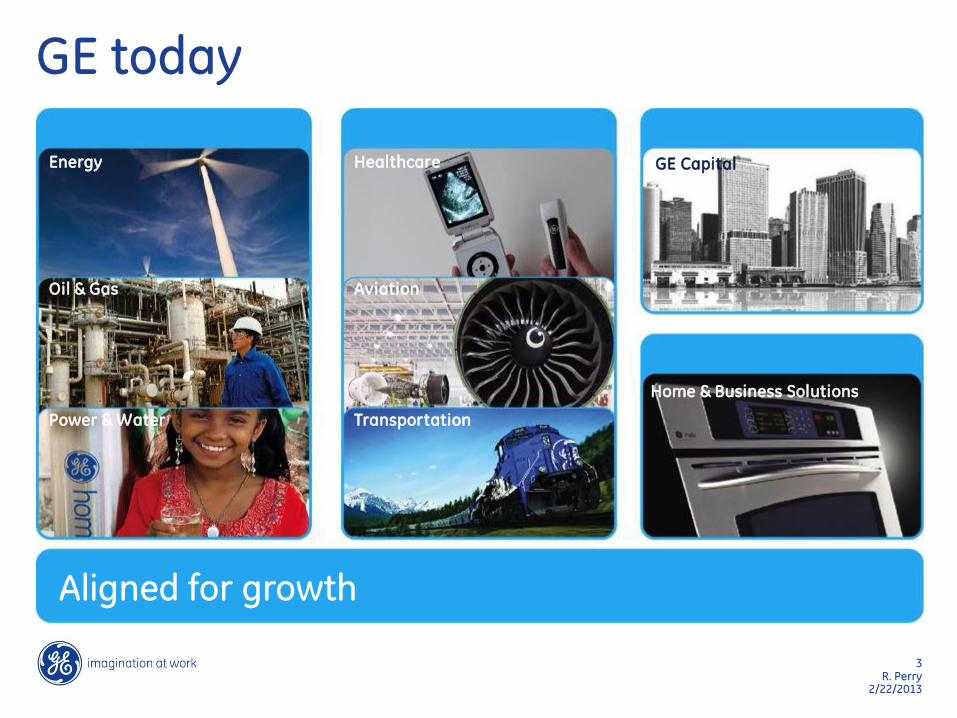
Aligned for growth
GE Capital
Home & Business Solutions
Energy
Oil & Gas
Power & Water
Healthcare
Aviation
Transportation
GE today
4 R. Perry
2/22/2013
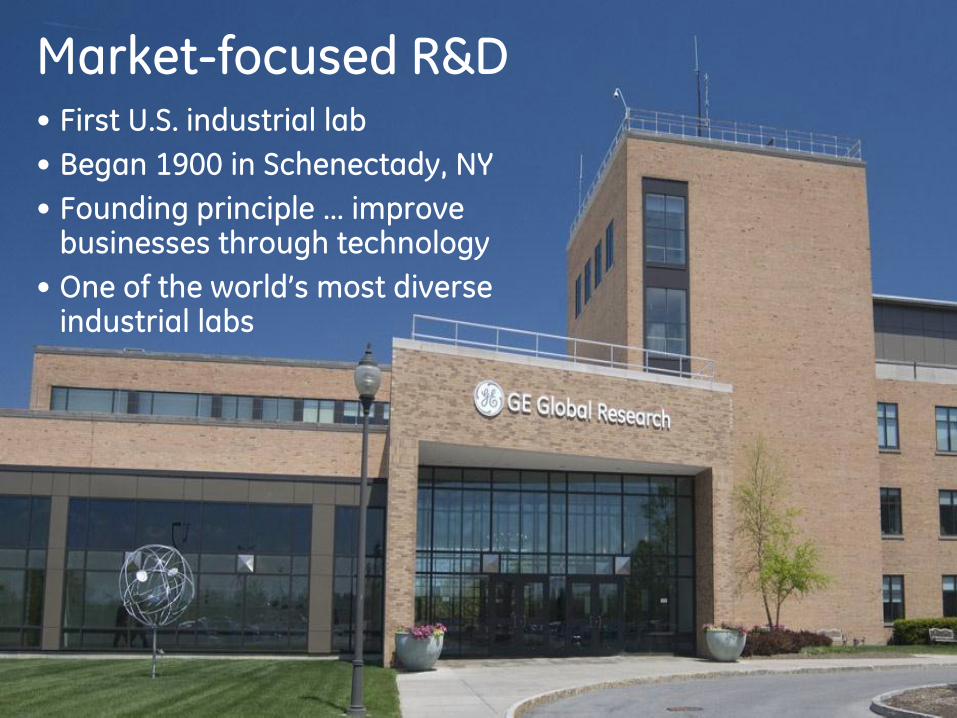
Market-focused R&D • First U.S. industrial lab
• Began 1900 in Schenectady, NY
• Founding principle … improve businesses through technology
• One of the world’s most diverse industrial labs

5 R. Perry
2/22/2013
A tradition of innovation 1909 Ductile tungsten
1913 Medical X-ray
1927 First television broadcast reception
1932 Langmuir Nobel Prize in chemistry
1938 Invisible/glareless glass
1942 First US jet engine
1953 LEXANTM polycarbonate
1955 Man-made diamonds
1962 Semi-conductor laser
1973 Giaever Nobel Prize in physics
1984 Magnetic resonance imaging
1994 GE90® composite fan blade
1999 Digital X-ray
2004 Lightspeed VCT
2009 Wide Bore 1.5T MR System
2010 Energy SmartR LED
2012 Durathon Battery
6 R. Perry
2/22/2013
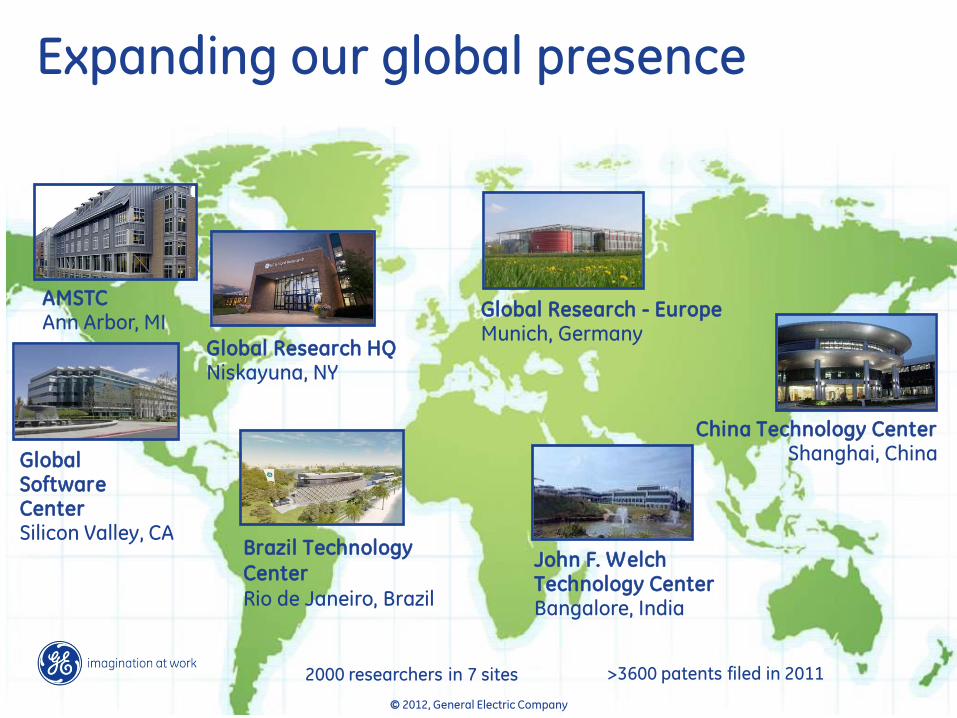
Global Research HQ Niskayuna, NY
Expanding our global presence
John F. Welch Technology Center Bangalore, India
China Technology Center Shanghai, China
Global Research - Europe Munich, Germany
© 2012, General Electric Company
Brazil Technology Center Rio de Janeiro, Brazil
AMSTC Ann Arbor, MI
Global Software Center Silicon Valley, CA
>3600 patents filed in 2011 2000 researchers in 7 sites

7 R. Perry
02/22/2013
Carbon Capture
Technology Development at GE
8 R. Perry
02/22/2013
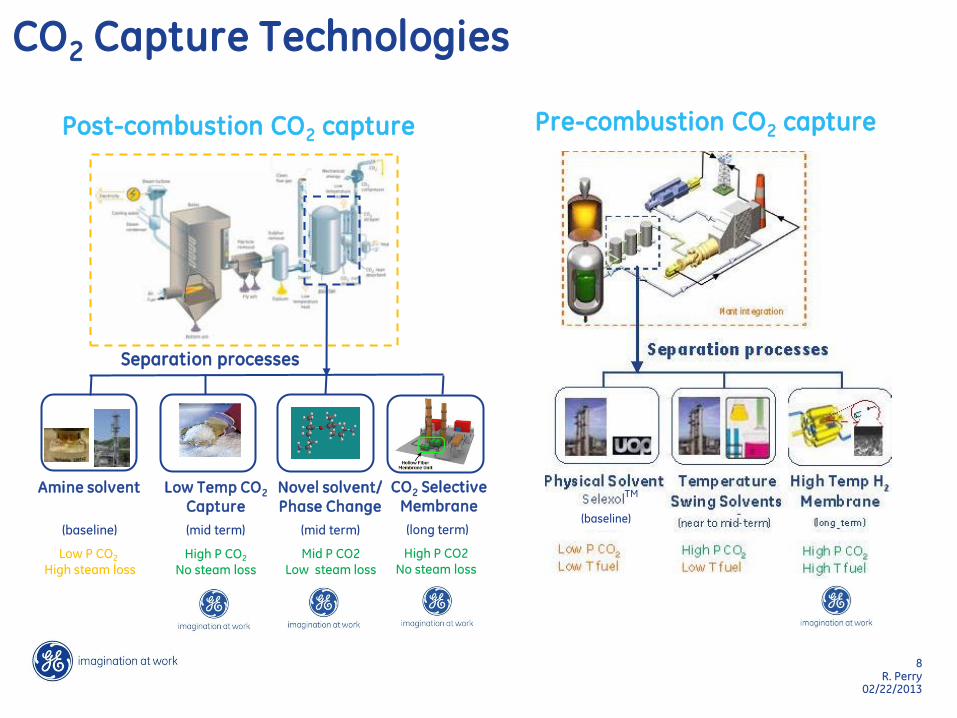
CO2 Capture Technologies
Pre-combustion CO2 capture
(baseline)
Post-combustion CO2 capture
Separation processes
Amine solvent Novel solvent/
Phase Change
Low P CO2 High steam loss
(baseline) (mid term)
Mid P CO2 Low steam loss
(mid term)
High P CO2 No steam loss
Low Temp CO2
Capture
CO2 Selective Membrane
(long term)
High P CO2 No steam loss
TM
9 R. Perry
2/22/2013
• Develop a novel, CO2
capture solvent with:
• 90% Carbon capture efficiency
• 25% Increase in capacity vs MEA
• Less than 35% increase in Cost of Energy Services
Program Objectives
Program Objective: Develop novel solvent and process for post-combustion capture of CO2 from coal-fired power plants with 90% Capture efficiency, and less than 35% increase in cost of electricity
capture
Aminosilicone Solvents for
Post-Combustion CO2 Capture
GE Global Research GE Energy
University of Pittsburgh
Robert Perry
Columbia University February 22, 2013
10 R. Perry
2/22/2013
Acknowledgement . The information, data, or work presented herein was
funded in part by the Advanced Research Projects Agency – Energy (ARPA-E), U.S. Department of Energy, under Award Number DE-AR0000084 and DOE- NETL under Award Numbers DE-NT0005310 and DE-NT0007502.
Disclaimer. The information, data, or work presented herein was funded in
part by an agency of the United States Government. Neither the United States Government nor any agency thereof, nor any of their employees, makes any warranty, express or implied, or assumes any legal liability or responsibility for the accuracy, completeness, or usefulness of any information, apparatus, product, or process disclosed, or represents that its use would not infringe privately owned rights. Reference herein to any specific commercial product, process, or service by trade name, trademark, manufacturer, or otherwise does
not necessarily constitute or imply its endorsement, recommendation, or favoring by the United States Government or any agency thereof. The views and opinions of authors expressed herein do not necessarily state or reflect those of the United States Government or any agency thereof.
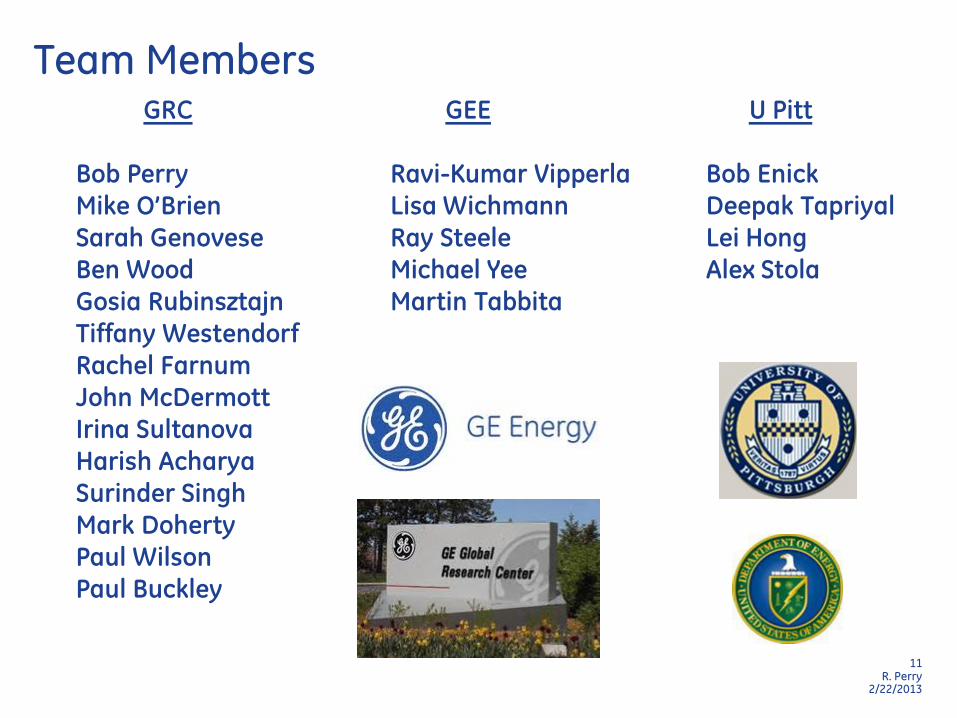
11 R. Perry
2/22/2013
Team Members GRC
Bob Perry
Mike O’Brien
Sarah Genovese
Ben Wood
Gosia Rubinsztajn
Tiffany Westendorf
Rachel Farnum
John McDermott
Irina Sultanova
Harish Acharya
Surinder Singh
Mark Doherty
Paul Wilson
Paul Buckley
GEE
Ravi-Kumar Vipperla
Lisa Wichmann
Ray Steele
Michael Yee
Martin Tabbita
U Pitt
Bob Enick
Deepak Tapriyal
Lei Hong
Alex Stola
12 R. Perry
2/22/2013
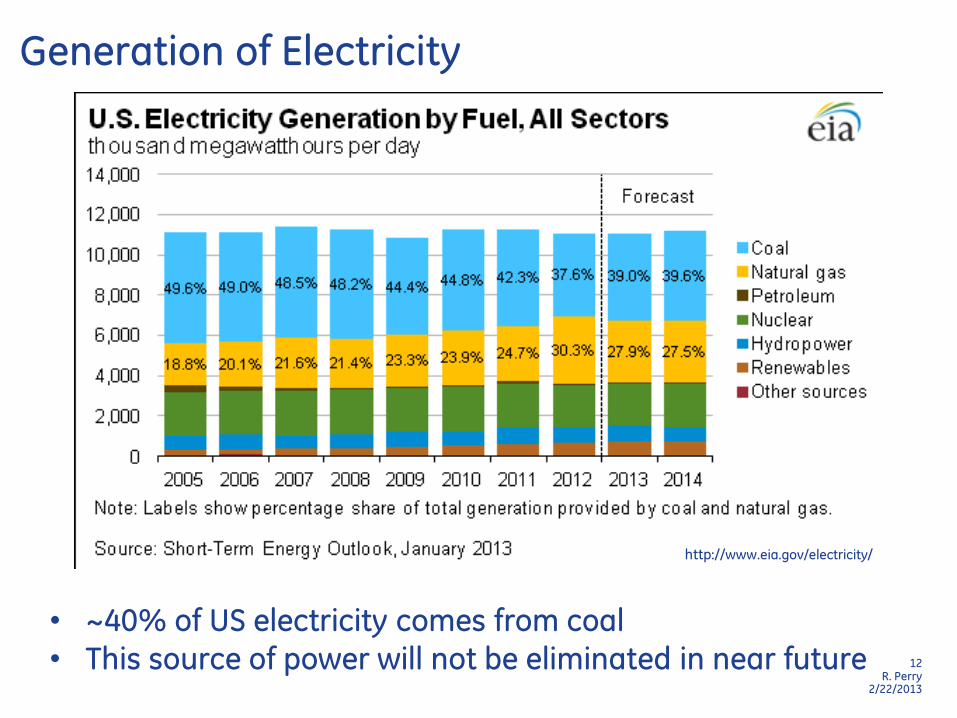
Generation of Electricity
• ~40% of US electricity comes from coal • This source of power will not be eliminated in near future
http://www.eia.gov/electricity/

13 R. Perry
2/22/2013
Generation of Electricity from Coal
General Process Diagram
• Coal is burned in a boiler to generate steam.
• Steam is used to produce electricity.
• Flue gas from boiler treated
to remove solids, NOx, SO2. • CO2 from combustion
currently exhausted to air.
-1400 plants in US produced 318 GW electricity in 2011.
-Also released ~1.7 billion tons of CO2.
-largest commodity chemical is H2SO4 = 60 million tons http://www.eia.gov/electricity/capacity/
http://www.ucsusa.org/clean_energy/coalvswind/c02c.html
http://www.topsoe.com/sitecore/shell/Applications/~/media/PDF%20files/Topsoe_Catalysis_Forum/2007/Peacock.ashx
14 R. Perry
2/22/2013
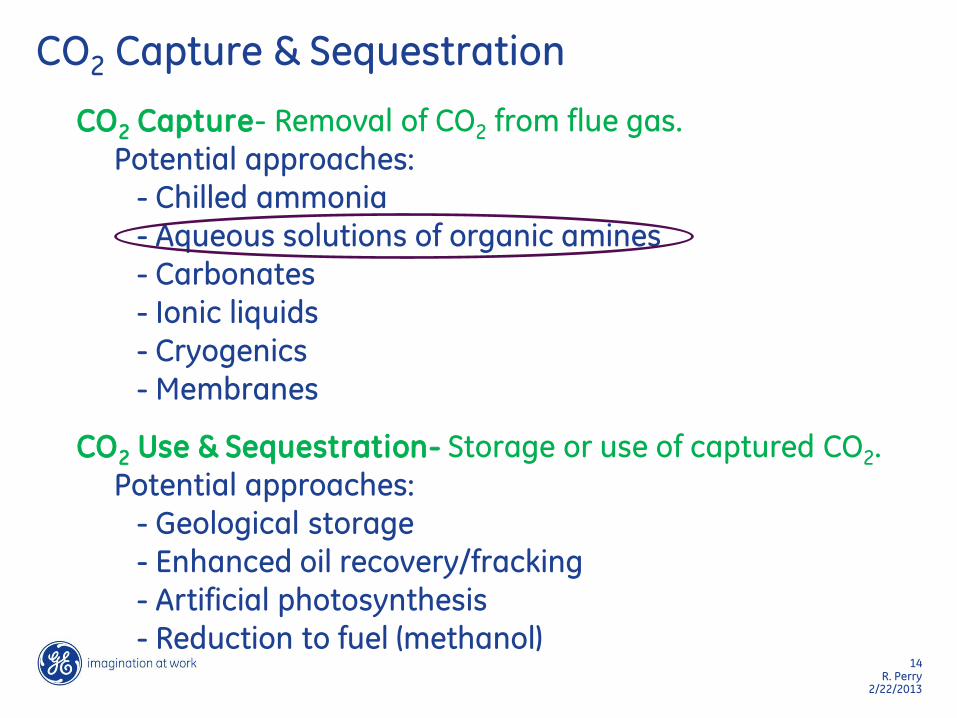
CO2 Capture & Sequestration
CO2 Capture- Removal of CO2 from flue gas. Potential approaches: - Chilled ammonia - Aqueous solutions of organic amines - Carbonates - Ionic liquids - Cryogenics - Membranes
CO2 Use & Sequestration- Storage or use of captured CO2.
Potential approaches: - Geological storage - Enhanced oil recovery/fracking - Artificial photosynthesis - Reduction to fuel (methanol)
15 R. Perry
2/22/2013
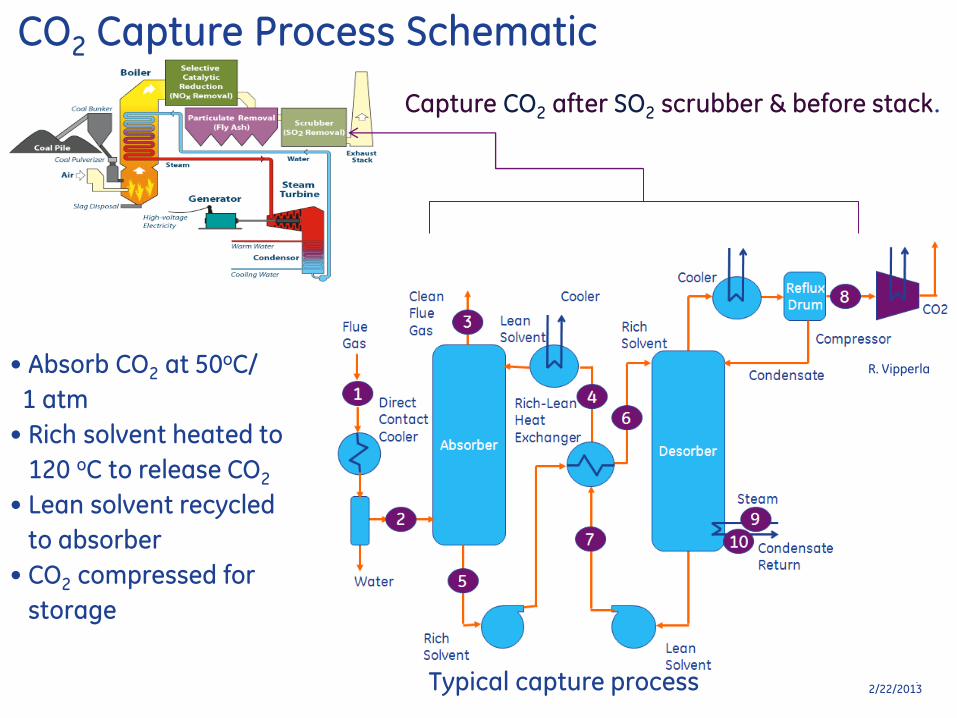
• Absorb CO2 at 50oC/
1 atm
• Rich solvent heated to
120 oC to release CO2
• Lean solvent recycled
to absorber
• CO2 compressed for
storage
CO2 Capture Process Schematic
R. Vipperla
Capture CO2 after SO2 scrubber & before stack.
Typical capture process
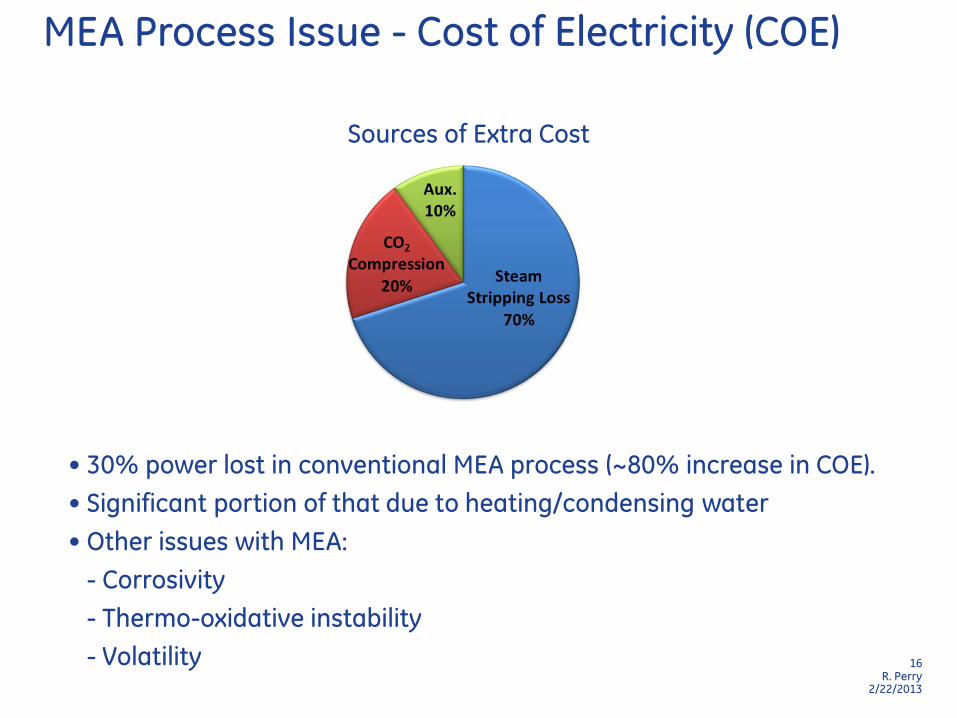
16 R. Perry
2/22/2013
MEA Process Issue - Cost of Electricity (COE)
• 30% power lost in conventional MEA process (~80% increase in COE).
• Significant portion of that due to heating/condensing water
• Other issues with MEA:
- Corrosivity
- Thermo-oxidative instability
- Volatility
Sources of Extra Cost
17 R. Perry
2/22/2013
New Solvent System
Low/no water
Liquid carbamate salt
Thermal stability
High CO2 loading
High desorption pressure
Low desorption energy
Low volatility
High reaction rates
Low cost
Solvent Properties
Aminosiloxanes
DOE Target: Material & Process with >90% CO2 capture efficiency & <35% increase in COE vs plant w/o capture
CO2-philic backbone (physi-sorption)
CO2-reactive group (chemi-sorption)

18 R. Perry
2/22/2013
Aminosiloxanes
• High molecular weight amino polysiloxanes used in conditioners for hair & in textile treatment
• Amine content of these commercial polysiloxanes low little CO2 capacity • Need low molecular weight monomeric or oligomeric
versions • Commercially available examples:
Bis(aminopropyl)tetramethyldisiloxane Bis(aminoethylaminomethyl)tetramethyldisiloxane
GAP-0 GAP-AEAM

19 R. Perry
2/22/2013
Variety of aminosiloxanes
GAP-0
GAP-1
GAP-AEAM
GAP-nPr
M’3T’
GAP-AEAP
M’D’M’
DAB-0
DAB-Me
DAB-Me2
GAP-Dytek
20 R. Perry
02/22/2013
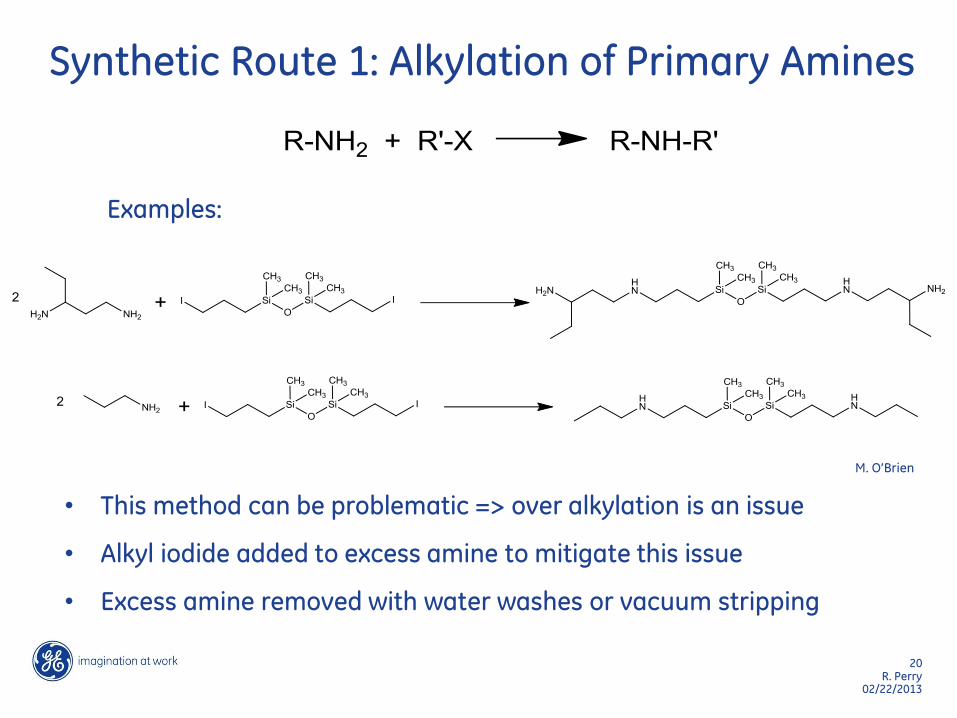
Synthetic Route 1: Alkylation of Primary Amines
Examples:
• This method can be problematic => over alkylation is an issue
• Alkyl iodide added to excess amine to mitigate this issue
• Excess amine removed with water washes or vacuum stripping
M. O’Brien
21 R. Perry
2/22/2013
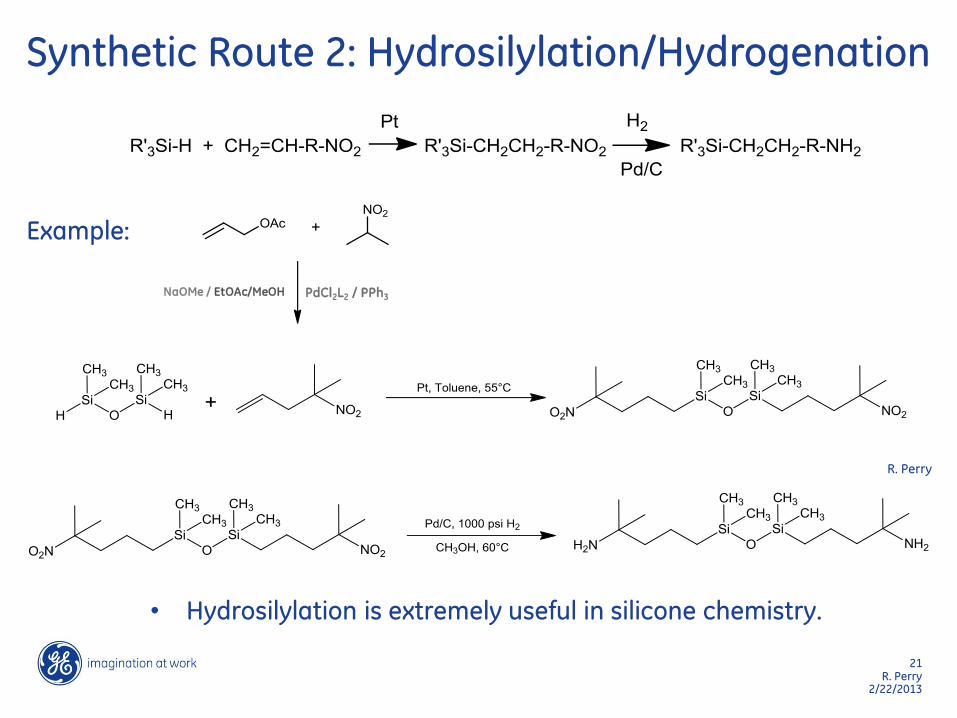
Synthetic Route 2: Hydrosilylation/Hydrogenation
Example:
R. Perry
• Hydrosilylation is extremely useful in silicone chemistry.
NaOMe / EtOAc/MeOH PdCl2L2 / PPh3
22 R. Perry
2/22/2013
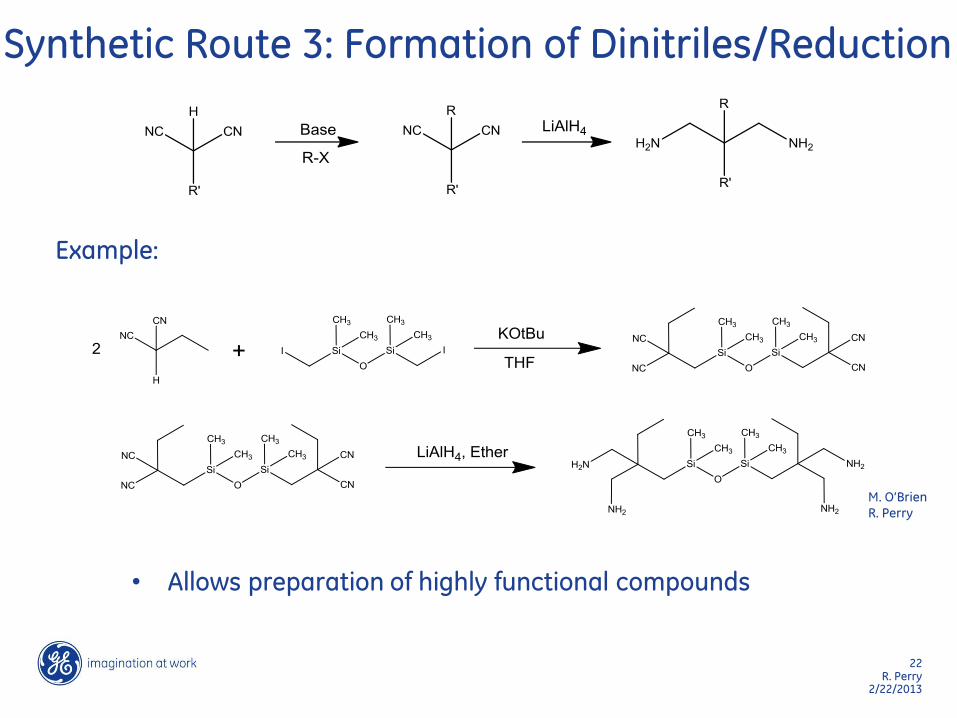
Synthetic Route 3: Formation of Dinitriles/Reduction
Example:
• Allows preparation of highly functional compounds
M. O’Brien R. Perry

23 R. Perry
2/22/2013
Cyclic Disiloxane Derivatives
Ether/THF 60 40
Ether 98 2
mp = 132-134°C
• Cyclic disiloxane formed instead of linear material
• Some reductive decyanation seen in LAH
• Rxn- solvent dependent
M. O’Brien R. Perry
24 R. Perry
2/22/2013
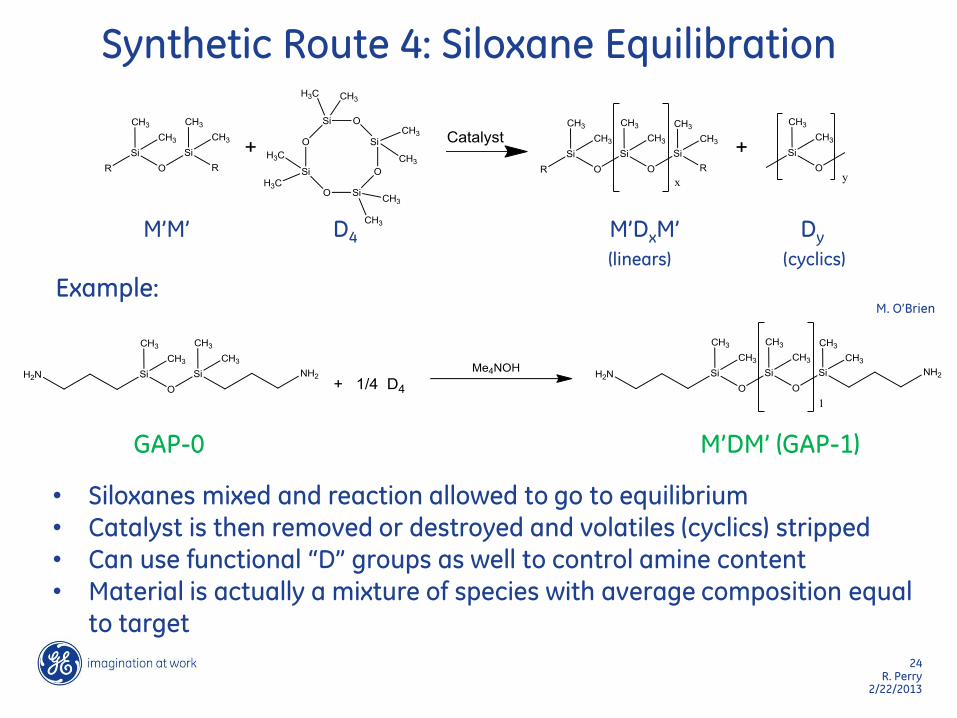
Synthetic Route 4: Siloxane Equilibration
M’M’ D4 M’DxM’ Dy
(linears) (cyclics)
Example:
• Siloxanes mixed and reaction allowed to go to equilibrium
• Catalyst is then removed or destroyed and volatiles (cyclics) stripped
• Can use functional “D” groups as well to control amine content
• Material is actually a mixture of species with average composition equal
to target
M’DM’ (GAP-1) GAP-0
M. O’Brien
25 R. Perry
2/22/2013
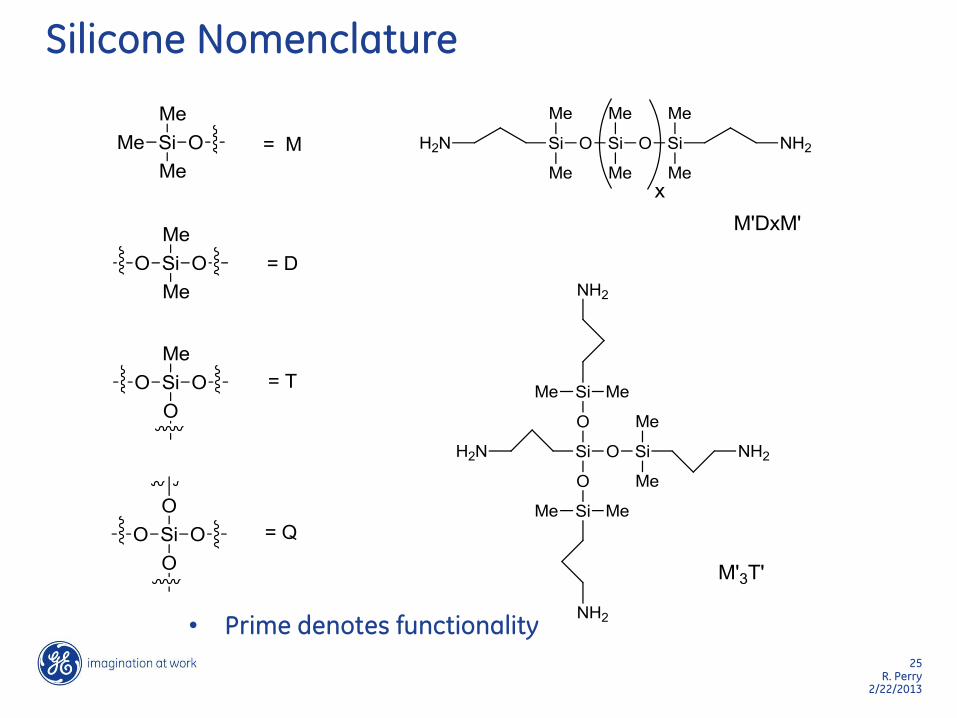
Silicone Nomenclature
• Prime denotes functionality
26 R. Perry
2/22/2013
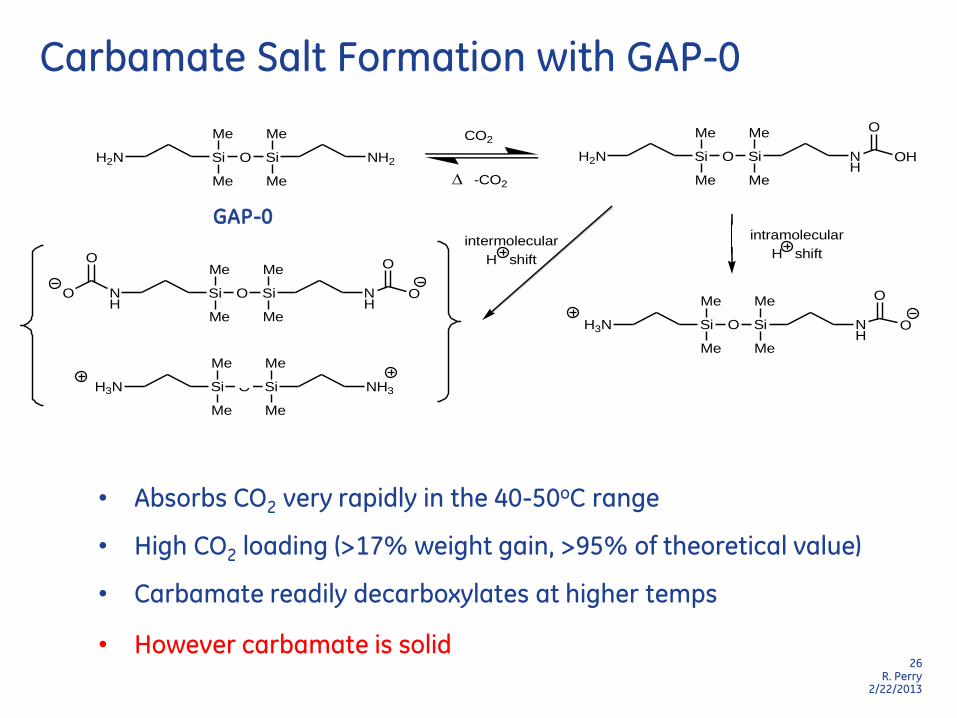
Carbamate Salt Formation with GAP-0
• Absorbs CO2 very rapidly in the 40-50oC range
• High CO2 loading (>17% weight gain, >95% of theoretical value)
• Carbamate readily decarboxylates at higher temps
2
3
5
Si
Me
Me
O Si
Me
Me
NH
H2N OH
O
Si
Me
Me
O Si
Me
Me
NH2H2N
CO2
-CO2
1
Si
Me
Me
O Si
Me
Me
NH
H3N O
OSi
Me
Me
O Si
Me
Me
NH
NH
O
O
O
O
Si
Me
Me
O Si
Me
Me
NH3H3N
4
intermolecular
H shift
intramolecular
H shift
GAP-0
• However carbamate is solid
27 R. Perry
2/22/2013
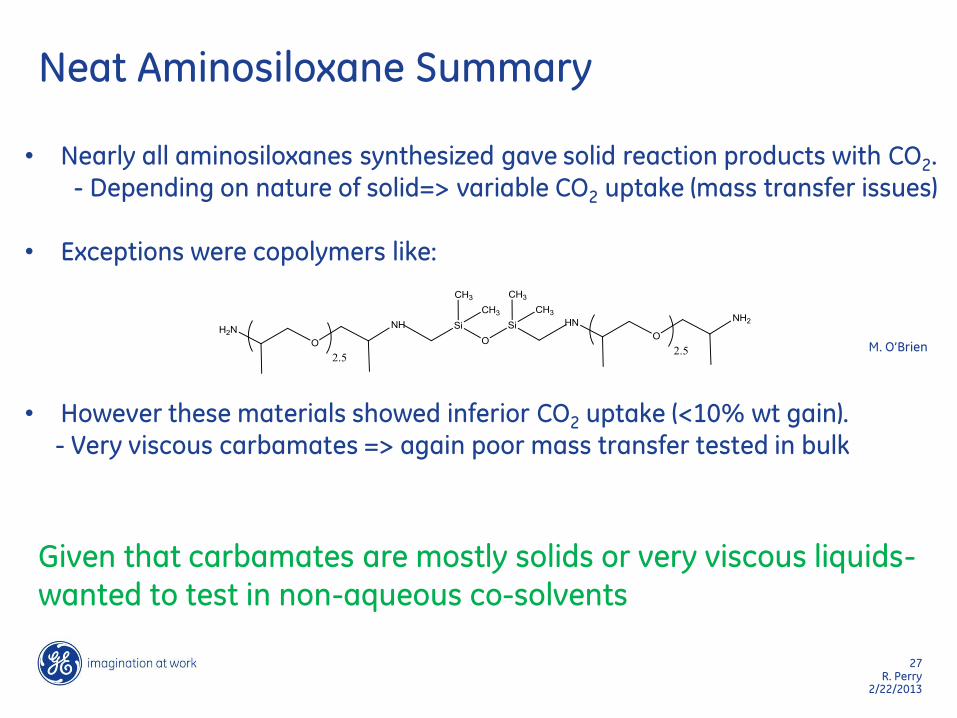
Neat Aminosiloxane Summary
• Nearly all aminosiloxanes synthesized gave solid reaction products with CO2.
- Depending on nature of solid=> variable CO2 uptake (mass transfer issues)
• Exceptions were copolymers like:
• However these materials showed inferior CO2 uptake (<10% wt gain).
- Very viscous carbamates => again poor mass transfer tested in bulk
Given that carbamates are mostly solids or very viscous liquids- wanted to test in non-aqueous co-solvents
M. O’Brien
28 R. Perry
2/22/2013
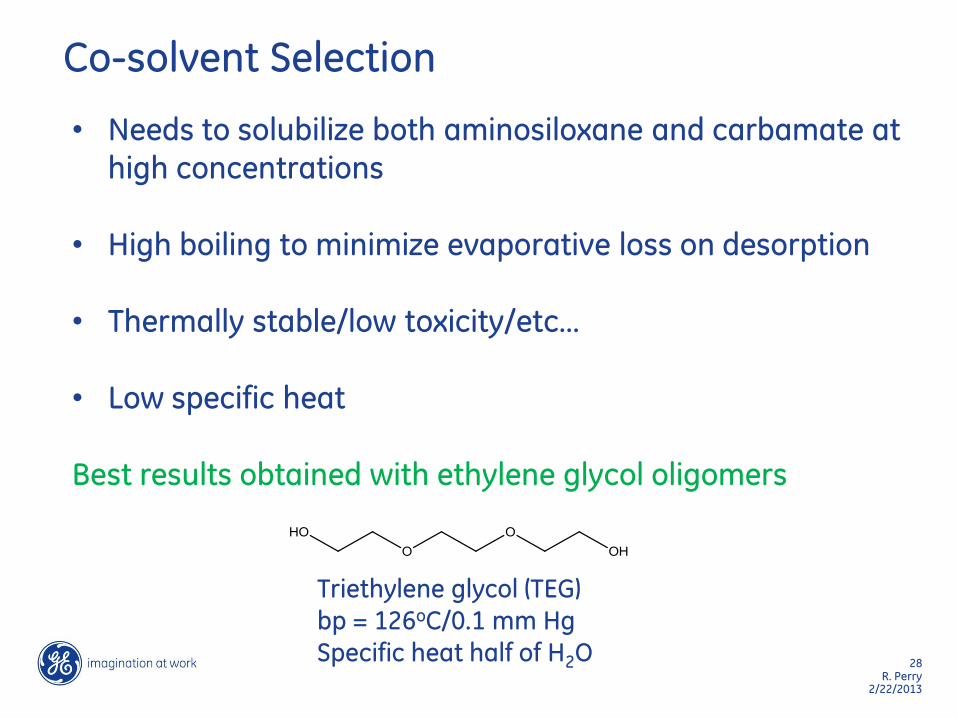
Co-solvent Selection
• Needs to solubilize both aminosiloxane and carbamate at high concentrations
• High boiling to minimize evaporative loss on desorption
• Thermally stable/low toxicity/etc…
• Low specific heat
Best results obtained with ethylene glycol oligomers
Triethylene glycol (TEG)
bp = 126oC/0.1 mm Hg
Specific heat half of H2O
29 R. Perry
2/22/2013
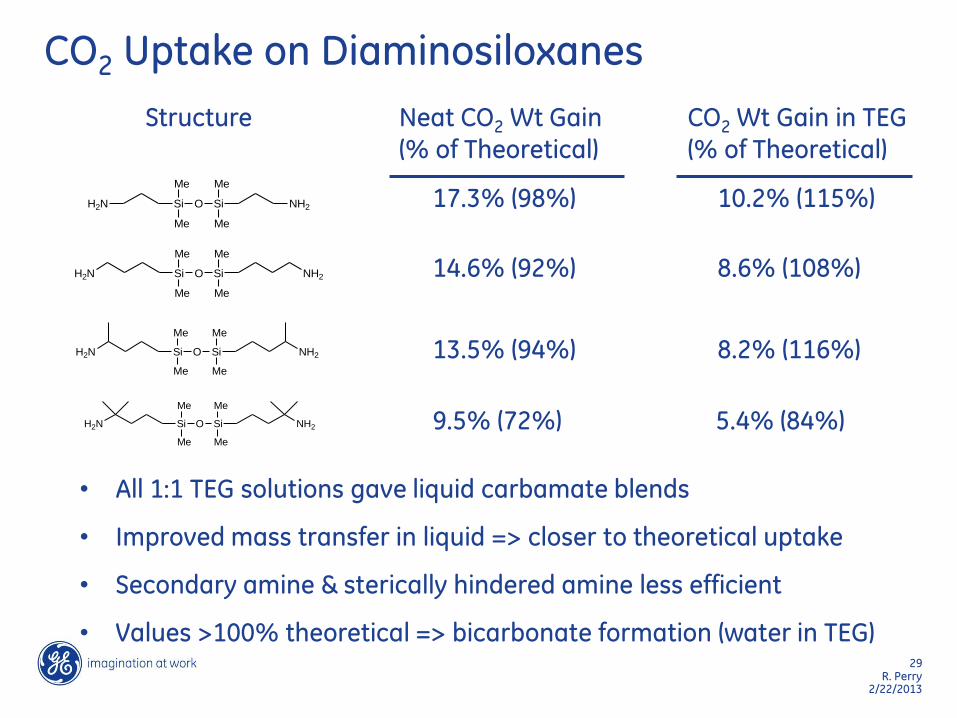
CO2 Uptake on Diaminosiloxanes
Structure Neat CO2 Wt Gain
(% of Theoretical)
CO2 Wt Gain in TEG
(% of Theoretical)
Si
Me
Me
O Si
Me
Me
NH2H2N
Si
Me
Me
O Si
Me
Me
NH2H2N
Si
Me
Me
O Si
Me
Me
NH2H2N
Si
Me
Me
O Si
Me
Me
NH2H2N
17.3% (98%) 10.2% (115%)
14.6% (92%) 8.6% (108%)
13.5% (94%) 8.2% (116%)
9.5% (72%) 5.4% (84%)
• All 1:1 TEG solutions gave liquid carbamate blends
• Improved mass transfer in liquid => closer to theoretical uptake
• Secondary amine & sterically hindered amine less efficient
• Values >100% theoretical => bicarbonate formation (water in TEG)
30 R. Perry
2/22/2013
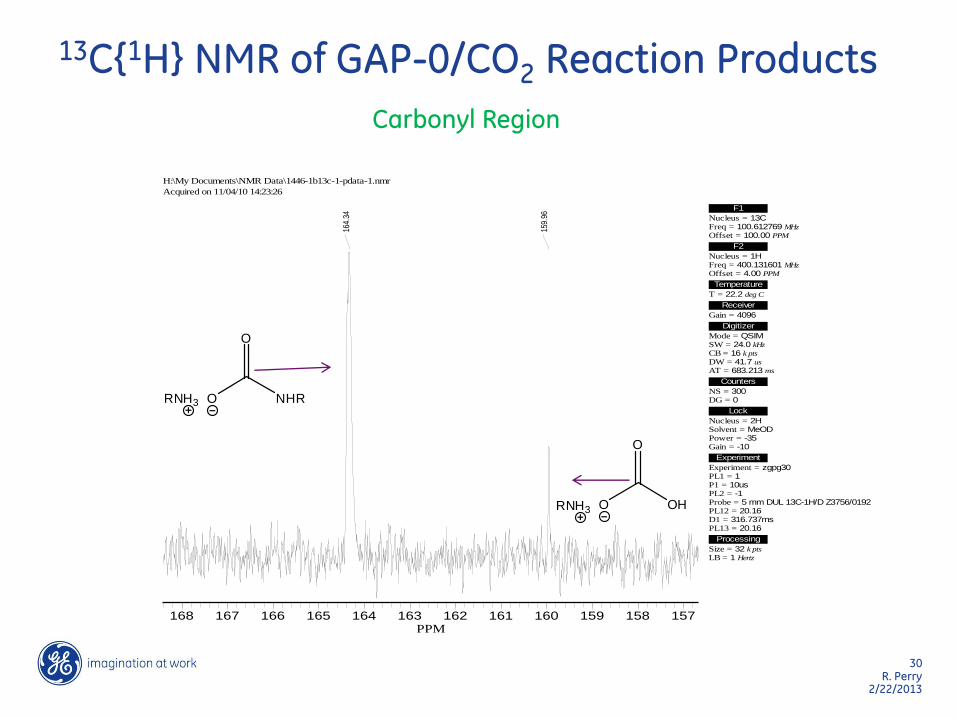
13C{1H} NMR of GAP-0/CO2 Reaction Products
164.
34
159.
96
168 167 166 165 164 163 162 161 160 159 158 157PPM
H:\My Documents\NMR Data\1446-1b13c-1-pdata-1.nmr
Acquired on 11/04/10 14:23:26
F1
Nucleus = 13C Freq = 100.612769 MHz
Offset = 100.00 PPM
F2
Nucleus = 1H Freq = 400.131601 MHz
Offset = 4.00 PPM
Temperature
T = 22.2 deg C
Receiver
Gain = 4096
Digitizer
Mode = QSIM SW = 24.0 kHz
CB = 16 k pts
DW = 41.7 us
AT = 683.213 ms
Counters
NS = 300 DG = 0
Lock
Nucleus = 2H Solvent = MeOD Power = -35 Gain = -10
Experiment
Experiment = zgpg30 PL1 = 1 P1 = 10us PL2 = -1 Probe = 5 mm DUL 13C-1H/D Z3756/0192 PL12 = 20.16 D1 = 316.737ms PL13 = 20.16
Processing
Size = 32 k pts
LB = 1 Hertz
Carbonyl Region
O NHR
O
RNH3
O OH
O
RNH3
31 R. Perry
2/22/2013
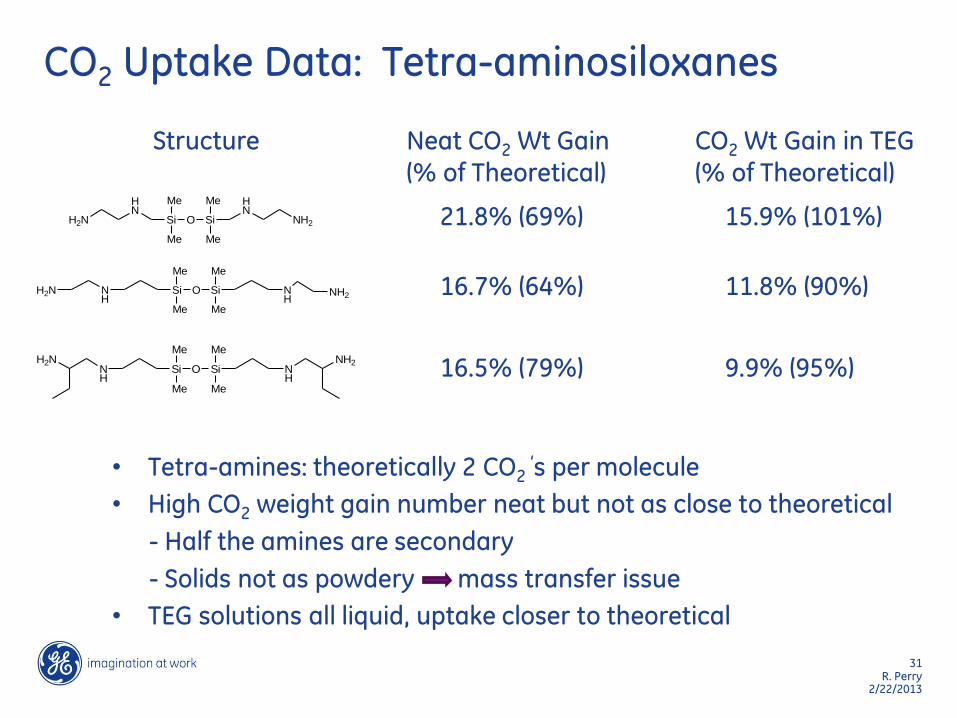
CO2 Uptake Data: Tetra-aminosiloxanes
Structure Neat CO2 Wt Gain
(% of Theoretical)
CO2 Wt Gain in TEG
(% of Theoretical)
21.8% (69%) 15.9% (101%)
16.7% (64%) 11.8% (90%)
16.5% (79%) 9.9% (95%)
Si
Me
Me
O Si
Me
Me
HN
HN
NH2H2N
Si
Me
Me
O Si
Me
Me
NH
NH
NH2H2N
Si
Me
Me
O Si
Me
Me
NH
NH
NH2H2N
• Tetra-amines: theoretically 2 CO2 ‘s per molecule
• High CO2 weight gain number neat but not as close to theoretical
- Half the amines are secondary
- Solids not as powdery mass transfer issue
• TEG solutions all liquid, uptake closer to theoretical
32 R. Perry
2/22/2013
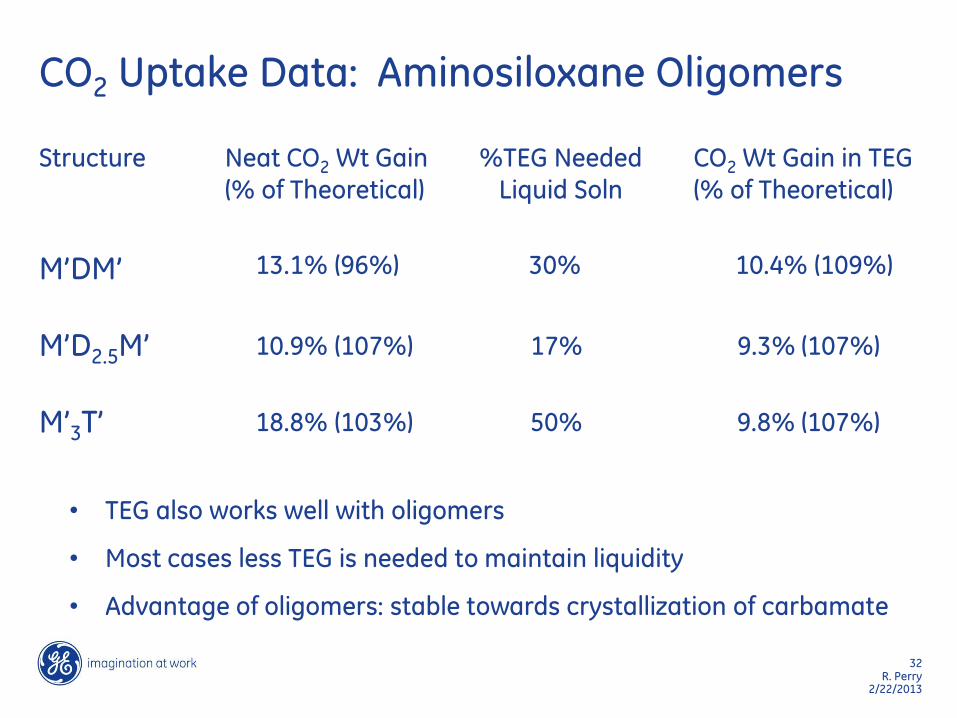
CO2 Uptake Data: Aminosiloxane Oligomers
Structure Neat CO2 Wt Gain
(% of Theoretical)
%TEG Needed
Liquid Soln
CO2 Wt Gain in TEG
(% of Theoretical)
M’DM’ M’D2.5M’ M’3T’
13.1% (96%) 30% 10.4% (109%)
10.9% (107%) 17% 9.3% (107%)
18.8% (103%) 50% 9.8% (107%)
• TEG also works well with oligomers
• Most cases less TEG is needed to maintain liquidity
• Advantage of oligomers: stable towards crystallization of carbamate
33 R. Perry
2/22/2013
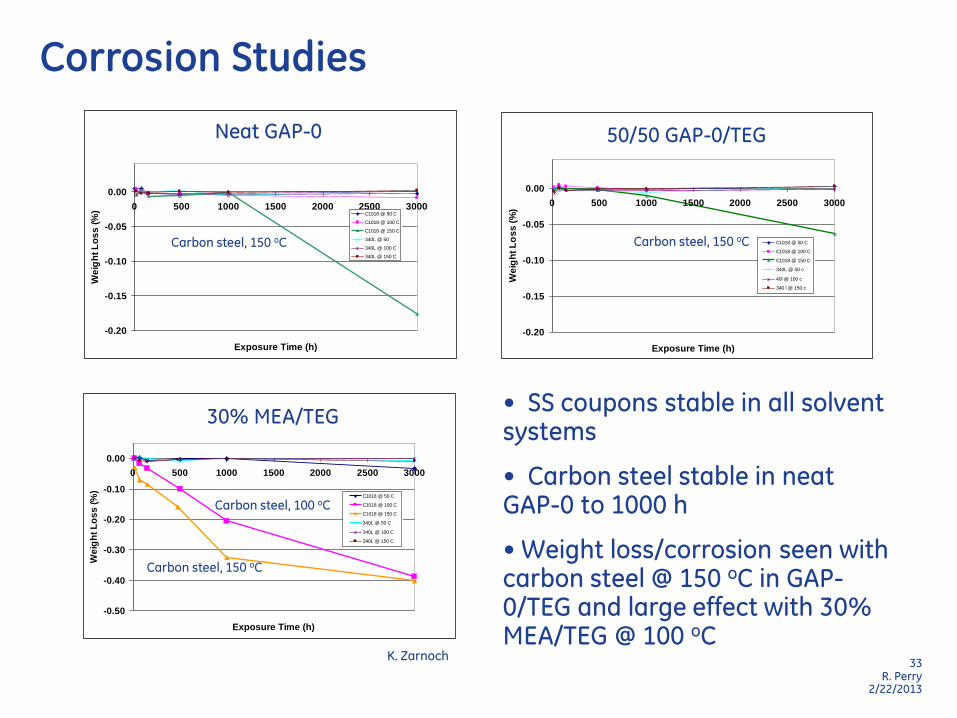
GAP-0
-0.20
-0.15
-0.10
-0.05
0.00
0 500 1000 1500 2000 2500 3000
Exposure Time (h)
We
igh
t L
os
s (
%) C1018 @ 50 C
C1018 @ 100 C
C1018 @ 150 C
340L @ 50
340L @ 100 C
340L @ 150 C
Corrosion Studies
Neat GAP-0
• SS coupons stable in all solvent systems
• Carbon steel stable in neat GAP-0 to 1000 h
• Weight loss/corrosion seen with carbon steel @ 150 oC in GAP-0/TEG and large effect with 30% MEA/TEG @ 100 oC
GAP/TEG
-0.20
-0.15
-0.10
-0.05
0.00
0 500 1000 1500 2000 2500 3000
Exposure Time (h)
We
igh
t L
os
s (
%)
C1018 @ 50 C
C1018 @ 100 C
C1018 @ 150 C
340L @ 50 c
40l @ 100 c
340 l @ 150 c
50/50 GAP-0/TEG
30% MEA/TEG
-0.50
-0.40
-0.30
-0.20
-0.10
0.00
0 500 1000 1500 2000 2500 3000
Exposure Time (h)
We
igh
t L
os
s (
%)
C1018 @ 50 C
C1018 @ 100 C
C1018 @ 150 C
340L @ 50 C
340L @ 100 C
340L @ 150 C
30% MEA/TEG
K. Zarnoch
Carbon steel, 150 oC Carbon steel, 150 oC
Carbon steel, 150 oC
Carbon steel, 100 oC
34 R. Perry
2/22/2013
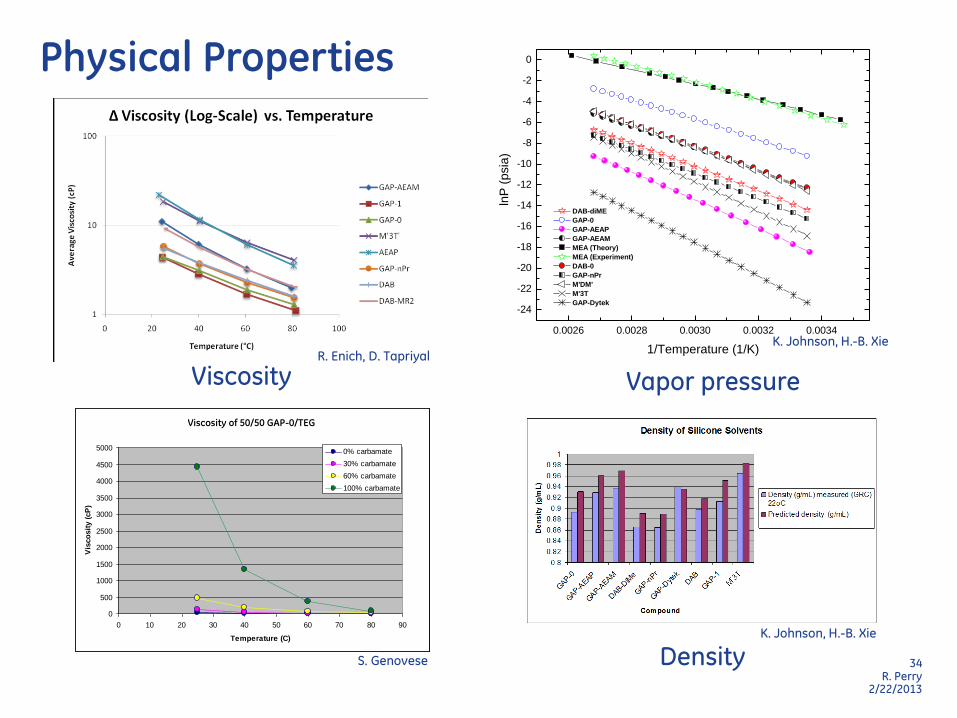
Physical Properties
Vapor pressure
0.0026 0.0028 0.0030 0.0032 0.0034
-24
-22
-20
-18
-16
-14
-12
-10
-8
-6
-4
-2
0
lnP
(p
sia
)
1/Temperature (1/K)
DAB-diME
GAP-0
GAP-AEAP
GAP-AEAM
MEA (Theory)
MEA (Experiment)
DAB-0
GAP-nPr
M'DM'
M'3T
GAP-Dytek
Viscosity
Density
Viscostiy of 50/50 GAP-0/TEG
0
500
1000
1500
2000
2500
3000
3500
4000
4500
5000
0 10 20 30 40 50 60 70 80 90
Temperature (C)
Vis
co
sit
y (
cP
)
0% carbamate
30% carbamate
60% carbamate
100% carbamate
Viscosity of 50/50 GAP-0/TEGViscostiy of 50/50 GAP-0/TEG
0
500
1000
1500
2000
2500
3000
3500
4000
4500
5000
0 10 20 30 40 50 60 70 80 90
Temperature (C)
Vis
co
sit
y (
cP
)
0% carbamate
30% carbamate
60% carbamate
100% carbamate
Viscosity of 50/50 GAP-0/TEG
K. Johnson, H.-B. Xie R. Enich, D. Tapriyal
S. Genovese
K. Johnson, H.-B. Xie
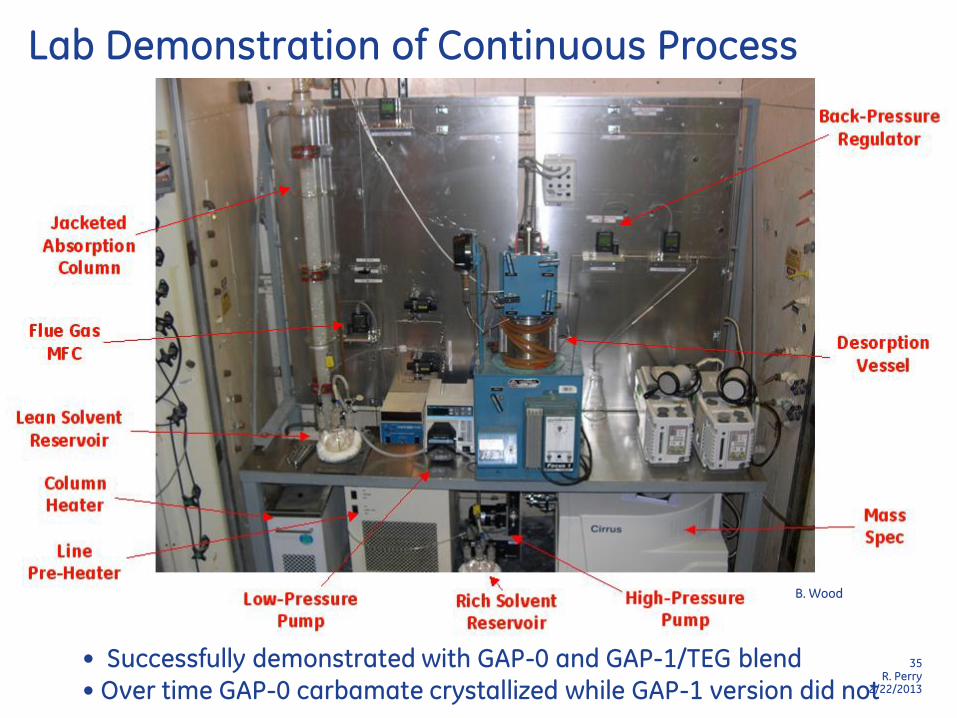
35 R. Perry
2/22/2013
Lab Demonstration of Continuous Process
• Successfully demonstrated with GAP-0 and GAP-1/TEG blend
• Over time GAP-0 carbamate crystallized while GAP-1 version did not
B. Wood B. Wood

36 R. Perry
2/22/2013
Energy Penalty
• ASPEN Plus model built for CO2 separation using GAP-1; Updated with experimental results
• Energy Penalty: GAP-1 EP for the overall system ~24% vs. ~31% for MEA
37 R. Perry
2/22/2013
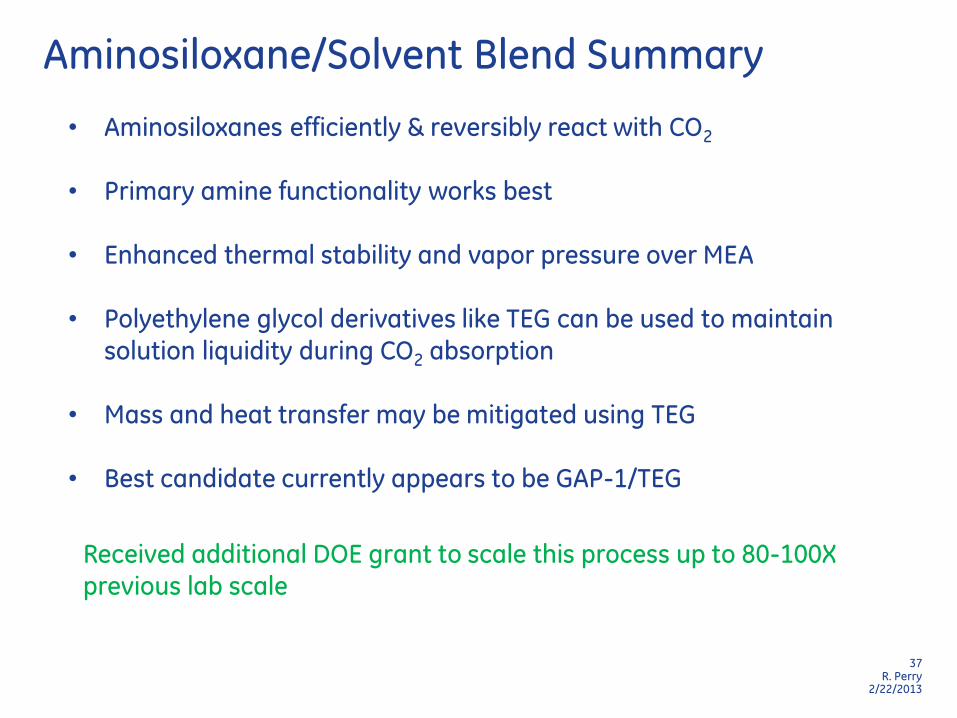
Aminosiloxane/Solvent Blend Summary
• Aminosiloxanes efficiently & reversibly react with CO2
• Primary amine functionality works best
• Enhanced thermal stability and vapor pressure over MEA
• Polyethylene glycol derivatives like TEG can be used to maintain
solution liquidity during CO2 absorption
• Mass and heat transfer may be mitigated using TEG
• Best candidate currently appears to be GAP-1/TEG
Received additional DOE grant to scale this process up to 80-100X
previous lab scale
38 R. Perry
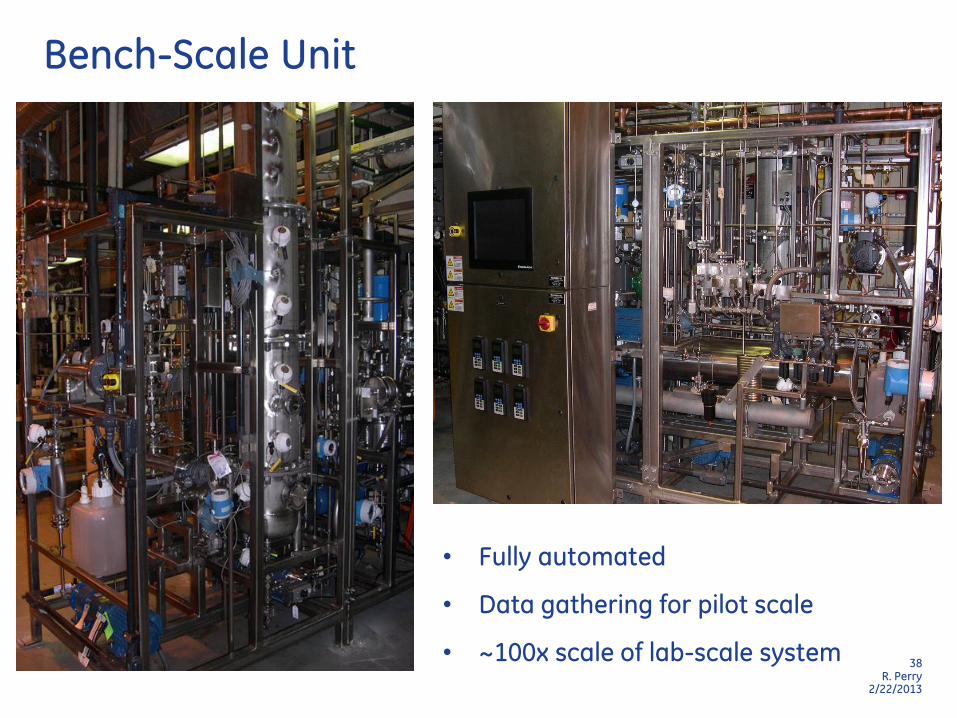
2/22/2013
Bench-Scale Unit
• Fully automated
• Data gathering for pilot scale
• ~100x scale of lab-scale system
39 R. Perry
2/22/2013
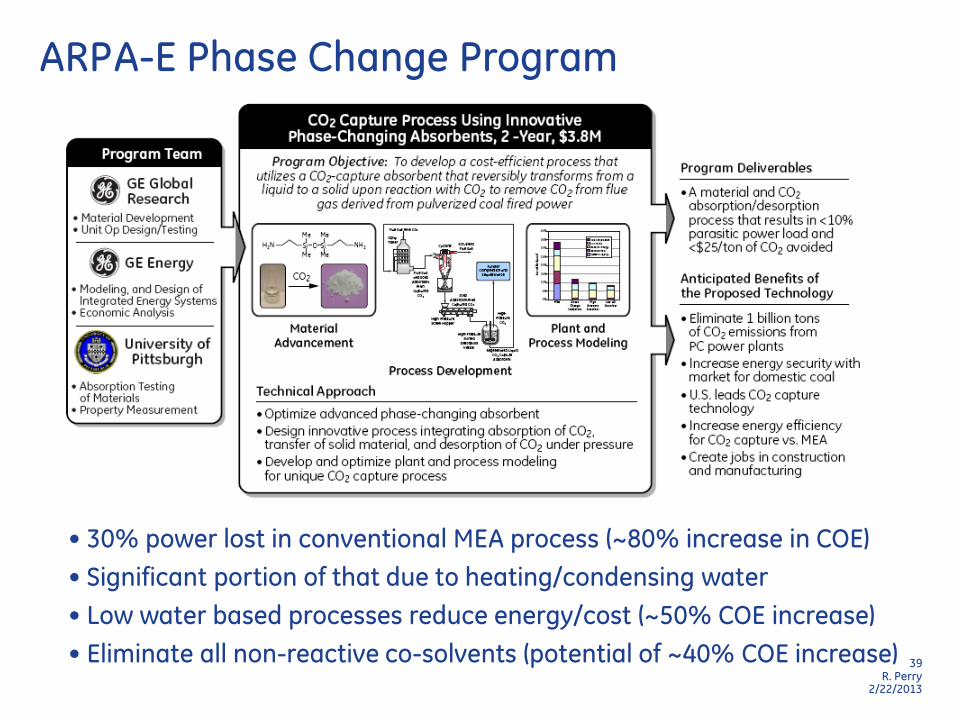
ARPA-E Phase Change Program
• 30% power lost in conventional MEA process (~80% increase in COE)
• Significant portion of that due to heating/condensing water
• Low water based processes reduce energy/cost (~50% COE increase)
• Eliminate all non-reactive co-solvents (potential of ~40% COE increase)
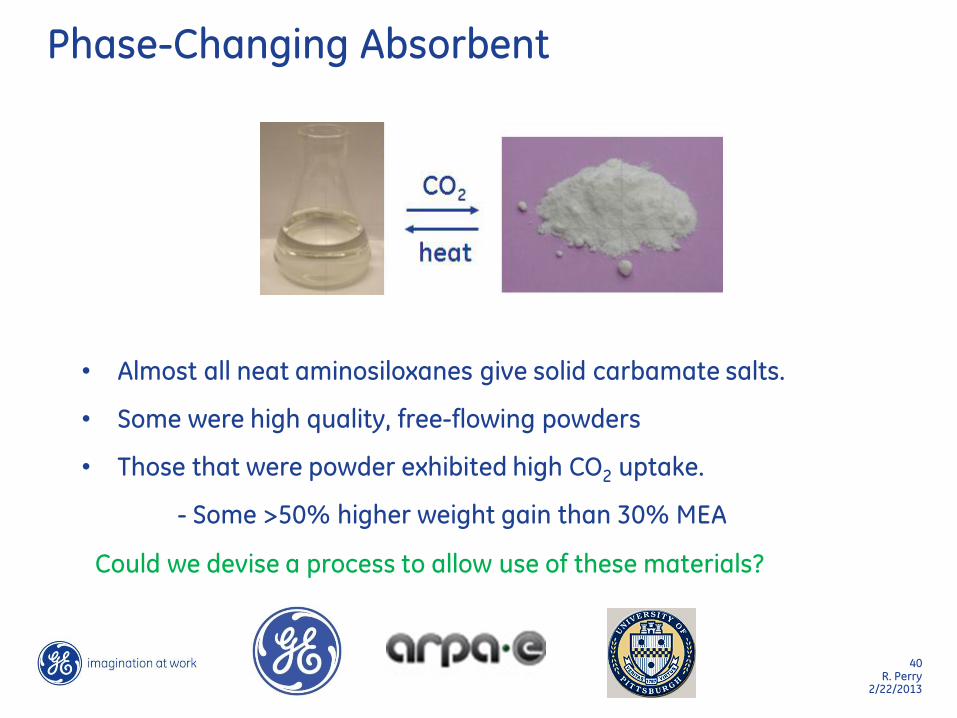
40 R. Perry
2/22/2013
Phase-Changing Absorbent
• Almost all neat aminosiloxanes give solid carbamate salts.
• Some were high quality, free-flowing powders
• Those that were powder exhibited high CO2 uptake.
- Some >50% higher weight gain than 30% MEA
Could we devise a process to allow use of these materials?
41 R. Perry
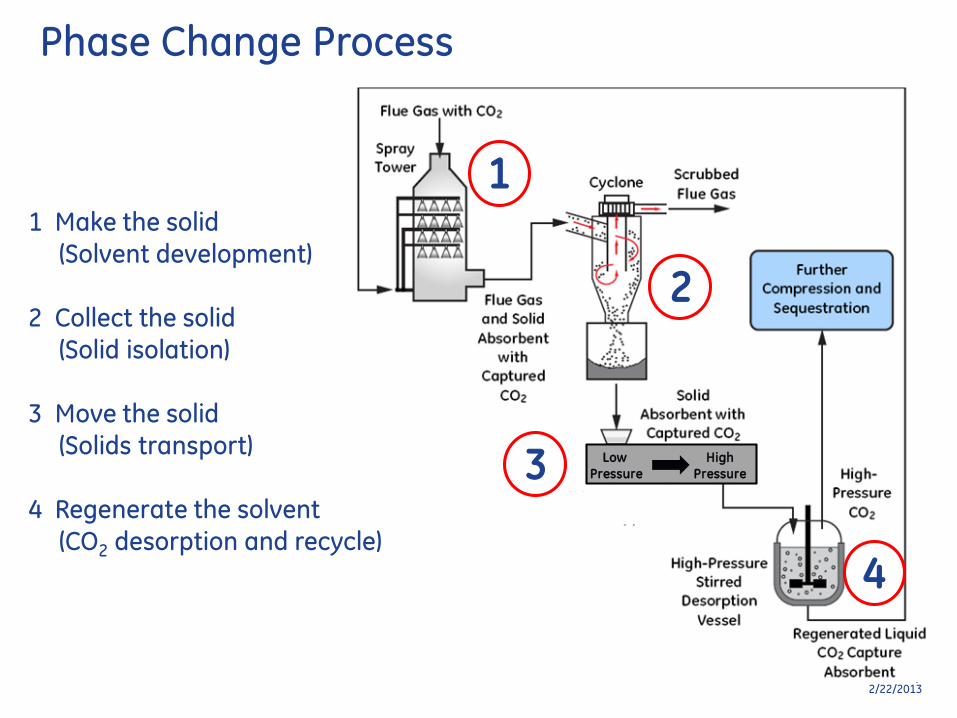
2/22/2013
2
1
4
3 Low
Pressure
High
Pressure
Phase Change Process
1 Make the solid
(Solvent development)
2 Collect the solid
(Solid isolation)
3 Move the solid
(Solids transport)
4 Regenerate the solvent
(CO2 desorption and recycle)
42 R. Perry
2/22/2013
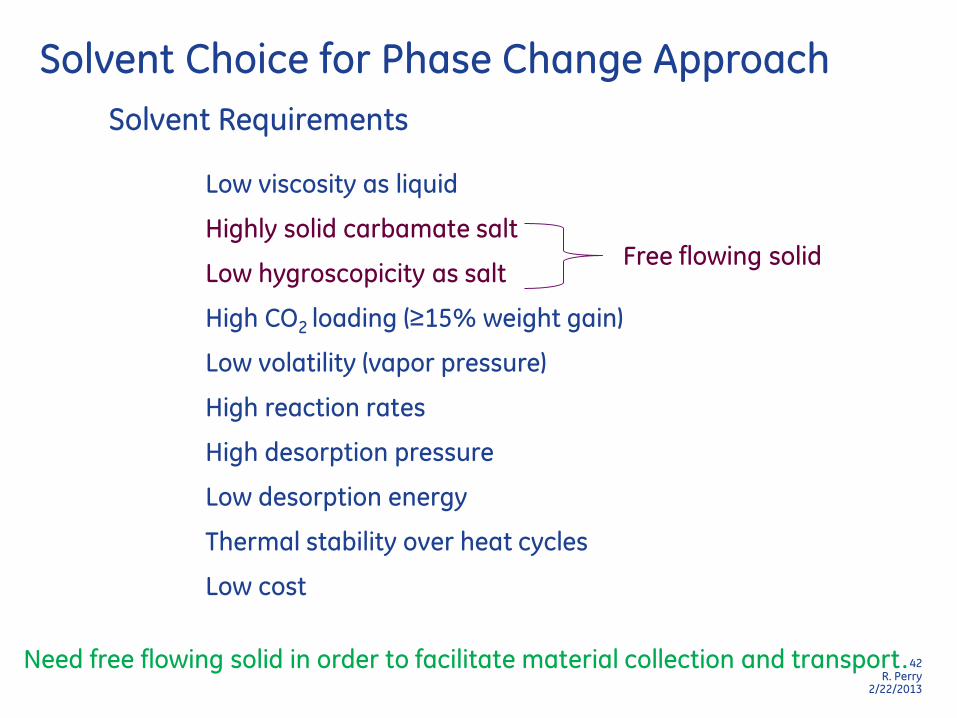
Solvent Choice for Phase Change Approach
Solvent Requirements
Low viscosity as liquid
Highly solid carbamate salt
Low hygroscopicity as salt
High CO2 loading (≥15% weight gain)
Low volatility (vapor pressure)
High reaction rates
High desorption pressure
Low desorption energy
Thermal stability over heat cycles
Low cost
Free flowing solid
Need free flowing solid in order to facilitate material collection and transport.
43 R. Perry
2/22/2013
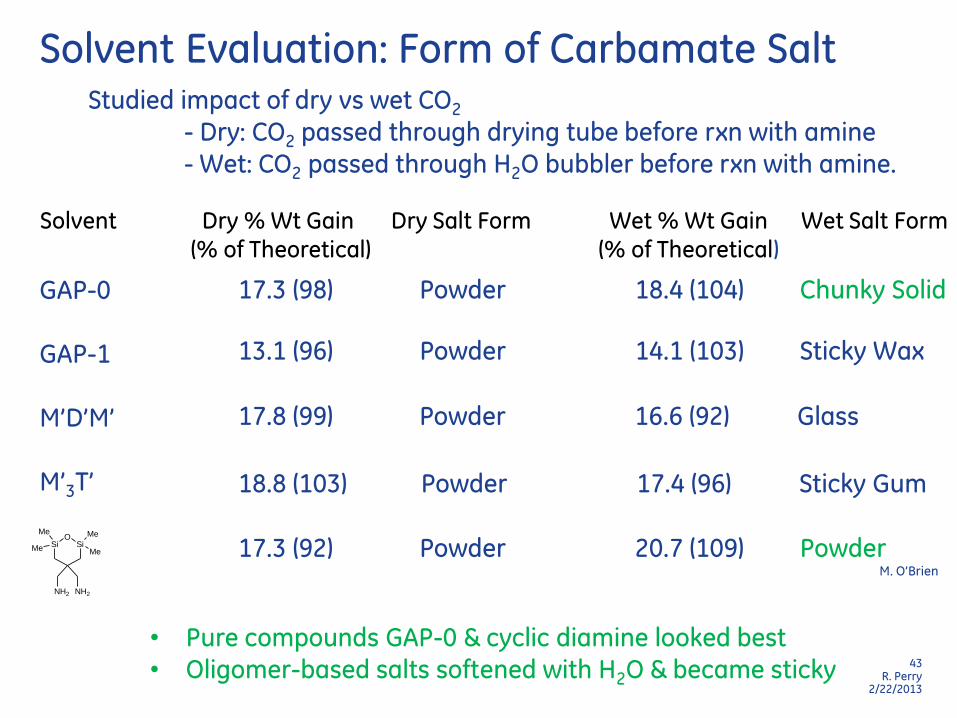
Solvent Evaluation: Form of Carbamate Salt
Studied impact of dry vs wet CO2
- Dry: CO2 passed through drying tube before rxn with amine
- Wet: CO2 passed through H2O bubbler before rxn with amine.
Solvent Dry % Wt Gain (% of Theoretical)
Wet % Wt Gain (% of Theoretical)
Dry Salt Form Wet Salt Form
GAP-0
GAP-1
M’D’M’
M’3T’
Si SiO
Me
Me Me
Me
NH2 NH2
17.3 (98) Powder 18.4 (104) Chunky Solid
13.1 (96) Powder 14.1 (103) Sticky Wax
17.8 (99) Powder 16.6 (92) Glass
18.8 (103) Powder 17.4 (96) Sticky Gum
17.3 (92) Powder 20.7 (109) Powder
• Pure compounds GAP-0 & cyclic diamine looked best
• Oligomer-based salts softened with H2O & became sticky
M. O’Brien
44 R. Perry
2/22/2013
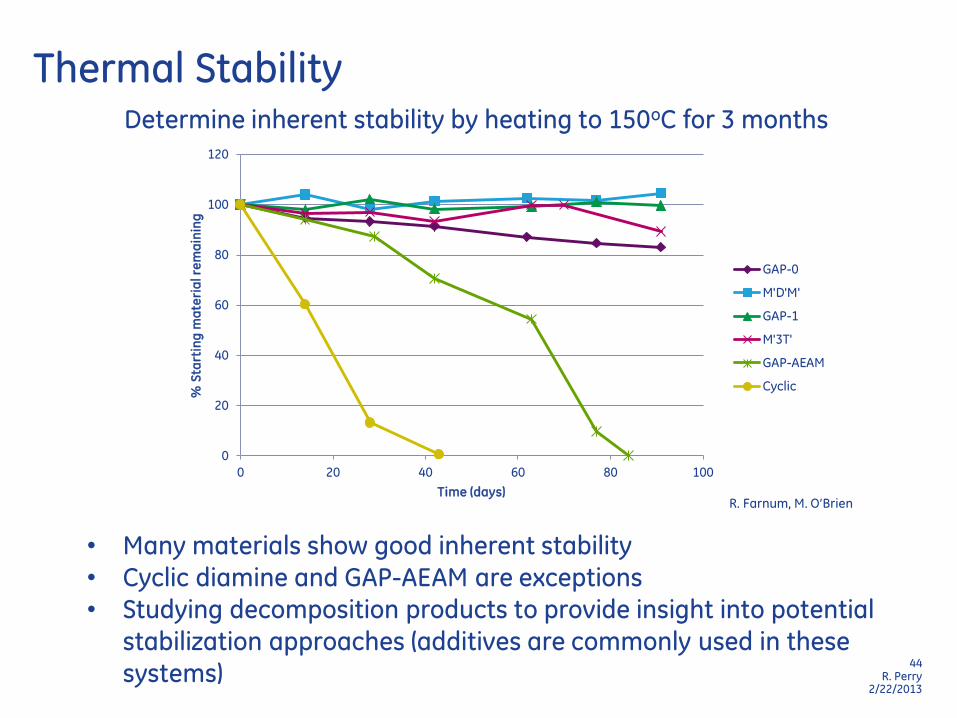
0
20
40
60
80
100
120
0 20 40 60 80 100
% S
tart
ing
ma
teri
al r
em
ain
ing
Time (days)
GAP-0
M'D'M'
GAP-1
M'3T'
GAP-AEAM
Cyclic
Thermal Stability Determine inherent stability by heating to 150oC for 3 months
R. Farnum, M. O’Brien
• Many materials show good inherent stability
• Cyclic diamine and GAP-AEAM are exceptions
• Studying decomposition products to provide insight into potential
stabilization approaches (additives are commonly used in these
systems)
45 R. Perry
2/22/2013
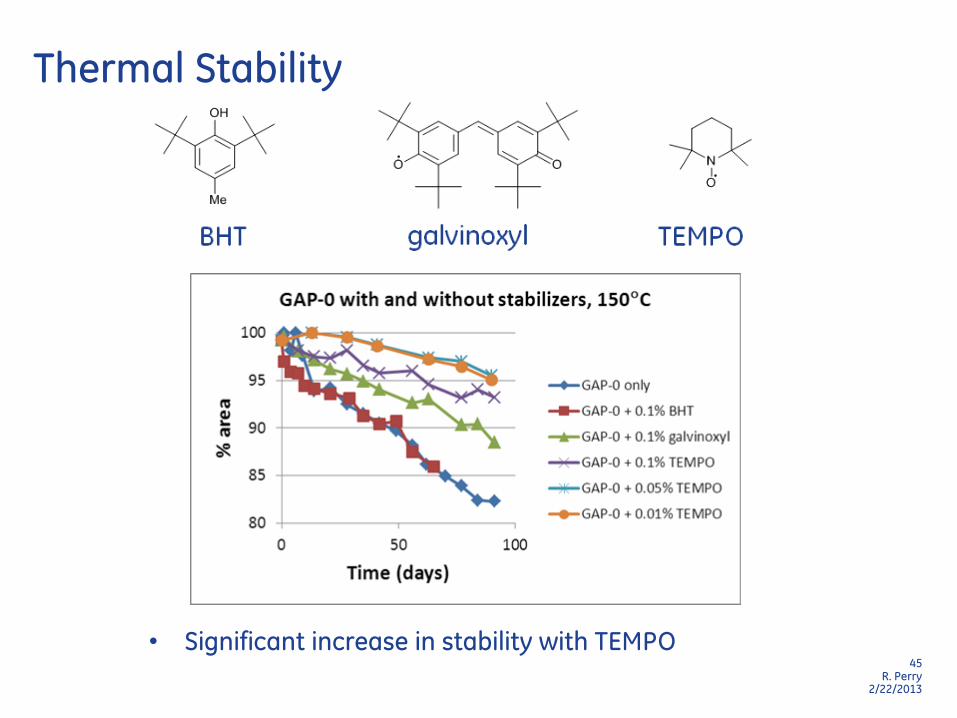
Thermal Stability
• Significant increase in stability with TEMPO
46 R. Perry
2/22/2013
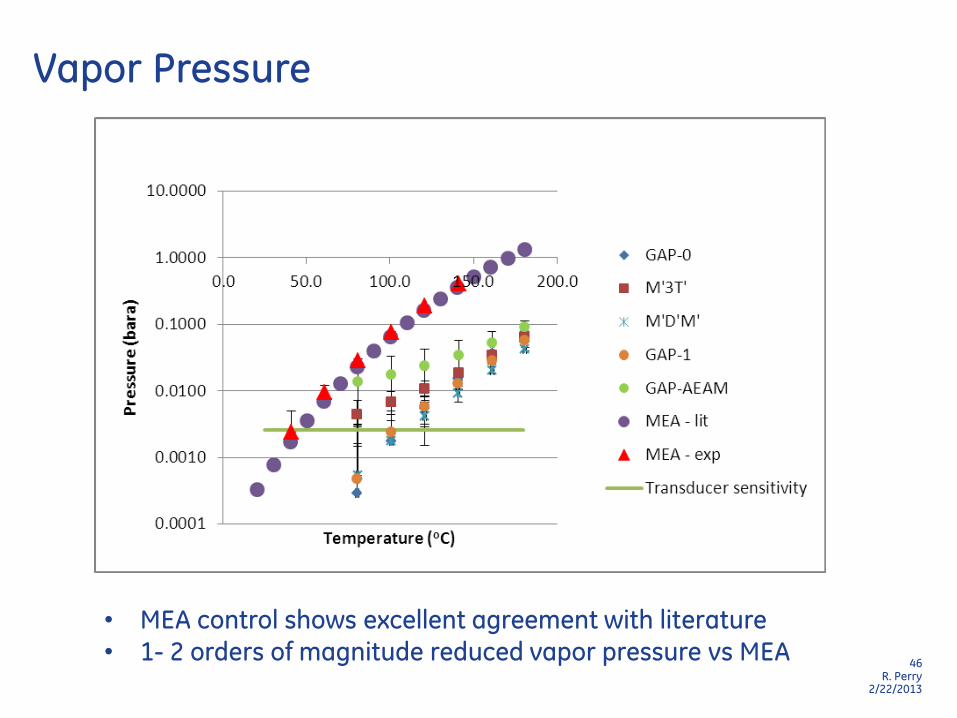
Vapor Pressure
• MEA control shows excellent agreement with literature
• 1- 2 orders of magnitude reduced vapor pressure vs MEA
47 R. Perry
2/22/2013
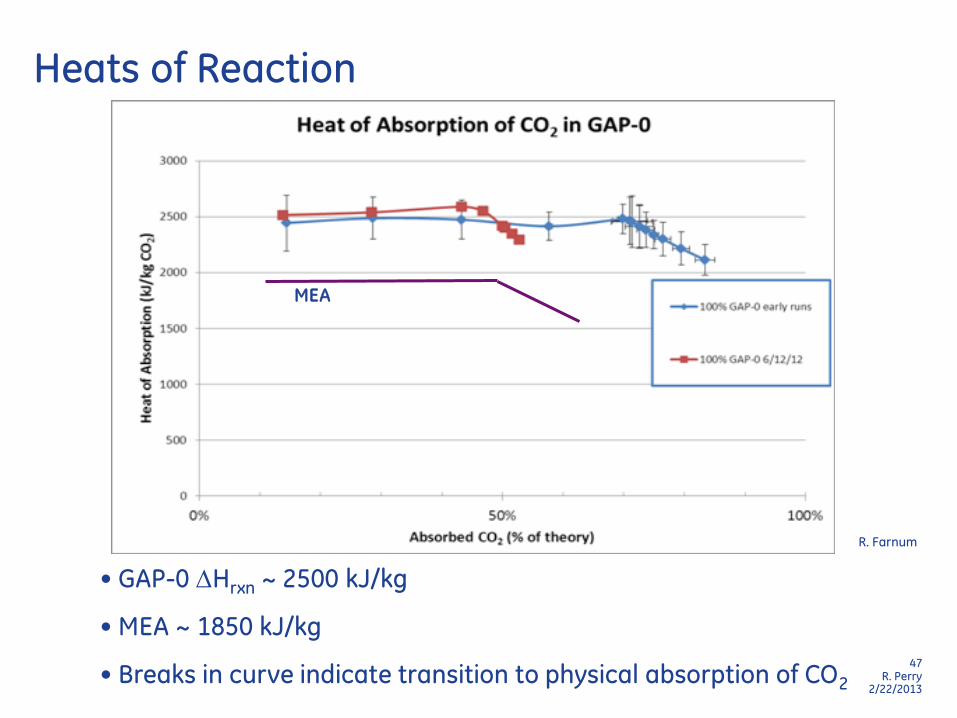
Heats of Reaction
• GAP-0 Hrxn ~ 2500 kJ/kg
• MEA ~ 1850 kJ/kg
• Breaks in curve indicate transition to physical absorption of CO2
MEA
R. Farnum
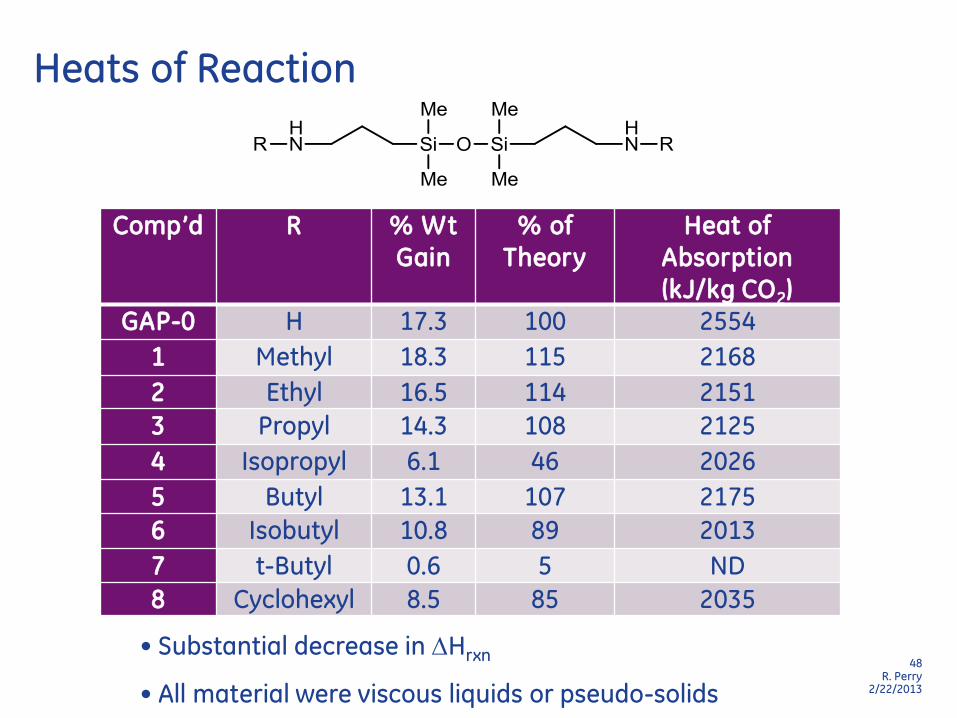
48 R. Perry
2/22/2013
Comp’d R % Wt
Gain
% of
Theory
Heat of
Absorption
(kJ/kg CO2)
GAP-0 H 17.3 100 2554
1 Methyl 18.3 115 2168
2 Ethyl 16.5 114 2151
3 Propyl 14.3 108 2125
4 Isopropyl 6.1 46 2026
5 Butyl 13.1 107 2175
6 Isobutyl 10.8 89 2013
7 t-Butyl 0.6 5 ND
8 Cyclohexyl 8.5 85 2035
Heats of Reaction
• Substantial decrease in Hrxn
• All material were viscous liquids or pseudo-solids
49 R. Perry
2/22/2013
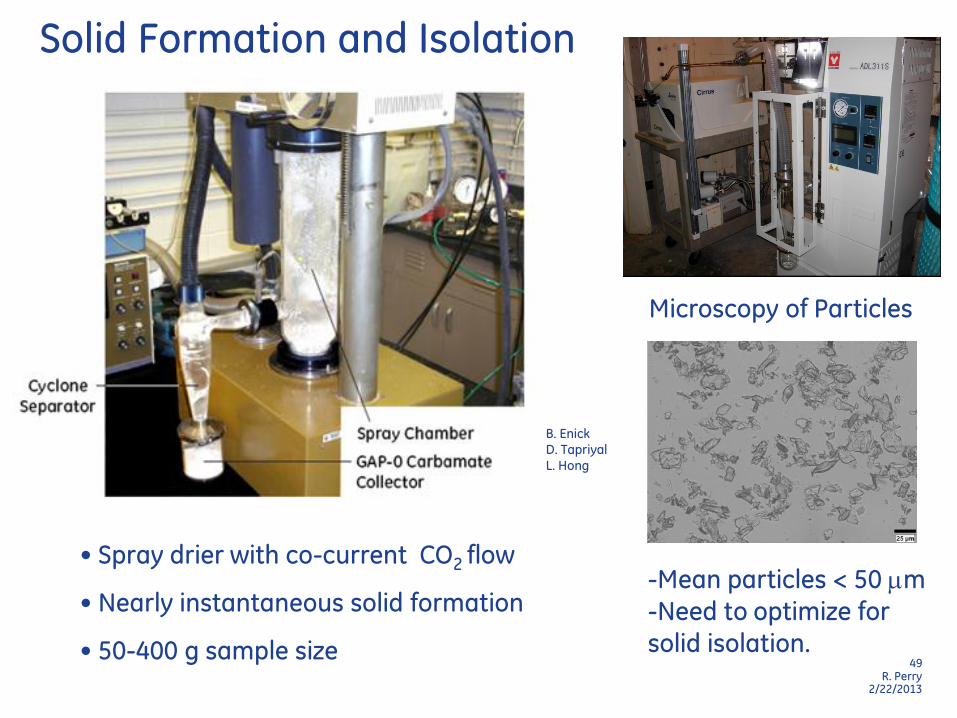
Solid Formation and Isolation
• Spray drier with co-current CO2 flow
• Nearly instantaneous solid formation
• 50-400 g sample size
B. Enick D. Tapriyal L. Hong
-Mean particles < 50 mm
-Need to optimize for
solid isolation.
Microscopy of Particles
50 R. Perry
2/22/2013
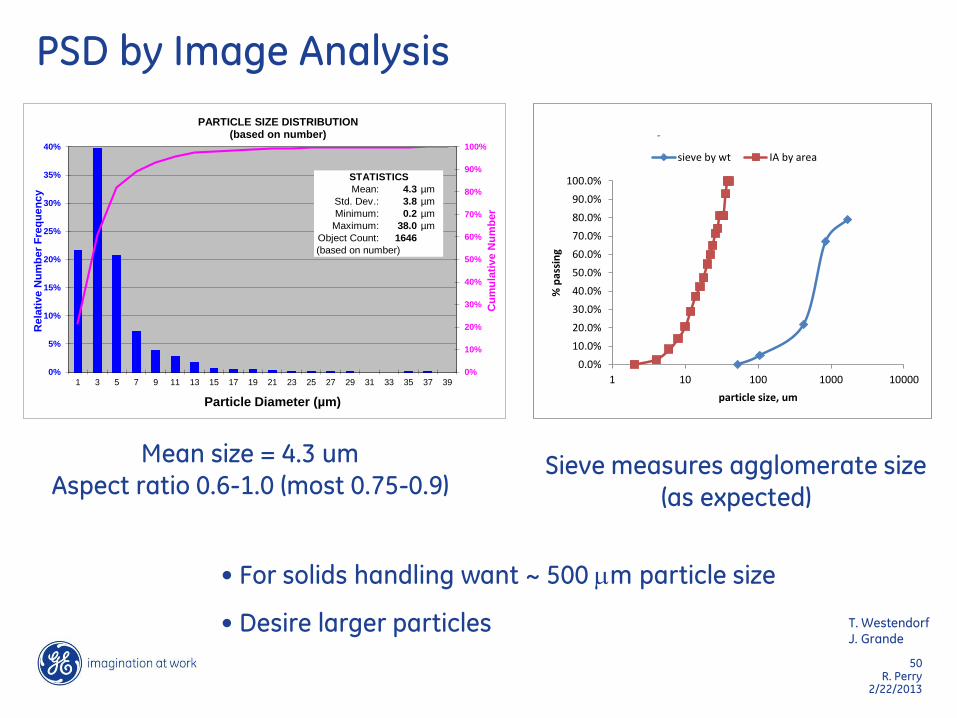
PSD by Image Analysis
Mean size = 4.3 um
Aspect ratio 0.6-1.0 (most 0.75-0.9)
0.0%
10.0%
20.0%
30.0%
40.0%
50.0%
60.0%
70.0%
80.0%
90.0%
100.0%
1 10 100 1000 10000
% p
assi
ng
particle size, um
July 2010 UPitt mixture
sieve by wt IA by area
Sieve measures agglomerate size
(as expected)
• For solids handling want ~ 500 mm particle size
• Desire larger particles T. Westendorf J. Grande
0%
10%
20%
30%
40%
50%
60%
70%
80%
90%
100%
0%
5%
10%
15%
20%
25%
30%
35%
40%
1 3 5 7 9 11 13 15 17 19 21 23 25 27 29 31 33 35 37 39
Cu
mu
lati
ve N
um
ber
Rela
tiv
e N
um
ber
Fre
qu
en
cy
Particle Diameter (µm)
PARTICLE SIZE DISTRIBUTION(based on number)
Mean: 4.3 µm
Std. Dev.: 3.8 µm
Minimum: 0.2 µm
Maximum: 38.0 µm
Object Count: 1646
(based on number)
STATISTICS
51 R. Perry
2/22/2013
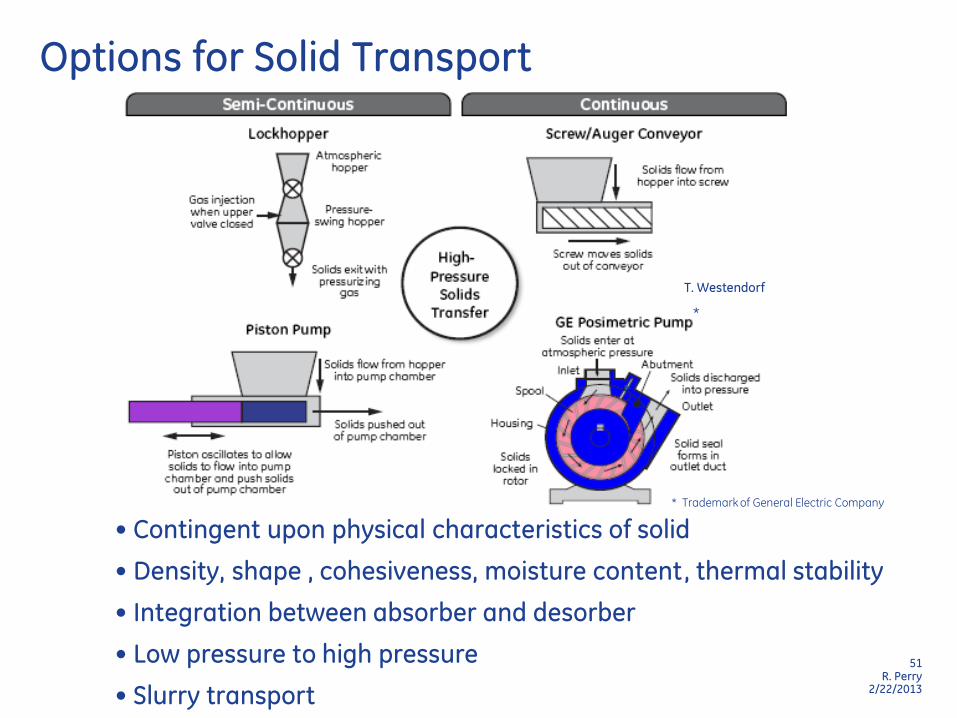
Options for Solid Transport
• Contingent upon physical characteristics of solid
• Density, shape , cohesiveness, moisture content, thermal stability
• Integration between absorber and desorber
• Low pressure to high pressure
• Slurry transport
T. Westendorf
*
* Trademark of General Electric Company
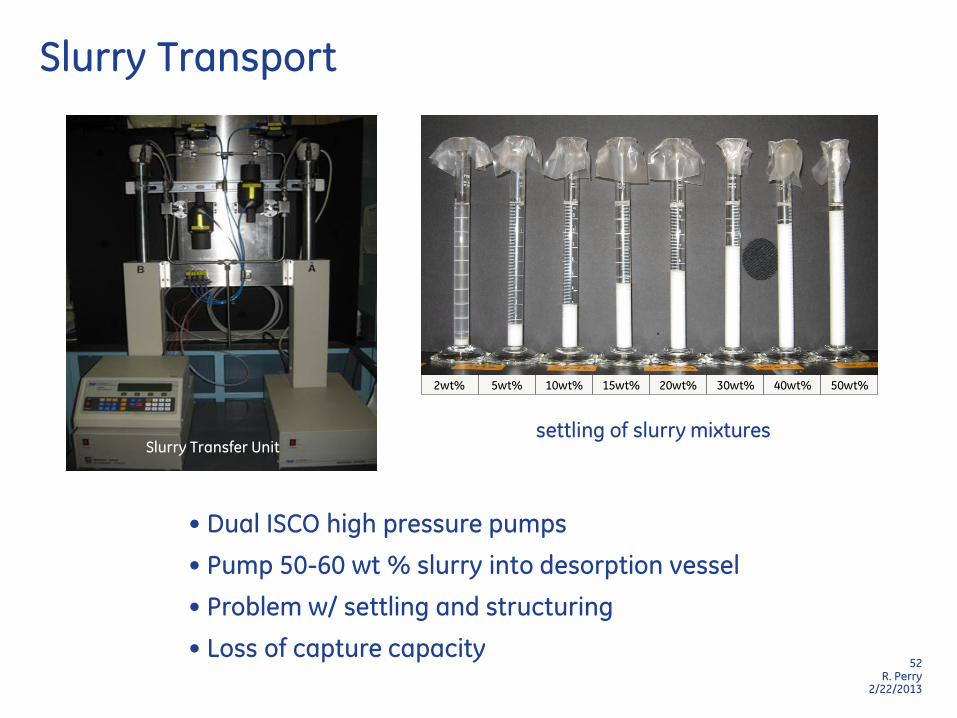
52 R. Perry
2/22/2013
Slurry Transport
Slurry Transfer Unit
• Dual ISCO high pressure pumps
• Pump 50-60 wt % slurry into desorption vessel
• Problem w/ settling and structuring
• Loss of capture capacity
settling of slurry mixtures
2wt% 5wt% 10wt% 15wt% 20wt% 30wt% 40wt% 50wt%

53 R. Perry
2/22/2013
Desorption
• Neat GAP-0 data
• Rich Solvent >16% CO2 to Lean Solvent <5% CO2
• ~11% dynamic range
• CO2 can be desorbed at relatively high pressure.
Error bars = 95% CI
R. Farnum S. Genovese
Desorption Isotherms
54 R. Perry
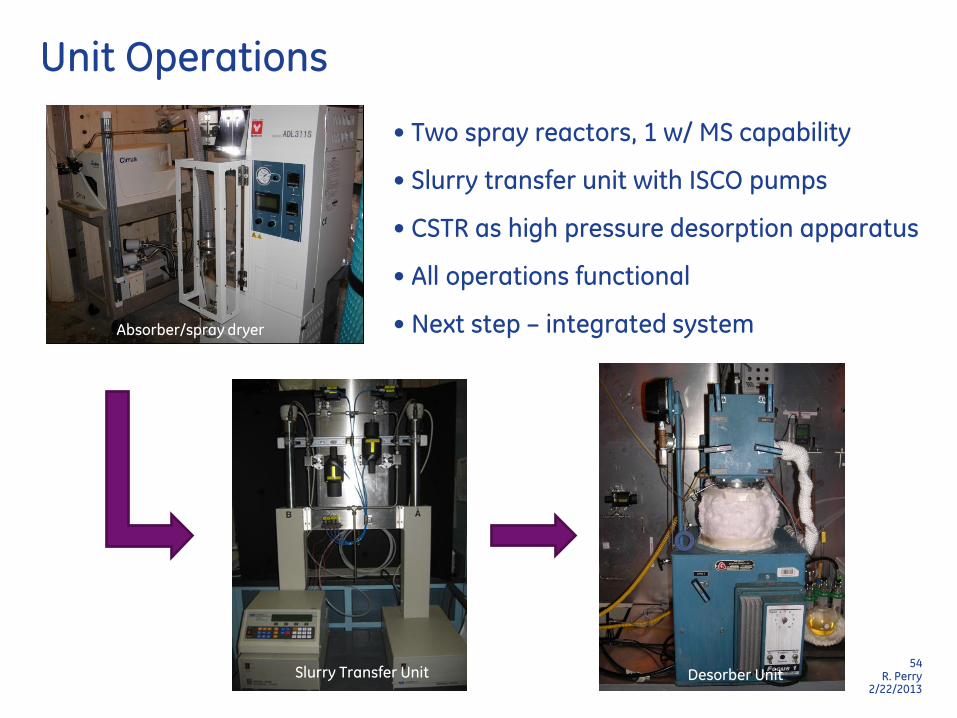
2/22/2013
Unit Operations
• Two spray reactors, 1 w/ MS capability
• Slurry transfer unit with ISCO pumps
• CSTR as high pressure desorption apparatus
• All operations functional
• Next step – integrated system Absorber/spray dryer
Desorber Unit Slurry Transfer Unit
55 R. Perry
2/22/2013
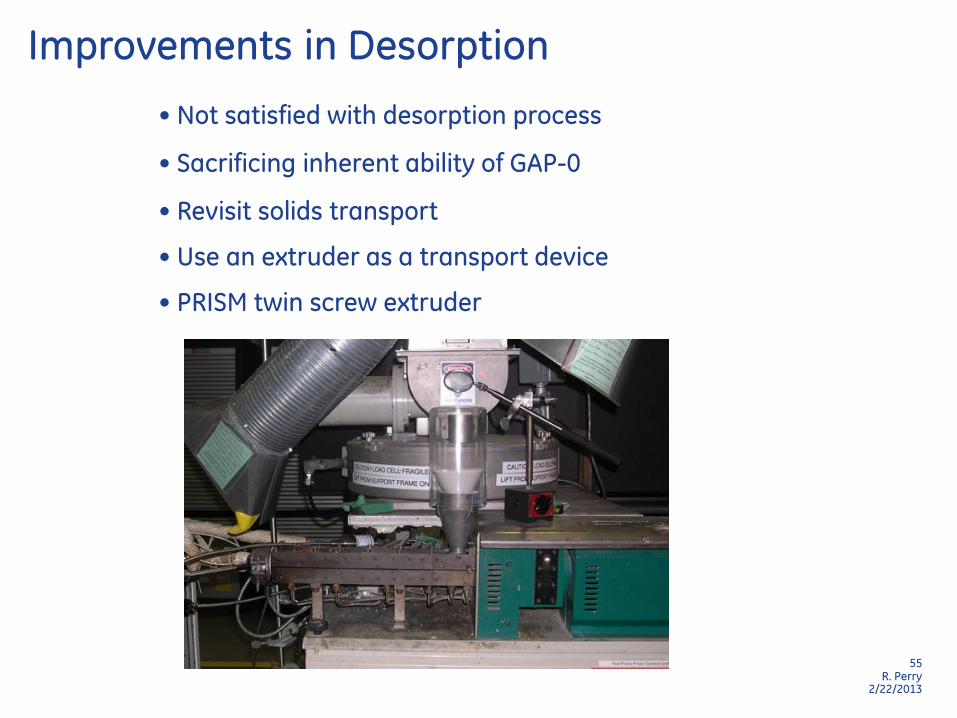
Improvements in Desorption
• Not satisfied with desorption process
• Sacrificing inherent ability of GAP-0
• Revisit solids transport
• Use an extruder as a transport device
• PRISM twin screw extruder

56 R. Perry
2/22/2013
57 R. Perry
2/22/2013
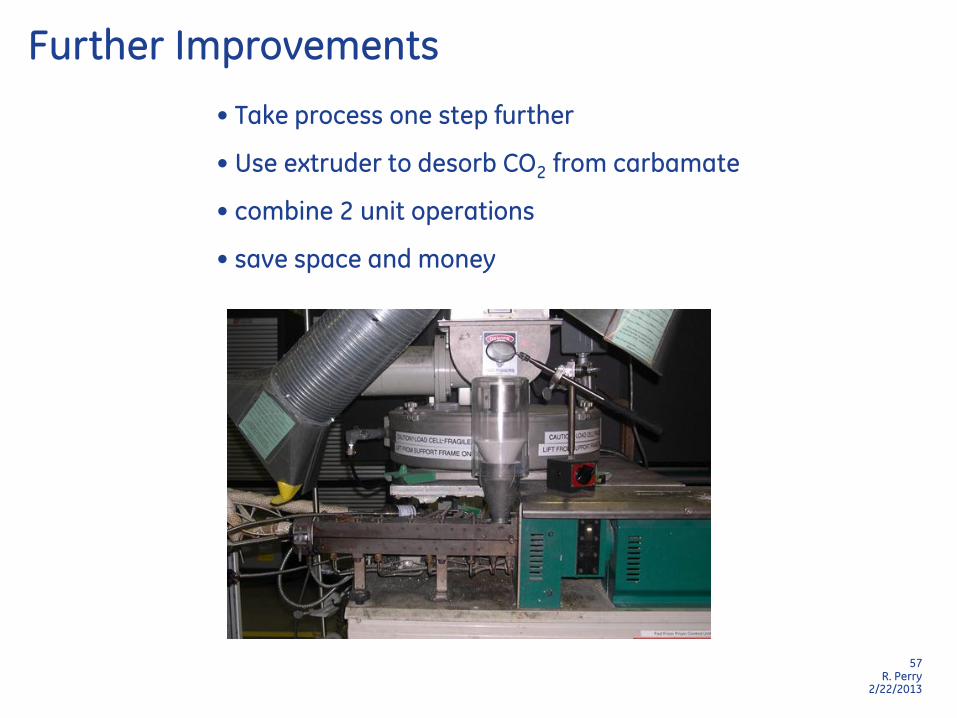
Further Improvements
• Take process one step further
• Use extruder to desorb CO2 from carbamate
• combine 2 unit operations
• save space and money

58 R. Perry
2/22/2013
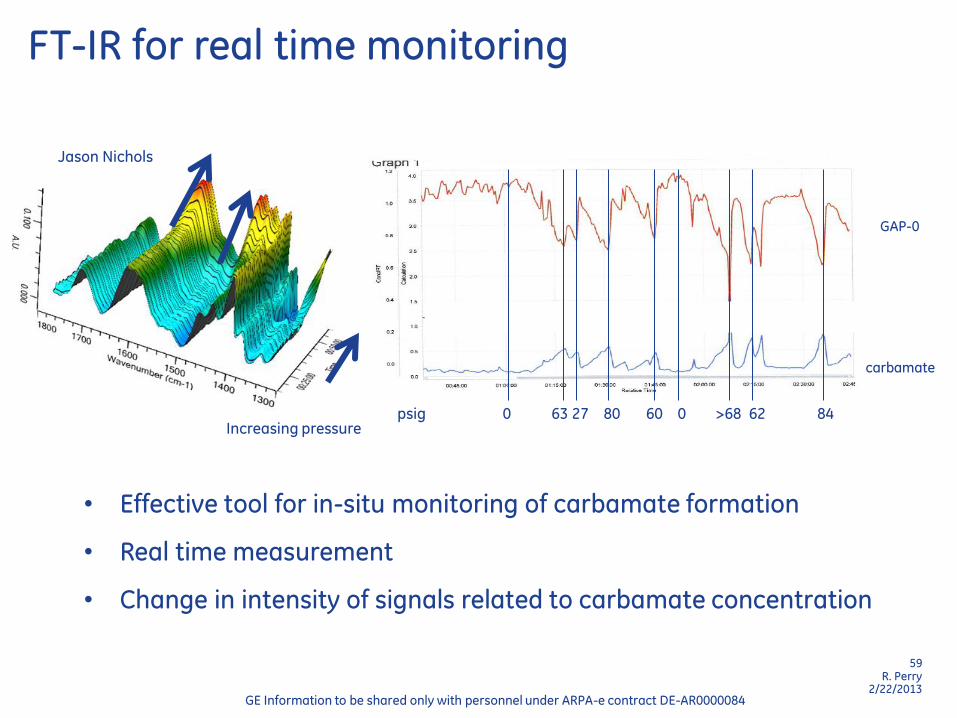
59 R. Perry
2/22/2013
FT-IR for real time monitoring
GE Information to be shared only with personnel under ARPA-e contract DE-AR0000084
• Effective tool for in-situ monitoring of carbamate formation
• Real time measurement
• Change in intensity of signals related to carbamate concentration
Increasing pressure
Jason Nichols
psig 0 63 27 80 60 0 >68 62 84
carbamate
GAP-0

60 R. Perry
2/22/2013
Moving Forward
• Designing and building continuous system
• New, larger absorption unit
• Examining nozzle configurations
• Incorporate extruder into system
• Installing analytical instrumentation
• Gather data for mass balance
• Building ASPEN model for predictive capabilities
61 R. Perry
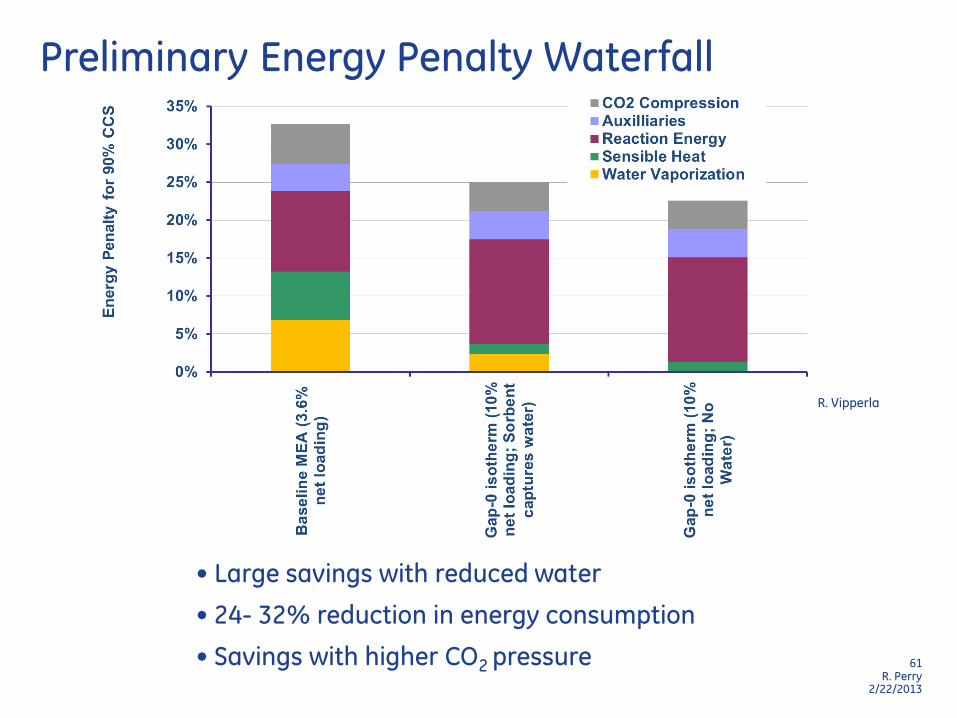
2/22/2013
Preliminary Energy Penalty Waterfall
• Large savings with reduced water
• 24- 32% reduction in energy consumption
• Savings with higher CO2 pressure
R. Vipperla
62 R. Perry
2/22/2013
Summary
• Novel use of aminosilicone sorbents for CO2 capture
• 4th year of effort
• 2 parallel programs ongoing
• Solution-based system in bench-scale phase
• Skid commissioned in Jan 2013
• Unique phase-change process demonstrated
• Designing an integrated system
• Looking for opportunities to leverage this technology in
appropriate businesses
• Partner with external industries to validate process(es) and
bring value to both
63 R. Perry
2/22/2013
GE GRC CO2 Capture Team

64 R. Perry
2/22/2013
Thank You