gdc-utp system studies
TRANSCRIPT

i
GDC-UTP SYSTEM STUDIES
By
MUHAMAD HAFIZ BIN YAZIZ
FINAL YEAR PROJECT REPORT
Submitted to the Electrical & Electronics Engineering Programme
In Partial Fulfillment of the Requirements
For the Degree
Bachelor of Engineering (Hons)
(Electrical & Electronics Engineering)
Universiti Teknologi Petronas
Bandar Seri Iskandar
31750 Tronoh
Perak Darul Ridzuan
Copyright 2011
by
Muhamad Hafiz Bin Yaziz, 2011

ii
CERTIFICATION OF APPROVAL
GDC-UTP SYSTEM STUDIES
by
Muhamad Hafiz Bin Yaziz
A project dissertation submitted to the
Electrical & Electronics Engineering Programme
Universiti Teknologi PETRONAS
in partial fulfillment of the requirement for the
Bachelor of Engineering (Hons)
(Electrical & Electronics Engineering)
Approved:
__________________________
Ir. Mohd Faris Abdullah
Project Supervisor
UNIVERSITI TEKNOLOGI PETRONAS
TRONOH, PERAK
May 2011

iii
CERTIFICATION OF ORIGINALITY
This is to certify that I am responsible for the work submitted in this project, that the
original work is my own except as specified in the references and acknowledgements,
and that the original work contained herein have not been undertaken or done by
unspecified sources or persons.
__________________________
Muhamad Hafiz Bin Yaziz

iv
ABSTRACT
The power system analysis studies serve as the basis for ensuring reliability,
improving system performance and power quality, reducing operating costs, and
providing a reliable supply power during system operation. Thus, this paper presents
a case study for designing power supply system for a plant which will include load
flow study, short circuit study and protection relay study. The studies mentioned will
be conducted through simulation by using DIG SILENT Power Factory Software.
This study will focus in island system which is Gas District Cooling (GDC) in
Universiti Teknologi PETRONAS (UTP). The load flow study will be emphasized on
loading and voltage. The short circuit study will be emphasized on fault current for
three phase, line to line, line to ground and line to line to ground. Finally, the
protections relay study is to know the correct Time Multiplier Setting (TMS) to make
the relay operate coordinately. The purpose of this study to understand the importance
of system study analysis in plant, study and performed the analysis simulation for
designing a power system and finally to familiarize with software which is DIGSilent
Power Factory. The system study should be done in Universiti Teknologi
PETRONAS because of total blackout and increasing in load every year. The method
that used to do this study such as gathering data, model the system in software and
analysis the data. The simulation base on four scenarios for load flow study and short
circuit study and one scenario for protection relay study. The result that obtained from
this study is for load flow study, the voltage deviation with the limit base on
PETRONAS Technical Standard (PTS). For short circuit study, the current faults that
obtained from the study will not damage the buses. For protection relay study, some
breaker has been suggested to have new Time Multiplier Setting (TMS) during
overcurrent and cannot manage to do the earthfault due to limitation on software.

v
ACKNOWLEDGEMENTS
I would like to express my gratitude to all those who gave me the possibility to
complete this project. My utmost gratitude goes to my project supervisor, Ir. Mohd
Faris Abdullah for his supervision, commitment, professionalism, suggestion and
encouragement helped me in all the time of study and writing of this thesis. I am
indebted to maintenance engineer, Ir . M Fatimie Irzaq B Khamis I would not be
performing this work without his continual guidance. Finally special thanks to my
family, my colleague and to those who helped me to complete this studies. Thank
you.

vi
TABLE OF CONTENTS
ABSTRACT…………………………………………………....…………iv
ACKNOWLEDGEMENT ……………………………………..………….v
LIST OF TABLES………….......................................…………………….viii
LIST OF FIGURES…………………………………………….………….ix
LIST OF ABBREVIATIONS………………………………….…………..x
CHAPTER 1: INTRODUCTION…………………………...…….…..1
1.1 Background of Study……………………………….………....…........1
1.2 Problem Statement………………………………….….……….....…..2
1.2.1 Problem Identification…………………………..…….…....….….2
1.2.2 Significant of Project….………………………..……….….…......2
1.2.3 Objective and Scope of Study……..……………………….…..….3
CHAPTER 2: LITERATURE REVIEW..……………………….…...5
2.1 Power System Design Requirements……………………….…………5
2.2 System Studies….………………………………………………….…..5
2.2.1 Load Flow Study……………………………………..…….………5
2.2.2 Short Circuit Study…………………………………….….……….5
2.2.3 Protection Relaying Studies..................................................................6
CHAPTER 3: METHODOLOGY………………...………….……....10
3.1 Procedure Identification…………..…………………………….……10
3.2 Tools and Equipments Required……………………………......……12

vii
CHAPTER 4: RESULT AND DISCUSSION…................................……16
4.1 Load Flow………………………………………………………….….…..16
4.1.1 Voltage Drop….……………………………………………….………16
4.1.2 Losses………………………………………………………….…….....18
4.2 Short Circuit…………………………………………………………….…18
4.2.1 Result……………………………………………………………….…19
4.2.2 Discussion…...............................................................................…….…..23
4.3 Protection Relay Study…....................................................................…....….23
4.3.1 Result……………………………………………………………….…..23
4.3.2 Discussion………………………………………………………...……24
CHAPTER 5: CONCLUSIONS AND RECOMMENDATIONS………….25
5.1 Conclusion…………………………………………..………..………….....25
5.2 Recommendation……………………………….....…………...………..…25
REFERENCES……………………………………….……..………….......….26
APPENDICES……………………………………….…………………………27
APPENDIX A……………………………………….………………………….28
APPENDIX B……………………………………….……………...…….…….30
APPENDIX C……………………………………….……….………...…….…35
APPENDIX D……………………………………….…….….…………...……36
APPENDIX E……………………………………….…………..…….………..37
APPENDIX F……………………………………….……………..…….……..38
APPENDIX G……………………………………….…………………...…….39
APPENDIX H………………………………………………………………….40

viii
LIST OF TABLES
Table 1: Scenario options for load flow study………………………..…….11
Table 2: Scenario option for short circuit study……………………..………12
Table 3: Scenario options for protection relay study……………………..…..13
Table 4: Summary of HV (11kV) buses voltage drop (kV)………….....…….16
Table 5: Analysis of each scenario …………………………………………..17
Table 6: Total losses of the system…………………………………..…..…18
Table 7: Result of short circuit analysis (Three phase)……………..........…19
Table 8: Result of short circuit analysis (Phase to Phase)…………...….….20
Table 9: Result of short circuit analysis (Phase to Ground)…………...…...21
Table 10: Result of short circuit analysis (Phase to Phase to Ground)….....22
Table 11: Overcurrent……………………………………………………….23

ix
LIST OF FIGURES
Figure 1: Overcurrent fault (R-B Fault)…….…………………….…...7
Figure 2: Overcurrent fault (R-Y Fault)…………………………….....7
Figure 3: Earthfault ............................................................................…...8
Figure 4: Combined overcurrent and earthfault protection…….....…9
Figure 5: Flow chart of the project....................................................…...14

x
LIST OF ABBREVIATIONS
TNB Tenaga Nasional Berhad
GDC Gas District Cooling
UTP Universiti Teknologi PETRONAS
AC Alternating Current
PTS PETRONAS Technical Standard
HV High Voltage
LV Low Voltage

xi

1
CHAPTER 1
INTRODUCTION
1.1 Background of Study
The power system shall be designed to meet the objective, primarily safety
to personnel operation and maintenance of plant and also reliability and continuity
of power supply for maximum production and energy-efficient operation.
A load flow analysis shall be carried out for both normal and emergency
operation modes to determine the steady-state operating characteristics of the
electrical system and to check that the steady-state voltage drops and voltage
deviations in the power system are within operating limits of the equipment. The
load flow study highlights the system power flows, percentage voltage drop, power
factors and transformer loading in the system during steady state operations under
normal and peak load conditions.
A short circuit analysis which is the calculation of fault-current levels at all
buses in the system is studied to minimize the consequences of a potential short
circuit in the system [1]. The short circuit study is conducted to ensure the
adequacy of the existing switchgear fault level capacity by taking into account the
fault contribution by generator and equipment in the system.
A protection relaying study should be performed in order to prevent
protection maloperation total blackout during operation. The basic components in
protection system are sensing device (current transformer, voltage transformer, and
transducer), relay (decision maker to trip), and circuit breaker (fault isolation)

2
1.2 Problem Statement
1.2.1 Problem Identification
Power system analysis is an important consideration that must be dealt
with during the design of power supply system. The design of power supply
system must meet requirement for maximum production and energy efficient
operation. In the design process, it is not practical to design a system to be stable
under all possible circumstances. Thus the design criteria specify the disturbances
for which the system must be designed to be stable. In system design, therefore, a
wide number of scenario or disturbances are assessed and if the system is found to
be unstable, a variety of action can be taken to improve the situation.
In order to do that, the need of powerful software that performs various
calculation and studies is a necessity. Therefore DIG SILENT Power Factory
Software has been chosen to do modeling and simulation for load flow, short
circuit and relay protection coordination study in this project.
1.2.2 Significant of Project
The power system analysis is like main element in designing a plant. Since
all the equipment in the plant using electricity as their source of power, the
modeling and simulation is required to determine the performance of the power
system in the plant [3].
As for the load flow study, the need to calculate the total load demands in
UTP. This is important as to ensure the generators available can cater all the loads
or find other alternatives.
Short circuit study is conducted to verify and establish the maximum three
phase symmetrical short circuit current at all busses. The result obtained from
study is used to verify whether the existing short circuit ratings are sufficient to
withstand the fault current.

3
A protection relaying study is very important in order to solve problems
that occurred in UTP which is total blackout even though fault happened at the low
voltage. The objectives of this study are:
a. Reliability – Correct operation in clearing a fault
b. Security – avoidance of incorrect operation or mal-operation in clearing
fault
c. Speed – minimum operation time to clear a fault so as to minimize
equipment damage.
d. Selectivity – disconnection of minimum section of the network to isolate
the fault and maintain continuity of supply
1.2.3 Objective and Scope of Study
The objectives of the project are outlined as below:
To understand the importance of system study analysis in
plant.
To study and perform the analysis and simulations for
designing a power system.
To familiarization the selected computer aided tool which is
DIG SILIENT Software.
The scope of study can be summarized as preview on the basic of electrical
system installation for a plant including the power system simulation based on the
demand load. The system study analysis will cover load flow study, short circuit
study, and relay protection coordination.

4
CHAPTER 2
LITERATURE REVIEW
2.1 Power System Design Requirements
The design of the electrical power generation and distribution systems shall be
based on good engineering practice and internationally accepted standards and
shall provide [5]:
Safety to personnel during operation and maintenance of the plant
Reliability and continuity of services of electrical systems to ensure the
plant produce optimum power.
Energy efficient power distribution and utilization.
Ease of operation and minimum maintenance of equipment
Remote control facility.
Fail-safe feature for safety-related controls.
Standardization of components for maximum interchange ability and
minimal spare stockholding.
Ease of future extension to the existing facilities.

5
2.2 System Studies
2.2.1 Load Flow Study
The load flow study also known as power flow study is one of the most
common used tools in power system engineering which is widely applied to
analyze a variety of the system planning and off-line and on-line operation [6].
The load flow serves a purpose which to calculate the steady state conditions and
focuses on various forms of AC power rather than voltage and current [7].
A load flow study is basically performed to verify:
The total power generation against the power demand of the
plant.
Load flow characteristic in the whole electrical system.
Any current loading violations at any point in the system
Any voltage violation at any bus in the system.
2.2.2 Short Circuit Study
Short circuit study is an important part in power system analysis. It consists
of determining fault-current levels at all buses in the system in order to minimize
the consequences of potential short circuit in the system. Whenever a fault occurs
in electrical power system, relatively high current flow, it will produce large
amounts of destructive energy in the forms of heat and magnetic forces. A short
circuit study ensures that protective device rating within a power system is
adequate [8].

6
Type of Faults
Faults on power systems are divided into three phase balanced
faults and unbalances faults. Different types of faults are:
Three-Phase Fault (3P)
Single Line to Ground Fault (L-G)
Line to Line Fault (L-L)
Line to Line Ground Fault (L-L-G)
The three phase balances fault (3P) is defined as the simultaneous short
circuit across all three phases. It occurs independently, but it is the most severe
type of fault encountered. The information obtain from three phase balanced fault
is used to select and set phase relays, while the line-to-ground fault (L-G) is used
for ground relays [2].
2.2.3 Protection Relaying Studies
Overcurrent
An overcurrent relay operates when the magnitude of the current exceeds
the pickup or operating level for a time greater than a pre-set delay (definite time)
or a time delay determined by the operating characteristic (inverse) [11]. An
overcurrent relay can also be set instantaneous, i.e. it operates with no intentional
time delay.
A requirement of an overcurrent relay is that it should remain stable, i.e.
not operate, on a starting current, a permissible overcurrent or a current surge. This
requires the inclusion of a time delay that inhibits operation for a period that in an
inverse relay depends upon the magnitude of the current. In a definite time relay
the overcurrent must be greater than the current operating setting for a preset
period.
If a delay is unacceptable, an instantaneous overcurrent relay can be used
but its operating setting must be set sufficiently high to prevent maloperation on

7
non-fault current surges or remote faults which should be cleared by other
protection devices. Grading or relay coordination must consider the operating
behavior of neighboring overcurrent relays, i.e. on a radial system a downstream
fault must be cleared by a downstream relay. [8]
Figure 1: Overcurrent Fault (R-B Fault)
Figure 2: Overcurrent Fault (R-Y Fault)
During overcurrent fault (Figure 1 and Figure 2), if line to line fault happen
which is R-B fault or R-Y fault, the overcurrent (OC) relay will see the fault and
the relay will operate base on the current flow in the figure.

8
Earthfault
An earth fault relay ( Figure 3) is activated by the fault current flowing
from line to earth, while an overcurrent relay is activated if the line current
exceeds a certain value. Normally these are combined to form what is known as a
combined overcurrent and earth fault relay, which is widely used as back up
protection if the main protection fails. An earthfault will cause the unbalanced
current in the CTs and would cause residual current to flow through the earthfault
relay element.
Figure 3: Earth Fault

9
Operation for overcurrent and earthfault relay
Figure 4: Combined overcurrent and earth fault protection
Relays are normally combined for overcurrent and earth fault protection
(Refer Figure 4). It is no necessary to provide overcurrent relay at the yellow
phase because line to line fault will be covered by red and blue phase. An
earthfault will cause the unbalanced current in the CTs and would cause residual
current to flow through the earthfault relay element. [10]

10
CHAPTER 3
METHODOLOGY
3.1 Procedure Identification
3.1.1 Load Flow
i. Collect all the data regarding load flow such as load data, generator data,
cable size, and single line diagram.
ii. Model the single line diagram or the system in the DIGSilent Power
Factory.
iii. The modeling and simulations have been performed with DigSILENT
Power Factory. The parameters for the generator and transformer used in
the calculation are as follows:
(i) Gas Turbine Generator
Site Rating : 4.2MW (5.3MVA at 0.85 p.f.)
System Voltage : 11.17kV, 50Hz
(ii) Transformer
Rating : 1250 / 1750 kVA
Voltage : 11kV / 433V
Rating : 1000kVA
Voltage : 11kV / 433V
Rating : 1600kVA
Voltage : 11kV / 433V
Rating : 1500kVA
Voltage : 11kV / 433V
11
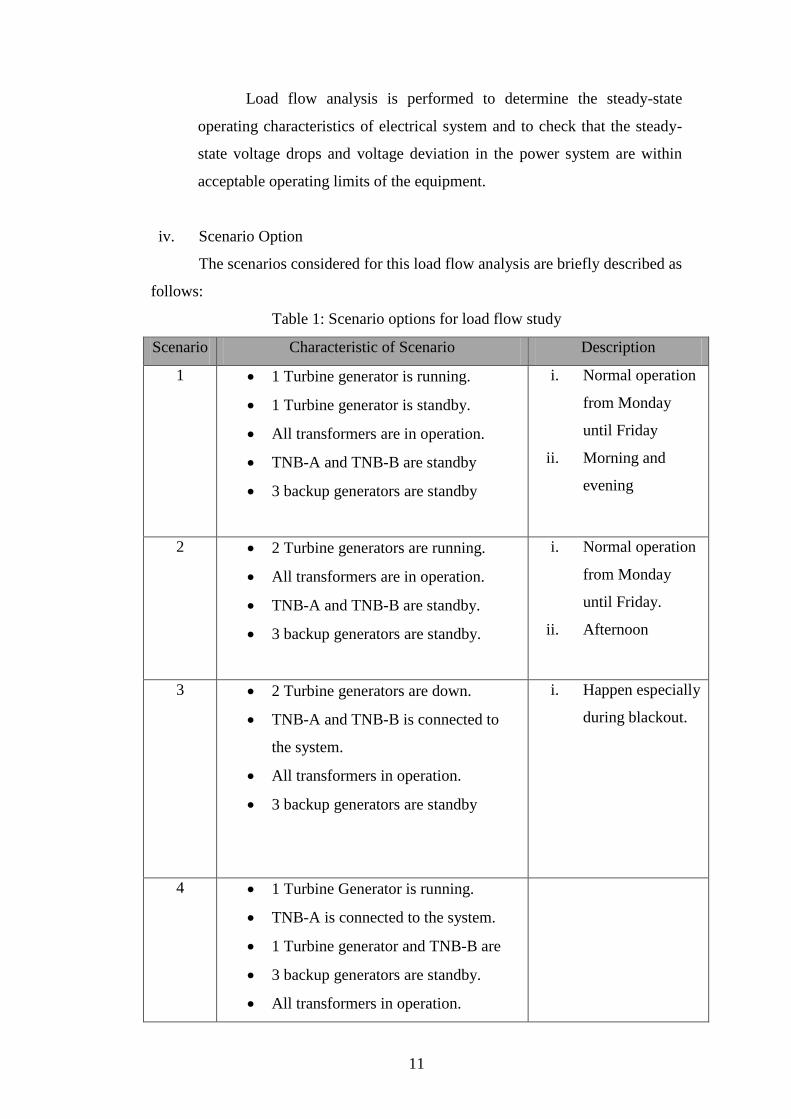
Load flow analysis is performed to determine the steady-state
operating characteristics of electrical system and to check that the steady-
state voltage drops and voltage deviation in the power system are within
acceptable operating limits of the equipment.
iv. Scenario Option
The scenarios considered for this load flow analysis are briefly described as
follows:
Table 1: Scenario options for load flow study
Scenario Characteristic of Scenario Description
1 1 Turbine generator is running.
1 Turbine generator is standby.
All transformers are in operation.
TNB-A and TNB-B are standby
3 backup generators are standby
i. Normal operation
from Monday
until Friday
ii. Morning and
evening
2 2 Turbine generators are running.
All transformers are in operation.
TNB-A and TNB-B are standby.
3 backup generators are standby.
i. Normal operation
from Monday
until Friday.
ii. Afternoon
3 2 Turbine generators are down.
TNB-A and TNB-B is connected to
the system.
All transformers in operation.
3 backup generators are standby
i. Happen especially
during blackout.
4 1 Turbine Generator is running.
TNB-A is connected to the system.
1 Turbine generator and TNB-B are
3 backup generators are standby.
All transformers in operation.

12
3.1.2 Short Circuit
i. Collect all the data regarding load flow such as load data, generator data,
cable size, and single line diagram.
ii. Model the single line diagram or the system in the DIGSilent Power
Factory.
iii. Scenario Option
The scenarios considered for this load flow analysis are briefly described as
follows:
Table 2: Scenario options for short circuit study
Scenario Characteristic of Scenario Description
1 1 Turbine generator is running.
1 Turbine generator is standby.
All transformers are in operation.
TNB-A and TNB-B are standby
3 backup generators are standby
iii. Normal operation
from Monday
until Friday
iv. Morning and
evening
2 2 Turbine generators are running.
All transformers are in operation.
TNB-A and TNB-B are standby.
3 backup generators are standby.
iii. Normal operation
from Monday
until Friday.
iv. Afternoon
3 2 Turbine generators are down.
TNB-A and TNB-B is connected to
the system.
All transformers in operation.
3 backup generators are standby
ii. Happen especially
during blackout.
4 1 Turbine Generator is running.
TNB-A is connected to the system.
1 Turbine generator and TNB-B are
3 backup generators are standby.
All transformers in operation.

13
3.1.3 Protection Relay Study
i. Collect all the data regarding load flow such as load data, generator data,
cable size, and single line diagram.
ii. Model the single line diagram or the system in the DIGSilent Power
Factory.
iii. Scenario has been created in order to have a study case.
Table 3: Scenario for protection relay study
Scenario Characteristic of Scenario
1 1 Turbine generator is running.
3.2 Flow Chart
The project activities flow chart is shown in Figure 5. The studies start with
literature review. After that learning Dig Silent software which is the structure of
the software. Then do some analysis on the electrical load. After that, modeling the
system and verify it. Then the studies begin with load flow study, short circuit
study and finally protection relaying study. Finally, the result from the studies was
analyzed and interpreted. Then the project complete with conclusion and
recommendation.

14
`
Figure 5: Flow Chart of the Project
Result Analysis and Interpretation
Learning DIG SILENT Software
Literature review
Electrical Load Analysis
Start
System Modeling and Verification
Protection Relaying study Load Flow Study
Short Circuit Study
Project Complete

15
3.2 Tools / Software / Equipment Required
1. DIG SILENT Power Factory Software
2. Laptop

16
Chapter 4
RESULT AND DISCUSSION
4.1 Load Flow Study
4.1.1 Voltage Drop
Table 4: Summary of HV (11kV) buses voltage drop (kV)
LOCATION VOLTAGE DROP (kV)
SCENARIO
1 2 3 4
CBTG1 0.00 0.00 0.00 0.00
CBTG2 0.01 0.00 0.00 0.00
GDC 0.01 0.00 0.00 0.00
GDC(2) 0.01 0.00 0.00 0.00
Substation 4
(TX)
0.13 0.12 0.11 0.11
MIS 0.01 0.01 0.00 0.00
Block 05 (2) 0.02 0.02 0.01 0.01
Undercroft 0.02 0.02 0.01 0.01
Substation 1 0.01 0.01 0.00 0.00
MPH
Substation
0.01 0.01 0.00 0.00
Substation 5 0.11 0.11 0.1 0.1
Substation 5B 0.02 0.1 0.09 0.09
Block 05 0.02 0.01 0.00 0.00
Substation 5A 0.09 0.09 0.07 0.07
Substation
ETS
0.04 0.04 0.02 0.02
Block 3A 0.02 0.02 0.01 0.01
DS1A 0.1 0.1 0.09 0.09

17
From the result in Table 4, voltage deviations at all HV buses are in +- 5%
base on PETRONAS Technical Standard (PTS). These voltage deviations are
within the limit of the standard.
Table 5: Analysis of each scenario
SCENARIO RESULT ANALYSIS
1 1. Maximum reactive power limit exceeded , (9.54 MVAR >6.63
MVAR)
2. Maximum active power limit (15.05MW > 5.3MW)
3. The generator loadings is about 268.99%
2 1. No problem occurred
2. The generator loadings for GTG A is 190.04%
3. The generators loading for GTG B is 79.25%
3 1. No problem occurred.
4 1. No problem occurred.
2. The generator loadings for GTG A is 79.25
From the result in Table 5, the loading of the generator is high while loadings
at the average around 50%.
DS1B 0.12 0.12 0.11 0.11
DS2 0.13 0.13 0.12 0.12
Substation 3 0.14 0.14 0.12 0.12
Substation 4 0.13 0.12 0.11 0.11
Substation 2 0.09 0.09 0.08 0.08

18
4.1.2 Losses
Table 6: Total losses of the system
SCENARIO TOTAL LOSSES (MW)
1 0.12
2 0.12
3 0.11
4 0.11
From the Table 6, the total loss in almost the same around 0.11 and 0.12
MW due to the incorrect load scaling.

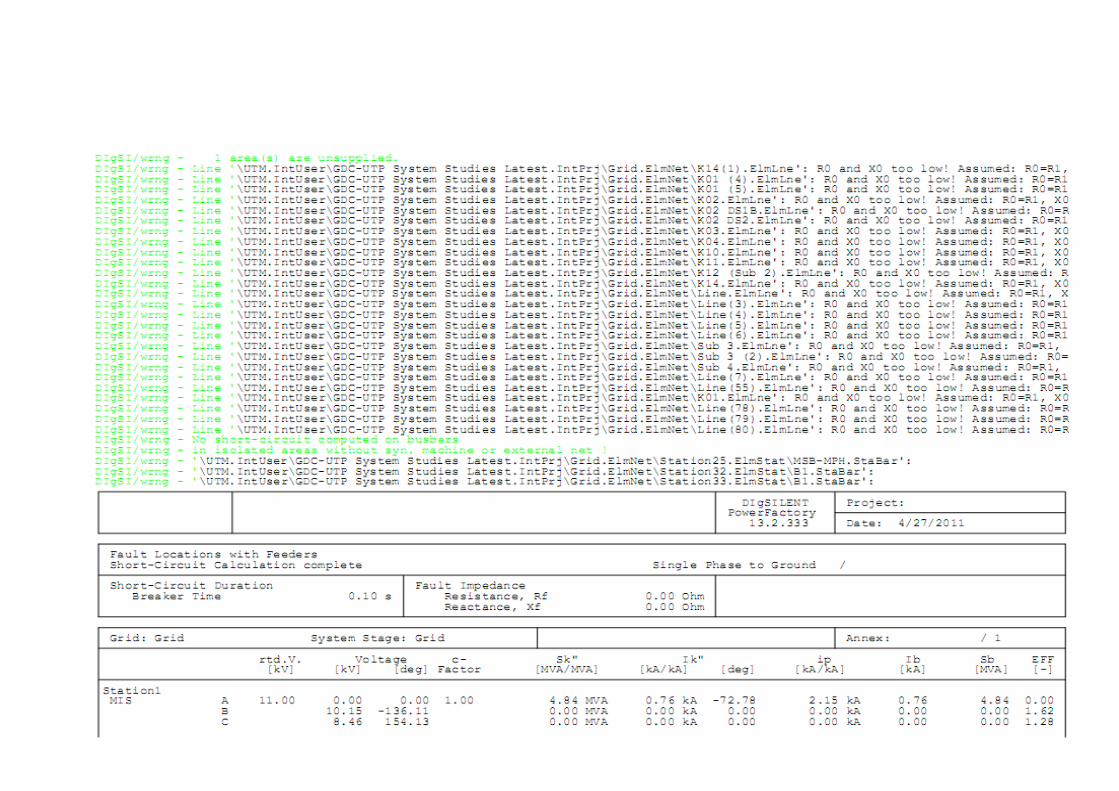
19
4.2 Short Circuit Analysis
Table 7: Result of Short Circuit Analysis (Three Phase Fault)
LOCATION Fault Current (kA)
SCENARIO
1 2 3 4
CBTG1 1.47 2.01 1.31 1.31
CBTG2 1.47 2.01 1.31 1.31
GDC 1.47 2.01 1.31 1.31
GDC(2) 1.47 2.01 1.31 1.31
Substation 4
(TX)
1.42 1.92 1.27 1.27
MIS 1.47 2.01 1.31 1.31
Block 05 (2) 1.45 1.98 1.29 1.29
Undercroft 1.44 1.96 1.28 1.28
Substation 1 1.43 1.94 1.27 1.27
MPH
Substation
1.37 1.83 1.23 1.23
Substation 5 1.38 1.85 1.24 1.24
Substation 5B 1.40 1.88 1.25 1.25
Block 05 1.45 1.97 1.29 1.29
Substation 5A 1.42 1.92 1.27 1.27
Substation
ETS
1.45 1.99 1.30 1.20
Block 3A 1.44 1.95 1.28 1.28
DS1A 1.43 1.93 1.27 1.28
DS1B 1.42 1.92 1.27 1.27
DS2 1.42 1.92 1.27 1.27
Substation 3 1.42 1.92 1.27 1.27

20
Table 8: Result of Short Circuit Analysis (Phase to Phase Fault)
Substation 4 1.42 1.92 1.28 1.27
Substation 2 1.43 1.94 1.27 1.28
LOCATION Fault Current (kA)
SCENARIO
1 2 3 4
CBTG1 1.45 2.07 1.13 1.58
CBTG2 1.45 2.07 1.13 1.58
GDC 1.45 2.07 1.13 1.58
GDC(2) 1.45 2.07 1.13 1.58
Substation 4
(TX)
1.39 1.95 1.10 1.51
MIS 1.45 2.07 1.13 1.58
Block 05 (2) 1.43 2.03 1.12 1.55
Undercroft 1.41 2.00 1.11 1.54
Substation 1 1.40 1.98 1.10 1.52
MPH
Substation
1.34 1.86 1.07 1.45
Substation 5 1.35 1.87 1.07 1.46
Substation 5B 1.37 1.91 1.08 1.48
Block 05 1.42 2.03 1.12 1.55
Substation 5A 1.39 1.95 1.10 1.51
Substation
ETS
1.43 2.04 1.12 1.56
Block 3A 1.41 2.00 1.11 1.53
DS1A 1.40 1.97 1.11 1.52
DS1B 1.40 1.96 1.10 1.51
DS2 1.39 1.96 1.10 1.51

21
Table 9: Result of Short Circuit Analysis (Phase to Ground Fault)
Substation 3 1.39 1.95 1.10 1.51
Substation 4 1.39 1.96 1.10 1.51
Substation 2 1.40 1.98 1.11 1.52
LOCATION Fault Current (kA)
SCENARIO
1 2 3 4
CBTG1 0.18 0.19 0.96 0.76
CBTG2 0.18 0.19 0.96 0.76
GDC 0.18 0.19 0.96 0.76
GDC(2) 0.18 0.19 0.96 0.76
Substation 4
(TX)
0.18 0.18 0.93 0.75
MIS 0.18 0.19 0.96 0.76
Block 05 (2) 0.18 0.19 0.95 0.76
Undercroft 0.18 0.19 0.94 0.75
Substation 1 0.18 0.19 0.94 0.75
MPH
Substation
0.18 0.19 0.92 0.74
Substation 5 0.18 0.18 0.91 0.73
Substation 5B 0.18 0.18 0.92 0.74
Block 05 0.18 0.19 0.95 0.76
Substation 5A 0.18 0.18 0.93 0.74
Substation
ETS
0.18 0.19 0.95 0.76
Block 3A 0.18 0.19 0.94 0.75
DS1A 0.18 0.18 0.94 0.75
DS1B 0.18 0.18 0.94 0.75
DS2 0.18 0.18 0.93 0.75

22
Table 10: Result of Short Circuit Analysis (Phase to Phase to Ground
Fault)
Substation 3 0.18 0.18 0.93 0.74
Substation 4 0.18 0.18 0.93 0.75
Substation 2 0.18 0.19 0.94 0.75
LOCATION Fault Current (kA)
SCENARIO
1 2 3 4
CBTG1 1.41 1.48 2.04 2.11 1.01 1.34 1.43 1.72
CBTG2 1.41 1.48 2.04 2.11 1.01 1.34 1.43 1.72
GDC 1.41 1.48 2.04 2.11 1.01 1.34 1.43 1.72
GDC(2) 1.41 1.48 2.04 2.11 1.01 1.34 1.43 1.72
Substation 4
(TX)
1.36 1.43 1.92 1.99 0.98 1.31 1.37 1.67
MIS 1.41 1.48 2.04 2.10 1.01 1.34 1.43 1.72
Block 05 (2) 1.39 1.46 1.99 2.06 1.00 1.33 1.41 1.69
Undercroft 1.38 1.45 1.97 2.04 0.99 1.32 1.39 1.67
Substation 1 1.37 1.44 1.94 2.01 0.98 1.31 1.38 1.66
MPH
Substation
1.30 1.37 1.82 1.89 0.95 1.28 1.31 1.59
Substation 5 1.31 1.38 1.84 1.91 0.96 1.27 1.32 1.59
Substation 5B 1.33 1.38 1.88 1.95 0.97 1.29 1.34 1.62
Block 05 1.39 1.46 1.99 2.06 1.00 1.33 1.40 1.69
Substation 5A 1.36 1.43 1.92 1.99 0.98 1.30 1.37 1.64
Substation
ETS
1.40 1.47 2.00 2.07 1.00 1.33 1.41 1.70
Block 3A 1.38 1.45 1.97 2.03 0.99 1.32 1.39 1.67
DS1A 1.37 1.44 1.94 2.01 0.99 1.31 1.38 1.66
DS1B 1.36 1.43 1.93 1.99 0.98 1.31 1.37 1.65

23
Base on the Table 7, 8, 9 and 10 for three phase fault, the maximum
fault occurred happen during two generators are running. For phase to phase fault,
the maximum current occurred during two generators are running. For phase to
ground fault, the maximum fault current occurred both TNBs are connected into
the system. Finally, for phase to phase to ground, the maximum current fault
occurred during two generators are running. During the generator in parallel, the
current will add up that caused the current high.
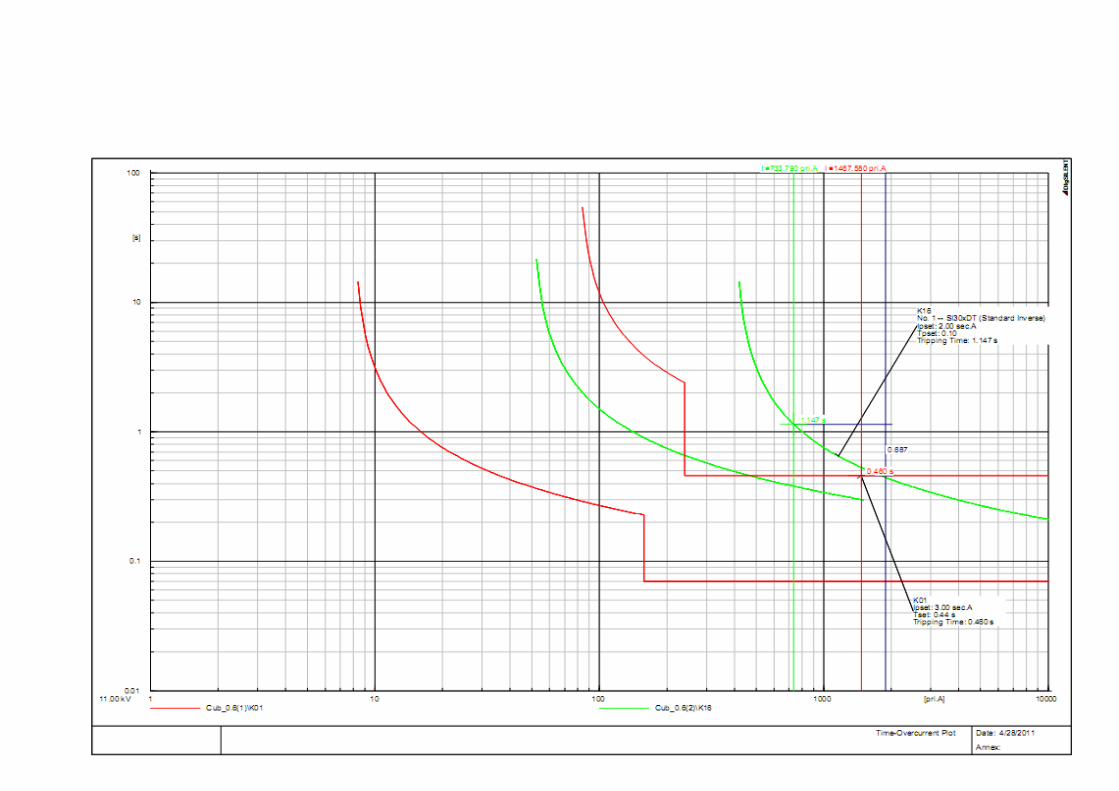
4.3 Protection Relay Studies
Overcurrent
Table 11: Overcurrent
LOCATION FAULT
CURRENT
(A)
CT RATIO
(A)
TMS NEW TMS
K03 14680 400/5 0.2 0.1
GS05 14680 400/5 0.5 0.1
K01(MIS) 14680 400/5 0.15 0.44
K02(MIS) 14680 400/5 0.15 0.325
K03 (MIS) 14680 400/5 0.15 0.300
K04 (MIS) 14680 400/5 0.175 0.225
K10(MIS) 14680 400/5 0.175 0.225
DS2 1.36 1.43 1.92 1.99 0.98 1.31 1.37 1.65
Substation 3 1.36 1.43 1.92 1.99 0.98 1.31 1.37 1.65
Substation 4 1.36 1.43 1.92 1.99 0.98 1.31 1.37 1.65
Substation 2 1.37 1.44 1.94 2.01 0.99 1.31 1.38 1.66

24
K11(MIS) 14680 400/5 0.125 0.15
K12(MIS) 14680 400/5 0.15 0.15
K14(MIS) 14680 400/5 0.1 0.1
From the Table 11, to get the margin 0.4s the new Time Multiplier Setting
(TMS) should be change to new TMS. Total blackout or generator trip will occur
due to the wrong setting of TMS.

25
CHAPTER 5
CONCLUSIONS AND RECOMMENDATIONS
5.1 Conclusion
The power system analysis serve as the basis for improving system
performance and power quality and providing a reliable supply power during
system operation. In this project, author have conducted study on power system
design requirement, power system operating philosophy and further knowledge on
power system studies as well.
For load flow study can conclude that, the system in UTP still reliable due
to the low voltage deviation and low power loss. For short circuit study can
conclude that fault current for every buses will not damage the bus bar due to the
correct breaker current which is lower than fault current. For protection relay study
can conclude that some changes should be done in order to prevent UTP from total
blackout.
5.2 Recommendations
For further studies, for load flow study should study the different off-point
and study for load forecasting. For protection relay coordination should study the
two generator are running at the same time.

26
REFERENCES
[1] http://www.slb.com/media/services/artificial/controller/power_sys_an.pdf
[2] Hadi Saadat. 2004, “Power System Analysis”, Mc Graw-Hill
[3] John. J. Granger & William D. Stevenson, Jr. 1994, “Power System Analysis”,
Mc Graw Hill International Editions,Electrical Engineering Series.
[4] http://www.crcnetbase.com/doi/pdf/10.1201/9780203910832.ch16
[5] Azra Dahiyah Binti Alias, “Power System Analysis for an Offshore Platform”,
2009, Universisti Teknologi PETRONAS.
[6] http://www.cmbengineering.com/short_circuit_study.html
[7] DC Consulting Engineering. 2002, “Protection Relaying Study”
[8] C.L Hor, K.Kangvansaicho, P.A Crossley & A.Shafiu, “Relay Models for
Protection Studies”, Paper accepted for presentation at 2003 IEEE Bologna Power
Tech Conference , June 23rd
– 26th
, Bologna, Italy.
[9] R.Giovanini, D.V Choury, K.M Hopkinson, J.S Thorp, 2004 “Improving Local
and Backup Protection Using Wide Area Agents”, The Institution of Electrical
Engineer.
[10] Sallehuddin Yusuf, Khalid M Nor, Abu Hanifah Azit, Baharin Din, Muahamad
Sumbian Sukaimy, Ralf Humpert, 1996, Distribution Protection-Coordination of
Protective Devices. Tenaga Nasional Berhad.

27
APPENDICES

28
APPENDIX A
GANTT CHART

29
Activities WEEK
1 2 3 4 5 6 7 8 9 10 11 12 13 14
Literature Review on load flow, short circuit and protection relaying study
Software Familiarization
Site Visit to GDC
Progress Report Submission
Electrex (Pre-EDX)
Engineering Design Exhibition (EDX)
Draft Report Submission
Technical Paper Submission
Final Presentation
Final Report Submission

30
APPENDIX B
POWER SYSTEM DATA

31
Generator Spec
Real Power (kW) 5.3 MW
Reactive Power (kVAR) 5.2 MVAR
Phase 3 phase
Voltage (kV) 11 kV
Current (A) 348 A
Frequency 50Hz
Power Factor 0.8
Rotor speed (rpm) 1500 rpm

32
TRANSFORMER DATA
FACT AND FIGURE UTP ELECTRICAL
Bil Substation Rated
(kVA)
Transformer
Brand
Impedence
(%)
Transformer
type
Year Oil
liter
HV
Amp
LV Amp
1 Compact Substation 750 EWT 4.56 Hermitically seal 1996 429l 39.4 1000
2 MPH Substation 1000 EWT 4.66 Hermitically seal 1996 490l 52.48 1333.33
3 Substation 1 1000 EB 5.19 Conservator tank 1998 794l 52.48 1333.33
4 Substation 5 1000 SGB 6.04 Hermitically seal 2001 644l 52.48 1333.33
5 Substation 5A 1000 SGB 6.13 Hermitically seal 2004 659l 52.48 1333.33
6 Substation 5B 1000 SGB 6.03 Hermitically seal 2004 659l 52.48 1333.33
1000 SGB 6.03 Hermitically seal 2004 659l 52.48 1333.33
7 Substation ETS 1000 SGB Cast resin 2005 52.48 1333.33
8 Substation DS1A 1000 LG Cast resin 2003 52.48 1333.33
9 Substation DS1B 1000 LG Cast resin 2003 52.48 1333.33

33
10 Substation DS2 1600 EWT 5.11 Hermitically seal 2000 829l 84 2133
11 Substation 4 1000 MTM 4.67 Hermitically seal 1994 528l 52.48 1333.33
12 Substation 3 1500 EB 6.15 Conservator tank 1988 953l 78.7 2000
1500 EB Conservator tank 1988 953l 78.7 2000
13 Substation
Desajaya
1000 EB 5.24 Conservator tank 1998 794l 52.48 1333.33
14 3A Substation 3000/4200 LG 5.9 Cast resin 2002 157/22
0
4000/560
0
3000/4200 LG 5.9 Cast resin 2002 157/22
0
4000/560
0
Undercroft 1000/1400 LG Cast resin 2007 52.48 1333.33
15 Building 5
Substation
2000/2800 LG 5.8 Cast resin 2001 105/14
4
2667/373
2
2000/2800 LG 5.8 Cast resin 2001 105/14
4
2667/373
2
16 Pocket C
Substation
1250/1750 LG 6.2 Cast resin 2004 65.6 1677
1250/1750 LG 6.2 Cast resin 2004 65.6 1677
17 Pocket D 2000/2800 LG 5.8 Cast resin 2004 105 2667

34
Bil Genset Rated (kVA) Brand
1 Site Office 450kVA/360kW Volvo Penta
2 Main Hall 125kVA/100kW Cummins 6CT
3 MPH 300kVA/240kW Scavia
4 Pocket C
200
kVA/140kW Volvo Penta
5 Pocket D 200kVA/140kW Volvo Penta
Bil UPS Rated (kVA) Brand
1 Main Hall 60 Protec
2 Main Control Room 40 Chloride EDP 70
3 Data Centre 160 Chloride EDP 90
4 Chancellor Hall 160 Chloride EDP 90
Substation
2000/2800 LG 5.8 Cast resin 2004 105 2667
18 MIS 11kV
Substation
500 EWT 4.41 Hermitically seal 2000 275l 26.2 667

35
APPENDIX C
LOAD FLOW RESULT

36

37

38

39

40

41

42

43

44
APPENDIX D
SHORT CIRCUIT STUDY RESULT
(Three Phase)

45

46

47

48

49
APPENDIX E
SHORT CIRCUIT STUDY RESULT
(Phase to Phase)

50

51

52

53

54
APPENDIX F
SHORT CIRCUIT STUDY RESULT
(Phase to Ground)

55

56

57
58

59
APPENDIX G
SHORT CIRCUIT STUDY RESULT
(Phase to Phase to Ground)

60

61

62

63

64
APPENDIX H
Protection Relay Studies Result

65
66

67

68

69