gateway regional center: report to metro
TRANSCRIPT

Gateway Regional Center: Report to Metro Prepared by: Portland Bureau of Planning with assistance from the Portland Development Commission January 2005

Table of Contents Executive Summary 5 Introduction 13 Visions for the Gateway Regional Center 16 Profile of the Gateway Regional Center 17
• Summary of Demographics 17 • Land Use 18 • Transportation 24 • Parks, Open Space, and Public Facilities 28 • Infrastructure 29 • Police & Public Safety 30 • Fire and Emergency Services 32 • Cultural Amenities, Attractions, Activities, and Events 33 • Analysis of the Organization of Civic Uses and Spaces 33
Policy and Regulatory Framework 34 • Relevant Comprehensive Plan Policies 34 • Principles, Goals and Objectives of the Gateway
Regional Center Urban Renewal Plan 38 • Urban Renewal Housing Goals 40 • Urban Design 41 • Zoning and Comprehensive Plan Designations 43 • Relevant Zoning Code Provisions 43
Assets, Barriers/Challenges, and Opportunities 48 • Assets 49 • Barriers/Challenges 50 • Opportunities 53
Market Analysis/Market Trends 55 • Residential Development 56 • Retail and Related Service Commercial 62 • Office Development 65 • Lodging Development 68 • Industrial Potential 69
Redevelopment Strategies 72 • Opportunity Gateway Concept Plan Redevelopment Strategy 72 • Financial Tools 74 • Actions 79
Appendix 91 • Bibliography 91 • Public Involvement Summary 92


Gateway Regional Center Report to Metro
January 2005 5
Executive Summary Background/Problem Statement The Gateway Regional Center: Report to Metro is a summary of the conditions, policies, opportunities, and challenges that affect redevelopment of Portland’s Gateway Regional Center. The 2040 Regional Center “design type” is characterized by mixed uses, higher densities, and transit/pedestrian oriented development and design. As Portland’s only designated Regional Center, Gateway is expected to have concentrations of development second to downtown. The Gateway Regional Center is intended to become a mid-city “downtown” for East Portland. Gateway has long been the location of the major shopping centers serving the “east county” part of Portland. It’s potential as a more intensely developed center has grown over the years due to its accessibility within the region. The area has great transportation assets including access to two major Interstate Highways and MAX light rail. The biggest challenge to creating the Gateway Regional Center has been inducing private-sector development that is consistent with the vision and goals for the area. This is in part due to the weakness in the local market for commercial and employment uses, strong competition from other centers in the region, land assembly issues (due to much of the area’s current small-lot development pattern), the very limited public funds available for redevelopment projects, the perception of the area and the gulf between its current condition and its vision. Portland has established policies to support the long term development of Gateway into an intensively-developed center of housing, employment and commercial activity. Recently the city adopted new zoning regulations for Gateway with flexible provisions, incentives and design standards. The city also created an urban renewal area supported by tax increment financing to pursue private and public redevelopment projects in Gateway. The urban renewal area is relatively young, established only 3.5 years ago, and has yet to generate significant funds to affect change in the area. Vision and Development Concept Early visions for Gateway called for the area to become a commercial, employment and entertainment district with an emphasis on retail and office development. The vision has evolved to include more uses - housing, government, education, and cultural facilities - greater densities, and more emphasis on transit/pedestrian oriented development. The specific concepts for development of Gateway have evolved over the past decade. The diagrams shown on the following pages trace the evolution of the vision for Gateway. Gateway in the 1950s. Photo by Bob Earnest.

Gateway Regional Center Report to Metro
January 2005 6
Adopted Vision Plan Map Outer Southeast Community Plan 1996 The adopted vision plan map of the Outer Southeast Community Plan hints at what a full-scale urban design concept for Gateway might look like. It includes the following elements: • linear north-south park blocks • proposed LRT stations at
Stark/Washington and Market • neighborhood focal points • a system of interconnected walkways
Opportunity Gateway Concept Plan Calthorpe Associates 2000 The regional center – almost as large as downtown Portland – is interrupted at regular intervals by wide, heavily-traveled streets. The concept suggested linear design elements capable of overcoming the barriers created by these streets. In addition, the Concept Plan identifies: • creation of distinct subareas with unique
attributes • tree-lined streets as a unifying design feature • improved street connectivity and creation of
smaller neighborhood blocks • a series of parks in “neighborhood” areas,
and plazas at key locations

Gateway Regional Center Report to Metro
January 2005 7
Draft Urban Design Diagram Opportunity Gateway Program Advisory Committee/SERA Architects 2001 This concept helped focus discussions about Gateway’s identity and design components, and resulted in principles for site/block and building design. Key features included the following: • “Green Streets” to connect parks and schools • identification of future parks and plazas • identification of scale transition areas • identification of view corridors • identification of landmark sites • a refined street hierarchy
Gateway Urban Design Concept Gateway Planning Regulations Project 2004 The adopted urban design concept updates the vision map and sets the policy-level framework for planning and regulatory tools. The concept describes the form of Gateway and includes the following elements: • key street typologies and refined hierarchy • location of potential parks • location of key gateways and intersections • updated future LRT station locations

Gateway Regional Center Report to Metro
January 2005 8
Existing Conditions Demographics & Economy Population in Gateway grew 24% between 1990-2000; the estimated 2003 population is 9,554. Gateway is a moderate income area, with roughly 15 percent of households earning above $75,000, and roughly 15% earning less than $15,000 annually. Employment opportunities are expected to grow over time, with the greatest increase expected in Consumer Services (45%), Health Services (40%), and Fire, Insurance and Real estate (26%). Top employment categories for Gateway residents were Office and Administration Support (20.6%), Production (11.9%), and Sales and Related Occupations (11.2%). Slightly over 18% of all residents have a Bachelor or Graduate degree. Land Use Roughly 33% of Gateway’s acreage is in Commercial and Employment uses; at 18.4% of acreage, multi-family residential is another significant component. The area’s largest employer, Adventist Medical Center, serves as an anchor at the south end of the district. Other district anchors include the Gateway Shopping Center and Physician’s Hospital at north end of the district, and Mall 205, with Home Depot, Target, and other major retailers, at the south end. With some notable exceptions, much of the development in Gateway is currently one- and two-story wood frame structures. Transportation Gateway is well served by some transportation modes, but is lacking in others. It has direct access to I-205 and I-84, and is served by a network of arterial streets. Conversely, the local street network is inadequate – the area lacks connectivity, and many existing streets have poor sidewalk and paving conditions. Walking and cycling are challenging in this district as the infrastructure to serve these modes is incomplete. MAX light rail service provides direct access to downtown Portland, Gresham, and Portland International Airport (PDX), with stops at the Gateway transit center and 102nd Avenue. Planned MAX light rail transit in the I-205 corridor will link Gateway to the Clackamas Regional Center, Lents Town Center and other destinations. An additional Gateway stop is planned at Market Street in the south end of the district. Parks and Public Facilities Gateway has 5.5 acres of public parks, is home to the East Portland Community Center at the south end of the district. The area is currently deficient in parks and usable open space. Other services and facilities include the east Portland police precinct and nearby Multnomah County Library. Policy and Regulatory Framework City and regional policies support future development of Gateway as a highly urban regional center, with transit-supportive land uses, high-quality architecture and design, and pedestrian-oriented design features. Approximately 33% of Gateway’s 645 acres is designated Central Commercial (CX); roughly 8.4 percent is in Central Residential (RX), and 7.4% is in Central Employment (EX), Portland’s most intensive land use designations, respectively. An additional 17% of land area is in lower-intensity multi-dwelling designations. Recent changes to the development code provide generous building envelopes, through increases in maximum heights and floor area ratios

Gateway Regional Center Report to Metro
January 2005 9
envelopes in central areas. The plan for Gateway requires that larger new development “step down” to better meet existing neighborhood scale at the edges of the district. Assets, Barriers/Challenges, and Opportunities Gateway has several assets that make it an attractive place for development as a regional center. Foremost may be the unique transportation facilities that serve the district. This includes convenient access to the regional freeway and light rail system. Gateway is relatively central to Portland’s east side, which allows it to draw from and serve a relatively broad market area. In addition, the area is an established commercial destination with major anchor tenants and employers. Gateway has a relative niche in the area of medical and dental facilities, including two hospital facilities. Finally, Gateway is a designated urban renewal area, which provides financial resources for the development of the district that other areas lack, along with Portland Development Commission staff knowledge and expertise. A significant barrier for Gateway regards the perceptual shift about viability of place and scale of development that must occur as Gateway changes. Many in the broader community have not recognized the potential Gateway offers, and continue to perceive it as a suburban shopping area. In addition, other physical attributes create barriers. The local street network lacks key connections, and improvements are often substandard. Fragmented ownership and small parcel size makes redevelopment challenging. The land use pattern is currently auto-oriented and low scale. Much of the area adjacent to the public realm is used as surface parking. The mix of land uses is often awkward, with adjacent seemingly conflicting uses, and the lot pattern has created inefficient or unusable lots. Private development agreements also limit redevelopment of key parcels. Additionally, land values and market demand do not currently support structured parking or the development potential allowed by the zoning code. Finally, competition from other existing nearby commercial and employment districts such as Clackamas and Gresham, and new ones such as Cascade Station at Portland International Airport, compete for a share of development that might be attracted to Gateway. Gateway currently offers several opportunities to capitalize on public investment in the area. The Gateway Transit Center is the future site of significant redevelopment. Phase one of the project includes development of an office building and parking structure in an area currently used as a surface park and ride lot. Planned “boulevard” improvements to 102nd Avenue will enhance the pedestrian environment and public realm, making it a more attractive place for development. The intersection of 99th Avenue and Glisan Street has been realigned to improve traffic flow and access in the district. Completion of the East Portland Community Center Pool in 2007/08 will provide a major recreation asset in the district. New I-205 light rail transit service will provide better connectivity to other regional destinations and a new major transit stop at the south end of the district. Market Trends/Analysis Residential Market studies have identified younger, single or married workers, or empty-nest seniors as the primary market for new multi-family housing development. Several multi-dwelling project have

Gateway Regional Center Report to Metro
January 2005 10
been developed in recent years. These include Russellville Commons, Gateway Arbors, and Burnside Station among others. Many of these projects have received some form of public financial assistance, such as tax abatements or loans. Without subsidy, most high density, high quality new construction requires higher rents than are currently supported by the market. In terms of price, Gateway rents were clustered in the middle of the market, but were somewhat less than Portland as a whole. Retail The mid Multnomah County/East Portland area is relatively well-served by retail, particularly power centers and large, credit tenants, but not in terms of major department stores and other retail uses typically found in regional malls. Existing older centers, have upgraded site and buildings to remain competitive with other newer centers. Population growth in the area is expected to support an additional 500,000 to 600,000 square feet of retail or service space by the year 2020. Retail market in Gateway rebounded in the 2002/03 time period, with a 2003 vacancy rate of 9%, and rents between $14 and $15 per foot. Office The mid-county/East Portland area has been a relatively minor player in the regional office market. There is virtually no Class A space on the eastside of Portland and none currently in Gateway. Rents are typically in the $12.50 to $13.00 per square foot range, but can be much higher for medical uses. In the long term, Gateway offers considerable potential for office to serve the East Portland area. In the short term, however, the overall office market is relatively weak, except for medical uses, and regional centers in Clackamas and Gresham compete with Gateway for office development. Cascade Station at Portland International Center may also pose additional competition in the future. Additionally, Gateway has a limited track record for development of Class A space. This however, should change as the proposed Gateway Transit Center development moves toward construction. Lodging In the near-tem, much of the market activity for this area is likely to be focused at the airport area. Additionally, near-tern prospects are dampened by the general oversupply of lodging facilities in Portland. Gateway’s long term prospects are brighter, as the I-84, and I-205 corridors provide visibility, and light rail connections and proximity to the airport may provide other opportunity. Industrial There is an existing cluster of industrial uses in a portion of the district. Forty eight acres of land are zoned Central Employment (EX) which offers flexibility for industrial as well as other uses. Previous market studies have concluded that significant industrial development in the district is unlikely. An outstanding question is the role of existing industrial in the Regional Center vision. Development Strategy and Accomplishments The City of Portland and Portland Development Commission have enacted a number of tools and programs to aid in redevelopment of the Gateway Regional Center. Development tools include Tax Increment Financing, Housing and Transit-Oriented Development Tax Abatements, Storefront Improvement Grants, and Business Retention and recruitment Loans.

Gateway Regional Center Report to Metro
January 2005 11
The near term strategy for development of the regional center includes the following four items: 1) Focus on key redevelopment opportunities and catalytic projects near the Gateway
Station/Gateway Transit center.
2) Focus business enhancement tools on the medical niche to enhance the district’s identity, build on agglomeration economies and increase business to business activity.
3) Pursue acquisition of property for consolidation and redevelopment as funds and
opportunities allow. 4) Leverage public and private funding sources:
• Leverage federal and regional transportation funds for improvements; • Provide loans and gap financing to leverage private investment.
Recent accomplishments in the Gateway regional center include the following: 1. Gateway Transit Center redevelopment efforts. A public-private partnership underway
between the a private medical practice, Portland Development Commission, and TriMet, will transition the existing surface park-and-ride lot into structured parking and a phased office, housing, and retail development.
2. 102nd Avenue boulevard improvements. Currently in the final planning stages, federal transportation funds will be used to develop boulevard street treatments on 102nd Avenue, a major street within the regional center.
3. 99th Avenue and Glisan improvements. The City of Portland’s Office of Transportation has improved the intersection of NE 99th Avenue and Glisan Street to improve traffic flow and the attractiveness of the intersection area.
4. I-205 MAX. The Portland Development Commission has committed funds for the I-205 light rail transit project which will connect Gateway to the Lents town center, Clackamas regional center, and other southern destinations.
5. Technical and financial assistance. For the next sixteen years, the Portland Development Commission will play a significant role in district improvements through its urban renewal efforts, ranging from assisting redevelopment of large single-ownership parcels to providing storefront facade improvement grants to small businesses.
6. Parks and recreation planning. The Portland Bureau of Parks and Recreation have developed a parks acquisition and development strategy for the district.
7. Development and design regulations update. The Portland Bureau of Planning recently completed an update of planning and development regulations to allow greater density and flexibility for new development.

Gateway Regional Center Report to Metro
January 2005 12

Gateway Regional Center Report to Metro
January 2005 13
Introduction About this Report This report is a summary of significant conditions, policies, regulations, opportunities, challenges, trends, and strategies that affect redevelopment of the Gateway Regional Center in Portland, Oregon. Gateway has been identified as a targeted “regional center” dating back to the development of the Outer Southeast Community Plan but has long served as a center of community commercial and business activity in the area of Portland east of Interstate 205. Now a designated urban renewal area, Gateway has had the benefit of numerous studies and reports both before and after designation as an urban renewal area. The material in this report is a compilation of many of these studies and reports. Given the limited resources for creation of this report and wealth of existing documents, much of the text in this summary report, except for the Executive Summary section, is excerpted almost verbatim from the existing reports. Refer to the appendix for a complete bibliography. Changes were made to the material in the following instances: • The term “district” was changed to the words “regional center” or just “center.” • “Currently” was changed to the date of publication. • Completed tasks were not listed. • Because several documents were used, some rewording was made to integrate the different
elements and for the sake of readability. • References to the anticipated MAX line to the airport were replaced by the completed line. • References to Portland International Center were changed to Cascade Station/Portland
International Center.

Gateway Regional Center Report to Metro
January 2005 14
Location and Background The 653-acre Gateway Regional Center (“Gateway”) has one of the most strategic locations in the Portland metropolitan region. It is an area rich in transportation assets located at the convergence of two freeway corridors (I-84 and I-205), two light rail transit lines, including one that provides direct service to the Portland International Airport, multiple bus lines, and four east-west arterial streets that service neighborhoods from downtown Portland to downtown Gresham. It may soon be home to a third light rail transit line south to the Clackamas Regional Center. The Gateway Regional Center is also an urban renewal area (the Gateway Regional Center Urban Renewal Area) created by Portland City Council in June 2001. Map 1, below, shows the adopted Gateway Regional Center boundary.
Map 1 Gateway Regional Center

Gateway Regional Center Report to Metro
January 2005 15
Neighborhood and Business Associations The Gateway Regional Center/Gateway Plan District is located within three neighborhood associations: Hazelwood, Mill Park, and Parkrose Heights. It is adjacent to the Montavilla, Woodland Park, and Madison South Neighborhood Associations. Map 2, below, shows the relationship of the neighborhood associations to the regional center. Gateway is also home to the Gateway Area Business Association.
Map 2 Neighborhood Associations

Gateway Regional Center Report to Metro
January 2005 16
Visions for the Gateway Regional Center Visions for the Gateway Regional Center, described below, are similar though not identical. The first was adopted by ordinance in January 1996 as part of the Outer Southeast Community Plan. The second was adopted by Resolution in February 2000 as part of the Opportunity Gateway Concept Plan and Redevelopment Strategy. The Gateway Housing Vision is specific to housing, and is part of the Gateway Regional Center Urban Renewal Area Housing Strategy. Gateway/Mall 205 Regional Center Adopted Vision: Growing dramatically, Gateway has added many multi-storied buildings with ground floor restaurants and trendy retail shops, as was anticipated in 1995. Modern transit stations let passengers off at locations sheltered from the strong east winds and driving winter rains. Beyond the stations lie the heart of this exciting new employment, commercial, and entertainment district, anchored by major retailers and office complexes. The park blocks are the focus of development and offer open space and relaxation for the growing population of residents, workers, and visitors. (Outer Southeast Community Plan, page 26.)
Future Vision. The Concept Plan envisions an intensification of activity in the new Regional Center. There is increased employment, retail, and housing opportunities, all of which enhance the district’s livability. The unparalleled transportation access serving the district has been complemented by an improved local network of streets, sidewalks, and transit service – including service to and from the airport. Numerous destinations and attractions fill the area, including new parks, an education center, a government center, and cultural facilities. The Gateway Transit Center has converted from a surface parking lot to a mixed-use community, complete with a public plaza, local shops, and entertainment. The character of existing streets such as 102nd, 99th and 97th has changed dramatically, with wider sidewalks, street trees, and bicycle lanes. New street connections have been made which reduce congestion on major streets. Much of the through-traffic has been managed. All these improvements have made walking and bicycling more pleasant and commonplace. (Opportunity Gateway Concept Plan, page 1.) Gateway Housing Vision. In the next 20 years, the Gateway District will emerge as a vibrant, mixed-income neighborhood offering rental and ownership options across the spectrum of incomes. Housing will act as a catalyst for job creation, mixed-use commercial development, neighborhood-serving amenities, and multi-modal transportation throughout the District. Increased homeownership within the District will strengthen neighborhood stability and offer wealth creation opportunities for residents. Higher quality design and building materials will enhance the area’s livability. Neighborhood-sensitive housing development will honor the transitions between single-family and mixed-use areas. (Gateway Regional Center Urban Renewal Area Housing Strategy, page iv.)

Gateway Regional Center Report to Metro
January 2005 17
Profile of the Gateway Regional Center Summary of Demographics The information in this section was taken primarily from the unpublished and undated Draft paper, Current Conditions and Economic Opportunities, prepared for and with the Gateway Economic Development Working Group by the Portland Development Commission (PDC). The estimated 2003 population of the Gateway Regional Center was 9,554.1 The area’s population grew by 24 percent between 1990 and 2000. This level of growth was consistent with the population growth for the metropolitan area as a whole. The city of Portland grew by 21 percent; the metropolitan region grew by 26.7 percent.2 In 2003 there were approximately 3,800 households in the regional center. They are estimated to grow to 4,157 households, or 9.39 percent, by 2008. In 2003, these households earned the following: Household Income Percentage of households $150,000 or more 2.03% $100,000 – 149,999 5.32% $75,000 – 99,999 7.58% $50,000 – 74,999 20.68% $35,000 – 49,999 16.54% $25,000 – 34,999 17.24% $15,000 – 24,999 14.97% $10,000 – 14,999 8.26% Under $10,000 7.47%
The 2003 estimated population by race was as follows: Caucasian 74.83% Asian 8.43% Hawaiian or Pacific Islander 0.20% Black 4.91% American Indian, Eskimo, Aleut 1.15% Multi-face 4.62% Other 5.87% Hispanic origin 10.66%
1 2000 US Census. Research compiled by Marcus & Millichap. US Census Block Groups with 50% or more of their
area inside the Gateway Urban Renewal Area were included. 2 This summary is based on draft material being compiled with and for the Gateway Economic Development
Working Group. It has not yet been released. Earlier demographic material was based on the Gateway Urban Renewal Area Base Data and Trends report, prepared in September 2002 for the Gateway Housing Strategy. The data in this summary is specific to the Gateway Regional Center. The boundaries for the Housing Strategy, known as the Gateway Study Area, however, are considerably larger, including census tracks adjacent to and even beyond the regional center.

Gateway Regional Center Report to Metro
January 2005 18
Employment information was obtained primarily from projections made by the Metro Data Center based on Transportation Area Zones (TAZs). TAZs are larger than US Census tracts and, therefore, include a larger area than the URA alone. According to Metro, the number of jobs in the TAZs bounded by and adjacent to the Gateway IRA was 11,769 in the year 2000. The number of jobs in the same area in 2015 is projected to be 14,913. This is an anticipated growth rate of 27 percent. The greatest positive changes are projected to occur in the following industries3: • Consumer Services 45% increase • Health Services 40% increase • Finance, Insurance, and Real Estate 26% increase • Retail Trade 22% increase (Note: According to the Housing Strategy, the State of Oregon estimates about 9,249 jobs in Gateway in 2000.) According to the 2000 Census, the number of Gateway residents in the workforce was 3,997. The top three employment categories were: • Office and Administrative Support 20.6% • Production 11.9% • Sales and Related Occupations 11.2% The majority of Gateway residents have completed high school; about half have some secondary education. Of the estimated 6,381 residents who were 25 years of age or older in 2003, the following educational attainment was recorded4: • Elementary 10.12% • Some High School 11.42% • High School Graduate 29.12% • Some College 25.61% • Associate Degree only 5.63% • Bachelors Degree only 13.10% • Graduate Degree 5.00% Land Use General As of 2001, the Gateway Regional Center Urban Renewal Area contained a mixture of commercial, industrial, and residential land uses, as shown below:
3 Consumer services include hotels, personal services, business services, automotive repair, motion pictures and
recreational services. Health services include doctor and other medical clinics, general, specialty and surgical hospitals, outpatient clinics, nursing home facilities, home health care services, psychiatric services, dental laboratories and other related categories. Retail includes food stores, apparel and general merchandise stores, home furniture, hardware and garden supply, automotive dealers and gasoline service stations, and restaurants. Finance, Insurance and Real Estate (FIRE) is self-explanatory.
4 US Census and Marcus and Millichap Map Net, January 2004

Gateway Regional Center Report to Metro
January 2005 19
Land Use Category Acres Commercial/Employment 194.8 32.9%Tax Exempt* 109.0 18.4%Multifamily Residential (includes institutional uses)
108.9 18.4%
Rights-of-Way 160.0 16.8%Industrial 26.3 4.4%Vacant 23.0 3.9%Single Family Residential 22.5 3.8%Open Space* 8.1 1.4%Total 652.6 100.0%
* Open space uses are also tax exempt uses, but are called out separately in this table for illustrative purposes.
Based on its current spectrum of uses, Gateway serves as an activity and transportation center. It exhibits a concentration of employment, retail/office, institutional, and multifamily uses and has minimal single-family and industrial property, both of which tend to require a lot of land and space per capita. It also has an employment anchor in the Portland Adventist Medical Center, the largest employer in the center, which is also a large land holder in the district. Range of Land Uses: • Large, mid-size, and small retail businesses, including national chains and local companies
• Multifamily apartment complexes, including several strictly for senior citizens and condominiums
• Day care centers
• Single-family homes
• Portland Adventist Medical Center, Physician’s Hospital (formerly Woodland Park Hospital)
• Medical and dental offices
• General office uses
• Auto uses, including rental agencies, auto repair shops, dealers, auto body shops, auto lube centers, auto scavengers, and gas stations
• Service agencies, such as IRCO, Multnomah County Child Receiving Center, East Portland Police Precinct
• East Portland Community Center and adjacent parkland
• Two schools: Floyd Light Middle School and Portland Adventist Academy
• U.S. Post Office
• Numerous local and national restaurants, including coffee shops and fast-food chains
• Two large grocery stores
• Fraternal organization: Elks Lodge
• Banks
• Churches
Gateway Regional Center Report to Metro
January 2005 20
• Convalescence and nursing homes
• Funeral homes
• Several motels, including Holiday Inn Express
• Qwest and Pacific Power complexes
• Several small manufacturing/light industrial plants, including metals manufacturing and commercial printing
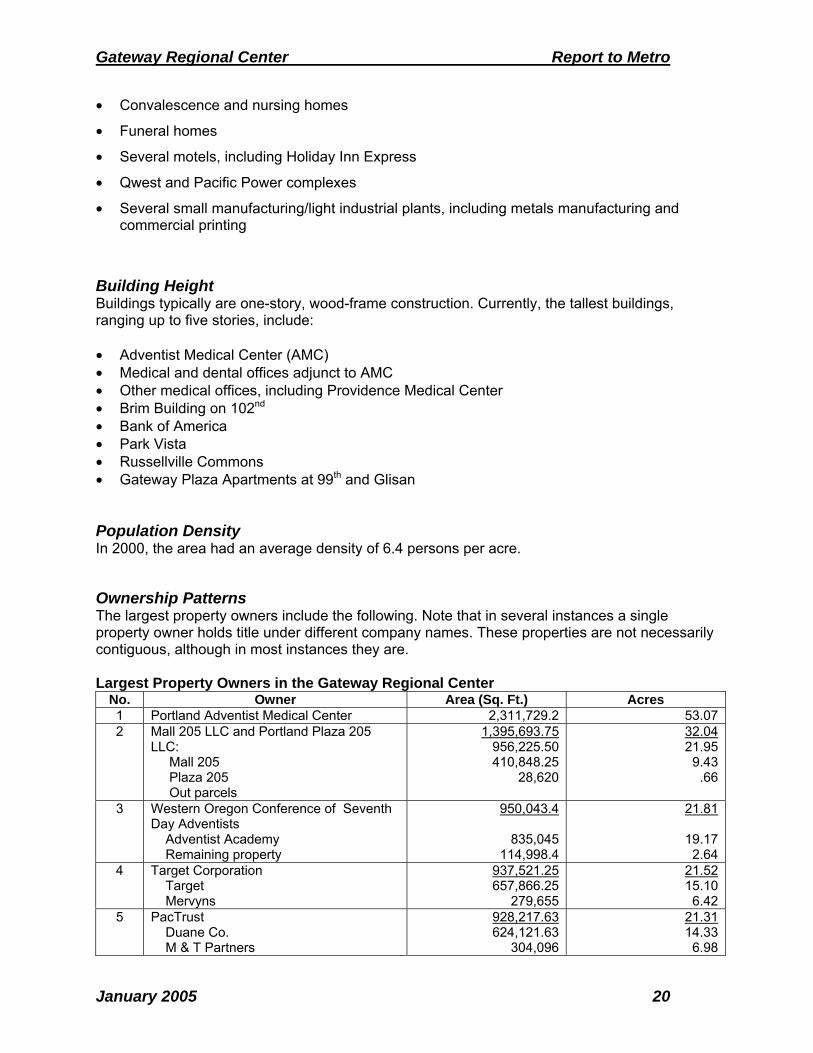
Building Height Buildings typically are one-story, wood-frame construction. Currently, the tallest buildings, ranging up to five stories, include: • Adventist Medical Center (AMC) • Medical and dental offices adjunct to AMC • Other medical offices, including Providence Medical Center • Brim Building on 102nd • Bank of America • Park Vista • Russellville Commons • Gateway Plaza Apartments at 99th and Glisan Population Density In 2000, the area had an average density of 6.4 persons per acre. Ownership Patterns The largest property owners include the following. Note that in several instances a single property owner holds title under different company names. These properties are not necessarily contiguous, although in most instances they are. Largest Property Owners in the Gateway Regional Center
No. Owner Area (Sq. Ft.) Acres 1 Portland Adventist Medical Center 2,311,729.2 53.072 Mall 205 LLC and Portland Plaza 205
LLC: Mall 205 Plaza 205 Out parcels
1,395,693.75956,225.50
410,848.25 28,620
32.04 21.95 9.43 .66
3 Western Oregon Conference of Seventh Day Adventists Adventist Academy Remaining property
950,043.4
835,045 114,998.4
21.81
19.17 2.64
4 Target Corporation Target Mervyns
937,521.25 657,866.25
279,655
21.52 15.10 6.42
5 PacTrust Duane Co. M & T Partners
928,217.63 624,121.63
304,096
21.31 14.33 6.98

Gateway Regional Center Report to Metro
January 2005 21
No. Owner Area (Sq. Ft.) Acres 6 David Douglas School District* 834,610 19.167 Russellville LLC 477,424 10.968 Gilbert Properties
ARP Opportunities LLC Baron Equities GMB Unlimited LTD Gateway Terrace LLC
355,217 198,923 35,463 20,202
100,624
8.16
9 City of Portland* 352,051 8.0810 TriMet 243,108 5.5811 TJS, Inc (Site of Winco Foods) 239,136 5.4912 Benevolent Protective Order of the Elks
(Elks Club) 232,524 5.34
13 Beny Apartments Ltd 229,562 5.2714 205 Place Associates, LLC 227,222.34 5.2215 Gateway Park Apartments (Housing
Authority of Portland) 220,849 5.07
16 AARK LLC 197,111 4.5317 Ernest B. Martin (location of Physician’s
Hospital) 188,620 4.33
18 Frank A Bitar & Associates** 176,959 4.06* Note: These figures are approximate. Most of the City-owned property is designated open space (OS) and
includes the East Portland Community Center and the wooded area east of it. However, a land swap between the City and the David Douglas School District, included as a separate owner, is close to being finalized. This will change the ownership pattern in that part of the regional center.
** These are 15 relatively small parcels clustered around and just south of the SE 99th and E Burnside intersection. General Housing Attributes There are generally four housing subareas in Gateway:
• North of Weidler: Primarily apartment complexes, including a nursing home and retirement community
• South of Halsey, east of 102nd: A mix of single-family homes, low-density multifamily complexes, both rental and condominiums, and, most recently, Russellville Commons is a recent addition at 102nd and East Burnside. The development features a variety of housing types. Single-family homes on relatively large lots lie adjacent to the regional center.
• South of Halsey, west of 102nd: Includes an area of primarily multifamily units north of Glisan, and the Prunedale area, generally considered the area north of Stark Street and south of Glisan Street. Prunedale contains a smattering of single-family homes and a few apartments. These single-family rental and ownership homes are mixed in with large-lot commercial developments that include hotels, used car parts businesses, and manufacturing and supply businesses. There are a few, older multifamily developments near the freeway bordered by a regional paved bike path along the freeway.
• Community Center Neighborhood: New housing development has created a neighborhood hub near the East Portland Community Center taking advantage of the existing amenities of the Floyd Light Middle School, East Precinct Police Center, Adventist Medical Center and Mall 205. Recently developed Cherrywood Village, which occupies 12 acres and contains over 300 senior apartments and assisted living units, joined the Floyd Light Apartments on 106th and Park Vista apartments located on 109th and Stark Street to form a small neighborhood node off of 106th and Stark/Washington.

Gateway Regional Center Report to Metro
January 2005 22
Tax Exempt and Tax Abated Properties A list of significant tax exempt properties in the regional center includes: • Portland Adventist Medical Center (SE 100th and Main) • TriMet properties • Gateway Elks properties (NE 99th and Pacific) • Pacific Power and Light property (SE 100th and Ankeny) • US West/Qwest properties (NE 102nd and Wasco) • Glisan Street Baptist Church (NE 104th and Glisan) • Multnomah County Child Receiving Center (NE 102nd and Burnside) • Oregon College of Oriental Medicine (SE 105th and Cherry Blossom) • Portland Adventist Academy (SE 97th south of Main) • Park Vista housing development [Human Solutions] (SE 109th and Stark) • Floyd Light Middle School (10800 SE Washington) • East Portland Community Center and Police Precinct (SE 106th near Cherry Blossom) • Gateway Park Apartments [HAP] (NE 100th near Irving) Gateway contains several properties with tax-abated status, including Russellville Commons, Gateway Condominiums at 104th and Clackamas, Gateway Arbors at 99th and Irving, Cascade Crossing at 105th and Burnside, and Gateway Plaza Apartments at 99th and Glisan. On this list are the largest property holdings in the center and some of its most valuable building inventory. When combined with various smaller properties (owned by the City of Portland, Multnomah County, and the Oregon Department of Transportation), the total non-tax paying properties as of 1999 was over 117 acres. This represents almost $98 million in real market value (1999) as summarized in Table 3.8. Table 3.8: Tax Exempt and Tax Abated Properties Status Acres % of Total Acreage 1999 RMV % of Total RMV Exempt 117.1 19.8% $89,079,600 19.2% Abated 11.7 1.9% $8,640,000 1.9% Total 128.8 21.7% $97,719,600 21.1%
Sources: Multnomah County Tax Assessor and 2000 RLIS Data, Metro RMV = Real Market Value The Opportunity Gateway Concept Plan calls for some of the property that is currently tax exempt to be redeveloped into taxable uses (e.g. TriMet Transit Center, portion of the NE 102nd and Burnside site). The Concept Plan also envisions property potentially being taken off the tax rolls for tax exempt purposes (e.g. Education Center). Vacant Properties In 2000 less than 4 percent of the land in the regional center was vacant. Some vacant properties were small remainders attached to larger parcels, which were the result of creation or vacation of streets, land assembly and replatting, or other unusual situation. Some properties have landscaping on them, for example, part of the landscaping for Adventist Medical Center. Still others are used for parking for adjacent uses. . Building Conditions Most buildings in the center were built between 1950 and 1980, with some notable exceptions like the PacTrust site (which houses Fred Meyer, Mervyns, Tower Records), a 1980s-era mini-

Gateway Regional Center Report to Metro
January 2005 23
mall containing Office Depot, and the more recent buildings constructed since 1999. As of 1999, the median age for all buildings in the center was 52 years. While the age of the building stock does not necessarily correlate with its overall condition, it does indicate that the area had not recently experienced significant reinvestment district-wide. The lowest quality buildings are clustered in the Prunedale area, defined as the area framed roughly by East Burnside, SE Stark, I-205 and SE 102nd. In the summer of 2000, the Portland Development Commission (PDC) hired volunteers from the Gateway Elks, Loaves and Fishes Seniors, and Gateway Area Business Association to do a “windshield” survey of buildings in the study area. Volunteers were instructed to rate every building according to the following three-grade system: • Condition A: Buildings that were new or well-maintained, needing only cosmetic
improvements such as new paint • Condition B: Buildings that needed improvement over and above “cosmetics” (e.g., sagging
porch, broken windows or worn-out roof). These were buildings for which rehabilitation appeared economically feasible
• Condition C: Buildings that were dilapidated and probably beyond improvement or repair. These were buildings for which rehabilitation appeared to be economically unfeasible.
Building Conditions Total A B C 692 623 56 13 100% 90% 8% 2%
Source: Building Conditions Survey – Gateway Elks, Gateway Business Association, Gateway Loaves and Fishes Ten of the 13 Condition C buildings were in the Prunedale area between NE Glisan, SE Stark, I-205 and 102nd. The results of this survey indicate that Gateway’s buildings are in fair to good condition and are generally not a blighting influence on the area. Most of the area’s single-family homes are well-maintained and its commercial buildings are made of fairly durable materials that weather well. While it is true that one out of every ten buildings is in need of repair, (contributing to a visual type of blight), most of the buildings in Gateway contribute positively to the public health, welfare, and safety of the community. Moreover, the lowest quality buildings seem to be clustered in a fairly confined area. Ratio of Buildings to Land Value and Market Values Improvement to Land Ratio. The ratio shows the value of what’s on the land to the value of the land itself. In this methodology, land value in the ratio is expressed as one (1) and the value of the improvement – the buildings or other additions to the land – is expressed as a greater or lesser number, depending on whether that value is more or less than the value of the land. Different land uses yield very different I:L ratios; for instance, large lots that contain industrial uses with outdoor storage, and commercial uses with extensive at-grade parking, yield relatively low I:L ratios. High-density residential uses and intensive residential/retail mixed-use development with structured parking yield high I:L ratios. As a rule, the denser the development, the higher the I:L ratio, assuming all other things are equal. The average I:L ratio in Gateway for the tax year 1999 - 2000 is 2.08:1, which may be acceptable for a light to moderately developed suburban area, but would be inappropriately low for a regional center in close proximity to regional transportation facilities like I-205, I-84, and MAX.

Gateway Regional Center Report to Metro
January 2005 24
In looking at the subareas, the 102nd/Burnside Station subarea has the lowest I:L ratio in the center at 1.76:1. This is most likely attributable to the relatively high number of vacant parcels in the subarea, as well as a high percentage of buildings in “B” and “C” conditions. The same can be said for the Gateway Station subarea, although its ratio of 1.96:1 is also partially attributed to the large amount of land currently used as surface parking. Subarea I:L Ratios
Subarea I:L Ratio Halsey Weidler 2.40:1Employment (South) 2.24:1Gateway Average 2.08:1Gateway Station (North) 1.96:1102nd/Burnside Station (Central) 1.76:1
Source: 2000 RLIS Data, Metro The relevance of the center’s I:L ratio becomes clearer when compared to the I:L ratios of other City of Portland urban renewal districts. One example is illustrative: the properties within the recently formed Interstate Corridor Urban Renewal district had an average I:L ratio of 2.45:1 in the 1998-99 tax year. Transportation Public Transportation. The frequency and availability of public transportation service is excellent. The existing MAX light rail line carries passengers west to downtown, east to Gresham, and north to Portland International Airport. TriMet operates 12 bus lines within or adjacent to the area, and operates the Transit Center at the Gateway MAX station. The north-south corridors of 99th, 102nd and the east-west Main Street corridor are completely within a quarter-mile of a bus line that runs every 10 minutes during peak hours. The Halsey-Weidler, Stark-Washington and Market Street corridors are within a quarter-mile of 20-minute bus service. Only the Cherry Blossom corridor and the Glisan corridor lack 10- or 20-minute transit service, although Glisan does have hourly service. The Transportation Element of the Comprehensive Plan identifies the following transit classifications: • Regional Transitway: I-84, I-205 • Regional Transitway and Major Transit Priority Street: Burnside • Major Transit Priority Street: 102nd south to Washington; Stark/Washington couplet to 102nd • Transit Access Street: Halsey/Weidler couplet; Glisan from I-205 to 102nd, 99th to
Washington; Stark/Washington couplet east of 102nd • Community Transit Street: Glisan east of 102nd, 111th north of Halsey; 102nd/Cherry Blossom
south of Washington; 97th; Main; Market The most heavily used destination in the center is the five-acre Gateway Transit Center (Park-and-ride). Over 1,000 cars park at the Transit Center and on nearby streets every weekday morning. This volume, in combination with the poor accessibility of the Transit Center, has resulted in heavy congestion at nearby intersections. Congestion is exacerbated by Gateway’s poor connectivity. Because many of Gateway’s streets and sidewalks don’t connect, trips by foot, bicycle, and car are often circuitous and frustrating.

Gateway Regional Center Report to Metro
January 2005 25
Streets: Almost all of the development in the Gateway Regional Center was built after World War II, after the emergence of the automobile as the primary mode of transportation for residents, workers, and visitors in the area. The effects of this timing are clearly expressed in the suburbanized qualities of the area’s automobile-oriented street infrastructure and development. Major streets (Stark/Washington, 102nd, and Glisan) accommodate high vehicle volumes and speeds. Minor streets, such as 100th, Ash, and Irving are often discontinuous and lack standard improvements like curbs, sidewalks, and street trees. Despite this and despite the area’s proximity to public transit, most people in the regional center get around by driving alone. In 1994, 78 percent of home-based work trips by those who either work or live in the center were completed using a single-occupied vehicle. The auto was also the transportation mode of choice for 95 percent of all other trips. The Transportation Element of the Comprehensive Plan identifies four types of traffic streets: • Regional Trafficway: I-84, I-205 • Major City Traffic Street: Halsey/Weidler couplet, Glisan, Stark/Washington couplet, 102nd
north of Weidler • District Collector Street: 102nd south of Halsey, Cherry Blossom • Neighborhood Collector Street: 99th, 111th north of Weidler, Burnside, Market • Local Service Traffic Street: Remaining streets The center is immediately adjacent to I-205 and I-84, resulting in high volume usage of NE Halsey/Weidler, NE Glisan and SE Stark/Washington, the center’s major east-west streets. Although there is an established network of local service streets, there is also congestion caused by regional through-traffic and a lack of connectivity in the local street network. Roadway segments nearing or exceeding planned capacity in the center are shown in the table below. Roadway Segment Levels of Service
Roadway segment LOS NE Halsey west of NE 114th E NE Glisan west of NE 99th F SE Stark west of SE 113th E
Source: Fehr & Peers Associates, Inc. Several of the center’s key intersections rate poorly in terms of level of service. On a letter grade scale from A (free flowing traffic) to F (congestion), 13 of 17 roadway segments in the area measured in 1998 were rated at D or worse. Three intersections, represented in the following table, operate at LOS F during the PM peak hour of the day. Intersection Levels of Service
Intersection LOS NE Glisan/NE 102nd F NE Glisan/I-205 SB Ramps* F SE Washington/I-205 SB Ramps* F
*Under the jurisdiction of the Oregon Department of Transportation Source: Fehr & Peers Associates, Inc. Although the majority of the center’s roadways are in satisfactory physical condition, a Portland Office of Transportation (PDOT) analysis shows that they fail to meet the intersection spacing

Gateway Regional Center Report to Metro
January 2005 26
requirements of Metro’s Functional Plan. Approximately 30 percent of the center’s blocks are longer than the Metro designated maximum of 530 feet. This should be rectified over time as new streets are built in conjunction with new development. Map 3, shown on the next page, identifies the Gateway Master Street Plan, which was adopted into the Comprehensive Plan as part of the Transportation System Plan in 2002.
Map 3 Gateway Master Street Plan Unimproved Roads, Curbs, and Sidewalks. There are several unimproved roads located within the center, most of which lie west of 99th between SE Stark and NE Glisan. These roads lack any right-of-way improvements, including paving, curbs, and sidewalks. They are: • SE Ash and SE Pine between 97th and 99th; • NE Davis and NE Couch between 97th and I-205; • SE 102nd between SE Morrison Ct. and SE Yamhill St.; and

Gateway Regional Center Report to Metro
January 2005 27
• SE Yamhill between SE 102nd and SE Cherry Blossom. Approximately 20 percent of the streets in the center do not have complete sidewalks and curbs that comply with the Americans with Disabilities Act and applicable citywide standards. Sidewalk segments are missing throughout the center and are most notably absent in the southern portion of the Prunedale area. Nearly the entire length (0.5 miles) of SE 97th Avenue between Burnside and Stark is without sidewalks. In addition, most of the north-south avenues that intersect NE Halsey and NE Weidler lack sidewalks. Bicycle Routes. Presently, bike lanes exist only along two east-west corridors: the Halsey/Weidler and Burnside corridors. There are no bike lanes on north-south corridors except the dedicated pedestrian/bike trail between 96th and I-205 from Market to Stark. The Transportation Element of the Comprehensive Plan identifies the following bicycle classifications: • City Bikeways: 102nd, Burnside, Glisan, 99th/96th, Stark/Washington, Cherry Blossom,
Market, Glisan, Halsey/Weidler • Off-Street Path: I-205 Bikeway • Local Service Bikeway: Remaining streets Pedestrian Routes. Almost the entire regional center is included within the Gateway Pedestrian District, identified in the Transportation Element of the Comprehensive Plan. An action item in the revised Gateway Regional Center Subarea Policy of the Outer Southeast Community Plan identifies the expansion of the pedestrian district to include the entire regional center. This will be done during the next update of the City’s Transportation System Plan. It is to be noted that a pedestrian street – and the edge of a pedestrian district – includes both sides of the street. Freight Classifications. The Transportation Element of the Comprehensive Plan identifies the following freight classifications: • Regional Truck Street: I-84, I-205 • Major Truck Street: Stark/Washington • Minor Truck Street: 102nd, Halsey/Weidler, Glisan • Local Service Truck Street: Remaining streets Emergency Response Classifications. The Transportation Element of the Comprehensive Plan identifies the following emergency response classifications: • Major Emergency Response Street: 102nd, Halsey/Weidler, Glisan, Stark/Washington,
Cherry Blossom, 96th • Minor Emergency Response Street: Remaining streets Street Design Classifications. The Transportation Element of the Comprehensive Plan identifies the following street design classifications: • Urban Throughway: I-84, I-205 • Regional Main Street: Stark/Washington, Halsey/Weidler • Community Main Street: 102nd, Burnside • Regional Corridor: Glisan • Community Corridor: Cherry Blossom • Local Street: Remaining streets

Gateway Regional Center Report to Metro
January 2005 28
Parking. Parking is characterized by both abundance and shortage. There is ample parking throughout the center, but it is not located in the areas of highest demand. In 1998, a transportation consultant identified 12,602 on- and off-street parking spots in four subareas within the center: Halsey-Weidler, North, Central, and South. The Portland Office of Transportation (PDOT) reports that three of the four subareas show peak hour occupancy rates of 74 percent or below, within accepted standards for the provision of parking in urban areas. The Central subarea, containing the blocks south of Glisan and north of Stark, experienced the greatest demand for parking. During the subarea’s peak hour of 11 a.m., there was a demand for 2,662 parking spaces from the area’s existing supply of 2,517, resulting in 100-percent occupancy. The North subarea contains the Gateway Transit Center park-and-ride lot and the PacTrust-owned shopping center. The park-and-ride lot is known to overflow with light rail and bus commuters on a daily basis, but the peak hour occupancy rate for the subarea remains low because of the large supply of unoccupied spaces in the adjacent PacTrust shopping center. Overflow commuters park on the surrounding streets. There are currently no parking structures in the regional center, although there are several multifamily complexes with podium parking. The table below presents the peak hours and occupancy rates for all four subareas. On and Off-Street Parking Supply and Demand
Subarea Peak Hour Peak Hour Demand
Existing Supply* Peak Occupancy Rate
Central 11:00 AM 2,662 spaces 2,571 spaces 100% Halsey-Weidler 8:00 PM 940 spaces 1,272 spaces 74% North 2:00 PM 1,784 spaces 4,441 spaces 40% South 11:00 AM 1,554 spaces 4,402 spaces 35%
*Includes both public and private parking spaces Source: Fehr & Peers Associates, Inc. Parks, Open Space, and Public Facilities The center is home to approximately 5.5 acres of neighborhood parks and urban plaza open spaces, including Floyd Light Park and Park 51 at the east end of the Stark-Washington couplet. The only community center east of I-205, the East Portland Community Center, is located on SE 106th Avenue just south of Stark. The center is within a mile of Montavilla Park, a community park of approximately nine acres, and five other neighborhood parks. Nevertheless, the regional center is in need of a significant amount of open space when current conditions are compared to City of Portland people-to-parks standards. According to a 1999 Open Space Analysis, the center currently needs a minimum of 17.5 acres of parkland for existing residents and workers if it is to meet the current citywide ratio of approximately 18.72 acres per 1,000 residents. To keep up with projected population increases over the next 20 years, Gateway needs an additional 11 acres (for a total of 29 acres) of open space. The regional center is also home to the East Portland Community Center, one of 14 community centers within the City of Portland and the only community center east of I-205. Across the street from the community center are the East Portland Police Precinct, East Portland Neighborhood Office, and a U.S. Post Office distribution center. The area also contains one public school: Floyd Light Middle School, part of the David Douglas School District. All of these public facilities are located in the southernmost subarea of the center. Just to the north lie the

Gateway Regional Center Report to Metro
January 2005 29
Gateway post office and the Multnomah County Children’s Receiving Center. To the east, on 122nd Avenue, is the Midland Branch of the Multnomah County Library. Infrastructure Water. Public water is currently supplied to the area via a network of lines ranging from 4 to 12 inches in diameter. The City of Portland Bureau of Water Works detects no gross deficiencies in the existing water-line network and considers this system adequate to provide necessary domestic and fire-protection usage. A 1997 bureau review of the water system in the area identified deficiencies in north-south supply mains and the need for improved east-west distribution capabilities. Deficiencies in north-south supply mains were recently addressed with the 36-inch Parkrose Supply Main Phase I. This main connects to an existing 48-inch main in NE 96th Avenue near Mall 205 and extends north to SE Washington Street, east to 102nd Avenue, and north to Halsey Street. To address east-west distribution capabilities, a 12-inch diameter or larger east-west main is planned for SE Stark Street. This project has been in the Bureau’s 10 year CIP planning horizon for several years, but scheduling is not firm. Also in the Bureau’s 10-year CIP is the Parkrose Supply Main Phase II, which includes a large-diameter supply main in NE Halsey Street from 102nd Avenue east to 148th Avenue. Scheduling for this project is not firm. The bureau says that off-site main improvements may be needed to provide domestic and fire supplies to new development projects. Necessary upgrades will depend on specific domestic and fire-flow requirements for any proposed development. In particular, off-site main improvements will probably be needed for proposed developments in areas currently served by 6-inch and smaller distribution mains. New mains will need to be placed underneath any newly constructed or newly improved streets in the area. Sanitary Sewers. Most of the existing sanitary sewer system was constructed and upgraded in the 1990s during the Mid-County Sewer Project. The Bureau of Environmental Services (BES) reports that the system has an anticipated lifespan of 50 to 100 years and should be adequate to accommodate anticipated development. Stormwater. According to 2000 Metro RLIS data, no portion of the regional center exists within the 100-year floodplain. However, some locations experience flooding during periods of heavy rain; stormwater drains are present at each intersection, but some drains feature sumps that do not meet the current city operating standards. Current standards require one sump for each acre of impervious surface in the public right-of-way. The center currently has 100 acres of impervious surface in use as public right of way and only 80 sumps. Furthermore, these sumps are outdated and inefficient at removing floating pollutants and settleable solids. As a result, areas with these sumps (as well as some of those without) often experience flooding during periods of heavy or prolonged precipitation. Stormwater drainage in the Prunedale area is especially poor. Several segments of 97th, 99th, and 102nd Avenues are completely lacking sumps, which often results in flooding at their intersections with Glisan, Burnside and Stark/Washington Streets. Any significant increase in impervious surfaces will require immediate upgrades to the adjacent stormwater drainage system to reduce the possibility of flooding. The inefficient sump system,

Gateway Regional Center Report to Metro
January 2005 30
coupled with the likelihood of intensified development in the center, may ultimately require an area-wide update of the stormwater drainage and treatment infrastructure. Solid Waste. There is currently adequate solid-waste collection, disposal and recycling in the regional center. Eastside Waste & Recycling is the area's franchised hauler for residential units (single-family homes up to four-plexes). Sixty-seven haulers are permitted to provide service to commercial locations throughout Portland. BES does not anticipate problems in handling projected residential and commercial growth in the center. Gateway is centrally located between Metro's two regional transfer stations (Metro Center Station at 6161 NW 61st in Portland, and Metro South Station at 2001 Washington in Oregon City). The approximate travel time during non-peak hours to these locations is 20 minutes. In addition, the area is served by the nearby East County Recycling facility at 12409 NE San Rafael, which accepts non- putrescible waste, including yard debris. Brownfields. Brownfields are sites with known or suspected soil or groundwater contamination. They are typically the result of prolonged exposure to toxic materials or equipment associated with industrial and commercial land uses. Patterns of land use in the Gateway area have historically centered on agricultural and other relatively low-density uses, although the Prunedale area in recent years has housed light industrial uses, automotive service businesses, and the outdoor storage of automotive machinery. Underground oil tanks used to heat residential and commercial structures may have contaminated some sites. Bureau of Environmental Services (BES) records confirm that sites with known or suspected contamination are of minimal concern in the Gateway area. However, the City continues to identify brownfield sites as part of an ongoing effort, and it is possible that contamination associated with the above uses may be present in the study area. Electronics and Communication. Several inquiries were made to assess the suitability of the Gateway area telecommunications infrastructure. Information was solicited from the City’s corporate GIS office, the City’s Office of Cable Communications, US West/Qwest and a private sector consultant. Additional research is in order, but based on preliminary conversations, Gateway is reported to enjoy telecommunications infrastructure on par with any other location in the city. Telecommunications provider Qwest reports that the center is one of the best equipped areas in the region to support future telecommunications services and growth. The Qwest facility on NE 102nd Avenue houses Lucent Technologies’ most technologically advanced switch. The study area also has fiber-optic lines and a surplus of spare conduit that will serve future fiber-optic demand in the area, according to a telecommunications consultant to the City of Portland. Because of this infrastructure, future business and residential customers in the study area should enjoy access to high-speed Internet service, provided developers design new projects to take advantage of this resource. Police and Public Safety The East Portland Precinct is located on SE 106th just south of Stark. Its jurisdiction includes all of Portland east of the I-205 freeway. Below are tables that show the incidences of the eight “Part I” crimes – crimes the federal government requires each locality to track – for three jurisdictions: the City of Portland, the area patrolled by the East Portland Police Precinct, and the study area. The data includes the number of reported crimes in 1996, the number of crimes per 1,000 people, the number of

Gateway Regional Center Report to Metro
January 2005 31
crimes per square mile (both based on 1996 data) and the percentage change in each category of crime from 1996 to 1999. Crimes in City of Portland (146.6 square miles, 1996 population est. 503,000) Crime Incidents Per 1,000
Residents Per sq. mile Pct. Change
1996-1999 Murder 46 0.09 0.31 -27. 78% Rape 402 0.80 2.74 -18.24% Robbery 2,070 4.12 14.12 -44.96% Aggravated Assault
5,325 10.59 36.32 -18.31%
Burglary 7,214 14.34 49.21 -17.30% Larceny 28,966 57.59 197.59 -18.67% Motor Vehicle Theft
6,667 13.25 45.48 -40.68%
Arson 499 0.99 3.40 -6.62% Totals 51,189 101.77 349.17 -21.67%
Source: Portland Police Bureau Crimes in East Portland (38.1 square miles, 1996 population est. 145,492)
Crime Incidents Per 1,000 Residents
Per sq. mile Pct. Change 1996-1999
Murder 6 0.04 0.16 45.45% Rape 98 0.67 2.57 -10.11% Robbery 481 3.31 12.62 -58.75% Aggravated Assault
1,434 9.86 37.64 -9.72%
Burglary 1,682 11.56 44.15 9.47% Larceny 6,705 46.09 175.98 -5.91% Motor Vehicle Theft
1,968 13.53 51.65 -25.11%
Arson 100 0.69 2.62 -3.09% Totals 12,474 85.74 327.40 -7.82%
Source: Portland Police Bureau Crimes in Gateway (0.93 square miles, 1996 population est. 4,092)
Crime Incidents Per 1,000 Residents
Per sq. mile Pct. Change 1996-1999
Murder 0 0 0 0 Rape 5 1.22 5.38 0.00% Robbery 67 16.37 72.04 -91.43% Aggravated Assault
72 17.60 77.42 -18.03%
Burglary 83 20.28 89.25 14.43% Larceny 860 210.17 924.73 3.37% Motor Vehicle Theft
248 60.61 266.67 -60.00%
Arson 7 1.71 7.53 12.50% Totals 1,342 327.96 1443.01 -7.10%
Source: Portland Police Bureau

Gateway Regional Center Report to Metro
January 2005 32
Crime rates per capita and per square mile are significantly higher in Gateway than in East Portland and the city. Also notable is that while the incidence of burglary and larceny in the city declined by more than 15 percent from 1996 to 1999, reports of both burglary and larceny in Gateway rose during that same time period. The number of robberies and motor vehicle thefts during that time span, however, declined by a higher percentage in Gateway than in the city. Crime prevention specialists at the East Portland Neighborhood Office provided a more qualitative analysis of crime in Gateway. According to the specialists, the most frequent types of crimes in Gateway are: • car break-ins, especially in and around large surface parking lots at Mall 205, Gateway
Transit Center and Adventist Hospital • property thefts from lawns, sheds, and apartment-complex mailboxes • drug activity along NE 102nd and along E. Burnside • fights, drunk-and-disorderly conduct, and drug-related problems resulting in police calls
emanating mostly from several poorly maintained apartment complexes along 102nd and other housing near the freeway
According to East Portland office specialists, what underpins Gateway’s crime problems is its jumble of land uses – especially west of NE 102nd – which hinders a sense of community and connectivity among residents. Apartment complexes are cut off from other residential areas, and single-family homes are interspersed among light industrial uses that are incompatible with neighborhood uses and are inactive at night. The low level of on-street activity (e.g. people walking or spending time outside), especially during the evening hours, welcomes criminal activity. Fire and Emergency Services Activity There is no fire station located within the Gateway Regional Center. The three nearby stations shown below respond to calls in Gateway. Fire and Emergency Stations Serving Gateway
Station Address Year Built Units Square Footage No. 19 7301 E. Burnside 1953 Engine 5,676 No. 41
1500 SE 122nd 1975; retrofitted 2001
Ladder Truck, Engine, Rescue,
HazMat
10,090
No. 43 13313 NE San Rafael
1958 Engine 4,628
Source: Seismic Rehabilitation Plan – Phase III Report, Bureau of Fire, Rescue & Emergency Services, 1998 A “Fire Station Location and Resource Deployment Study” conducted in December 1997 by TriData Corporation concluded that Portland “is well served by its current fire stations and resource deployment.” It did not recommend any service changes for the three stations that serve Gateway. In FY 94-95, response times for the three stations serving Gateway were between five and six minutes. Response times for the three stations during several stretches during 1996, 1997 and 1998 ranged between four-and-a-half and five minutes. During the same time period, citywide average response time ranged between four and five minutes.

Gateway Regional Center Report to Metro
January 2005 33
In terms of physical infrastructure, the three Gateway stations were among 22 identified in 1998 as in need of seismic and functionality upgrades. Renovation of Station 41, whose fire management area includes the study area south of Glisan, was completed in 2001. Stations 19 and 43 are scheduled to close for renovations for six-month periods in 2004 and 2005, respectively. Stations No. 19 and No. 41 are traditionally among the busiest ten of Portland's 27 stations. Data from the Portland Bureau of Fire, Rescue, and Emergency Services indicate a total of 987 responses to calls in the study area between July 1, 1999, and June 30, 2000, the city's fiscal year. As shown in Table 2.13.2, more than half of the responses were to emergency medical calls, followed in prevalence by “good intent calls” – mistaken alarms originating from citizens with good intentions – which were not otherwise classified. Fire, Rescue, and Emergency Responses*
Situation Found # of Responses
% of All Responses
Emergency Medical Call 558 56.5% Good Intent Call 101 10.2% Fire** 41 4.2% Total 987 100.0%
*Select categories shown **Fire includes responses to structure, brush, refuse and other fires. Source: Portland Bureau of Fire, Rescue & Emergency Services Cultural Amenities, Attractions, Activities and Events • The Gateway Regional Center’s attractions might be considered to be its large retail sites
(Fred Meyer/Mervyn’s and Mall 205), the Adventist Medical Center, and the East Portland Community Center. Each of these attracts people for different reasons.
• Fun-O-Rama, a district fair sponsored by the Gateway Area Business Association, is held in May
• Numerous activities are held at the East Portland Community Center • IRCO, the Immigrant and Refugee Community Organization on Glisan just east of 102nd
conducts many workshops and sessions for this expanding population Analysis of the Organization of Civic Uses and Spaces Civic uses are concentrated along SE 106th south of Stark. These include the East Portland Community Center and the East Police Precinct. The Opportunity Gateway Concept envisioned a new civic center along Burnside near the Burnside/102nd LRT station. Another option informally discussed has been the possibility of locating an educational institution near the intersection of 99th and Pacific. This could include an urban horticultural center which utilizes currently unused ODOT properties north of the transit center between I-205 and I-84 as an experimental urban nursery.

Gateway Regional Center Report to Metro
January 2005 34
Policy and Regulatory Framework Relevant Portland Comprehensive Plan Policies Policy 2.11, Commercial Centers Expand the role of major established commercial centers which are well served by transit. Strengthen these centers with retail, office, service and labor-intensive industrial activities which are compatible with the surrounding area. Encourage the retention of existing medium- to high-density apartment zoning adjacent to these centers. Policy 2.12, Transit Corridors Provide a mixture of activities along major transit routes and main streets to support the use of transit. Encourage development of commercial uses and allow labor-intensive industrial activities which are compatible with the surrounding area. Increase residential densities on residentially-zoned lands within ¼-mile of existing and planned transit routes to transit-supportive levels. Require development along transit routes to relate to the transit line and pedestrians and to provide on-site pedestrian connections. Policy 2.15, Living Closer to Work Locate greater residential densities near major employment centers, including Metro-designated regional and town centers, to reduce vehicle miles traveled per capita and maintain air quality. Locate affordable housing close to employment centers. Policy 2.17, Transit Stations and Transit Centers Encourage transit-oriented development patterns at light rail transit stations and at transit centers to provide for easy access to transit service. Establish minimum residential densities on residentially-zoned lands within one-half mile of light rail transit stations and one-quarter mile of transit centers that support the use of transit. The design and mix of land uses surrounding the light rail transit stations and transit centers should emphasize a pedestrian- and bicycle-oriented environment and support transit use. Policy 2.18, Transit Supportive Density Establish average minimum residential densities of 15 units per acre within ¼-mile of existing and planned transit streets and transit centers, 25 units per acre within one-half mile of light rail stations and regional centers. Establish minimum floor area ratios for non-residential development at light rail centers of 0.5:1. Policy 4.3 Sustainable Housing Encourage housing that supports sustainable development patterns by promoting the efficient use of land, conservation of natural resources, easy access to public transit and other efficient modes of transportation, easy access to services and parks, resource efficient design and construction, and the use of renewable energy resources.
Objective A Place new residential developments at locations that increase potential ridership on the regional transit system and support the Central City as the region’s employment and cultural center. Objective B

Gateway Regional Center Report to Metro
January 2005 35
Establish development patterns that combine residential with other compatible uses in mixed-use areas such as the Central City, Gateway Regional Center, Station Communities, Town Centers, Main Streets, and Corridors.
Policy 4.7, Balanced Communities Strive for livable mixed-income neighborhoods throughout Portland that collectively reflect the diversity of housing types, tenures (rental and ownership) and income levels of the region.
Objective A Achieve a distribution of household incomes similar to the distribution of household incomes found citywide, in the Central City, Gateway Regional Center, in town centers, and in large redevelopment projects.
Policy 5.4, Transportation System Promote a multi-modal regional transportation system that encourages economic development.
Objective C Work closely with public agencies, such as TriMet, and the private sector to deliver an efficient and effective transportation system and network. Improve transit connections between residential communities and work sites. Objective D Support transit-supportive development and redevelopment along designated transit streets and in the vicinity of light rail stations.
Policy 6.17, Coordinate Land Use and Transportation Implement the Comprehensive Plan Map and the 2040 Growth Concept through long-range transportation and land use planning and the development of efficient and effective transportation projects and programs. Policy 6.19, Transit-Oriented Development Reinforce the link between transit and land use by encouraging transit-oriented development and supporting increased residential and employment densities along transit streets, at existing and planned light rail transit stations, and at other major activity centers. Policy 6.20, Connectivity Support development of an interconnected, multimodal transportation system to serve mixed-use areas, residential neighborhoods, and other activity centers. Policy 6.22, Pedestrian Transportation Plan and complete a pedestrian network that increases the opportunities for walking to shopping and services, schools and parks, employment, and transit.
Objective A Promote walking as the mode of choice for short trips by giving priority to the completion of the pedestrian network that serves Pedestrian Districts, schools, neighborhood shopping, and parks. Objective B Support walking to transit by giving priority to the completion of the pedestrian network that serves transit centers, stations, and stops; providing adequate crossing opportunities at
Gateway Regional Center Report to Metro
January 2005 36
transit stops; and planning and designing pedestrian improvements that allow adequate space for transit stop facilities.
Policy 6.23, Bicycle Transportation Make the bicycle an integral part of daily life in Portland, particularly for trips of less than five miles, by implementing a bicycle network, providing end-of-trip facilities, improving bicycle/transit integration, encouraging bicycle use, and making bicycling safer.
Objective A Complete a network of bikeways that serves bicyclists' needs, especially for travel to employment centers, commercial districts, transit stations, institutions, and recreational destinations. Objective E Provide short-term and/or long-term bicycle parking in commercial districts, along main streets, in employment centers and multifamily developments, at schools and colleges, in industrial developments, at special events, in recreational areas, at transit facilities such as light rail stations and park-and-ride lots, and at intermodal passenger stations.
Policy 6.24, Public Transportation Develop a public transportation system that conveniently serves City residents and workers 24 hours a day, seven days a week and can become the preferred form of travel to major destinations, including the Central City, regional and town centers, main streets, and station communities.
Objective A Support light rail transit and bus connections as the foundation of the regional transit system, with completion of the system to connect all regional centers, downtown Vancouver, major attractions, and intermodal passenger facilities as a high priority for the region.
Policy 6.25, Parking Management Manage the parking supply to achieve transportation policy objectives for neighborhood and business district vitality, auto trip reduction, and improved air quality. Policy 6.26, On-Street Parking Management Manage the supply, operations, and demand for parking and loading in the public right-of-way to encourage economic vitality, safety for all modes, and livability of residential neighborhoods.
Objective A Support land uses in existing and emerging regional centers, town centers, and main streets with an adequate supply of on-street parking.
Policy 6.27, Off-Street Parking Regulate off-street parking to promote good urban form and the vitality of commercial and employment areas.
Objective A Consider eliminating requirements for off-street parking in areas of the City where there is existing or planned high-quality transit service and good pedestrian and bicycle access.
Gateway Regional Center Report to Metro
January 2005 37
Objective B Encourage the redevelopment of surface parking lots into transit-supportive uses or development or to include facilities for alternatives to the automobile. Objective C Limit the development of new parking spaces to achieve land use, transportation, and environmental objectives.
Goal 11B, Public Rights-of-Way Improve the quality of Portland’s transportation system by carrying out projects to implement the 2040 Growth Concept, preserving public rights-of-way, implementing street plans, continuing high-quality maintenance and improvement programs, and allocating limited resources to identified needs of neighborhoods, commerce, and industry. Policy 11.11, Street Plans Promote a logical, direct, and connected street system through the development of street plans. Policy 12.7, Design Quality Enhance Portland’s appearance and character through development of public and private projects that are models of innovation and leadership in the design of the built environment.
Objective D Consider the application of the design review requirement to parts of Portland expected to experience significant change.
Outer Southeast Community Plan: The Outer Southeast Community Plan was adopted into the Portland Comprehensive Plan by City Council on January 31, 1996. Subarea Policy IV, Gateway Regional Center Foster the development of this area as a “Regional Center,” attracting intense commercial and high-density residential development capable of serving several hundred thousand people, and promoting an attractive urban environment by creating better pedestrian connections and providing more public open space. Objective 1 Promote more intense development, including office buildings, civic and cultural facilities, and hotels, in the Gateway and Mall 205 shopping districts. Objective 2 Provide an infrastructure that is supportive of high-intensity development for living, working, and recreating. Objective 3 Provide a pleasant and diverse pedestrian experience by providing connecting walkways within a structure to adjacent sidewalks areas.

Gateway Regional Center Report to Metro
January 2005 38
Objective 4 Strive for a 200’ by 400’ foot street grid pattern throughout the district, and surround each block with sidewalks, street trees, and on-street parking, except where it would interfere with the efficient operation of MAX. Objective 5 Create a sidewalk environment which is safe, convenient, and attractive, and enlivening the environment, creating vitality and interest, with building walls with windows and display windows. Objective 6 Discourage surface parking lots. Objective 7 Address the area’s park deficiency by developing park blocks from north of Pacific Street to south of Start Street between 99th and 100th Avenues, and marking each end of the park blocks with dramatic focal points such as an arch, fountain, or other art form. Objective 8 Zone the Prunedale industrial area to allow a wider rage of uses which generate jobs, and ensuring that development is compatible with the surrounding area. Objective 9 Stimulate high-density residential development throughout the Gateway subdistrict. Principles, Goals, and Objectives of the Gateway Regional Center Urban Renewal Plan Standing Principle: Establish the Gateway Regional Center 1. Utilize informed public participation
Goals: a. Inclusivity b. Education c. Leadership d. Accountability
2. Optimize investment in the center
Goals: a. Community investment b. Strategic public investment c. Policy-supportive private investment d. Stability and sustainability
3. Establish a distinctive identity
Goals: a. Unity and cohesiveness b. Attractive appearance/thoughtful
design
6. Create a mixture of public spaces Goals: a. Parks and plazas b. Rights-of-way c. Recreation d. Public buildings
7. Establish a pedestrian orientation
Goals: a. Safety b. Destinations c. Amenities d. Visual interest
8. Expand and improve travel options
Goals: a. Street grid b. Facilitate non-auto trips c. Transit improvements

Gateway Regional Center Report to Metro
January 2005 39
c. Mitigation of visual blight d. High-visibility projects
4. Support compact development
Goals: a. Respect adjacent neighborhoods b. Efficient land use c. Station area focus
5. Support a mixture of land uses
Goals: a. Within the center b. Within development projects
d. Traffic management 9. Expand and improve housing options
Goals: a. Housing diversity b. Balanced communities c. Housing compatibility and quality d. Develop a Housing Strategy
10. Enhance economic opportunities
Goals: a. Support small local businesses b. Employment center c. Family-wage jobs d. Complement I-205 development

Gateway Regional Center Report to Metro
January 2005 40
Urban Renewal Housing Goals 1. The Gateway URA will include an adequate supply of housing that is available and
affordable to people of all income levels. 2. Housing in the Gateway area will include housing of diverse types, sizes, and styles to
accommodate the range of needs of current and future District residents. 3. Housing in the Gateway area will increase livability of the entire District by incorporating
quality design, materials, and techniques that enhance existing development and achieve the vision for a regional center.
4. Development in the Gateway area will encourage housing options for homeownership for a
range of households and incomes. 5. The Gateway URA will support job growth by providing housing opportunities for employees
working within the District and surrounding areas.

Gateway Regional Center Report to Metro
January 2005 41
Urban Design Opportunity Gateway Concept Plan Map 4 shows the concept plan that was approved by City Council in 2000. It suggests one possible 20-year scenario, with a concentration on transportation infrastructure, open space, and four subareas. Though the plan provides more detail than necessary on individual properties, this concept was used extensively during Gateway’s early years in getting initial projects off the ground.
Map 4 Opportunity Gateway Concept Plan

Gateway Regional Center Report to Metro
January 2005 42
Urban Design Concept The Gateway urban design concept adopted in May 2004, shown in Map 5, updates the Opportunity Gateway Concept Plan. It identifies a future for Gateway as an urban and prosperous regional center to be obtained by developing and enhancing the following three elements: • A hierarchy of streets • An urban system of parks and open spaces • Focusing density Map 5 Gateway Urban Design Concept

Gateway Regional Center Report to Metro
January 2005 43
Zoning and Comprehensive Plan Designations The regional center contains the highest-density zoning designations in the city – Central Commercial (CX), Central Residential (RX), and Central Employment (EX). With the exception of Floyd Light Middle School, which is zoned R5 with a Comprehensive Plan designation of R1, and a single property at the edge of the regional center zoned R7, Gateway is zoned exclusively for commercial, employment, institutional, and multifamily residential uses.
Zoning Designations Zone Square Feet Acres % Parcels CX 9,284,987.5 213.15 33.0IR 3,613,331.5 82.95 12.9R1 3,512,212.6 80.63 12.4OS 3,082,559.1 70.77 11RX 2,359,541.8 54.17 8.4EX 2,084,052.5 47.84 7.4CS 913,137.1 20.96 3.3RH 926,309.0 21.27 3.3
CO2 704,219.4 16.17 2.5R2 602,630.4 13.83 2.1R5 560,435.1 12.87 2CM 154,434.9 3.55 .6R3 152,911.3 3.51 .54
CN2 84,094.2 1.93 .3CO1 83,715.2 1.92 .3R7 6,061 .14 0
Total 645.65 100 Zoning and Comprehensive Plan designations are identical with the exception of two properties. The Portland Adventist Academy site (19.21 acres) has a Comprehensive Plan designation of RX. The Floyd Light Middle School (approximately 9 acres) has a Comprehensive Plan designation of R1. Relevant Zoning Code Provisions On May 19, 2004, the Portland City Council adopted new regulations for the Gateway Regional Center. These included revisions to the Gateway Plan District, design review, and several other zoning code provisions. The following are the most important provisions that will move Gateway toward a more compact, mixed-use, pedestrian-friendly regional center. Prohibited Uses and Development: In the Portland Zoning Code, a use or development that is prohibited cannot be established at all. Uses that were established legally and are now prohibited may remain but may expand only under certain circumstances. The following uses and developments are prohibited in the regional center. • Vehicle repair, quick vehicle servicing, commercial parking, and self-service storage • Sale or lease of consumer vehicles within 200’ of light rail. Offices for vehicular sales or
leasing where the vehicles are stored elsewhere are allowed. • Exterior display and storage, except for outdoor seating for restaurants and pedestrian-
oriented accessory uses, temporary open-air markets, and carnivals. • Drive-through facilities.

Gateway Regional Center Report to Metro
January 2005 44
Retail Sales and Service Uses: The provisions allow more retail sales and service uses in some areas and restrict them in other locations as follows: • On sites in the Central Employment (EX) zone, such uses are allowed up to 5,000 square
feet for each use. • On portions of sites zoned Institutional Residential (IR) within 1000 feet of the proposed
Main Street light rail station, such uses are allowed only up to 10,000 square feet per use. • On all sites in the Central Residential (RX) zone, 40 percent of the net building area can be
in such uses. In addition, on the portion of a site within ¼ of a transit station, up to 50 percent of the net building area may be in such uses.
Building Height • Building height ranges between 75 – 150 feet. • In certain locations (around light rail stations) and under certain circumstances (use of the
master plan option), height could go up an additional 75 feet depending on which bonus option(s) are used.
• Along the edge of the regional center, there is a “step-down” or transition in height to the single-dwelling neighborhoods outside the regional center.
Floor Area Ratios (FAR) • FARs range from 3:1 for non-residential and 5:1 for residential to 8:1 for all uses. • Minimum FARs range from 0.5:1 in some locations to 1.5:1 around light rail stations. • Increases in FAR through bonus options or transfers are limited to 3:1. Bonus Options: Floor area and height bonuses are available for providing three things: additional housing, additional open space, and an eco-roof. The amount of the bonus is determined by the amount of the amenity provided. Extra height is also allowed. Because the allowable height and floor area is already quite high, the City does not anticipate that the bonus options will be used until property values rise high enough to take advantage of this provision. Open area: At least 0.5 square foot of open area is required for each square foot of floor area proposed for the site, up to a maximum requirement of 15 percent of the site area. Adjustments are prohibited. In addition to providing open area on-site, applicants have the option of locating the open area off-site or paying into an open area fund. The latter, to be administered by Portland Parks and Recreation, can only be used for open areas within the Gateway plan district. Connectivity: There are two main connectivity provisions: 1) new development will be required to provide streets and accessways as determined by the City Engineer to be consistent with the master street plan (shown on Map 3); and 2) new site improvements are not allowed to obstruct street alignments shown in the master street plan. The City Engineer has the ability to require rights-of-way to be reserved, dedicated, or dedicated and improved to City standards when a building permit is issued or a land use decision made.

Gateway Regional Center Report to Metro
January 2005 45
Pedestrian- and Transit-Friendly Standards: Map 6, below, identifies streets designated as Enhanced Pedestrian Streets:
Map 6 Enhanced Pedestrian Streets The following provisions should ensure that sidewalks in the regional center are convenient, active, pleasant environments with pedestrian amenities: Along the Enhanced Pedestrian Streets: • The area between a building or exterior improvement and a street lot line must be hard-
surfaced and developed for use by pedestrians. Amenities could be such things as benches, trees, drinking fountains, planters, and kiosks.
• Exterior walls of buildings must be at least 15 feet high and either extend to the street lot line along at least 75 percent of the lot line or within 12 feet of the street lot line for 75 percent of the lot line, with the space between the building and the street lot line designed as an extension of the sidewalk.
• Buildings must be designed to accommodate active uses such as lobbies, retail, office, or commercial uses.
Along All Streets: • There must be improvements between buildings and the street, whether landscaping or
hard-surfaced.

Gateway Regional Center Report to Metro
January 2005 46
• At least one main entrance into a building and each tenant space in a building that faces a street must be oriented to public streets or the light rail alignment.
• All exterior walls on the ground level must provide ground floor windows. Master Plan Option: The master plan is a tool that can help combine regulation, design, bonuses, and financial tools to implement the Gateway Regional Center development strategy. Deliberations about development schemes become an opportunity for City staff and developers to jointly consider the best combination of plan, regulation, and urban renewal involvement to accomplish public and private purposes. There is potentially an opportunity to leverage public dollars on behalf of progressive, exciting new development. In exchange for a degree of flexibility in the application of zoning standards, applicants prepare site development plans that would be reviewed on the basis of an explicit list of criteria. Any property owner or combination of property owners can utilize the master plan provision. There is no site size minimum nor maximum. Preparation of a master plan does not eliminate the need to meet code requirements, but it does offer the flexibility of phasing, deferral, and reallocation of required floor area on a site, independent of zoning. Parking: After the Central City, Gateway has the most restrictive parking ratios in Portland. This low parking ratio is a critical policy for promoting transit and accomplishing the level of transit-supportive development desired in Gateway. The area is already a transit-rich regional center, but with the addition of a third light rail line, it will be even more so. The two exceptions are medical/dental offices and general offices. Medical/dental offices are documented to need more parking. Gateway has a concentration of medical/dental offices and medical/dental employment. The parking ratio for medical/dental offices is 4.9/1000 sq. ft., whether the parking is in a surface lot or a structured garage. Exempting structured parking from parking maximums in Gateway is consistent with Metro’s Regional Parking Policy, Title 2 in the Urban Growth Management Functional Plan, which exempts parking spaces in parking structures from maximum parking standards. Studies prepared by the Oregon Department of Environmental Quality (DEQ) and Metro have shown that 3.4 spaces /1000 sq. ft. generally provides a parking space for every employee. The parking ratio for general office parking is 3.4 spaces/1000 sq. ft. but only if all the spaces are in a parking structure. Design Review: As densities in the regional center rise and public and private investments grow, there will be increasing pressure for buildings to be of a higher design quality. Property owners and developers want to ensure that the care and quality going into their designs will be reflected in each subsequent project, contributing to the long-term value of Gateway’s overall transformation. To achieve the desired high level of design quality, all properties within the regional center have been given the design overlay zone. Therefore, all proposals in the Gateway Regional Center be subject to either Type II or Type III design review. The Gateway Regional Center Design Guidelines will be the criteria used in the design review process. Design Guidelines: The design review process in the Gateway Regional Center will vary with the type, size, and location of the proposal. Most proposals will initially be reviewed by staff in a process that generally takes less than two months (Type II procedure). Other proposals, in certain locations or over certain thresholds, will be reviewed at a public hearing in a process of about three to four months (Type III procedure). Owners of nearby property will be notified and testimony from individuals, organizations, and neighborhood associations will be taken. There are 16 design guidelines that must be met: • Strengthen the relationships between buildings and the street • Enhance visual and physical connections

Gateway Regional Center Report to Metro
January 2005 47
• Integrate building mechanical equipment and service areas • Convey design quality and building permanence • Integrate ground-level building elements • Design for coherency • Integrate encroachments • Integrate roofs, rooftop lighting, and signs • Integrate ecological/sustainable concepts • Provide opportunities for active uses at major street intersections • Enhance gateway locations • Support open spaces with new development • Develop complementary parking areas • Transition to adjacent neighborhoods • Build on view opportunities • Strengthen the regional center’s western edge

Gateway Regional Center Report to Metro
January 2005 48
Assets, Barriers/Challenges, and Opportunities Metro has designated seven regional centers for the tri-county area of Multnomah, Washington, and Clackamas Counties. Unlike other Metro-designated regional centers, Gateway was developed with a variety of sub-regional community, neighborhood, and associated commercial strip centers in the early suburban motif. An important challenge uniquely posed for Gateway is whether this aging suburban prototype can be transformed over time into a truly urban, high-density, mixed-use, and vibrant retail experience. Based on Metro’s regional center designation, it would appear that Gateway could evolve either toward securing a role as a true regional retail and service center or toward that of a smaller-scale, more traditional small city downtown – or possibly some combination thereof. Map 7, below, graphically identifies Gateway’s challenges, opportunities, and subareas.
Map 7 Challenges, Opportunities, and Subareas

Gateway Regional Center Report to Metro
January 2005 49
Assets Transportation • Junction of two freeways: I-84 and I-205 • Junction of two light rail lines: Hillsboro to Gresham; Beaverton to Airport • Planned third light rail line to Clackamas Regional Center • Twelve bus lines Commercial: Economically successful retail center. Medical/Dental: Concentration of medical and dental facilities, including Adventist Medical Center, Providence Health Center, Oregon College of Oriental Medicine, and numerous offices and clinics. Committed Citizenry: Since 1996 residents, property and business owners, and adjacent stakeholders have met almost monthly with technical staff and local governing body representatives – the Program Advisory Committee (PAC) – to chart the direction of Gateway’s future. There has not been unanimous agreement on everything, but by talking out different points of view and options, decisions have been made that are acceptable to most people. Location Near Airport: Gateway is approximately 5 miles from Portland International Airport, which is easily accessed either from I-205 or by light rail. Designation as an Urban Renewal Area: The Portland City Council designated Gateway as an urban renewal area in June 2001. Mixture of Uses: Interspersed among the shopping centers, medical office buildings, and small businesses are single-family homes that predate the commercial development, and a collection of apartment buildings built in the 1960s and 70s. Newer apartments began to appear in the late 1990s, filling in some vacant lots and underutilized sites in the center. Gateway is no longer just an employment center. It has been discovered as a convenient location for new housing. Job Assets: • Access to a labor force that includes most of the Portland metro area on the Willamette
River’s east side. Among employed residents who live in the Gateway area, 87 percent work within 30 minutes of home – slightly above Multnomah County levels.
• Proximity to substantial industrial presence with good-paying industrial and related jobs in the Columbia Corridor just north of Gateway.
• Service sector jobs in abundance south of Burnside, creating a good commercial support base and providing access to a skilled labor force to grow businesses.
• Opportunity as a Metro-designated regional center to provide for new development that is oriented to better paid service sector employment. Business and professional service jobs have been underrepresented in the East Portland area and throughout East Multnomah County.
By Subarea Subarea 1: Halsey/Weidler Corridor • Historically Gateway’s main commercial streets, with many thriving businesses

Gateway Regional Center Report to Metro
January 2005 50
• Predominant pedestrian-orientation with building placement at street edge and on-street parking
• Outstanding visibility and accessibility provided by high traffic volumes – tremendous potential for continued successful retail and neighborhood-serving uses
Subarea 2: Gateway Station • Major portal to multiple destinations in the city and region • Development parcel adjacent to the Gateway transit center in public ownership providing a
highly-visible, precedent-setting, and potentially catalytic development opportunity • Close proximity to Fred Meyer grocery store significant for dense new development • Strategic implementation of new open space(s) and street enhancements that could
catalyze redevelopment Subarea 3: 102nd and Burnside • Burnside has lower traffic volumes and vehicle speeds • Publicly-owned parcel adjacent to 102nd/Burnside station a catalytic/organizing opportunity • Creation of new open space(s) and street enhancements that could catalyze redevelopment • Good access to transit at 102nd/Burnside station from new development to north and south Subarea 4: Southern Triangle • Close proximity to Mall 205 home improvement stores (Home Depot and Target), as well as
the Adventist Medical Center, its associated medical facilities and senior housing • The Portland Adventist Academy adjacent to the proposed light rail transit station at 96th and
Main, a potential redevelopment site • Proximity to concentration of civic buildings along 106th, existing open space at Floyd Light
Middle School and the East Portland Community Center Barriers/Challenges The defining challenge for the Gateway Regional Center is the growing disparity between the area’s attractiveness as a location for thousands of new housing units and jobs, and its existing inefficient land use and transportation patterns. The Gateway Urban Design Concept offers a framework for reconciling this tension. The Urban Design Concept describes a regional center that is respectful of public policy and existing conditions, local preferences and regional responsibilities, visionary dreams, and market realities. Transportation: The transportation system is problematic relative to the district’s usefulness as a regional center. Although the area is easy to get to, motorists, bicyclists, and pedestrians are regularly confronted with frustrating and unsafe situations within the Regional Center. The local street system, which was established four decades ago, is incomplete and unimproved in places. Yet Gateway’s streets are heavily used because they provide direct access to interstate freeways, light rail, and commercial and employment centers. Large tracts of land occupied by “big box” retailers, malls, small industrial and utility operations and storage yards prohibit efficient travel patterns in the area. Like many older suburban districts, Gateway’s private and public land uses are predominantly auto-dependent. Large public streets deliver motorists to large private parking lots. Many of the center’s primary intersections are the domain of car dealerships and gas stations. Buildings and businesses face parking lots rather than public streets or sidewalks. There are few bicyclists
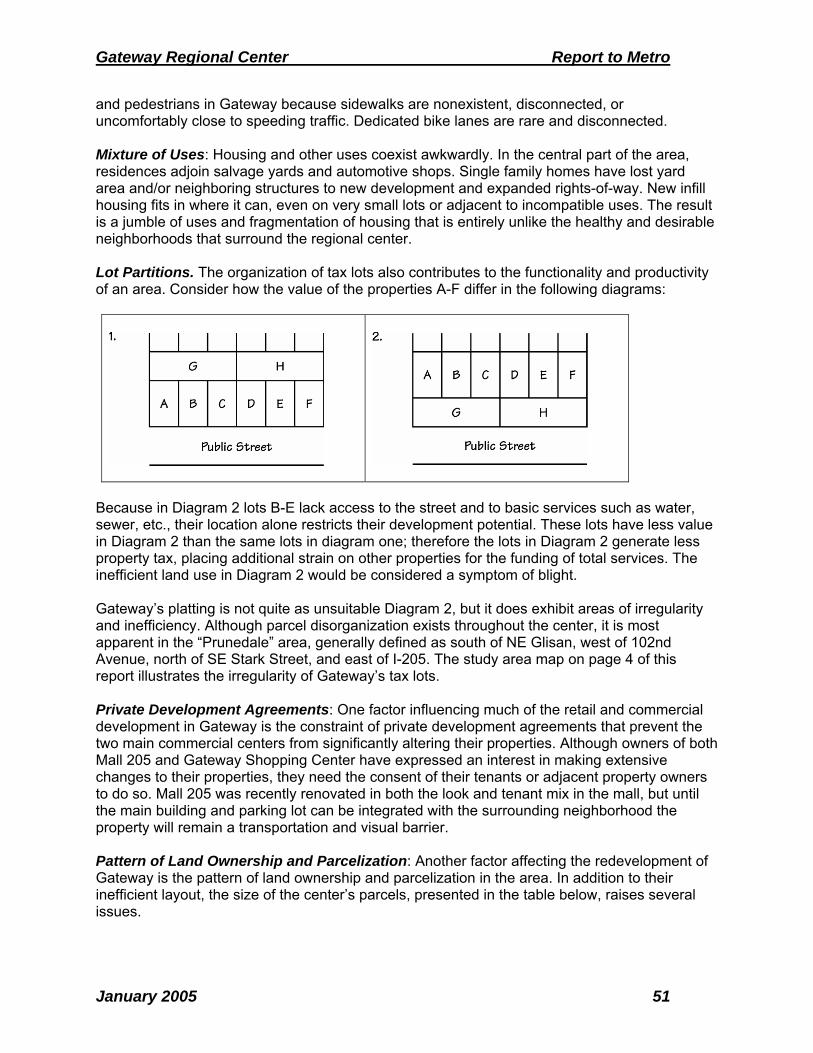
Gateway Regional Center Report to Metro
January 2005 51
and pedestrians in Gateway because sidewalks are nonexistent, disconnected, or uncomfortably close to speeding traffic. Dedicated bike lanes are rare and disconnected. Mixture of Uses: Housing and other uses coexist awkwardly. In the central part of the area, residences adjoin salvage yards and automotive shops. Single family homes have lost yard area and/or neighboring structures to new development and expanded rights-of-way. New infill housing fits in where it can, even on very small lots or adjacent to incompatible uses. The result is a jumble of uses and fragmentation of housing that is entirely unlike the healthy and desirable neighborhoods that surround the regional center. Lot Partitions. The organization of tax lots also contributes to the functionality and productivity of an area. Consider how the value of the properties A-F differ in the following diagrams:
Because in Diagram 2 lots B-E lack access to the street and to basic services such as water, sewer, etc., their location alone restricts their development potential. These lots have less value in Diagram 2 than the same lots in diagram one; therefore the lots in Diagram 2 generate less property tax, placing additional strain on other properties for the funding of total services. The inefficient land use in Diagram 2 would be considered a symptom of blight. Gateway’s platting is not quite as unsuitable Diagram 2, but it does exhibit areas of irregularity and inefficiency. Although parcel disorganization exists throughout the center, it is most apparent in the “Prunedale” area, generally defined as south of NE Glisan, west of 102nd Avenue, north of SE Stark Street, and east of I-205. The study area map on page 4 of this report illustrates the irregularity of Gateway’s tax lots. Private Development Agreements: One factor influencing much of the retail and commercial development in Gateway is the constraint of private development agreements that prevent the two main commercial centers from significantly altering their properties. Although owners of both Mall 205 and Gateway Shopping Center have expressed an interest in making extensive changes to their properties, they need the consent of their tenants or adjacent property owners to do so. Mall 205 was recently renovated in both the look and tenant mix in the mall, but until the main building and parking lot can be integrated with the surrounding neighborhood the property will remain a transportation and visual barrier. Pattern of Land Ownership and Parcelization: Another factor affecting the redevelopment of Gateway is the pattern of land ownership and parcelization in the area. In addition to their inefficient layout, the size of the center’s parcels, presented in the table below, raises several issues.

Gateway Regional Center Report to Metro
January 2005 52
Parcel Size Land Use Average Acreage Average SF
Tax Exempt 3.86 168,307Commercial 0.82 35,793Multifamily 0.52 22,499Industrial 0.29 12,733Vacant 0.25 10,860Single Family 0.22 9,584
Source: 2000 RLIS Data, Metro First, the small size of industrial parcels puts the long-term viability of such uses in the center at risk. Expansion onto nearby sites may prove difficult if there are multiple ownerships. Rising land values might make these small-scale businesses increasingly attractive for acquisition and redevelopment. A similar situation could occur for non-conforming single-family residential uses, because their zoning encourages replacement with multifamily development. Secondly, the average size of Gateway’s parcels is relatively small, indicating an extensive fragmentation of property ownership. This may hinder the development potential of these parcels because owners looking to expand their businesses or developers looking for suitably sized redevelopment sites in Gateway must: 1) convince different owners with different motivations to sell their properties at a fair price, and 2) pay additional costs for increased demolition and/or improvement requirements. This condition is frequently addressed through urban renewal programs. The urban renewal agency’s strategic acquisition of multiple adjacent sites or buildings is sometimes referred to as “site assembly.” It would be an appropriate urban renewal activity in Gateway given the center’s existing fragmentation of property ownership. Desirable office, commercial, and residential development in the zones in the regional center requires the availability of large or easily assembled redevelopment sites. Attractive and exciting projects that include public benefits such as higher architectural quality or structured parking require a higher return on investment to offset construction costs. The smaller parcels currently scattered throughout the regional center may be relatively inexpensive compared to commercial property prices in the metropolitan area, but they will not support higher-quality projects because they do not provide enough square footage to rent. This situation hampers the expansion of Gateway’s residential, employment and retail base and could ultimately jeopardize the comprehensive vision for the Gateway Regional Center. CascadeStation/Portland International Center (PIC): Gateway’s market conditions and redevelopment potential could be significantly impacted by the 120-acre CascadeStation/PIC development. Early market studies for Gateway were predicated on a significant office development at CascadeStation/PIC. To date, there has been no impact because nothing has occurred, and the anticipated 10,000 employees have not materialized. The Airport MAX light rail line opened just as the 911 tragedy struck. Between the implications from the 911 attack and the market bust, Gateway has not been able to take advantage of its highly convenient location to access the approximately 7,500 daily travelers and 30,000 airport employees. While the CascadeStation/PIC project is a changing target, it is still possible that Gateway could tap into possible housing for CascadeStation/PIC-area employees, since housing will not be a component of any development, no matter what configuration is ultimately approved.

Gateway Regional Center Report to Metro
January 2005 53
By Subarea Subarea 1: Halsey/Weidler Corridor • Many surface parking areas between building and sidewalk • Primarily low-density, single-use buildings • Many buildings in need of repair or restoration • High traffic volumes and vehicle speeds along couplet • Lacks open space or parks Subarea 2: Gateway Station • Surface park-and-ride lot adjacent to Gateway transit center • Impacts of the I-205 Freeway along western edge • Significant amount of surface parking • Concern that potential gentrification will force out low-income residents • Lacks open space or parks Subarea 3: 102nd and Burnside • Impacts of the I-205 Freeway along western edge • Lacks open space or parks • Configuration of light rail infrastructure (rails and track beds) a barrier to pedestrian
crossings • Prevalence of small lot sizes, making parcel consolidation difficult • Lack of street connectivity here as well as area north of Burnside Subarea 4: Southern Triangle • Significant amount of surface parking • Mall 205 recently renovated with few connections to surrounding neighborhoods • Adventist Medical Center, Mall 205, and civic facilities on 106th separated from each other • Impacts of the I-205 Freeway along western edge • High traffic volumes and vehicle speeds along Stark/Washington couplet at northern edge Opportunities The Gateway Regional Center’s location, access, and relatively inexpensive land offer substantial redevelopment opportunities. Specifically, its proximity to major auto, transit, and air routes, and its increasing population and income levels all favor private investment in new development. Opportunity Sites: Opportunity sites are identified in the regional center around existing and proposed light rail stations and at some gateway locations. Some of these sites are in public ownership and/or control, and all offer designers and developers the ability to explore innovative design solutions that add to Gateway’s identity as a place. Possible Building Blocks: Recent/Scheduled Infrastructure and Public Facility Improvements: The following are in progress, are recently completed, or have had funds committed:
• East Portland Community Center Swimming pool: Construction is scheduled to start around November 2006, with the grand opening around January 2008.

Gateway Regional Center Report to Metro
January 2005 54
• Transfer of TriMet-owned property to the Portland Development Commission to be used for new development project(s). The Commission recently approved a three-story medical project to be built by Gerding/Edlen, with the option of an additional six stories in the future. Immediately adjacent to this project, TriMet has agreed to build a several-story park-and-ride structure.
• 102nd Ave Street Improvement: This project will provide urban streetscape treatments on 102nd Ave. from NE Weidler St. to SE Washington Street. The project will include widening existing sidewalks, planting new street trees, pedestrian-scale lighting and several new pedestrian crossings with median refuge islands. The project is funded by regionally allocated federal transportation funds. Construction is expected in late 2005/early 2006.
• 99th and Glisan Intersection: This project realigned the south leg of the NE 99th and NE Glisan intersection to match the north leg and installed a new traffic signal. The project also added wider sidewalks and bike lanes through the intersection, improved the safety and operation of the intersection, and reduced traffic congestion on NE Glisan Street.

Gateway Regional Center Report to Metro
January 2005 55
Market Analysis/Market Trends Over the past five years, the Portland Development Commission (PDC) has commissioned or conducted several assessments of the market in the Gateway area. An assessment of market conditions in the Gateway Regional Center was prepared by E.D. Hovee and Company in Fall 2000. This assessment was prepared as part of the work leading to the creation of Gateway as an urban renewal area. Among other things, it included assumptions about development potential at the nearby Cascade Station/Portland International Center (PIC), which is linked to Gateway via MAX. These assumptions have changed somewhat over the past few years. While now somewhat dated, this market assessment still provides a framework for understanding the Housing, Retail, Office, Lodging, and Industrial elements of the Gateway Regional Center. Much of the following market analysis text is taken directly from the E. D. Hovee report. The Study Area upon which this memo was based is somewhat larger than the Gateway Regional Center as currently defined, and includes larger areas of East Portland. More recently, the Portland Development Commission prepared updated market studies. One, Base Data and Trends, was prepared in September 2002 for the Gateway Housing Strategy. The Study Area upon which this report was based contains census tracts east and slightly west of the regional center. Use of the term “Gateway Study Area” in the PDC section refers to this report. Another report was prepared by the Portland Development Commission, but is unpublished at this time. It was developed with and for the Gateway Economic Development Working Group, a subcommittee of the Program Advisory Committee, and, largely uses the urban renewal boundary as the basis for its data. Updates on market conditions based on these post-2000 studies are included following the Hovee findings. There are five categories in this market analysis section: A. Residential Development B. Retail and Related Service Commercial C. Office Development D. Lodging Development E. Industrial Potential

Gateway Regional Center Report to Metro
January 2005 56
A. Residential Development Excerpts from the E.D. Hovee Study The characteristics of the existing study area’s housing market bode well for future development if recent trends persist. Introduction of new residential market activity not previously seen in the Gateway area is continuing with the development of projects such as Russellville Commons and Cherrywood Village. Area demographics are changing and the housing market is shifting. The primary driver for the single-family market is the larger multigenerational family. The most opportune target population for multidwelling may consist of younger, single (or married without children) workers. Another potential market exists with the empty nest/senior population currently in Gateway area single-family housing. Higher density housing with sufficient amenities could allow for them to move out of their single-family detached housing into new low-maintenance units. In this way they would not have to leave the familiar neighborhood and friends. Multifamily Residential Overview The market is shifting toward multifamily and higher density residential development. Land identified as multifamily opportunity sites in the previous study are being developed at a rapid pace. In 2000, Hovee projected that housing demand would utilize the available land inventory much sooner than was expected in previous forecasts. Since then, urban renewal has been adopted for the Gateway area, and changes to zoning and development regulations have increased development capacity in the district Most of the recently developed housing is currently targeted to affordable (60-80% MFI) and senior housing markets, and most also involve some form of public financial support. Incentive mechanisms applied with these projects include transit-oriented development (TOD) tax abatement (available to the entire area), tax exempt bond financing, low income housing tax credits, and PDC loans. Among other things, Hovee found that: • Without public tax and financing incentives, new construction generally requires higher rents
than found in existing housing stock to be financially feasible. On a per square foot basis, construction costs for higher density units (above 20-25 units per acre) are likely to be greater than what has recently been experienced for traditional suburban markets (for any given market segment). This is particularly the case if higher densities are accompanied by tuck-under/structured parking, building elevators, integration of ground floor commercial, and/or a move from wood frame to concrete/steel construction.
• While there are no required parking minimums in the Gateway Plan District, for properties not immediately adjacent to the light rail the market will probably require at least one space per dwelling unit, despite the 1999 construction of 24 condos at 103rd and Clackamas without parking. Based on conversations by PDC with developers, even those by light rail will likely provide parking or be required to do so by lenders.
• The CACI data show that the two largest types of households within a one-mile radius are retirement age persons and young mobile adults – twenty-somethings. There are about two-thirds again as many in the retirement segment as in the twenty-somethings segment.

Gateway Regional Center Report to Metro
January 2005 57
• A variety of senior housing product types may be worth considering. In addition to the care-oriented developments, younger or more-fit retirees may be encouraged to downsize to an upscale condominium, especially where retail and shopping needs are accessible in adjacent pedestrian areas.
Residential Potentials In large measure, opportunities for residential development improvement consistent with the Regional Center vision can be articulated by looking to the experience of other revitalized neighborhoods throughout the Portland area. A successful residential program undoubtedly will need to appeal to a variety of market segments – some already in Gateway and others yet to be captured: • Well-designed, more urban-scale residential could offer improved housing choices for
existing residents – including seniors and those desiring a more diverse mix of housing choices.
• Housing products should appeal to a broader set of mid-/east county market demographics – including younger adults, more upscale residents, and persons making housing choices for proximity to both the Central City and the airport employment opportunities via MAX.
• It likely will be important to deliver a mix of condominium as well as for-rent product to a cost-sensitive market ranging between perhaps 60-120 percent of median household income.
• New single-family housing such as cottage clusters and row houses offer more traditional ownership opportunities. When complemented by connected pedestrian urban amenities, these units provide an attractive alternative for downsizing seniors and working but economy minded twenty-somethings.
• A more balanced range of housing product offers opportunity to increase Gateway area household incomes, supporting amenity improvements as well as stronger commercial retail and service support activities. Much of the success of transit-oriented development will depend on attracting households with a choice of alternative commute modes to choose transit.
• To attain the balanced range of housing products will require making those kinds of developments attractive for builders. Phone interviews with developers familiar with the Gateway area indicated that the willingness of those builders to build depends a great deal on the available infrastructure. Traffic realignments to smooth the flow through the area east to west were cited as primary concerns.
Summary Observations The ability to effect higher-density urban-scale residential development in the Gateway regional center can be facilitated by: (a) orientation to market segments not currently served; and (b) active public efforts to alter existing private realtor/developer perceptions of Gateway as a marketable residential community. To achieve economies of scale expected for suburban apartment developments, it is important to identify sites capable of accommodating projects of 150+ units. Premier sites are those directly adjacent or in immediate proximity to light rail stations. The relatively fragmented nature of property ownerships indicates a potential need for a public role in site assembly to achieve desired economies of scale for multifamily developments.
Gateway Regional Center Report to Metro
January 2005 58
There also may be a public sector role to encourage development of a balanced range of residential types including both apartment and ownership products. Recent new housing development activity indicates that the Gateway area can attract investor and developer interest. The Gateway URA project can facilitate this interest by broadening the product mix focusing on TOD sites and providing linkages to local retail, service, and job opportunities.5 The development at the airport is expected to generate a significant number of jobs, although many will be retail jobs, rather than office and industrial jobs previously anticipated. The retail and entry-level positions that would typically be filled by twenty-somethings and singles will generate a potential demand for housing along the light rail line. The higher density options available to the Gateway area may be positioned to serve that demand. When coupled with the potential influx of seniors who are downsizing from high equity home ownership, the twenty-somethings provide a significant market that may be captured by suitable housing stock in Gateway. This demographic then would provide the economic base to support the more diversified pedestrian-oriented kinds of development described in the Opportunity Gateway Concept Plan and Redevelopment Strategy. There is also a countercurrent to this transit-oriented growth engine – consisting of larger family ethnic populations flowing in behind the seniors moving out of their relatively inexpensive single-family homes surrounding the core area of the Gateway Regional Center. With the possible exception of impacts on schools and services, this, too, is an engine for positive growth for retail goods and services. Additionally, as these newer families mature and downsize, housing demand may have increased to the point where their properties can be converted to higher density development as is happening with properties currently within the Gateway and East Corridor Plan Districts. Excerpts from the PDC Housing Update – 2003
The following information comes from the Gateway URA Base Data and Trends Report, January 2003. The information pertains to the Gateway Study Area. In order to collect detailed information on rental housing within the URA, PDC developed a rental housing survey and mailed it to all owners of rental property. The survey collected information on the number of units, the bedroom types, size of the unit, the rent utility costs, as well as information on amenities and fees collected. Other information sources for the inventory included Multnomah County tax assessor data, Metroscan and a windshield survey of the Gateway URA conducted by PDC in the summer of 2001. According to Multnomah County Tax Assessor information and information collected through the survey, the Gateway URA in 2002 had 83 multifamily rental buildings and 80 single family home rentals, 63 owner-occupied multifamily units (condominiums and townhouses), and about 150 owner-occupied single-family homes. The Gateway Rental Housing Inventory estimated there were over 2,135 rental housing units in the Gateway URA boundary in 2002, 87 of them single-family rental units and 2,048 multifamily units. The majority of housing units were located within multifamily rental buildings compared to 213 single-family rental and ownership units (150 owner-occupied and 80 rental). Most multifamily housing units were within smaller buildings but about one-third of the units were in 3 5 An example of a TOD housing incentive is the location efficient mortgage, increasing the proportion of income
allocated to housing for households with reduced auto use.

Gateway Regional Center Report to Metro
January 2005 59
buildings with 100 or more units. Slightly less than one-third were in 8 buildings with 55 to 90 units. Gateway’s housing market has grown significantly since 2000 — 35 percent of the 2,348 units were built since 1998 compared to 4 percent of units built between 1990 and 1997. From 1990 to 2000 the number of owners in the Gateway Study Area increased by 7 percent (26 percent increase citywide) and the number of renters increased by 12 percent. With an estimate of 522 new rental and ownership units built within the urban renewal boundary from 1990-2000, the area absorbed 28 percent of the entire Gateway study area household growth of 1,857 households. Rental Housing: In terms of size, over one-third of Gateway’s rental stock is one-bedroom units and over half are two-bedroom units. The Gateway area offers few studios or larger units (four or more bedrooms), though the addition of two family-oriented tax-credit developments has increased the family-sized unit stock in recent years. In terms of price, Gateway is clustered in the middle of the market, with an overall median rent of $699 per month. Gateway average one-bedroom units rent at $615 compared to $713 citywide and Gateway average two-bedroom rent is $708 compared to $908 for two-bedrooms citywide. In terms of rent-restricted units that will be affordable over the long-term, Gateway has at least three tax credit projects totaling 184 units and a Housing Authority of Portland apartment building which will keep its existing rents affordable over the long-term, for a total of 328 rent-restricted units—representing 15 percent of total stock. Gateway’s affordability range lacks offering below 50 percent MFI (Median Family Income) and above 80 percent MFI. For example, 73 percent of the rental units were affordable to households earning between 51 percent to 80 percent ($640 and $1,050 for a two-bedroom). The table below illustrates that the open market units are highly concentrated in two products: $650-$850 one-bedrooms and $640-$775 two-bedroom units. The table also shows the market clusters with 371 two-bedroom units priced from $640-$775 (over half of the 51 percent to 60 percent MFI units). The second most common price point is the 300 one-bedrooms renting for $650-$850 per unit (half the 61 percent to 80 percent MFI units). Rental Housing Affordability
Number of Bedrooms 0 1 2 3 4 Total
% of Total
0-30% 5 5 0%31-50% 7 32 57 25 10 131 8%51-60% 3 137 371 68 2 581 36%61-80% 304 194 86 1 585 37%
81-100% 65 65 4%101-120% 12 12 1%121-150% 32 71 45 148 9%
150% + 24 44 68 4%Total 42 568 788 184 13 1595 100%
Goal 4.7 of the Portland Comprehensive Plan states that the Regional Center should strive to achieve a distribution of household incomes similar to the distribution of household incomes found citywide. The following table compares the recent PDC Housing Inventory rent data (76 percent of Gateway URA units) with the most recent citywide distribution of income to reveal the areas where the Housing Strategy should focus its funding and development efforts.

Gateway Regional Center Report to Metro
January 2005 60
Total Housing Units Surveyed by Median Family Income Compared to Citywide Income Ranges (1990 Census) 2002 Rental Housing Inventory Gateway URA
Total Return Surveys
0–30% MFI
31–50% MFI
51% to 60% MFI
61–80% MFI
81–100% MFI
101–120% MFI
121%-150% MFI
150% or more
# of units
1,554
5
131
581
585
65
12
148
68
% of Total Units*
76%
<1%
8%
36%
37%
4%
1%
9%
4%
1990 City Income Range
14%
13%
20%
20%
33%
* Complete 2002 with 76% of rental units in Gateway URA. Does not include Gateway ownership units. The lack of units above 80 percent MFI is likely due to lack of market feasibility — investors cannot be convinced that the market will pay these rents for Gateway product and location. Existing incentives such as the transit-oriented tax abatement are open market incentives meant to help overcome these financing barriers and increase the range of housing developed. The Gateway Regional Center Urban Renewal Area Housing Strategy, approved by the Portland Development Commission in May 2003, indicates the variety of tools that can be used to increase housing supply in the two market gaps and specifies the targets for the number of units PDC would like to add to the District by 2008. Gateway Multifamily Rental 1999-2001 Project Name
Year Built
# of units
Complex Amenities
Unit Mix Price Range % Occ.
Russellville 1999 283 Pool/hot tub Fitness ctr.
1-3 bdrm. $600-$1,070 99%
Cascade Crossing
1999 74 Community Room and Day Care
1-3 bdrm. $531 to $807 100%
Park Vista 2000 59 Playground Community Room
Studio, 1, 2,3, 4 bd
$351-$706 100%
Cherrywood Village
1999
320 Wellness ctr Chapel Theatre
Studio/ Asst. Liv.
$1,400 -$3,800
90%
Homeownership: According to the 2002 Rental Housing Survey, the Gateway URA itself contains 213 ownership units, including 150 single-family and 63 multifamily units. The 9 percent homeownership rate within the URA boundary is dramatically lower than surrounding neighborhoods of the larger study area, which recorded a 59 percent homeownership rate in 2000. In 2000, in terms of homeownership by race, the homeownership rate among Asians was the highest at 68 percent, higher than the city’s percentage of homeowners among Asians at 57 percent. The rate for Caucasian residents was 62 percent. The Gateway Study Area had fewer Black households that were homeowners (21 percent) than the city (38 percent). The Base Data and Trends report notes that Hispanic residents’ homeownership rate was 26 percent and American Indian or Alaska Native rate was 33 percent. Homeownership has historically remained affordable within Gateway due to its location in the midst of commercial activities. Prospective homebuyers are faced with a market choice

Gateway Regional Center Report to Metro
January 2005 61
between single-family homes in surrounding neighborhoods and a few condominium and townhomes clustered near transit. As indicated in the table below, the diversity of these new homes is limited; few are studios or two-bedroom or larger units designed for families, and few are accessible to seniors or older adults. However, in terms of affordability, nearly all new condominiums built in the last few years are selling for less than half the regional median sales price of $180,000 and even the new townhomes are far below this median sales price. The lower cost of the condominiums at 103rd and Clackamas units reflects the fact that these are smaller units without parking included. Nonetheless, these units have absorbed quickly and offered some affordable homeownership options to new residents. Gateway Multifamily Ownership 1999-2001 Project Name Year
Built # of units Unit Mix Price Range
Gateway Condos (103rd & Clackamas)
1999
24 studios/1bd $59,750 to $69,200
Gateway Arbors Condos (99th & Irving)
2001
24 Studio, 1,2 bdrm
$60,950 to $99,950
Townhomes 105TH/Burnside
1999
9 2 Bd/2.5 ba $112,000 to $126,000
Recent Rental and Ownership Developments: The market is providing low to moderately priced rental and ownership options, with the exception of service-enhanced senior housing, which is more costly. Developers of future Gateway market rate projects will need to convince lenders and potential residents that Gateway is a place that warrants rents competitive with the Central City. Projects such as Russellville Apartments on Burnside and 102nd provide a positive market comparable for the area and help dispel the historic rent ceiling. The project has increased density and provided open space onsite. This transit-oriented development includes a variety of townhome style apartments, traditional flats, and a 154-unit senior development. Russellville achieves rents of between $.80 and $1.08 per square foot ($800 to $1000 for a 1000 square foot unit). This is accomplished through an aggressive web marketing and management approach that includes amenities scaled for urban professionals such as controlled entry, community computer, fax and copy services, pool and hot tub and exercise facilities. Absorption and occupancy have been average to strong in this successful infill development. Projected Demand Findings: The projected Portland household growth is 31,500 households between 2000 and 2010. The demand analysis completed in the 2002 Gateway Market Study estimates that Gateway can capture between five and ten percent of the future Portland population growth for a total of 1,200 units by 2010. The demand would likely continue in the pattern with a majority of units built in multifamily rental buildings (1,050 rental units) and 150 units built in multifamily ownership buildings. The Study identified the following demographic market segments that may be attracted to living in Gateway:
• Price Sensitive Urban Dwellers – like the households drawn to Russellville, these households value the access and service associated with an urban location, but are relatively price sensitive compared to renters in more central/expensive locations.

Gateway Regional Center Report to Metro
January 2005 62
• Senior Households 75+ - Seniors 75+ will be attracted to the Gateway neighborhood given the right mix of independent living and assisted living options.
• First Time Homebuyers – Principally households with members in the 25 to 34 age cohort, first-time homebuyers will be drawn to Gateway for condominiums and town homes priced less than $150,000 and near transit and other urban amenities.
• “Empty Nester Households” – Principally households with members in the 55-64 age cohort, these households will be especially sensitive to neighborhood and unit amenities.
• Recent Immigrant Households - Includes households attracted to area for proximity to family and cultural/social amenities.
• Low-income Renter Households – There is significant pent up demand for affordable housing throughout the City of Portland that could be captured by new development in the Gateway URA.
B. Retail & Related Service Commercial Excerpts from the E.D. Hovee Study The Opportunity Gateway Concept Plan de-emphasizes this area’s regional retail role in favor of added office development and housing. While Gateway has the opportunity to serve a regional trade area, retail does not necessarily need to be presented in the traditional suburban mall format. Combining elements of a planned urban center with those of a true Main Street may offer the best of both worlds. However, the question of how retail is organized depends ultimately on both local and regional demand for reconfigured or expanded facilities. Retail Characteristics & Trends: The mid-/east Multnomah County area is relatively well-served with retail space. In the absence of a major regional or super-regional shopping center, the market could be considered relatively fragmented, since the retail is generally found in a large number of smaller community, neighborhood and strip centers. • As of year-end 1998, retail square footage regionwide had increased to 35.4 million square
feet, while retail space in mid-Multnomah County (subarea 4) market stayed static (at about 1.57 million square feet). As of year-end 1998, the commercial real estate firm Grubb & Ellis identified virtually no retail centers or buildings of 10,000 square feet or more as completed during 1998, or planned or under construction for 1999 for this mid-county submarket.
• The mid-county market appears to be relatively well served with retail space. This subarea has close to 5 percent of the region’s competitive retail space versus a similar 5 percent share of metro area population. Similarly, mid-county and east county (subareas 4 and 5) combined have 12 percent of the region’s population (with 191,000 residents) and a comparable 12 percent share of the region’s competitive retail space.
• As of fourth quarter 1998, close to one-half of the mid-county’s competitive retail space (47 percent) consists of community center versus only 32 percent of retail space regionwide. The mid-county market is also relatively well-served by neighborhood and specialty centers but underserved with regional retail (i.e., no regional or super-regional malls). The closest

Gateway Regional Center Report to Metro
January 2005 63
super-regional malls readily accessed via the I-84 and I-205 freeways are Lloyd Center, Clackamas Town Center and Vancouver Mall.
• Retail vacancy rates in mid-Multnomah County remain relatively low (at 3.4 percent for year-end 1998), versus 4.4. percent regionwide. Mid-county retail vacancies consistently have been below those of the metro area, albeit with only modest levels of new construction as a result. Despite good market fundamentals, what is perceived as an already developed community has yet to be rediscovered by more aggressive retail development and investment interests.
• Growth potentials for this subregional market are stronger than may be readily apparent. The number of households in mid-county (subarea 4) is expected to increase by 39 percent from 1994-2015 versus a 52 percent increase for the entire Portland metro area. The number of households for subareas 4 and 5 combined is expected to increase by a more substantial 50 percent due to the stronger rate of residential growth that has been forecast for east Multnomah County.
• Building permit data indicates that retail is one of the stronger sectors of new construction activity in the immediate Gateway area. Out of $30.75 million of new construction permits from 1990-1999, $4.6 million (or 15 percent) consisted of new retail construction. However, since 1990, permits for only four retail buildings of more than 10,000 square feet have been issued, none since 1995.
• Building permit data reviewed for the entire 1990-1999 period shows that virtually all of the immediate Gateway project activity has occurred either on 102nd Avenue or on an east-west street within three to five blocks of 102nd Avenue (notably Halsey or Stark/Washington).
• Major multi-tenant retail centers serving the mid-county area from Gateway are Gateway Shopping Center (Fred Meyer, Office Depot, Mervyn’s) and Mall 205 (this project was redeveloped and tenanted post-2000 with anchors Target and Home Depot). Just east of 102nd Avenue (across from Mall 205) is Plaza 205 (anchored by JoAnn Fabrics, Office Max, Old Country Buffet, and Bally Total Fitness). A newer specialty center just to the west of Mall 205 across 97th is 205 Place (anchored by Blockbuster Video, Newport Bay, and Kinko’s).
• Relatively modest incomes in the mid-Multnomah County market tend to indicate support for traditional department store and big box anchor formats. The more upscale retail venues as in the NW 23rd Avenue and even the Lloyd Center/Broadway-Weidler areas become more viable as median household incomes increase. With a broader mix of new housing development, the residential population base could evolve to also support a more diverse set of urban shopping experiences focused on the mid-/east county market.
• If sufficient land could be secured, Gateway is ideally situated for a regional-scale retail center due superior transportation accessibility (freeway and light rail) and the possibility to capture a larger trade area population.
• Ability to achieve the critical mass of a regional retail center would require a policy commitment from the City of Portland, interest from major users and sufficient acreage to assemble competitive site(s).
• A major challenge and opportunity will be to design a concept that proves to be attractive to anchor tenants but with a higher density, more urban scale retail configuration — possibly involving significant use of main street-type frontage retail — as on /Stark/Washington, Halsey or 102nd.
• Left to its own course, the private real estate market probably will not deliver either a regional/super-regional scale shopping area or a main street-type retail street environment. The more likely scenario would involve redevelopment of a large older community center (such as Mall 205) as a power center anchored primarily by freestanding (or connected) big

Gateway Regional Center Report to Metro
January 2005 64
box retailers. (As noted previously, this has occurred since 2000 with Target and Home Depot are principal anchors.)
Despite this potential regional retail opportunity, future mid-/east county market potentials will probably continue to be served via smaller-scale retail developments. The Cascade Station/Portland International Center (PIC) development will serve much of the same trade area with up to 400,000 square feet of retail and cinema/entertainment space. In the absence of a concerted public-private effort, PIC development could pre-empt or dilute much of the new retail development potential that could be generated in the Gateway area — at least in the short-term. Summary Observations: The mid-Multnomah County market appears to be relatively well-served for all forms of retail activity, except perhaps for regional centers with major department store and/or big box anchors. Moderate mid-county residential population increases indicate reasonable opportunity for new development on the horizon. Existing older centers also are expected to be under continued pressure to reconfigure in order to remain competitive. However, while demand for retail is stable, major increments of new Gateway area retail space are not expected for a decade or so until the new inventory anticipated in the Cascade Station/PIC area is absorbed. Population growth in the mid-county market (by itself) can be expected to support in the range of an added 500,000 - 600,000 square feet of retail/service commercial space through the year 2020. A significant portion of this demand potential may be served by retail space planned in conjunction with the Cascade Station/Portland International Center development — especially near-term. This analysis could be interpreted as suggesting that demand for added Gateway area retail will be correspondingly moderate — with development continuing to occur in smaller 100,000 to perhaps 300,000 square foot planned centers. However, this relatively conservative approach understates the retail opportunity that is potentially available to Gateway via a bolder initiative. A more aggressive approach could be predicated on creating a true regional/super-regional retail focus — meeting retail industry standards —but in a format not typical for the shopping center industry. Preliminary analysis indicates that the larger mid-/east county market should support a significant increment in retail space (i.e., up to an added two million square feet). A regional center at Gateway would be predicated on: • Reorganizing and modernizing existing facilities as well as capturing a significant share of
the income potential associated with future mid-/east county population growth. • Development of a critical mass of not less than 1+ million square feet of competitive planned
center and main street-type retail as an integral component of the regional center. • Attracting both major department store and big box retailers in a multi-tenant, planned
center environment. • Linking and reconfiguring the area’s two existing smaller community shopping centers at
Mall 205 and Gateway. • Applying a main street corridor orientation to establish this connectivity, while also
encouraging an active street and pedestrian-oriented shopping environment. • Attracting retail developers, investors and retailers to capitalize on the opportunity to get in
on the ground floor of a significant urban scale prototype reshaping Portland’s retail environment in the years to come.

Gateway Regional Center Report to Metro
January 2005 65
Excerpts from the PDC Retail Market Update - 2004 Price per square foot for retail space increased in 2003. The Gateway area showed a strong resilience in the retail market in 2003, when compared to the rest of the City of Portland. Retail vacancies fell nearly two percentage points, from close to 11 percent down to less than 9 percent. At the same time, effective retail rents rose 3.5 percent, ending last year with averages between $14 and $15 per square foot.
Retail Rent & Vacancy Rates
$9.00$10.00$11.00$12.00$13.00$14.00$15.00
1999 2000 2001 2002 2003
Ask
ing
Ren
t (Ba
r)
3.0%
5.0%
7.0%
9.0%
11.0%
13.0%
Vac
ancy
Rat
e (L
ine)
Source: Marcus and Millichap Real Estate Investment Brokerage Company
The relative strength of the Gateway retail real estate market is due to a number of factors, including the area’s ease of access and central regional location. The Stark/Washington couplet and the shopping centers at Fred Meyer/Mervyn’s and Mall 205 also attract customers from around the region. Well located retail space in the area will continue to be in high demand. One challenge for the economic health of the urban renewal area will be to increase the diversity of economic activities, including an increase in professional and medical related uses. C. Office Development Excerpts from the E.D. Hovee Study The entire mid-/east Multnomah County area has been a relatively minor player in the region’s office market, particularly for Class A office space. A question is whether Gateway’s position as a Metro-designated regional center with significant freeway and transit access advantages provides a similar opportunity to emerge as a competitive player for new office development. Office Characteristics & Trends: The mid-Multnomah County area maintains a low profile office presence, with virtually no Class A space, but with healthy occupancies for available office space, thereby indicating potential latent demand: • An earlier Leland analysis (David Leland, Leland Consulting Group) indicated that the mid-
county market (subarea 4) had less than 1 percent of the region’s office space inventory as of 1995. More recent data indicates that little changed between 1997 and 2000.

Gateway Regional Center Report to Metro
January 2005 66
• As of year-end 1998, Grubb & Ellis data showed that mid-county had 138,441 square feet of net rentable office space, down from 1977 levels of 171,000 square feet.6 With 5 percent of metro area population, mid-county effectively had less than one-half of 1 percent of the region’s inventory of 32.2 million square feet of office space.
• Due in large part to limited supply, the office vacancy rate is 5.7 percent, somewhat below the Metro average of 5.8 percent (as of year-end 1998). As with retail, it is apparent that the development community has not yet stepped forward to take advantage of: (a) latent office market demand, and (b) opportunity to serve a large resident work force with office jobs closer to places of residence.
• The mid-county office inventory comprises seven buildings, for an average of less than 20,000 square feet per building. There are no Class A buildings in the mid-county area. Approximately 64,000 square feet of supply (46 percent) is considered Class B and 74,700 square feet (54 percent) as Class C space. Since 1995, a considerable part of what was considered Class B has been redefined to a Class C designation (increasing the Class C inventory by over 50 percent).
• Regional office absorption in the Portland metropolitan area slowed in the 1990s to an average of less than 700,000 square feet per year, well below the 1.5 million square feet a year pace of the 1980s. This has happened despite the 1990s being the period of the most rapid job growth in Portland’s history — due largely to a shift of traditional office users to lower cost industrial/business park locations (including flex space). Long-time mainstay office tenants (notably banking) also have contracted in recent years as a result of corporate mergers and industry restructuring.
• The metro office market has also suburbanized. Downtown Portland historically accounted for 50 percent of the region’s office space, but has captured less than 20 percent of regional absorption to date in the 1990s. Prestige suburban office locations have emerged as strong competitors to Portland’s Central City. Lake Oswego’s Kruse Way, for example, accounted for 11 percent of regional office space absorption in 1998, while the Washington County Corridor accounted for just under half of all office absorption. East Portland/Multnomah County has yet to establish a competitive presence similar to what has been established southwest of the city.
• From 1990-1998, most office-related construction in the Gateway area has been related to medical uses — including facilities for Portland Adventist Center and Providence Gateway Clinic. Only three new non medically-related office buildings are noted — of 7,800, 4,800 and 4,000 square feet respectively.
As with retail, Gateway offers considerable potential as a resource for office development to better serve the labor market of the entire east Multnomah County area. Taken together, Metro areas 4 and 5 (mid-county and east county/Gresham) comprise 12 percent of metro area population but less than1 percent of the region’s competitive office inventory. Office Prospects: Despite the long-term prospects that Gateway presents for office development, near-term potentials may be limited by absence of a track record for existing development combined with the likely emergence of the Cascade Station/Portland International Center (PIC) as an emerging mid-/east county office site of choice over the next one to two decades.
6 Although 1999 data is available, Grubb and Ellis has changed its geographic reporting areas. There is no longer a
mid-Multnomah County subarea. For continuity, data in this update is limited to end-of-year 1998.

Gateway Regional Center Report to Metro
January 2005 67
Developing on light rail, Cascade Station/Portland International Center is potentially planned for up to 1.5 to 1.6 million square feet of office space. Capture of approximately 15-20 percent of the region’s office market is anticipated to achieve build-out within a 15-year time horizon.
Consideration of other major mid-/east county office sites therefore becomes problematic until the Cascade Station/Portland International Center (PIC) nears build-out. However, one limitation associated with PIC is that land for office development will be leased rather than sold. Developers interested in purchase of the underlying land may be motivated to look to other mid-/east county locations.
Conceptually, these negatives could be offset by Gateway’s outstanding access to two interstate freeways, light rail proximity, potentially suitable sites, opportunity for fee ownership, and a strong private-public development partnership. Properly marketed, the PIC development also becomes an asset for Gateway – shifting major office development attention to east Portland for the first time.
Establishing a competitive presence at Gateway in the region’s office market (especially for Class A space) will likely require:
• A slowly accelerating pace of development – predicated on clearly distinguishing the market niche for Gateway versus PIC office product.
• Early focus on facilitating one or two initial flagship office/mixed use projects (and possibly some smaller “B” quality space at secondary locations).
• Near-term identification of suitably-sized competitive office sites (preferably properties with locations either directly on or immediately visible from I-205 and the light rail) and land assembly/banking for future development as the Gateway market emerges.
• Longer-term positioning of Gateway for a more rapid pace of office development – particularly as the PIC development nears build out.
• Public sector assistance with land assembly (if required), marketing support and possibly financial incentives (particularly for initial pioneering projects).
Summary Observations: Despite its obvious transportation advantages, Gateway has not been and is not likely to become a competitive factor for significant new office in the immediate future. Much, though not all, of what emerges as a more competitive mid-/east county office market is expected to be captured initially by the high profile Cascade Station/Portland International Center development. However, an appropriate strategy may be to position Gateway as a distinctive market niche for smaller-scale, fee-owned office developments in the near term. Subsequently, the Opportunity Gateway Concept Plan area can be repositioned for the next wave of larger-scale east Portland office development – with significant investment activity possible by about 2010. Momentum for this approach could be established by facilitating the development of one or two initial Class A pioneering developments in Gateway over the coming decade. Excerpts from the PDC Office Market Update - 2004 As of the third quarter of 2003 (3Q03), the office vacancy rate in Gateway stood at 12 percent. This is the maximum vacancy rate that has been seen in the last several years, consistent with increasing office vacancies throughout the Portland metropolitan area. Overall, the Gateway submarket has faired better than the metropolitan area as a whole, with a vacancy rate of more

Gateway Regional Center Report to Metro
January 2005 68
than 5 percent below the market average. The lower vacancy rate may be due in part to limited supply. Office space in Gateway may be characterized as Class C or Class B product. There is no Class A space. These categorizations may generally be defined as:
• Class B space – Space that is in standard condition and includes basic tenant amenities • Class C space – Space that is in older condition
Asking rents as of 3Q03 stood at between $12.50 and $13.00 per square feet. This rate has been consistent since 2Q02. Marcus and Millichap research indicates that the area will experience declining vacancy and a flat rent growth rate over the next several years. The Opportunity Gateway Concept Plan states the following with respect to the area’s office: “As with retail, Gateway offers considerable potential as a resource for office development to better serve the labor market of the entire east Multnomah County area. Taken together, mid-county and east county/Gresham represent 12 percent of the metro area population, but only 1 percent of the region’s competitive office inventory.” In addition to a strategic regional location, Gateway’s close proximity to Portland International Airport, interstate highways, and light rail is another strong asset. The national and regional economic recession since 2000 have clearly hampered potential development. More opportunities will be considered with the return of economic stability. D. Lodging Development Excerpts from the E.D. Hovee Study While Gateway currently is not known for lodging activity, hotel/motel investment merits consideration — due in large part to the area’s strategic location and transportation access (both freeway and transit). Lodging Characteristics & Trends: Oregon and Washington have both experienced growth in lodging, outpacing overall national performance over the last several years. Increasing lodging demand can be attributed to strong growth in the region’s economic base, continued in-migration, and greater national/international recognition as a good place to visit. Much of the region’s new lodging construction has been focused on the Portland and Seattle metro areas — with considerable downtown/central city activity. As of 1998, PKF Consulting data indicates that, at an annual occupancy average of 69.5 percent, downtown Portland experienced a drop from the 74.7 percent highs of 1997. Suburban occupancies are somewhat lower but still healthy at 65.5 percent. As of 1995/1996, the Portland metro area had an inventory of approximately 14,000 overnight lodging units. Much of the recent hotel development activity in mid-/east Multnomah County has been centered on the airport area. New/planned lodging properties have included the Silver Cloud, Hampton Inn, Embassy Suites, Hilton Garden, Fairfield Inn and Courtyard by Marriott.

Gateway Regional Center Report to Metro
January 2005 69
Recent additions to the Portland inventory were 451 rooms by Marriot at Lloyd Center and City Center and 354 at the Westin Hotel Downtown and Paramount Hotel Downtown. Additional airport and Cascade Station/Portland International Center (PIC) lodging might still be built — involving both full service and limited service hotels. Lodging Prospects: As with office space, prospects for lodging development at Gateway will be different in the near term versus long-term. Near-term, much of the mid-/east Multnomah County market activity is likely to remain focused in the airport/PIC area. Additional near-term potentials may be dampened by the current prospect of lodging overbuilding as well as concerns over an economic downturn in the metro area. Longer-term, lodging represents an important part of the prospective use mix for Gateway. Market niches of particular importance to the Gateway area could include capture of pass-through traffic on the I-84 and I-205 corridors as well as spillover demand from Portland International Airport and downtown (both easily accessed via MAX). Summary Observations: Planning for overnight lodging accommodations represents an important part of the activity mix for Gateway. Lodging can support and is supported by nearby office and retail activity. Hotel/motel patrons can be particularly valuable as a source of evening clientele for area businesses. In the near-term (three to five years), efforts could be made to attract one or two smaller (50-150 room) properties oriented to freeway and airport/downtown spillover demand. Longer-term, larger signature projects may be worth pursuing — particularly as Gateway is established as a true regional nexus for multi-modal transportation, shopping/entertainment, and employment. E. Industrial Potential Excerpts from the E.D. Hovee Study Industrial development could be of short- or long-term interest for the Gateway area for two reasons. First, there is an existing cluster of generally small-scale industrial use in Gateway, especially in the employment area west of 102nd Avenue between Stark and just north of Burnside. Second, increased industrial activity might offer opportunity for relatively high wage jobs — important to a community with incomes below the metro area median. However, given Comprehensive Plan designations and pressures for redevelopment, it is more likely that the area will transition from industrial to other, more intense, employment and residential activities. Industrial activity is not emphasized either by the Opportunity Gateway Concept Plan nor the Urban Design Concept. Industrial Characteristics & Trends: Recent activity locally and in the greater mid-/east county area suggests little opportunity for resurgence of what has been a relatively quiet zone of smaller scale industrial uses:

Gateway Regional Center Report to Metro
January 2005 70
• As of year-end 1998, Grubb & Ellis estimated that mid-Multnomah County (subarea 4) accounted for 4.0 million square feet of competitive industrial space, less than 5 percent of the region’s industrial space inventory of almost 81.6 million square feet.
• While still relatively small compared to the region because of its emerging status, mid-Multnomah County now accounts for a considerable share of metro area industrial development and absorption activity. In 1998, the mid-county area accounted for close to 317,600 square feet of net space absorbed, or 27.8 percent of regionwide demand. Most of this development is occurring in the Columbia South Shore/Airport Way area. This is the same area with most of the industrial potential in East Portland.
• Due to the rapid pace of new construction, mid-county industrial vacancies have been relatively high — at 16.8 percent (as of year-end 1998) compared with an 8.5 percent vacancy level for the entire metro area.
• Virtually all of the competitive industrial space that has recently been constructed, is underway, or planned in mid-county is occurring on or near Airport Way (north of Gateway). This trend can be expected to continue for the foreseeable future.
Industrial Prospects: Requirements for development of competitive industrial space (whether end-user or multi-tenant) in the Gateway area would depend on: • Securing suitable sites of sufficient size • Land pricing competitive with that of other mid-/east county locations • Supportive land use and infrastructure plans
From a market perspective, a major limitation for expanded industrial use will be land pricing. Industrial activities typically pay less per acre (or square foot) than what other users are willing to pay. Summary Observations: While industrial development has an established foothold in the Gateway area, prospects for any significant expansion of industrial use are doubtful. As the rest of Gateway begins to revitalize, pressures to redevelop industrial property for commercial or residential use can be expected to emerge. The current zoning designation of Central Employment (EX) will likely serve to facilitate this transition consistent with market expectations. As this transition occurs, identifying new non-industrial but high paying employers will be important to maintaining and enhancing Gateway’s position as regional employment center. Excerpts from the PDC Industrial Market Update - 2004 There is a limited amount of property within the Urban Renewal Area that may be classified as industrial use. There are 48 acres of land zoned EX in the area bounded by approximately by I-205 on the West, SE 101st on the East, SE Stark on the South, and a line north of E Burnside on the North7.
7 The zoning for this area changed from EG2 to EXd as a result of the Gateway Planning Regulations Project and
City Council approval of recommended zoning changes on May 12, 2004.

Gateway Regional Center Report to Metro
January 2005 71
The asking sale price for industrial property was approximately $45 per square foot in 2003. However, the small inventory and slow volume of sales makes the average price subject to change based as a result of new sale activity.

Gateway Regional Center Report to Metro
January 2005 72
Redevelopment Strategies Opportunity Gateway Concept Plan and Redevelopment Strategy The Opportunity Gateway Concept Plan and Redevelopment Strategy identifies five measures that if implemented would greatly enhance Gateway’s Regional Center prospects. One measure - broaden community involvement - has largely been achieved. Its primary goal was to expand leadership in the Regional Center and its surrounding neighborhoods, and to encourage informed public participation. See the appendix for a summary of public participation. The Program Advisory Committee includes representatives of the entire spectrum of interests within Gateway and has established a Gateway URA website. Its meetings regularly find a large audience. The remaining four measures are: • undertake select improvements immediately • capitalize on design review • lever the 1999-2001 work program • implement redevelopment in phases Undertake Selected Improvements Immediately The following projects were chosen as priorities in the Strategy to help jump-start the regional center. Half of them have been started or completed to date: • Realignment of NE 99th Avenue at NE Glisan to improve intersection performance has been
completed. • Redevelopment of the Transit Center to improve access and parking and add commercial
and civic activity is underway • Development of new parks is planned. A parks development strategy is currently being
developed. • Assembly of fragmented ownership into development-ready parcels to encourage immediate
development is being considered. • Creation of an Identity Enhancement Program, to include gateways, beautification of traffic
islands, signage program, and landscaping of the I-205 berm. • Development of an Education Center in coordination with PSU, MHCC, and other
educational institutions is being pursued. Capitalize on Design Review The Gateway community has a powerful tool at its disposal to help influence the look and feel of future development in the Regional Center. This tool is the design overlay zone, which now requires that all new development and some redevelopment go through a Type II or Type III design review process. In this process, designs are reviewed for: • Architectural compatibility, building placement, and massing of new construction and
exterior changes; and • Assurance that new development and changes enhance the surrounding areas and the
environment for pedestrians.
Gateway Regional Center Report to Metro
January 2005 73
The design review process provides the opportunity for public evaluation of building and site designs. All projects have a requirement to contact the appropriate neighborhood association to offer an opportunity for evaluation. Lever the 1999-2001 Work Program The 1999-2001 work program laid the ground work for the Gateway Urban Renewal Plan. Many of the projects outlined in the work program are underway: Portland Development Commission • Evaluate, along with Tri-Met, Metro and PDOT, options for redevelopment at the transit
center. (Underway) • Coordinate efforts between Mount Hood Community College and Portland State University
to create an educational presence in Gateway. (Underway) Portland Office of Transportation in conjunction with Tri-Met • Evaluate alternatives to reduce the impact of regional through traffic on the Gateway
Regional Center. (Ongoing) • Consider parking alternatives for the Gateway Park and Ride. (Underway and ongoing) Portland Office of Transportation • Develop a set of design standards to transform 102nd Avenue into a regional boulevard.
(Underway) • Prepare a traffic management plan. (Completed and ongoing updates) • Develop street design standards for future local streets. • Examine alternatives to reducing the impact of regional through traffic on the regional
center. (Ongoing) Bureau of Parks and Recreation • Explore strategies, potential locations, and potential funding sources for property acquisition.
(Underway) • Prepare a report summarizing the use and possible phasing of parks and open space in the
Regional Center. (Completed) Implement Redevelopment in Phases • Phase One, years 1 – 5: projects that are already being examined for redevelopment or are
key improvements necessary to upgrade the existing infrastructure, such as high-priority street connections and high-priority open space improvements. Redevelopment is assumed only on high-priority opportunity sites.
• Phase Two, years 6 – 10: projects that would build upon Phase 1 activity. Enhanced funding and implementation tools allow some medium-priority street connections to be made and some additional open space to be developed. Redevelopment is targeted to uses with short-term market potential.
• Phase Three, years 11 – 20: projects that will require several years of market maturity and significant reinvestment within the regional center. Longer-term goals for street connectivity are assumed. This phase assumes full build-out of the improved circulation and open space network.

Gateway Regional Center Report to Metro
January 2005 74
Gateway Housing Strategy The following objectives and strategies will be implemented by PDC using both direct and indirect tools and funding: • Support the development of an additional 2,000 housing units within Gateway by 2020. • Assist in the development of at least 800 to 1,000 of these units with at least 200 units built
from 2003-2008; 300 units from 2009-2014; and 500 units from 2015-2020. • Focus on meeting gaps in available housing that is affordable to a range of incomes –
currently identified gaps are a lack of rental housing options for households with incomes below 50 percent and above 80 percent MFI.
• Strive to diversify the stock housing through increased homeownership; innovative pilot projects; and housing for elderly and others whose options are currently limited by the types, sizes, and range of affordability of area housing.
• Prioritize the needs of residents most at risk of displacement and of populations who currently lack housing options whenever possible.
• Ensure all new housing developments are challenged to implement the regional center vision by improving building design and adding amenities that enhance nearby neighborhoods.
Public Financial Tools The following technical and financial tools are generally available in the Gateway Regional Center URA (subject to URA and program funding availability).
Tax Increment Financing (TIF): The total maximum indebtedness that may be incurred to complete the URA Plan is $164,240,000 by the year 2021. Storefront Improvement Program: matching grants to property and business owners for non-structural improvements to any building façade oriented to a public right-of-way. Business Recruitment and Retention Loans (several types) with local, state and federal funds for qualifying new and existing businesses in Gateway. Land Acquisition: Property acquisition by the City of Portland can be accomplished through eminent domain, outright purchase by a willing seller, or through other means, including by gift. Affordable Housing Tax Abatement (city and URA wide). Available, but has not been used in Gateway because the TOD tax abatement program is more attractive. Transit Oriented Development (TOD) Tax Abatement Program. The TOD Tax Abatement Program seeks to enhance the effectiveness of the light rail transit system by encouraging transit-oriented, mixed-use development and affordable high-density housing development near light rail stations. City Council designated the Gateway Plan District (which includes the URA) eligible for the program in 1996. To be eligible, projects must meet density, affordability and transit orientation criteria described in the table below. City Council makes the ultimate decision to grant the abatement on a case-by-case basis.

Gateway Regional Center Report to Metro
January 2005 75
Eligibility Considerations for TOD Tax Abatement Criteria
(all must be met) Public Benefits
(must include at least 1) Design Criteria
(must include at least 1) • 8+ Dwelling Units • Permanent Housing • 1 or more Public Benefits • Pedestrian connectivity to
light rail system • Affordable to broad range of
public OR provide alternative public benefits or design features
• 20-35 units/acre density • Income level and sales price
restrictions for owner-occupied units (condos)
• Financial benefit to buyer/user
• For 15+ unit rental projects, 20% of the units must be affordable to households earning 60% MFI or less
• For 8-15 unit rental projects, 10% of the units must be affordable to households earning 30% MFI or less
• For ownership projects, all units must be sold to owners earning 100% MFI or less
• 20% units for people with special needs
• 20% units at 3 or more bedrooms
• On-site child care • 80% maximum density
• Ground floor service or commercial use space
• Office or meeting space for community organizations
• Publicly accessible open space
• Recreational facilities for children of project residents
• Transit or pedestrian design amenities
Upon City Council’s approval, the completed project becomes exempt from property taxation for ten consecutive years, beginning January 1 of the year immediately following the calendar year in which construction is completed. The land on which the project is built continues to be taxed during this time, but taxes on all improvements (the project itself) are abated. At the end of ten years, both the land and improvements are taxed at their current assessed value. Regional and State Transportation Funding: Competitive funding through the Metropolitan Transportation Improvement Program. State and Federal Housing Funding: Highly competitive funding. Regional TOD Funding: Competitive funding through the Metropolitan Transportation Improvement Program or Metro’s own program. Development and Housing Low Interest Loans/Gap Financing: Available through PDC, subject to annual budgets, see below for more specific program information. System Development Charges (SDCs): This is a city wide program that creates funds from new development to provide infrastructure and services to serve new development. New Market Tax Credits: A federal program that attracts private capital to economic development and development projects in qualifying census tracts. Development Opportunity Strategy. Provides pre-development matching grant funds to individuals who own or have control of property. This program is not yet available in Gateway. Land Disposition The Portland Development Commission is authorized to sell, lease, exchange, subdivide, transfer, assign, pledge, encumber by mortgage or deed of trust, or otherwise dispose of any interest in real property which has been acquired, in accordance with the goals and objectives of the Urban Renewal Plan.

Gateway Regional Center Report to Metro
January 2005 76
Public Improvements The City or Portland Development Commission may improve or construct public facilities and utilities within public rights-of-way, easements, or on public property. These may include public utilities, community facilities, communication delivery systems, street lighting installation, landscaping, street tree planting, on-site stormwater control facilities on public or private property, street improvements, light rail and other transit system components, pedestrian trails and other facilities, recreational facilities, public education or arts facilities, governmental centers, parking facilities, parks, open space development, safety-related public facilities, and public restrooms. Loans and Other Development Products/Programs PDC Development Loan Products – In general, PDC provides low-interest loans for use in property acquisition, refinancing, rehabilitation and new construction of housing, commercial or mixed use projects that meet URA goals. Loans may be used for gap financing and/or bridging the temporary financial need between acquisition, construction, permanent loans and equity to fund total development costs. These loans are often subordinated to private construction and permanent financing. PDC usually accepts applications for these financial assistance products in two ways: • PDC issues Request for Proposals (RFPs) to solicit proposals from developers of projects
that will provide public benefits as defined by city policy and urban renewal area goals. The City may have site control or developers may select and demonstrate site control (the latter often the case in Housing RFPs).
• PDC also accepts applications for direct financial assistance. Developers with site control who are interested in developing a project that furthers the objectives outlined in city policy or URA goals often bring unsolicited projects to PDC for funding consideration.
PDC Predevelopment Loans (for non-profits) - Non-Profit Predevelopment Loan Program. The PDC Housing Department, together with the Enterprise Foundation provides predevelopment financing for projects sponsored by eligible non-profit organizations through the loan program. These funds are available to fund technical and professional services necessary to explore the feasibility of low- or moderate-income, mixed use, mixed income housing development. Non-Profit Acquisition Financing Loan - PDC and the Enterprise Foundation offer nonprofit acquisition financing loans to eligible housing non-profits to fund the acquisition of property or to fund a portion of the cost of a contract purchase. The property must be intended for the development of low- or moderate-income, mixed use and/or mixed-income housing. PDC Predevelopment Loans (For-Profits) - PDC provides direct loans for pre-development activities to projects located in urban renewal areas. Loans are available to fund technical and professional services necessary to explore the project feasibility of rental housing, for-sale properties with multiple units or mixed-use developments that meet the programmatic objectives of the urban renewal area or the special initiative of PDC. PDC Direct Finance Acquisition Loans - PDC provides loans to project sponsors to fund the acquisition of property for projects located in the urban renewal areas which have tax increment financing available for housing. Loan funds are available to fund the acquisition of property or to fund a portion of the cost of a contract purchase of property for rental housing, for sale

Gateway Regional Center Report to Metro
January 2005 77
properties with multiple units, or mixed-use developments that meet the programmatic objectives. Limited Property Tax Abatement Program for New Rental Housing (ORS 307.600.PCC 3.104)- The City of Portland has a limited property tax abatement program for qualifying multi-family rental new construction with ten or more units in urban renewal areas. Projects receiving the abatement are exempted for ad valorem taxes on the value of the improvement for a 10-year period. In return for the tax abatement, the developer must provide public benefits such as affordable housing, open space, day care, etc. Charitable, Non-Profit Property Tax Abatement - A low-income project under the ownership or control of a qualified non-profit agency can receive property tax exemption on the value of land and improvements from the County Assessor, renewable annually, for the units occupied by households with incomes below 60 percent of the median family income for the area. Likewise, if ownership is held by the City of Portland (through the Housing Authority, for example) it will also be exempt from taxes. PDC Development Fee Waiver Program - This program is available to non-profit affordable housing projects in the City of Portland. It is intended to reduce development costs by waiving a portion of the development fees associated with rehabilitation or new construction of affordable housing units. The Fee Waiver benefit amount is derived from the number of affordable units created for any given project. The PDC Fee Waiver Program is intended to reduce development costs by waiving a portion of certain permit fees. Fee waivers are subject to the availability of PDC funds. System Development Charge (SDC) Exemption Program - New development within the City of Portland generates the need for capacity increases for transportation systems, parks and recreation facilities and water works systems. The System Development Charges (SDC) incurred by new housing units will fund a portion of the needed capacity increases in the City of Portland. SDC exemptions are intended to reduce the development costs for residential units that are made affordable to first time homeowners and low-income renter households by exempting developers from paying SDC fees levied by the City of Portland. Only those units meeting the requirements will receive the exemption. Other Community Housing Products and Programs Other Public and Foundation Financing Programs. A variety of local, state, and federal programs are available for housing serving low-income families; for example, the Oregon Affordable Housing Tax Credit for Low-Income Housing, Housing Trust Fund, Tax- Exempt Bonds, Elderly and Disabled and Private Activity Bonds, and the Oregon Residential Loan Program. Many of these programs are only available to non-profit developers. They are administered by the Oregon Housing and Community Services Department, the Portland Development Commission, Multnomah County, and the Bureau of Housing and Community Development or HUD. There are also a number of federal grant programs and charitable foundation opportunities for which non-profits may qualify. For example, local governments have reached agreements with the Enterprise Foundation to utilize the Foundation’s Smart Growth Fund. Federal Low-Income Housing Tax Credit - The Federal Low-Income Housing Tax Credit (LIHTC) provides a federal income tax credit for new construction and rehabilitation of

Gateway Regional Center Report to Metro
January 2005 78
residential units for low-income individuals. The credits are purchased by corporations with anticipated tax liabilities and are claimed for ten consecutive years following the date that the qualified property is placed in service. Projects must meet rent restrictions that require that either 20 percent of the units be occupied by households with incomes below 50 percent of the area’s median income or 40 percent or more of the units be occupied by household whose incomes do not exceed 60 percent of median. Residents in eligible units may not pay more than 30 percent or the applicable income limitation for rent and utilities. Generally, properties receiving tax credits must remain in compliance with the set-aside and rent restriction tests outlined above for an extended use period of at least 30 years, but commonly up to 50 years. The tax credit is either nine percent or four percent of the eligible basis (i.e., qualified expenses) of the project. Using these credits is complex, but may be used to raise significant equity for a project. The complexity of the tool results in the use of consultants, attorneys, and accountants familiar with the process. The credits are awarded through an application process conducted by the Oregon Housing and Community Services Department. The process is a highly competitive one for most credits. Private Financing - The private financing community will continue to finance market rate housing projects and these projects will help to meet growth management goals for the area and serve to generally improve the area. Typically with low income projects, private financing is but one of many sources necessary to complete the funding package.

Gateway Regional Center Report to Metro
January 2005 79
Actions The actions included in the following chart are found in three locations: the Opportunity Gateway Concept Plan (OGCP), the Transportation System Plan, and the Gateway Regional Center Subarea Policy of the Outer Southeast Community Plan (OSECP). The first and last were adopted by Resolution. The TSP was adopted by Ordinance. Some items in the OGCP and the OSECP have already been completed and are not included in this chart. Some items may no longer be acceptable. However, until they are superceded through another process, they are included. # Action Est.
Cost Time-frame
Imple-mentors/ Partners
Sourceof Funds
Committee Notes*
Priority**
Transportation and Parking 1 Plan, design and implement
the transportation projects identified in the Transportation System Plan (TSP) for the Gateway Regional Center. (OSECP)
On-going
PDOT, Metro
2 Implement the Gateway Concept and Redevelopment Strategy Recommendations to provide street connections as redevelopment occurs, manage regional traffic impacts, and focus boulevard and main street improvements on 102nd. (TSP)
PDOT
3 Create street standards that reflect the street designations and the subareas identified in the Opportunity Gateway Concept Plan. Include treatments for at least the following: street trees, street lights, street furnishings, tree grates, street signs, sidewalk pavement, traffic lights, and signals. (OSECP)
2010-2024
PDOT
4 Improve the traffic flow around the Transit Center. (OGCP)
(SC): Must be done prior to or in conjunction with I-17
1 of 45
5 Study Transit Center transportation impacts and possible parking solutions. (OGCP) • Resolve the long-term
future of the park-and-ride facility at the Gateway transit center to reinforce
(CD), (H), (B), (T): ideas include using the former Rocky Butte jail site for parking, expanding or replacing park-
(t)7/10

Gateway Regional Center Report to Metro
January 2005 80
# Action Est. Cost
Time-frame
Imple-mentors/ Partners
Sourceof Funds
Committee Notes*
Priority**
the regional center’s long-term vitality. (TSP)
• Consolidate park-and-ride parking into a parking structure(s). (OGCP)
• Request that TriMet and C-Tran establish a program to identify parking alternatives for park-and-ride commuters. (OGCP)
• Consider implementing parking controls in the vicinity of light rail stations where commuter parking is impacting nearby residential neighborhoods. (TSP)
and-ride capacity east of the transit center, etc.
6 Create a transportation management plan for the district to include a parking management plan. (OGCP)
2/45
7 Improve transportation data to bring up-to-date number of parking spaces, etc. (OGCP)
2/10
8 Re-evaluate options for hastening the transition of parking from surface lots to structured garages. (OSECP)
2010-2024
PDC, PDOT, TriMet, BOP, Metro
9 Eliminate on-street parking from the north side of Irving Street. (OGCP)
(t)25/45
10 Expand the Gateway Pedestrian District to include the entire regional center. (OSECP)
2009 PDOT
11 Improve pedestrian access at the light rail transit stations by adding local street connections and improvements, including enhanced crossings and wider sidewalks. (TSP)
12 Add pedestrian facilities, including sidewalks and crossings, and enhancements, such as street trees and drinking fountains, to provide good access within neighborhoods and to Gateway and other commercial areas. (TSP)
13 Improve pedestrian (CD): Install (t)20/45

Gateway Regional Center Report to Metro
January 2005 81
# Action Est. Cost
Time-frame
Imple-mentors/ Partners
Sourceof Funds
Committee Notes*
Priority**
connections across all arterials. (OGCP)
landscaped safety islands
14 Improve pedestrian connections between the transit center and the Gateway Shopping Center. (OGCP)
(t)35/45
15 Provide an off-street pathway and reasonable public access between the neighborhood south of SE Market, through the medical center campus, and extending through the commercial area south of SE Washington. (TSP)
16 Study the feasibility of alternative bike routes in the district. (OGCP)
(t)7/10
17 Improve crossings for cars and pedestrians over MAX tracks on Burnside commensurate with new through-streets at 100th and 101st.
(t)31/45
18 Embed light rail tracks into the Burnside right-of-way as is the case in Downtown Portland. (OSEC)
2010-2024
TriMet
19 Create a Transportation Management Association. (OSECP)
PDC, PDOT, TriMet, Business Association, Metro
MTIP
20 Create partnerships with area businesses to investigate the feasibility/support for the creation of a Gateway Transportation Management Association. (OGCP)
6 of 10
21 Study the feasibility of opening NE 99th to the north, improving NE Multnomah between Fred Meyer and Mervyns, and creating NE 97th between Pacific and Glisan). (OGCP)
(T): also to be studied: make 99th north of Pacific one-way going north; utilize 97th for direct freeway access only (B): does NOT recommend improving NE Multnomah
Not prioritized
22 Allow northbound traffic on 102nd to make a left turn on to
(t)18/45

Gateway Regional Center Report to Metro
January 2005 82
# Action Est. Cost
Time-frame
Imple-mentors/ Partners
Sourceof Funds
Committee Notes*
Priority**
Weidler. (OGCP) 23 Improve north/south and
east/west connectivity in the district by improving the street grid in a flexible manner while respecting existing housing and businesses. (OGCP)
15/45
24 Internal Circulation: • Consider building a trolley
or similar circular internal transit system between the northern and southern ends of the regional center. (OSECP)
• Improve internal circulation and enhance Gateway’s identity with a district shuttle or circulator like special buses, vans, or a trolley. (OGCP)
2010-2024
TriMet, Metro
(T): Implementation is key and business owners must be involved (SC); This goal might be achievable with a combination of existing transit service improvements and special street furniture, stations, shelters, etc.
11/45
25 Enhance travel lane demarcation to improve safety for motorists, cyclists, and pedestrians. (OGCP)
42/45
26 Conduct a 102nd Avenue study to determine best options for use of the right-of-way (e.g. on-street parking, bike lanes, pedestrian amenities, etc.). (OGCP)
(t)4/10
27 Establish planting program for the I-205 right-of-way in the district. (OGCP)
Not prioritized
28 Traffic patterns: • Improve traffic patterns in
the district associated with freeway use. (OGCP)
• Study traffic patterns beyond the Opportunity Gateway study area in assessing Gateway’s
(T), (SC): ideas include creating I-84 on and off-ramps between 43rd and 181st in places other than Gateway,
(t)27/45 1/10

Gateway Regional Center Report to Metro
January 2005 83
# Action Est. Cost
Time-frame
Imple-mentors/ Partners
Sourceof Funds
Committee Notes*
Priority**
transportation needs, impacts, plans, etc. (OGCP)
direct I-205 access from Stark, improvements to the Glisan interchange, etc
29 Nurture existing community interest groups in all future transportation planning for Gateway. (OGCP)
(t)8/10
30 Realign the intersection of NE 99th Avenue and NE Glisan.
2009 PDOT MTIP
Land Use/Development 31 Encourage active, mixed-use
development in and around the transit center. (OGCP)
(T): support parking structures at the transit center; silent on design and mixed-use program. (H), (CD), (B): Seek to incorporate ground floor commercial uses, hotel, restaurants, office, etc.
(t)4/45
32 Support the near-term redevelopment of all four corners at the 99th and Pacific intersection.
(t)7/45
33 Develop the Gateway Shopping Center more intensely, while making it more attractive, safer, pedestrian friendlier, and better connected to the transit center. (OGCP)
(t)31/45
34 Reintroduce small ground floor shops (including a bakery) around the Gateway Transit Center and elsewhere in the district. (OGCP)
9/45
35 Stimulate transit-oriented, mixed use housing with strong pedestrian connections from Halsey to the Mall 205 site. (OGCP)
14/45
36 Capitalize on the ground floor (t)20/45

Gateway Regional Center Report to Metro
January 2005 84
# Action Est. Cost
Time-frame
Imple-mentors/ Partners
Sourceof Funds
Committee Notes*
Priority**
retail potential of 102nd. (OGCP)
37 Capitalize on redevelopment opportunities along the Halsey-Weidler couplet. (OGCP)
(t)31/45
38 Locate a City Permit Center in the district, considering the advantages of a location near a light rail station. (OGCP)
Not prioritized
39 Locate a Civic Center in the district, considering the advantages of a location near a light rail station. (OGCP)
(t)20/45
40 Locate a high-end hotel somewhere in the district. (OGCP)
(t)35/45
41 Encourage more restaurants, theatres, and other entertainment and cultural venues which provide opportunity for socializing. (OGCP)
(t)31/45
42 Encourage a restaurant zone along the Stark-Washington couplet by encouraging development of a variety of restaurants (excluding fast-food chains). (OGCP)
(H): zone should not be limited to Stark Washington, rather should be throughout the business shuttle area
(t)38/45
43 Locate regional destinations on regional streets, separating these uses and their traffic from local uses and traffic. (OGCP)
(t)38/45
44 Support regulation that enables the local community to prohibit adult business from locating in the district. (OGCP)
(t)2/10
Education 45 Locate an education center in
the district, potentially to include a Civic Center or other large public meeting space. (OGCP)
(CD): should be in a light rail station area
12/45
Image/Identity/Livability 46 Create public art and unique
identity shelters at each light rail transit stop. (OSECP)
On-going
TriMet
47 Construct physical gateways at entry points in the district, to
(t)23/45

Gateway Regional Center Report to Metro
January 2005 85
# Action Est. Cost
Time-frame
Imple-mentors/ Partners
Sourceof Funds
Committee Notes*
Priority**
strengthen identity. (OGCP) 48 Identify view corridors to Mt.
Hood, Mt. St. Helens, and the West Hills. Amend the Scenic Resources Protection Plan to include the view corridors.
6-20 years
BOP
49 Create and hang banners for city, Gateway, and other special events. (OSECP)
On-going
HNA, GABA, PDOT, PAC
50 Utlities: • Place overhead utility
wires underground, in conjunction with planned street improvements. (OSECP)
• Underground all utilities in the district. (OGCP)
On-going
PDOT, Private, Utility Providers
(t)40/45
51 Encourage the use of private sector partnerships to assist with funding for public amenities (eg. the shuttle, Civic Center, etc)
10/10
52 Encourage and support architectural diversity. (OGCP)
(t)27/45
53 Encourage a distinctive (landmark) architecture for the Mall 205 site. (OGCP)
(t)25/45
54 Prohibit electronic billboards in the district. (OGCP)
(t)8/10
Parks and Open Space 55 Create a linear set of park
blocks between the Gateway and Mall 205 Shopping Centers. (OSECP)
2009 BOP, Parks
56 Support an open space strategy that relies on noncontiguous parks and open space throughout the district. (OGCP)
(B): use small neighborhood parks, additional trees appropriate to their location, and a selection of theme trees on different streets. (CD): use trees, flowers, and other natural elements in creating new identity
(t)7/45

Gateway Regional Center Report to Metro
January 2005 86
# Action Est. Cost
Time-frame
Imple-mentors/ Partners
Sourceof Funds
Committee Notes*
Priority**
57 Expand the Community Center to include an indoor pool. (OGCP)
1/08 BOPR (t)35 of 45
58 Support the freeway trail along the I-205 right-of-way to support walking, biking, jogging. (OGCP)
17/45
59 Complete the swale between Mall 205 and Adventist Medical Center. (OSECP)
2009 Private
60 Create a 3-acre active park south of Burnside and a 2-acre passive park north of Burnside. (OGCP)
(t)27/45
61 Provide adequate parking and encourage shared parking strategies for ballfields or other active park-related facilities. (OGCP)
(t)18/45
62 Trees: • Insofar as possible, retain
existing old-growth trees, especially the historic groves of fir trees. (OSECP)
• Protect existing stands of fir trees and use various types of trees and landscaping to enhance Gateway’s image. (OGCP)
On-going
Private, PAC
(H): also preserve views of trees
16/45
63 Support the community garden proposed for one park. (OGCP)
(t)40/45
64 Direct the City to purchase and beautify the traffic island at the west end of the Halsey-Weidler couplet. (OGCP)
(t)27/45
65 Encourage property owners to construct publicly-accessible fountains, water features, and courtyards on private property. (OSECP)
On-going
Private/ PAC
Environment and Sustainability 66 Evaluate the use of “water
quality friendly” street designs, such as porous pavement, depressed planter strips, street trees, or Metro’s Green Street design standards. (OSECP)
2010-2024
BES, PDOT
67 Emphasize water conservation and stormwater integration in both public and private
2009 Private, BES, OSD,

Gateway Regional Center Report to Metro
January 2005 87
# Action Est. Cost
Time-frame
Imple-mentors/ Partners
Sourceof Funds
Committee Notes*
Priority**
construction projects. (OSECP)
PAC
68 Encourage environmentally-sensitive landscaping with materials that emphasize water quality, water conservation, and stormwater abatement. (OSECP)
On-going
PDC, PAC, BES, OSD, Private
69 Promote energy-efficiency in pubic and private developments throughout the regional center. (OSECP)
On-going
PDC, OSD, PAC
70 Incorporate creative storm water management strategies in the district. (OGCP)
(SC): These could be special plantings, greenways, water features, roof treatments etc.
Not prioritized
Economic Development 71 Undertake an I-205 Corridor
study to help understand and identify potential markets for Airport Way, Gateway, and Lents. (OGCP)
(t)4/10
72 Encourage the development of Gateway as an employment center with abundant living wage jobs. (OGCP)
6/10
73 Maintain and encourage the availability of jobs and business opportunities in the Employment zone. (OGCP)
The employment zone is understood to be generally between Stark and Burnside, from the freeway to 102nd. It was rezoned Central Employment, EX, in May 2004.
6 of 45
Housing 74 Construct housing in the 102nd
Avenue transit station area for all income levels, including units affordable for low to moderate income households.
2009 PDC

Gateway Regional Center Report to Metro
January 2005 88
# Action Est. Cost
Time-frame
Imple-mentors/ Partners
Sourceof Funds
Committee Notes*
Priority**
(OSECP) 75 Encourage opportunities for
housing ownership throughout the district for people of all income levels. (OGCP)
7/10
* Committees: CD = Community Design; T = Transportation; B = Business; H = Housing; SC = Steering Committee
** Priorities are ranked separately in each section (t) = tie

Gateway Regional Center Report to Metro
January 2005 89
Abbreviations BES Bureau of Environmental Services BOP Bureau of Planning BOPR Bureau of Parks and Recreation GABA Gateway Area Business Association HNA Hazelwood Neighborhood Association OGCP Opportunity Gateway Concept Plan and Revitalization Strategy OSECP Gateway Regional Center Subarea Policy of the Outer Southeast Community
Plan PAC Gateway Regional Center Urban Renewal Area Program Advisory Committee PDC Portland Development Commission PDOT Portland Office of Transportation TSP Transportation System Plan (Transportation Element of the Comprehensive
Plan)

Gateway Regional Center Report to Metro
January 2005 90

Gateway Regional Center Report to Metro
January 2005 91
Appendix Bibliography • Bureau of Planning. Adopted Gateway Planning Regulations Project: Revisions to Policy,
Comprehensive Plan Designations, and the Zoning Code. May 2004.
• Bureau of Planning. Adopted Gateway Regional Center Design Guidelines. May 2004.
• Bureau of Planning. Adopted Gateway Planning Regulations Project: Findings. May 2004.
• Hovee, Eric & Darren Wertz (E.D. Hovee & Co), Project Memorandums to Kenny Asher, Portland Development Commission
Task 1: Opportunity Gateway Market Study Update, November 17, 2000 Task 2: Opportunity Gateway Jobs Memo (Final Draft), September 19, 2000 Task 3: Implementation Scenarios, October 27, 2000 Task 4: Gateway Urban Renewal District Findings, November 16, 2000
• Portland Development Commission. Adopted Gateway Regional Center Urban Renewal Plan. June 2001.
• Portland Development Commission. Draft The Gateway Area – Current Conditions and Economic Opportunities. 2004. (This material is in progress; it is being prepared and deliberated by the Gateway Economic Development Working Group.)
• Portland Development Commission. Draft Gateway Regional Center: Housing Market Study. 2002. Unpublished.
• Portland Development Commission. Gateway Regional Center Urban Renewal Area Housing Strategy. May 2003. (Adopted by Portland Development Commission)
• Portland Development Commission and Opportunity Gateway Program Advisory Committee. Opportunity Gateway Concept Plan and Redevelopment Strategy: A Guide to Growth for Portland’s only Regional Center. February 2000.
• Portland Development Commission. Opportunity Gateway Urban Renewal Feasibility Study. October 2000.
• Portland Development Commission. Report on the Gateway Regional Center Urban Renewal Plan. June 2001.
• Portland Development Commission. Gateway Urban Renewal Area: Base Data and Trends. September 2002.
• Portland Office of Transportation. Transportation System Plan. October 2002.

Gateway Regional Center Report to Metro
January 2005 92
Appendix Public Involvement Summary 1992 – August 1997 • The initial impetus for designating Gateway as a regional center came from the Outer
Southeast Community Plan (OSECP). Begun in 1992, the OSECP process coincided with Metro’s 2040 Growth Concept process. Metro designated an area around the Gateway Transit Center as a regional center in December 1995. The Portland City Council adopted the Outer Southeast Community Plan in January 1996.
• In 1995, the Bureau of Planning (BOP) submitted a TGM grant request to fund a Gateway Regional Center Development Plan. The grant application was approved with a completion date of June 30, 1997.
• In early December, 1996, BOP submitted a request for architectural and technical assistance for the “Prunedale” area of Gateway through the University of Oregon School of Architecture. The request was granted and, in January 1997, two students were assigned to the project.
• Due to staff changes at the Bureau of Planning, the TGM project didn’t begin until March, 1997. The firm of KPFF Consulting Engineers was hired as the prime consultant.
• To help advise the staff and consultants on various aspects of the project, BOP created a task force composed of representatives from the Hazelwood Neighborhood Association, Gateway Area Business Association, David Douglas School District, City of Portland, State of Oregon, Multnomah County, Metro, and TriMet.
• BOP held three public information meetings in May and June. The Bureau sent notices to all property owners announcing the first open house. Both workshops and the open house, as well as at least one task force meeting, were advertised in the Oregonian’s Mid-County Section, along with accompanying articles.
• The consultants completed the “Gateway Regional Center Development Plan” in August. Task Force members felt the public had too little time to become involved in the process and essentially no time to respond to the results. Therefore, the development plan was not presented to Council; rather, it was used as the basis for continued work.
August 1997 – June 1999 • In the fall of 1997 the Portland Development Commission (PDC) and the Portland Office of
Transportation (PDOT) were awarded a $170,000 TGM grant to prepare an overall Redevelopment Strategy for the Gateway Regional Center area, building on the earlier work.
• PDC formed a management team with staff from PDOT, Bureau of Planning (BOP), and Portland Parks and Recreation. The project was renamed Opportunity Gateway.
• The consultant team of Fregonese-Calthorpe was hired to carry out the technical research and analysis.
• The management and consultant teams together appointed a Steering Committee of interested parties and other stakeholders, and a Technical Advisory Committee of other city, regional and state staff.
• In the spring and summer of 1998, management and consultant team members met with individual property owners in the district, including the Elks Club, Fred Meyer, PacTrust, and Adventist Medical Center.
• An introductory workshop was held at the hospital in June, at which approximately 60 members of the community participated.

Gateway Regional Center Report to Metro
January 2005 93
• PDC developed a newsletter and created the Opportunity Gateway Hotline. • In November 1998 several staff members, consultants, and steering committee members
traveled to Berkeley, California to view several redevelopment and mixed-use projects and hold an in-house workshop with Peter Calthorpe and his staff.
• The first public workshop was held in December 1998, with two alternative concepts presented for the public to consider.
• An open-mike forum was held in February 1999 to allow community members to speak directly to City staff about the regional center.
• Four citizen-based interest groups, comprised of 8-12 citizens representing many of the east Portland neighborhoods, were formed, each concentrating on a different aspect of Gateway’s growth: Transportation, Housing, Business, and Community Design. The four groups met 4-5 times in the spring, formulating recommendations for the Steering Committee on the Concept Plan.
• The final open house, which presented the results of the previous workshops, the survey, the four interest groups, and consultant studies, was held in May 1999. The boundary was firmed up by this time; it would not include any land zoned for single family housing.
July 1999 - June 2000 • PDC reformed the Steering and Technical Advisory Committees into the Opportunity
Gateway Program Advisory Committee (PAC). Membership was broadened to include six neighborhood associations; two business associations; residents, property owners, and businesses of Gateway and the greater East Portland area; two school districts and Adventist Academy; two hospitals; City of Portland; State of Oregon; Multnomah County; Metro, and TriMet. At least 10 minutes, sometimes considerably more, was reserved during each meeting for public comment. Minutes of each meeting were made available at subsequent meetings.
• Dick Cooley, developer, property owner, and former resident of East Portland, was invited to join the PAC, which then chose him to be its chair.
• A full-scale outreach process was instituted with the establishment of a separate Community Involvement Subcommittee.
• PDC and a citizen-led subcommittee redrafted the consultant’s report into the Opportunity Gateway Concept Plan and Redevelopment Strategy, which was approved by City Council in February 2000.
• A BOP project to re-evaluate Gateway’s land use regulations began in late 1999, but was put on the back burner in early 2000 while the PAC and the community evaluated funding options to implement the Concept Plan.
• The PAC prepared and facilitated forums for public information and input. These included forums on funding options, including urban renewal, education, transportation, design review, and open space.
• In May 2000 the PAC requested an evaluation of the feasibility and desirability of making the Gateway Regional Center an urban renewal district.
July 2000 - June 2001 • An Outreach Plan was developed in July 2000; its goals were to inform and engage those
people most immediately impacted by Opportunity Gateway and the Urban Renewal feasibility study, to encourage feedback and involvement by affected property owners and business owners and to maximize the effectiveness of the Program Advisory Committee’s outreach efforts.
• Beginning in August, the PAC convened 13 meetings for property and business owners and renters within the Gateway boundary to discuss possible urban renewal.

Gateway Regional Center Report to Metro
January 2005 94
• All property and business owners within the project boundary who did not attend a precinct meeting were mailed information about Opportunity Gateway, including a schedule of future meetings.
• In September 2000 a survey of businesses within the proposed boundary was completed. • In October 2000 PDC staff completed the Urban Renewal Feasibility Study. • In November 2000, the PAC directed PDC to fully fund a planning process that would lead
to the type of development desired in the Concept Plan. Also that month a two-hour public meeting attended by more than 100 people was held to present information about the urban renewal feasibility study and get feedback from the community.
• In December 2000 the PAC established the Design and Development (D&D) Subcommittee to work with BOP staff on the Gateway Planning Regulations Project (planning project). In January 2001 PDC and the PAC requested BOP to limit its public outreach in order to focus attention on the possible creation of a Gateway Regional Center urban renewal district.
• Between January 24 and February 5, PDC and the PAC hosted four workshops designed to elicit feedback from stakeholders about a possible urban renewal district.
• Members of the Design and Development, Parks, Transportation, and Education Subcommittees took two tours to other communities and development projects and met jointly with a design consultant. From these came a set of design principles that become the basis for the Gateway Regional Center Design Guidelines.
• PDC staff made presentations regarding urban renewal to approximately 160 people at seven neighborhood and civic meetings during January, February, and March.
• A newsletter was sent out monthly to the project mailing list of area residents and businesses to provide updates on the urban renewal planning process.
• Seven “listening posts” and distribution sites were held at well-trafficked Gateway locations to distribute and elicit information about the project.
• The PAC held informational meetings on urban renewal, condemnation, relocation benefits, and financing. Over 240 people attended these meetings.
• The D&D Subcommittee met monthly between January and June. • Open, public meetings were held by the Portland Development Commission (April 12 and
May 9), the Portland Planning Commission (May 8 and 22), and City Council (June 13 and 20). City Council adopted the Gateway Regional Center URA on June 20.
July 2001 - June 2002 • When the PAC started up again in September, the same logistics continued – i.e., allowance
of time for public comment, availability of minutes, and invitations to all meetings to those on the project mailing list.
• Between August and October BOP staff held four neighborhood walks as part of the planning project.
• PDC created a Gateway URA website. • The D&D Subcommittee met monthly between July and February. • In October BOP staff held the first set of public workshops for the planning project. • Between fall and spring, PDC contracted with the University of Oregon School of
Architecture to use graduate students in architecture to address key design and planning issues in Gateway. Students held two slide show presentations for members of the general public.
• In January 2002, in response to the Oregon Supreme Court’s decision in Shilo vs. Multnomah County et al., PDC put all projects, including Gateway, on hold.

Gateway Regional Center Report to Metro
January 2005 95
July 2002 - June 2003 • PDC and the PAC continued to implement the Opportunity Gateway Concept Plan and the
Gateway Regional Center URA Plan. As possibilities for property acquisition, project construction, or other options arose, the PAC was brought into the discussion.
• Subcommittee chairs met on a monthly basis. • Transportation, Education, Housing, and Open Space subcommittees met on a regular
basis. • In September 2002, PDC and the PAC restarted the Gateway Planning Regulations Project. • The D&D Subcommittee met monthly between October and March. Meetings were open to
the public and were announced in all PDC notices to its mailing list. • In February and March the second of workshops for the planning project were held. • In June two open houses for the planning project were held. July 2003 – June 2004 • The final meeting of the D&D Subcommittee was held in July. • Between July and September BOP staff met with stakeholders on the planning project. • In August all elements of the planning project were put on the Planning Bureau’s website. • Open, public and noticed meetings for the planning project were held by the Portland Design
Commission (September 18, February 5, and February 19), the Portland Planning Commission (September 30, January 27, and March 9), and City Council (April 21, May 12, and May 19). City Council adopted the Gateway Planning Regulations Project on May 19.
• PAC meetings continued to be held monthly. July – December 2004 • PAC meetings continued to be held monthly, as were the Chairs meetings. • In July the Gateway Transit Center Development Proposal was presented to the public. • In August the Economic Development Workgroup and the Parks Subcommittee met. • Transportation Subcommittee meetings were held periodically to discuss the engineering
and design of 102nd.