gateway initiative
DESCRIPTION
GATEWAY INITIATIVE. Hillsborough Community College Fall 2007 Preliminary Results A Formative Evaluation. Preliminary Formative Analysis Fall 2007 Results. To provide feedback to participating faculty as quickly as possible ( Got Class, p. 40). - PowerPoint PPT PresentationTRANSCRIPT
GATEWAY GATEWAY INITIATIVEINITIATIVE
Hillsborough Community Hillsborough Community CollegeCollege
Fall 2007 Preliminary ResultsFall 2007 Preliminary Results
A Formative EvaluationA Formative Evaluation
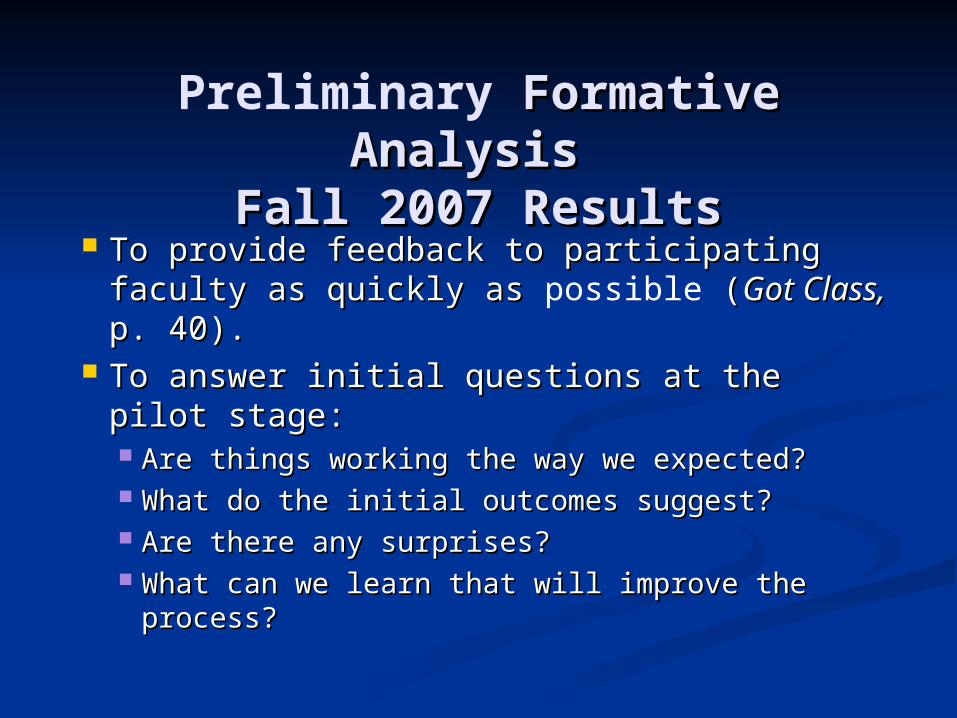
Preliminary Formative Analysis Formative Analysis
Fall 2007 ResultsFall 2007 Results To provide feedback to participating faculty To provide feedback to participating faculty
as quickly as as quickly as possible ( (Got Class, Got Class, p. 40).p. 40). To answer initial questions at the pilot To answer initial questions at the pilot
stage:stage: Are things working the way we expected?Are things working the way we expected? What do the initial outcomes suggest?What do the initial outcomes suggest? Are there any surprises?Are there any surprises? What can we learn that will improve the What can we learn that will improve the
process?process?

FALL 2007 FALL 2007 INTERVENTIONS - TWO PILOT COURSES:INTERVENTIONS - TWO PILOT COURSES:
MAC-1105 (College Algebra)MAC-1105 (College Algebra) Cumulative HomeworkCumulative Homework In-class Group ReviewIn-class Group Review
PSY-2012 (General Psychology)PSY-2012 (General Psychology) Team-TeachingTeam-Teaching Use of Clickers (Electronic Student Response System) Use of Clickers (Electronic Student Response System)
in the classroomin the classroom
BASELINE DATA – THREE COURSES:BASELINE DATA – THREE COURSES: ACG-2021 (Financial Accounting)ACG-2021 (Financial Accounting) CGS-1000 (Intro. To Computers & Technology)CGS-1000 (Intro. To Computers & Technology) ECO-2021 (Principles of Microeconomics)ECO-2021 (Principles of Microeconomics)

Data Collection StrategyData Collection Strategy
Pretest and PosttestPretest and Posttest Questions addressed identified learning outcomesQuestions addressed identified learning outcomes Three scores for each student:Three scores for each student:
Pretest ScorePretest Score Posttest ScorePosttest Score Gain Score (Posttest Score – Pretest Score)Gain Score (Posttest Score – Pretest Score)
Students’ Grades in the Course were Not AffectedStudents’ Grades in the Course were Not Affected Surveys of Student CharacteristicsSurveys of Student Characteristics
Descriptive and Demographic InformationDescriptive and Demographic Information Students’ Perceptions Students’ Perceptions
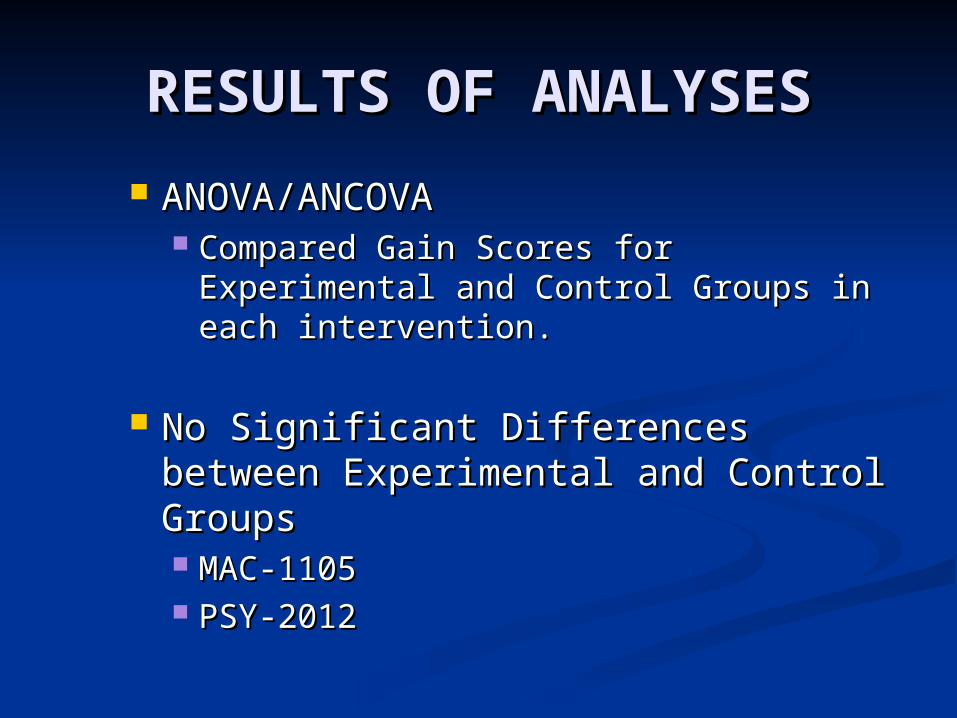
RESULTS OF ANALYSESRESULTS OF ANALYSES
ANOVA/ANCOVAANOVA/ANCOVA Compared Gain Scores for Compared Gain Scores for
Experimental and Control Groups in Experimental and Control Groups in each intervention.each intervention.
No Significant Differences between No Significant Differences between
Experimental and Control GroupsExperimental and Control Groups MAC-1105MAC-1105 PSY-2012PSY-2012

PRETEST/POSTTEST COMPARISONSPRETEST/POSTTEST COMPARISONS
MAC-1105MAC-1105
MEAN SCORES AT PRETEST AND POSTTEST GROUP REVIEW INTERVENTION
2.98%
27.30%27.73%
5.00%
0.0%
10.0%
20.0%
30.0%
40.0%
50.0%
60.0%
70.0%
80.0%
90.0%
100.0%
Pretest Posttest
Experimental Control
MEAN SCORES AT PRETEST AND POSTTEST CUMULATIVE HOMEWORK INTERVENTION
4.56%
26.44%25.21%
3.94%0.0%
10.0%
20.0%
30.0%
40.0%
50.0%
60.0%
70.0%
80.0%
90.0%
100.0%
Pretest Posttest
Experimental Control

MEAN SCORES AT PRETEST AND POSTTEST - CLICKERS INTERVENTION
50.8%
67.2%
49.9%
67.3%
0.0%
10.0%
20.0%
30.0%
40.0%
50.0%
60.0%
70.0%
80.0%
90.0%
100.0%
PRETEST POSTTEST
TEST
Experimental Control
MEAN SCORES AT PRETEST AND POSTTESTTEAM-TEACHING
58.4%
48.1%
65.5%
55.6%
0.0%
10.0%
20.0%
30.0%
40.0%
50.0%
60.0%
70.0%
80.0%
90.0%
100.0%
PRETEST POSTTEST
Experimental Control
PRETEST/POSTTEST COMPARISONSPRETEST/POSTTEST COMPARISONSPSY-2012PSY-2012

SURPRISE!!!SURPRISE!!!
Distributions of Gain Scores Distributions of Gain Scores revealed some “negative gains.” revealed some “negative gains.” GAIN SCORE = (Posttest Score – GAIN SCORE = (Posttest Score –
Pretest Score)Pretest Score) These students scored higher on the These students scored higher on the
pretest than on the posttest.pretest than on the posttest.
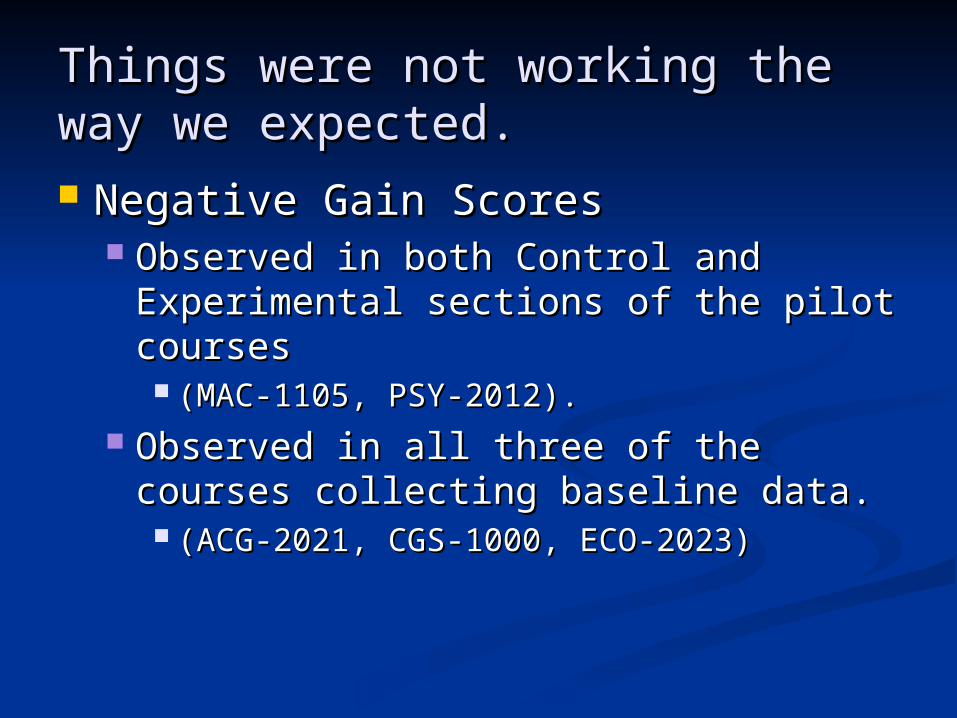
Things were not working the way Things were not working the way we expected.we expected. Negative Gain Scores Negative Gain Scores
Observed in both Control and Observed in both Control and Experimental sections of the pilot Experimental sections of the pilot courses courses (MAC-1105, PSY-2012).(MAC-1105, PSY-2012).
Observed in all three of the courses Observed in all three of the courses collecting baseline data.collecting baseline data. (ACG-2021, CGS-1000, ECO-2023)(ACG-2021, CGS-1000, ECO-2023)
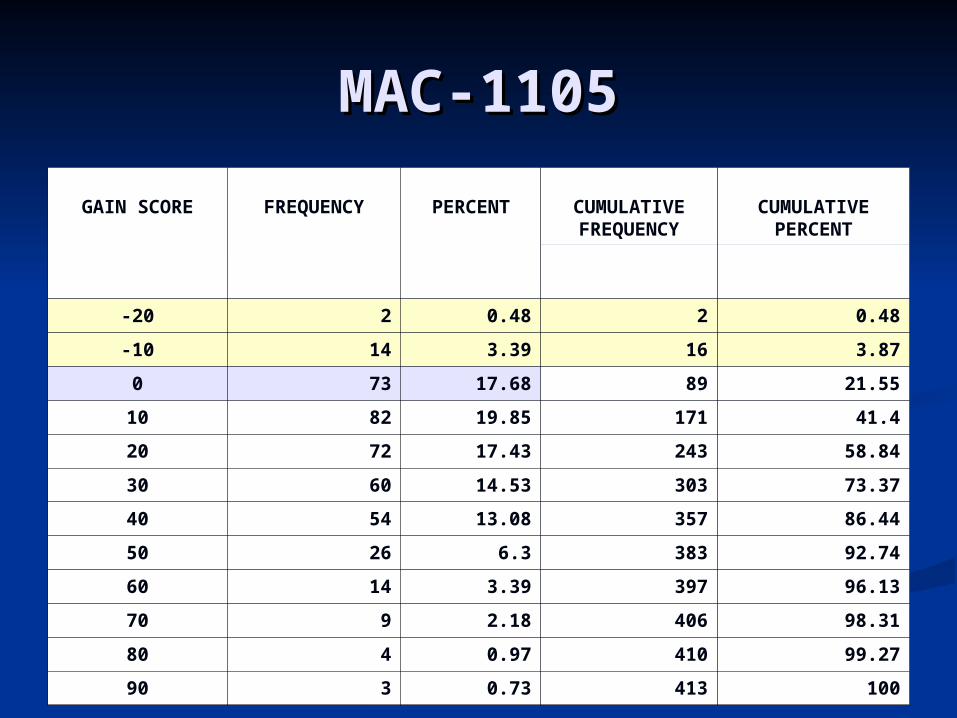
MAC-1105MAC-1105
GAIN SCORE FREQUENCY PERCENT CUMULATIVEFREQUENCY
CUMULATIVEPERCENT
-20 2 0.48 2 0.48
-10 14 3.39 16 3.87
0 73 17.68 89 21.55
10 82 19.85 171 41.4
20 72 17.43 243 58.84
30 60 14.53 303 73.37
40 54 13.08 357 86.44
50 26 6.3 383 92.74
60 14 3.39 397 96.13
70 9 2.18 406 98.31
80 4 0.97 410 99.27
90 3 0.73 413 100
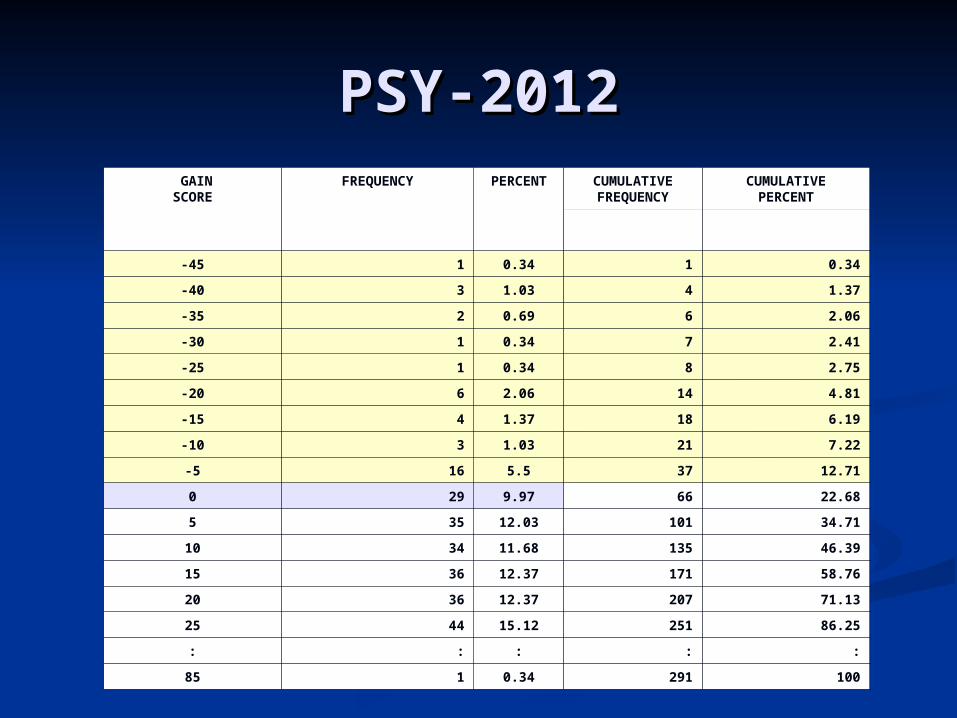
PSY-2012PSY-2012 GAINSCORE
FREQUENCY PERCENT CUMULATIVEFREQUENCY
CUMULATIVEPERCENT
-45 1 0.34 1 0.34
-40 3 1.03 4 1.37
-35 2 0.69 6 2.06
-30 1 0.34 7 2.41
-25 1 0.34 8 2.75
-20 6 2.06 14 4.81
-15 4 1.37 18 6.19
-10 3 1.03 21 7.22
-5 16 5.5 37 12.71
0 29 9.97 66 22.68
5 35 12.03 101 34.71
10 34 11.68 135 46.39
15 36 12.37 171 58.76
20 36 12.37 207 71.13
25 44 15.12 251 86.25
: : : : :
85 1 0.34 291 100
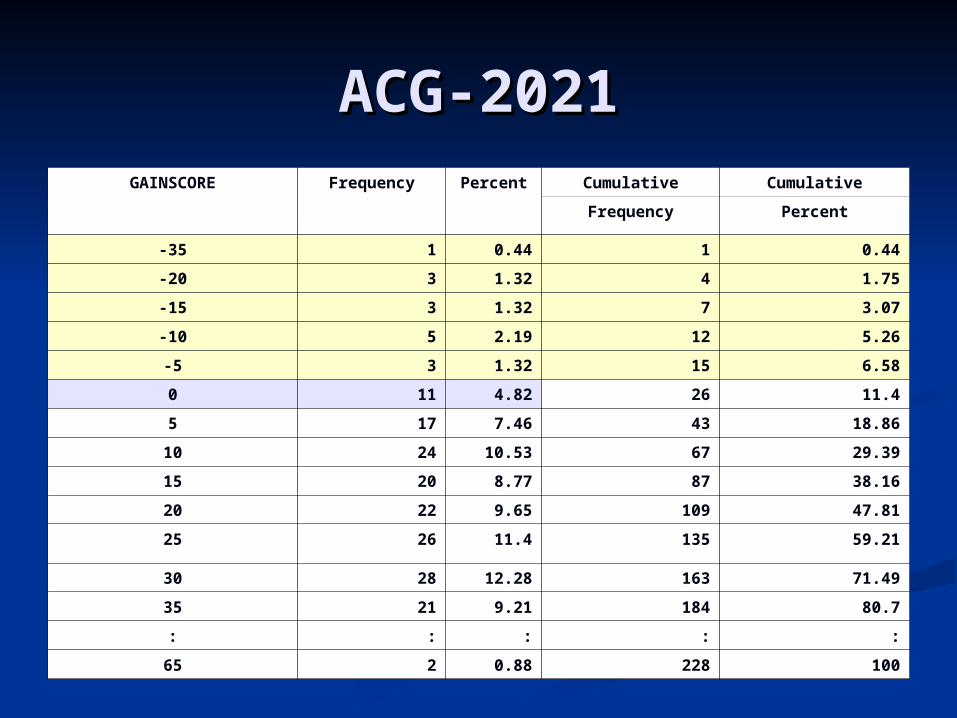
ACG-2021ACG-2021GAINSCORE Frequency Percent Cumulative Cumulative
Frequency Percent
-35 1 0.44 1 0.44
-20 3 1.32 4 1.75
-15 3 1.32 7 3.07
-10 5 2.19 12 5.26
-5 3 1.32 15 6.58
0 11 4.82 26 11.4
5 17 7.46 43 18.86
10 24 10.53 67 29.39
15 20 8.77 87 38.16
20 22 9.65 109 47.81
25 26 11.4 135 59.21
30 28 12.28 163 71.49
35 21 9.21 184 80.7
: : : : :
65 2 0.88 228 100
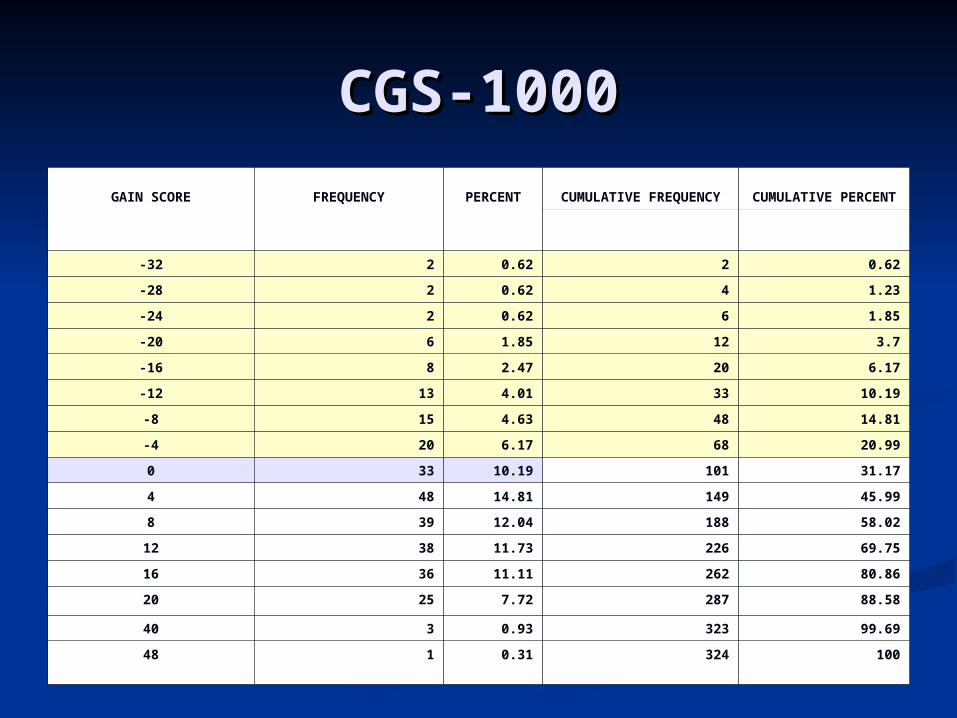
CGS-1000CGS-1000
GAIN SCORE FREQUENCY PERCENT CUMULATIVE FREQUENCY
CUMULATIVE PERCENT
-32 2 0.62 2 0.62
-28 2 0.62 4 1.23
-24 2 0.62 6 1.85
-20 6 1.85 12 3.7
-16 8 2.47 20 6.17
-12 13 4.01 33 10.19
-8 15 4.63 48 14.81
-4 20 6.17 68 20.99
0 33 10.19 101 31.17
4 48 14.81 149 45.99
8 39 12.04 188 58.02
12 38 11.73 226 69.75
16 36 11.11 262 80.86
20 25 7.72 287 88.58
40 3 0.93 323 99.69
48 1 0.31 324 100
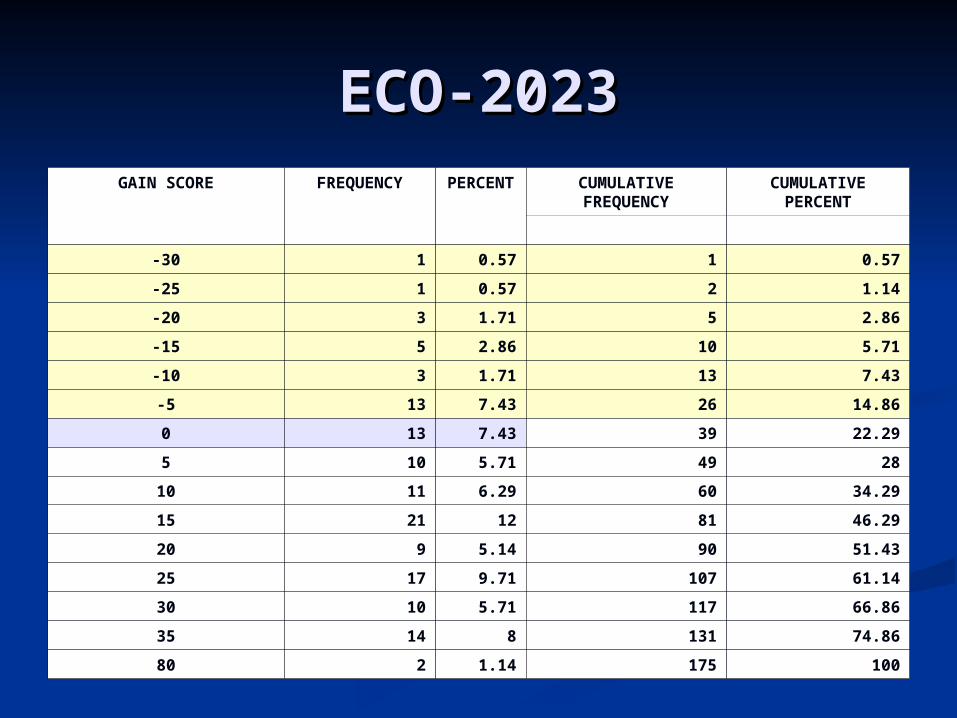
ECO-2023ECO-2023GAIN SCORE FREQUENCY PERCEN
TCUMULATIVE FREQUENCY
CUMULATIVE PERCENT
-30 1 0.57 1 0.57
-25 1 0.57 2 1.14
-20 3 1.71 5 2.86
-15 5 2.86 10 5.71
-10 3 1.71 13 7.43
-5 13 7.43 26 14.86
0 13 7.43 39 22.29
5 10 5.71 49 28
10 11 6.29 60 34.29
15 21 12 81 46.29
20 9 5.14 90 51.43
25 17 9.71 107 61.14
30 10 5.71 117 66.86
35 14 8 131 74.86
80 2 1.14 175 100

Because it did not affect their final Because it did not affect their final grades, students were not taking the grades, students were not taking the posttest seriously.posttest seriously. Tired of being testedTired of being tested Ready for Winter BreakReady for Winter Break
No incentive to do their bestNo incentive to do their best Marking answers at random (all 1s, all Marking answers at random (all 1s, all
5s, patterns)5s, patterns) Leaving answers blankLeaving answers blank
What Went Wrong?What Went Wrong?
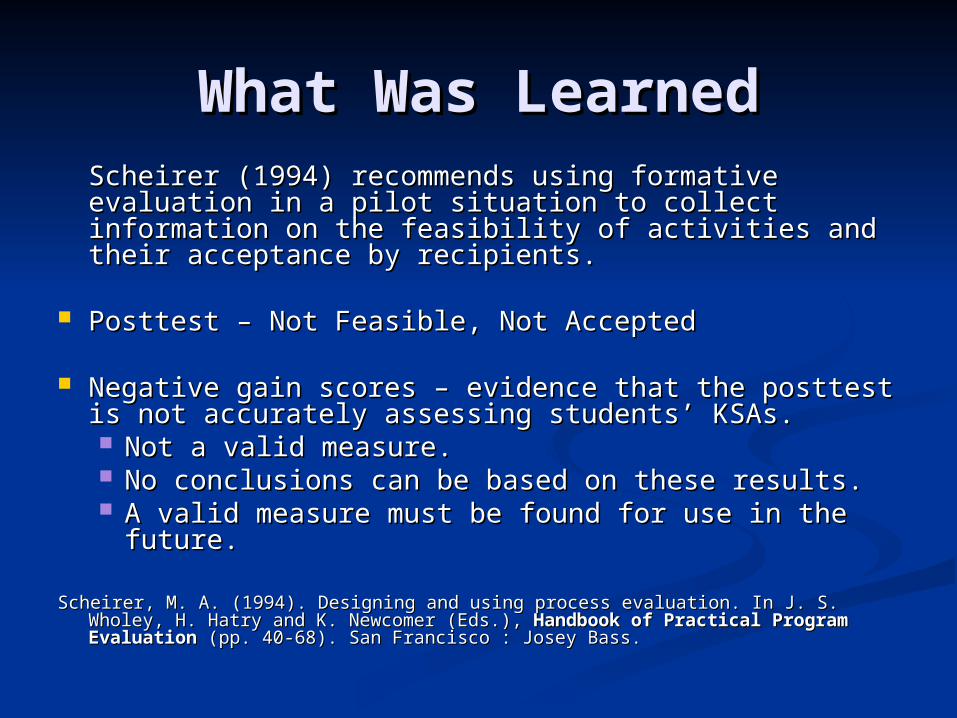
Scheirer (1994) recommends using formative Scheirer (1994) recommends using formative evaluation in a pilot situation to collect information evaluation in a pilot situation to collect information on the feasibility of activities and their acceptance by on the feasibility of activities and their acceptance by recipients.recipients.
Posttest – Not Feasible, Not AcceptedPosttest – Not Feasible, Not Accepted
Negative gain scores – evidence that the posttest is Negative gain scores – evidence that the posttest is not accurately assessing students’ KSAs.not accurately assessing students’ KSAs. Not a valid measure. Not a valid measure. No conclusions can be based on these results.No conclusions can be based on these results. A valid measure must be found for use in the A valid measure must be found for use in the
future.future.
Scheirer, M. A. (1994). Designing and using process evaluation. In J. S. Wholey, H. Scheirer, M. A. (1994). Designing and using process evaluation. In J. S. Wholey, H. Hatry and K. Newcomer (Eds.), Hatry and K. Newcomer (Eds.), Handbook of Practical Program EvaluationHandbook of Practical Program Evaluation (pp. 40-68). San Francisco : Josey Bass.(pp. 40-68). San Francisco : Josey Bass.
What Was LearnedWhat Was Learned
How Will We Improve the How Will We Improve the Process?Process?
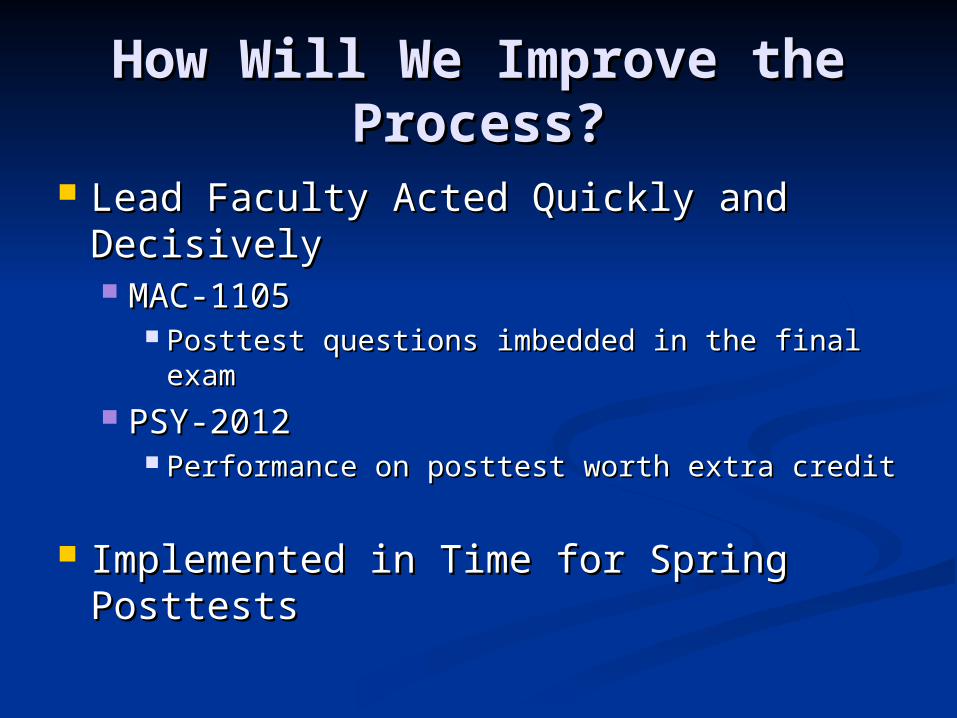
Lead Faculty Acted Quickly and Lead Faculty Acted Quickly and DecisivelyDecisively MAC-1105 MAC-1105
Posttest questions imbedded in the final examPosttest questions imbedded in the final exam PSY-2012PSY-2012
Performance on posttest worth extra creditPerformance on posttest worth extra credit
Implemented in Time for Spring Implemented in Time for Spring PosttestsPosttests
EXPECTED RESULTSEXPECTED RESULTS
Tying the posttest to the final grade Tying the posttest to the final grade appears to have corrected the appears to have corrected the problem. problem.
Lead faculty grading SP08 posttests Lead faculty grading SP08 posttests report seeing a difference.report seeing a difference.
We are expecting meaningful results We are expecting meaningful results from the revised posttest procedure from the revised posttest procedure as we conclude our first year of the as we conclude our first year of the study.study.

ABOUT OUR STUDENTSABOUT OUR STUDENTS

STUDENTS’ TERM CREDIT STUDENTS’ TERM CREDIT LOADLOAD
CreditCredit
Load:Load:
MAC-MAC-11051105
(N=760(N=760))
PSY-PSY-20122012
(N=504(N=504))
ACG-ACG-20212021
(N=453(N=453))
CGS-CGS-10001000
(N=131(N=1313)3)
ECO-ECO-20232023
(N=254(N=254))
< 12 < 12 hrshrs
38%38% 33%33% 47%47% 28%28% 45%45%
12+ 12+ hrshrs
62%62% 67%67% 53%53% 72%72% 55%55%

STUDENTS RECEIVING STUDENTS RECEIVING SOME FORM OF SOME FORM OF FINANCIAL AIDFINANCIAL AID
COURSE:COURSE:YESYES NONO
MAC-1105 MAC-1105 (N=760)(N=760)
61.6%61.6% 38.4%38.4%
PSY-2012 PSY-2012 (N=504)(N=504)
59.4%59.4% 40.6%40.6%
ACG-2021 ACG-2021 (N=453)(N=453)
56.6%56.6% 43.4%43.4%
CGS-1000 CGS-1000 (N=1313)(N=1313)
60.2%60.2% 39.8%39.8%
ECO-2023 ECO-2023 (N=254)(N=254)
54.6%54.6% 45.4%45.4%

WORK HOURS per WEEK WORK HOURS per WEEK (self-report)(self-report)
WK-WK-HRS:HRS:
MAC-MAC-11051105
(N=222(N=222))
PSY-PSY-20122012
(N=142(N=142))
ACG-ACG-20212021
(N=216(N=216))
CGS-CGS-10001000
(N=381(N=381))
ECO-ECO-20232023
(N=129(N=129))
00 19.9%19.9% 20.9%20.9% 15.5%15.5% 21.4%21.4% 11.9%11.9%
1-101-10 6.0%6.0% 3.7%3.7% 2.6%2.6% 5.9%5.9% 3.4%3.4%
11-2011-20 15.3%15.3% 15.5%15.5% 10.7%10.7% 17.9%17.9% 11.5%11.5%
21-3021-30 27.9%27.9% 29.7%29.7% 24.0%24.0% 25.0%25.0% 23.8%23.8%
30+30+ 30.9%30.9% 31.2%31.2% 47.2%47.2% 29.8%29.8% 49.4%49.4%

““What were your biggest obstacles in What were your biggest obstacles in learning (this subject)?”learning (this subject)?”
Perceived Obstacles to Success:
MAC1105 (n=46
4)
PSY2012(n=34
7)
ACG2021 (n=30
3)
CGS1000 (n=42
9)
ECO2023 (n=21
8)
Test Anxiety 37.9% 35.2% 20.5% 18.9% 22.0%
Found Subject Difficult to Learn
22.4% 9.5% 23.1% 20.3% 33.5%
Not Enough Time for Homework
26.1% 11.5% 9.2% 21.2% 7.3%
Material Covered Too Quickly
24.1% 13.8% 14.8% 8.6% n/a

““What additional resources would What additional resources would have helped you to be more successful have helped you to be more successful ( in this class)?”( in this class)?”
COURSE:“IMPROVED
STUDY SKILLS”
“A STUDY SKILLS CLASS”
MAC-1105 (N=464)
36.2% 6.0%
PSY-2012 (N=347)
42.9% 7.8%
ACG-2021 (N=303)
21.4% 4.6%
CGS-1000 (N=429)
23.1% 8.6%
ECO-2023 (N=218)
41.7% 3.7%
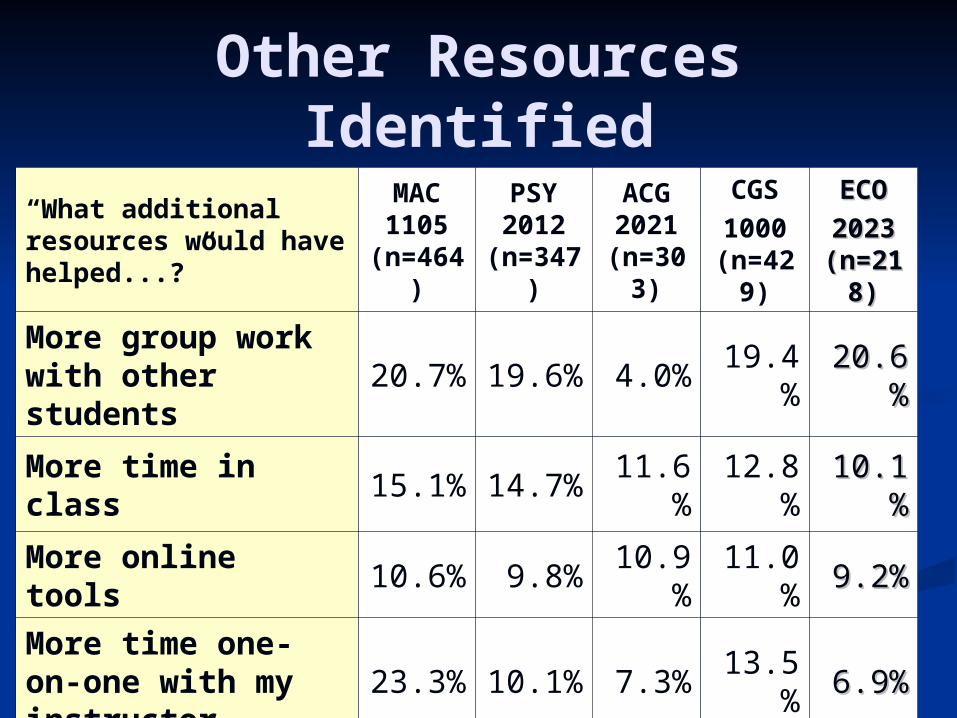
Other Resources Identified
“What additional resources would have helped...?”
MAC 1105 (n=46
4)
PSY 2012 (n=34
7)
ACG 2021 (n=303)
CGS1000 (n=429)
ECOECO
2023 2023 (n=2(n=218)18)
More group work with other students
20.7%
19.6%
4.0%19.4
%20.620.6
%%
More time in class
15.1%
14.7%
11.6%
12.8%
10.110.1%%
More online tools10.6
%9.8%
10.9%
11.0% 9.2%9.2%
More time one-on-one with my instructor
23.3%
10.1%
7.3%13.5
% 6.9%6.9%

“Which of the following helped you the most to succeed in (this class)?”
COURSE:
Instructor
Homework/
Test Review*
Working/Studying with
Others
MAC-1105 (n=464)
49.1% 45.3% 31.9%
PSY-2012 (n=347)
64.8% 43.2%* 20.5%
ACG-2021 (n=303)
60.4% 47.5% 15.8%
ECO-2023 (n=218)
75.2% 18.8% 16.1%
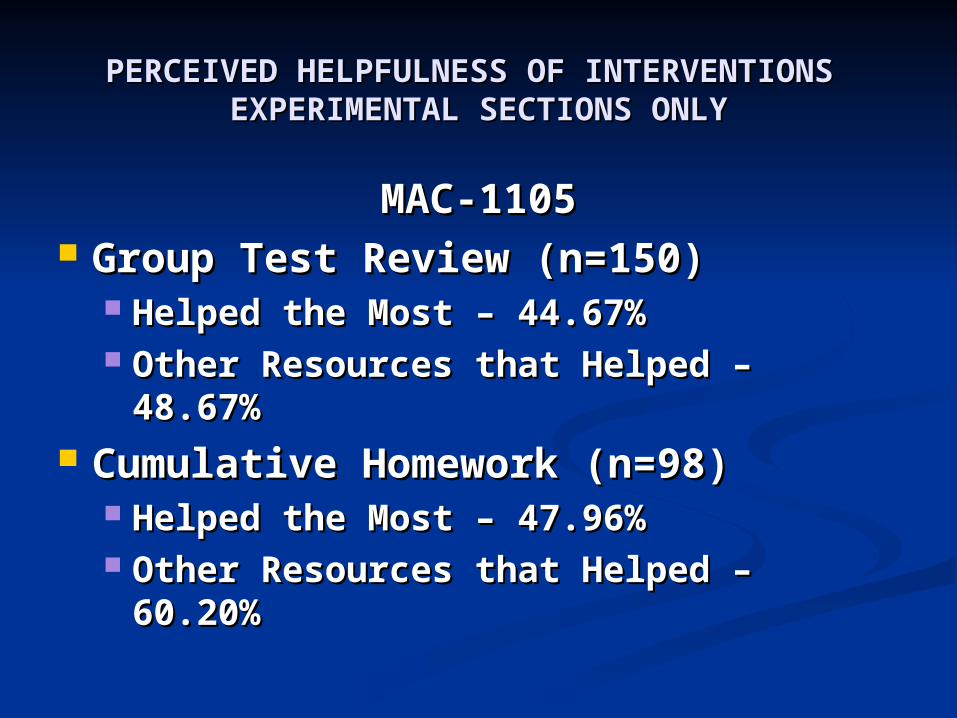
PERCEIVED HELPFULNESS OF PERCEIVED HELPFULNESS OF INTERVENTIONS INTERVENTIONS
EXPERIMENTAL SECTIONS ONLYEXPERIMENTAL SECTIONS ONLY
MAC-1105MAC-1105 Group Test Review (n=150)Group Test Review (n=150)
Helped the Most – 44.67%Helped the Most – 44.67% Other Resources that Helped – Other Resources that Helped –
48.67%48.67% Cumulative Homework (n=98)Cumulative Homework (n=98)
Helped the Most – 47.96%Helped the Most – 47.96% Other Resources that Helped – Other Resources that Helped –
60.20%60.20%

PERCEIVED HELPFULNESS OF PERCEIVED HELPFULNESS OF INTERVENTIONS INTERVENTIONS
EXPERIMENTAL SECTIONS ONLYEXPERIMENTAL SECTIONS ONLY
Psy-2012Psy-2012 Clicker Technology (n= 80)Clicker Technology (n= 80)
Helped the Most – 55.0%Helped the Most – 55.0% Other Resources that Helped – Other Resources that Helped –
58.75%58.75% Team-Teaching (n=58 )Team-Teaching (n=58 )
Helped the Most – 24.14 %Helped the Most – 24.14 % Other Resources that Helped – Other Resources that Helped –
20.69%20.69%
LOOKING FORWARDLOOKING FORWARD
Students’ feedback suggests that Students’ feedback suggests that these interventions ought to be these interventions ought to be effective.effective.
Spring semester’s results should Spring semester’s results should provide a more realistic picture of provide a more realistic picture of their impact on students’ learning their impact on students’ learning outcomes.outcomes.