gate-to-gate life-cycle inventory on hardwood sawmills … · gate-to-gate life-cycle inventory on...
TRANSCRIPT
Gate-to-Gate Life-Cycle Inventory on Hardwood Sawmills in the Northeastern Region of the United States
by
RICHARD D. BERGMAN
A thesis submitted in partial fulfillment of the requirements for the degree of
MASTER OF SCIENCE (FOREST SCIENCE)
at the
UNIVERSITY OF WISCONSIN – MADISON
2007
© Richard D. Bergman 2007
APPROVED _______________________________ ________________ Dr. Scott A. Bowe, Major Advisor Date Associate Professor Department of Forest and Wildlife Ecology at the University of Wisconsin-Madison _______________________________ Dr. Raymond P. Guries Professor, Chair Department of Forest and Wildlife Ecology at the University of Wisconsin-Madison _______________________________ Dr. Jeffrey C. Stier Emeritus Professor Department of Forest and Wildlife Ecology at the University of Wisconsin-Madison
i ACKNOWLEDGEMENTS First and foremost, I appreciate my advisor, Scott Bowe, for his guidance in completing this
research and Steve Hubbard for his help dealing with being a graduate student. Thank you,
James B. Wilson and Maureen E. Puettmann, Oregon State University, for help on technical
aspects of Life-Cycle Inventory analysis and Susan Regan and the Hardwood Manufacturing
Association for providing mill data. Financial assistance provided for this research project by
the USDA Forest Service, Forest Products Laboratory (JV1111169-211) through CORRIM
and the USDOE is gratefully acknowledged. The Author also thanks Professor KT. Hartwig,
Jean Livingston, Melissa Kershner, and Samuel Zelinka for their review comments on this
paper. Furthermore, I would like to extend my gratitude to my committee members Ray
Guries and Jeff Stiers rigorous examining my work to help me generate the best possible
product. Last but not the least, I owe a debt of gratitude to the USDA Forest Service-Forest
Products Laboratory for giving me the time to attend classes and write my thesis.
A special thanks to my wife, Debra, who without her support, would have made this a much
harder process. Also, I owe another debt of gratitude for her patience, love, and tolerance
when I had a cranky disposition.
ii
TABLE OF CONTENTS ACKNOWLEDGEMENTS....................................................................................................... i TABLE OF CONTENTS.......................................................................................................... ii TABLE OF TABLES .............................................................................................................. iii TABLE OF FIGURES............................................................................................................. iii TABLE OF APPENDICES ..................................................................................................... iv ABSTRACT.............................................................................................................................. 1 INTRODUCTION .................................................................................................................... 2 PROBLEM STATEMENT....................................................................................................... 5 STUDY OBJECTIVES............................................................................................................. 7
Objective 1 ............................................................................................................................ 7 Objective 2 ............................................................................................................................ 7
LITERATURE REVIEW ......................................................................................................... 8 Terminology.......................................................................................................................... 8
Life-Cycle Analysis .......................................................................................................... 8 Life-Cycle Inventory......................................................................................................... 9 Life-Cycle Impact Assessment ....................................................................................... 10
History and Evolution......................................................................................................... 10 When and Why Life-Cycle Research Developed ........................................................... 10 Consortium for Research on Renewable Industrial Materials (CORRIM)..................... 11 Stakeholder Perspectives on Development..................................................................... 12
METHODOLOGY ................................................................................................................. 13 Basic Steps for Life-Cycle Research .................................................................................. 13 Hardwood Lumber Manufacturing and the Four Main Unit Processes.............................. 13
Sawing............................................................................................................................. 14 Drying ............................................................................................................................. 15 Energy Generation .......................................................................................................... 15 Planing ............................................................................................................................ 15
Functional Unit ................................................................................................................... 16 System Boundaries.............................................................................................................. 16 Data Collection ................................................................................................................... 17
Survey ............................................................................................................................. 17 Mill Participants.............................................................................................................. 18
Project Assumptions ........................................................................................................... 19 Modeling Software Selection.............................................................................................. 22 Methodological Limitations................................................................................................ 24
Data Gaps........................................................................................................................ 24 Need for Reliable and Robust Results ............................................................................ 24 Confidentiality ................................................................................................................ 25
RESULTS and DISCUSSION................................................................................................ 26 Material Flow...................................................................................................................... 26 Energy Consumption .......................................................................................................... 28 Environmental Impact......................................................................................................... 31 Carbon Balance................................................................................................................... 33
iiiSensitivity Analysis ............................................................................................................ 34
Sensitivity Analysis Results............................................................................................ 36 Environmental Output for the Three Fuel Sources ......................................................... 37
STUDY SUMMARY.............................................................................................................. 42 CONCLUSIONS..................................................................................................................... 46 LITERATURE CITED ........................................................................................................... 48 APPENDICES ........................................................................................................................ 52 TABLE OF TABLES Table 1 Overall wood mass balance for 1.0 cubic meter of planed dry lumber (oven dry
kilogram)......................................................................................................................... 27 Table 2 Volume conversion of incoming logs to 1.0 cubic meter of planed dry lumber ....... 28 Table 3 Overall fuel and electricity consumption on-site to produce a per unit basis of planed
dry lumber....................................................................................................................... 29 Table 4 Raw materials consumed during production of a per unit basis of planed dry lumber
......................................................................................................................................... 31 Table 5 Life-Cycle Inventory results for total emissions on a per unit basis of planed dry
lumber ............................................................................................................................. 33 Table 6 Tracking of wood-based carbon inputs and outputs for hardwood lumber ............... 34 Table 7 Sensitivity Analysis for manufacturing hardwood lumber in the Northeast ............. 37 Table 8 Comparison of hardwood to softwood lumber energy use ........................................ 44 TABLE OF FIGURES Figure 1. Area selected for Life-Cycle Inventory of hardwood lumber production in the
United States. .................................................................................................................... 6 Figure 2. Life-Cycle Analysis Methodology ............................................................................ 8 Figure 3. Complete Life-Cycle from regeneration of trees to disposal of wood materials ..... 9 Figure 4. Description of the four unit processes for hardwood lumber manufacturing
showing material flow..................................................................................................... 14 Figure 5. System boundaries for hardwood lumber production ............................................. 17 Figure 6. SimaPro 7 model output showing the major air emissions and their level of
environmental impact for the 100% natural gas scenario............................................... 39 Figure 7. SimaPro 7 model output showing the major air emissions and their level of
environmental impact for the 100% wood fuel scenario ................................................ 39 Figure 8. SimaPro 7 model output showing the major air emissions and their level of
environmental impact for the orginal (base) fuel scenario ............................................. 40 Figure 9. SimaPro model output for major air emissions and their amount of environmental
impact for 100% natural gas replacement case............................................................... 41 Figure 10. SimaPro model output for major air emissions and their amount of environmental
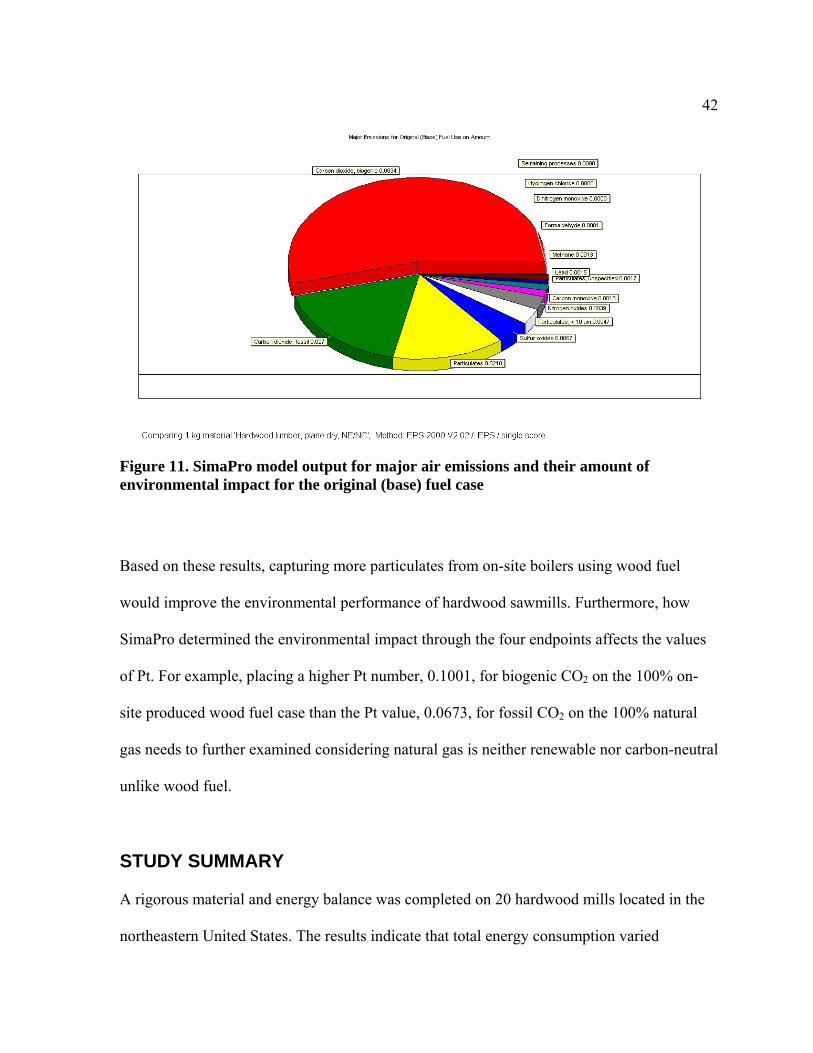
impact for 100% on-site produced wood fuel case......................................................... 41 Figure 11. SimaPro model output for major air emissions and their amount of environmental
impact for the original (base) fuel case........................................................................... 42
iv TABLE OF APPENDICES Appendix A - Page 1: Primary Mill Data questionnaire: Introduction and Questionnaire.... 52 Appendix A - Page 2............................................................................................................... 53 Appendix A - Page 3............................................................................................................... 54 Appendix A - Page 4............................................................................................................... 55 Appendix A - Page 5............................................................................................................... 56 Appendix A - Page 6............................................................................................................... 57 Appendix A - Page 7............................................................................................................... 58 Appendix B - 1: First letter sent to Hardwood Manufacturer Association ............................. 59 Appendix B - 2: Second letter sent to Hardwood Manufacturer Association......................... 60 Appendix C - 1: Total Electrical Power Industry by Source for Northeast for 2005 by State –
Coal and Other Gases...................................................................................................... 61 Appendix C - 2: Total Electrical Power Industry by Source for Northeast for 2005 by State –
Petroleum and Other ....................................................................................................... 62 Appendix C - 3: Total Electrical Power Industry by Source for Northeast for 2005 by State –
Natural Gas and Nuclear................................................................................................. 63 Appendix C - 4: Total Electrical Power Industry by Source for Northeast for 2005 by State –
Hydroelectric Conventional and Pumped Storage...........................................................64 Appendix D - 1 SimaPro 7 air emission inventory for 100% natural gas scenario ................ 65 Appendix D - 2 SimaPro 7 air emission inventory for 100% wood fuel scenario.................. 66 Appendix D - 3 SimaPro 7 air emission inventory for original (base) scenario..................... 67

1
ABSTRACT Using sustainable building materials is gaining a significant presence in the United States
therefore proving sustainability claims are becoming increasingly more important. Certifying
wood products as green building materials is vital for the long-term productivity of the wood
building industry and for forest management. This study examined hardwood lumber
manufacturing using Life-Cycle Inventory methodology. Material flow and energy type and
use were identified for hardwood sawmills in the northeastern United States. Energy
consumption of 608 MJ of electricity and 5,800 MJ of thermal energy per m3 were
determined for the manufacturing of planed dry hardwood lumber from incoming logs.
Burning green wood residues on-site generate the most energy. Hardwood log volume
conversion to planed dry lumber of 43.7% was estimated. Modeling data estimated biomass
and fossil carbon dioxide production of 428 kg per m3 and 139 kg per m3, respectively.
Increasing wood fuel use, a carbon-neutral process, would decrease the environmental impact
of hardwood lumber manufacturing and increase its value as a green building material.
2
INTRODUCTION
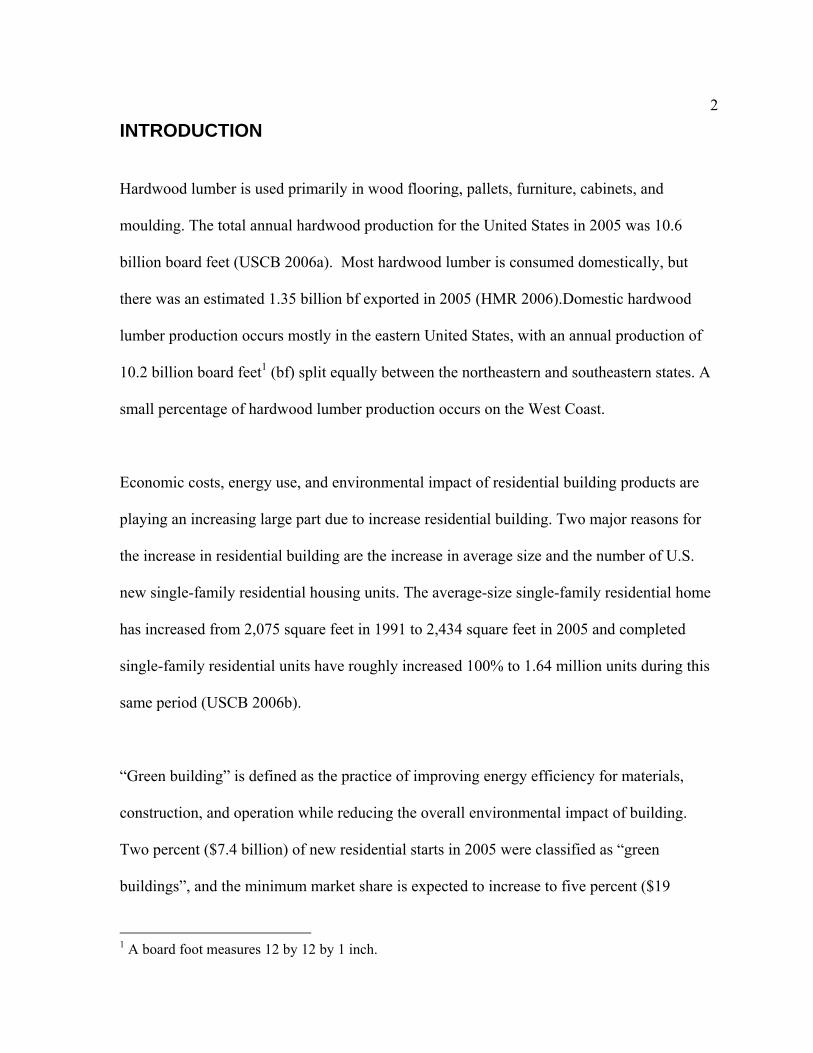
Hardwood lumber is used primarily in wood flooring, pallets, furniture, cabinets, and
moulding. The total annual hardwood production for the United States in 2005 was 10.6
billion board feet (USCB 2006a). Most hardwood lumber is consumed domestically, but
there was an estimated 1.35 billion bf exported in 2005 (HMR 2006).Domestic hardwood
lumber production occurs mostly in the eastern United States, with an annual production of
10.2 billion board feet1 (bf) split equally between the northeastern and southeastern states. A
small percentage of hardwood lumber production occurs on the West Coast.
Economic costs, energy use, and environmental impact of residential building products are
playing an increasing large part due to increase residential building. Two major reasons for
the increase in residential building are the increase in average size and the number of U.S.
new single-family residential housing units. The average-size single-family residential home
has increased from 2,075 square feet in 1991 to 2,434 square feet in 2005 and completed
single-family residential units have roughly increased 100% to 1.64 million units during this
same period (USCB 2006b).
“Green building” is defined as the practice of improving energy efficiency for materials,
construction, and operation while reducing the overall environmental impact of building.
Two percent ($7.4 billion) of new residential starts in 2005 were classified as “green
buildings”, and the minimum market share is expected to increase to five percent ($19
1 A board foot measures 12 by 12 by 1 inch.
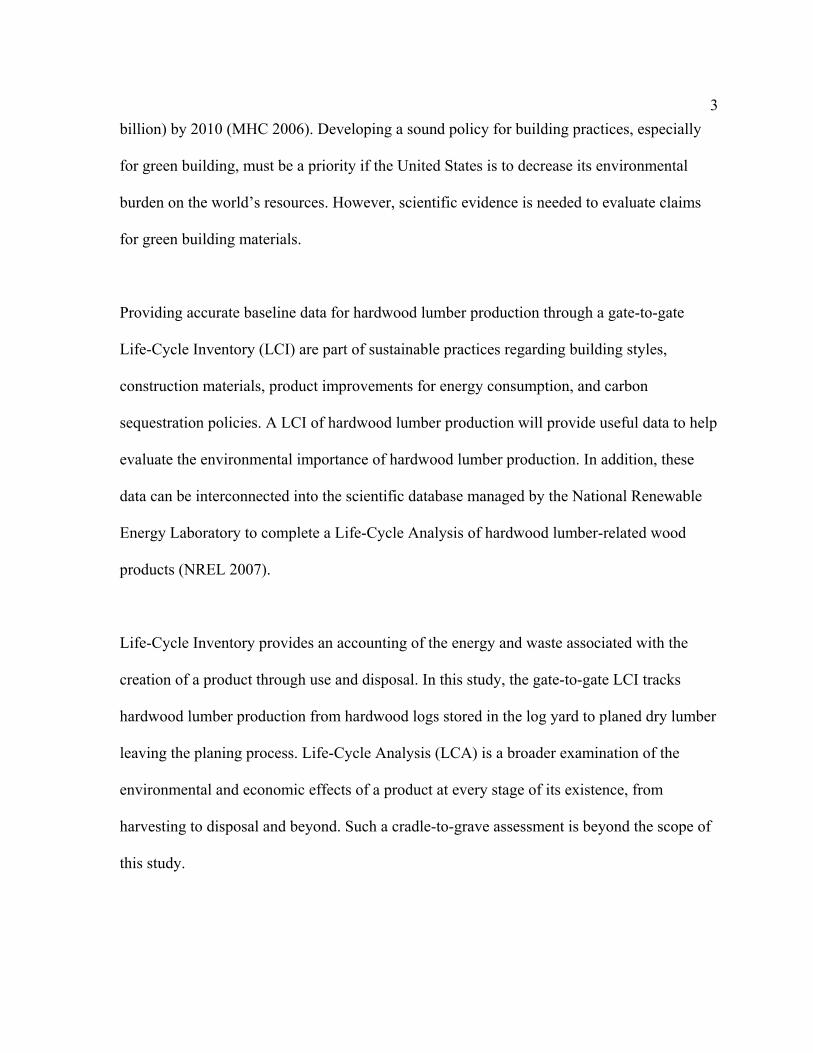
3billion) by 2010 (MHC 2006). Developing a sound policy for building practices, especially
for green building, must be a priority if the United States is to decrease its environmental
burden on the world’s resources. However, scientific evidence is needed to evaluate claims
for green building materials.
Providing accurate baseline data for hardwood lumber production through a gate-to-gate
Life-Cycle Inventory (LCI) are part of sustainable practices regarding building styles,
construction materials, product improvements for energy consumption, and carbon
sequestration policies. A LCI of hardwood lumber production will provide useful data to help
evaluate the environmental importance of hardwood lumber production. In addition, these
data can be interconnected into the scientific database managed by the National Renewable
Energy Laboratory to complete a Life-Cycle Analysis of hardwood lumber-related wood
products (NREL 2007).
Life-Cycle Inventory provides an accounting of the energy and waste associated with the
creation of a product through use and disposal. In this study, the gate-to-gate LCI tracks
hardwood lumber production from hardwood logs stored in the log yard to planed dry lumber
leaving the planing process. Life-Cycle Analysis (LCA) is a broader examination of the
environmental and economic effects of a product at every stage of its existence, from
harvesting to disposal and beyond. Such a cradle-to-grave assessment is beyond the scope of
this study.
4Hardwood logs sawn into rough green lumber are typically dried in conventional dry kilns
using wood and fossil fuels as heat sources (Denig et al. 2000). The sawing process
consumes the highest percentage of electrical energy. Prior to drying the lumber, the boards
are stickered (separated by thin wood strips) and stacked to aid drying and prevent drying
defects. The drying process consumes roughly 70% to 80% of the total energy required for
producing hardwood lumber (Comstock 1975). The rough dry lumber is planed to required
dimensions when drying is complete.

5
PROBLEM STATEMENT Green building awareness is growing with both residential and commercial consumers. As
the public, the building industry, and policy makers embrace the green building industry,
scientific evidence is required to evaluate claims about building products. It is important for
both the consumer and the wood building industry to know the environmental and energy
burdens of wood compared to non-wood building practices. This information also has
implications for the long-term competitiveness of the forest products industry and welfare of
our nation’s forests. Healthy forest management requires a healthy forest industry. It is
essential that the data gathered from processing logs into hardwood lumber be available to
document exactly what benefits and costs are associated with the decision-making policies
for the entire building industry.
The goal of this study was to document the gate-to-gate LCI of planed dry lumber production
from hardwood logs. Documentation showed the material flow, energy type and use, and
emissions for the hardwood lumber manufacturing process on a per unit volume basis of
planed dry lumber for the northeastern United States (Figure 1). Primary mill data were
collected through a questionnaire (Appendix A - Page 1-7) mailed to lumber mills, and
secondary data were collected from peer-reviewed literature per Consortium for Research on
Renewable Industrial Material (CORRIM) guidelines (CORRIM 2004). Material and energy
balances were calculated from primary and secondary data. Using these material and energy
data, the environmental impact was estimated by modeling emissions using the software
package SimaPro 7 (Pre' Consultants 2007), which follows ISO 14040 protocols. SimaPro
6has been used in previous CORRIM-initiated Phase I LCI projects (modules): softwood
lumber (Milota et al 2005), softwood plywood (Wilson and Sakimoto 2005), I-joist
production (Wilson and Dancer 2005), glue-laminated timbers (Puettmann and Wilson 2005),
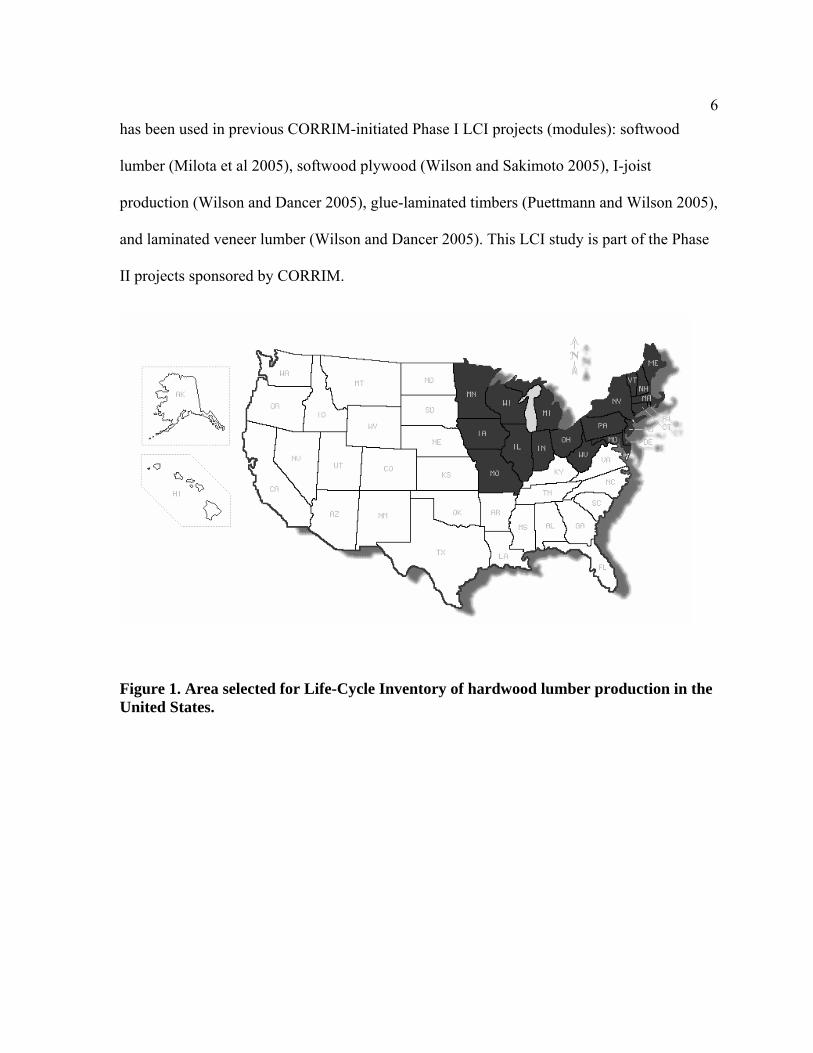
and laminated veneer lumber (Wilson and Dancer 2005). This LCI study is part of the Phase
II projects sponsored by CORRIM.
Figure 1. Area selected for Life-Cycle Inventory of hardwood lumber production in the United States.
7
STUDY OBJECTIVES
Objective 1 Measure the material and energy inputs and outputs for the manufacturing of planed kiln dry
hardwood lumber and model the environmental impact through a gate-to-gate Life-Cycle
Inventory.
Objective 2 Identify environmental process improvement opportunities for hardwood lumber
manufacturers in the northeastern United States by modeling various manufacturing
scenarios.
8
LITERATURE REVIEW It is important to define several terms used for Life-Cycle research.
Terminology
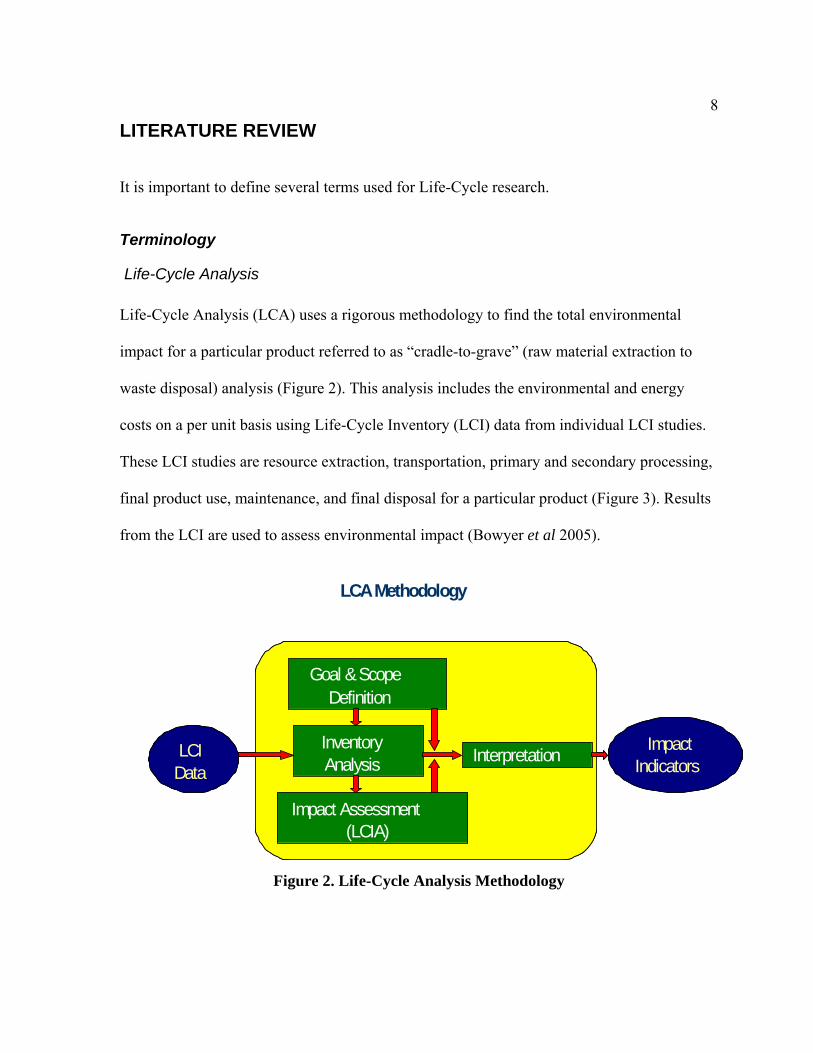
Life-Cycle Analysis Life-Cycle Analysis (LCA) uses a rigorous methodology to find the total environmental
impact for a particular product referred to as “cradle-to-grave” (raw material extraction to
waste disposal) analysis (Figure 2). This analysis includes the environmental and energy
costs on a per unit basis using Life-Cycle Inventory (LCI) data from individual LCI studies.
These LCI studies are resource extraction, transportation, primary and secondary processing,
final product use, maintenance, and final disposal for a particular product (Figure 3). Results
from the LCI are used to assess environmental impact (Bowyer et al 2005).
Figure 2. Life-Cycle Analysis Methodology
Goal & Scope Definition
Inventory Analysis
Impact Assessment (LCIA)
LCI Data
Interpretation Impact
Indicators
LCA M ethodology
Goal & Scope Definition
Inventory Analysis
Impact Assessment (LCIA)
LCI Data
Interpretation Impact
Indicators
LCA Methodology
Goal & Scope Definition
Inventory Analysis
Impact Assessment (LCIA)
LCI Data
Interpretation Impact
Indicators
LCA Methodology
9
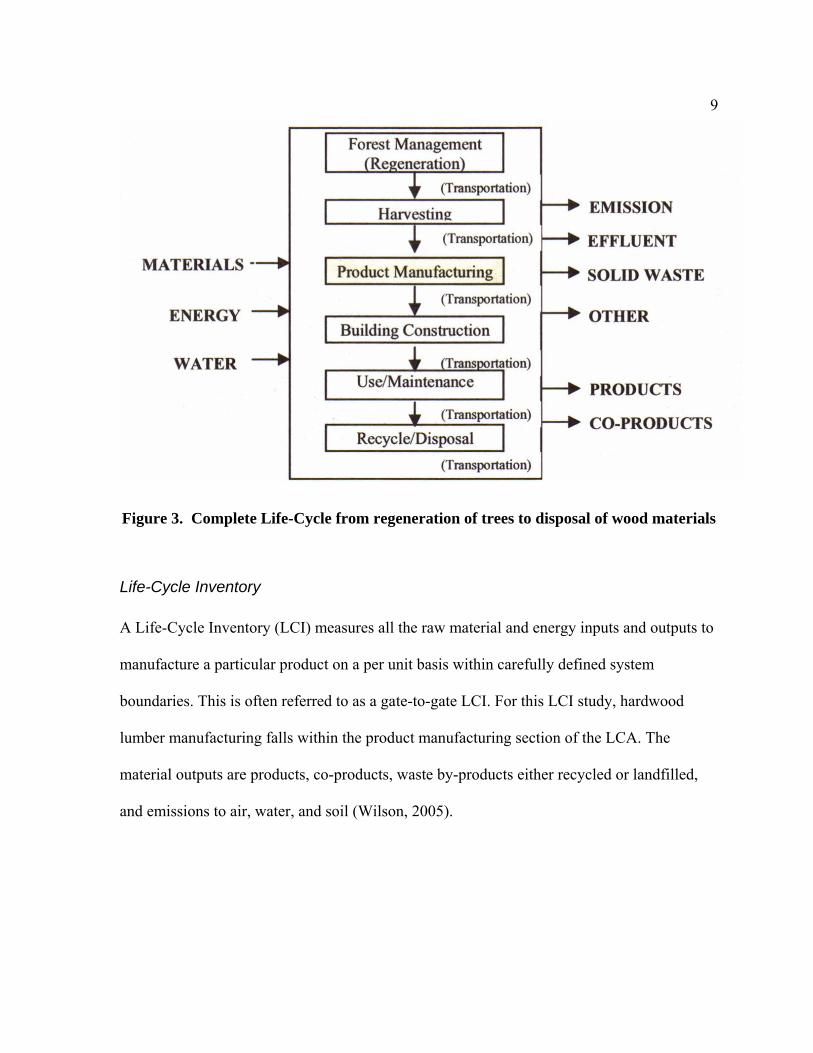
Figure 3. Complete Life-Cycle from regeneration of trees to disposal of wood materials
Life-Cycle Inventory A Life-Cycle Inventory (LCI) measures all the raw material and energy inputs and outputs to
manufacture a particular product on a per unit basis within carefully defined system
boundaries. This is often referred to as a gate-to-gate LCI. For this LCI study, hardwood
lumber manufacturing falls within the product manufacturing section of the LCA. The
material outputs are products, co-products, waste by-products either recycled or landfilled,
and emissions to air, water, and soil (Wilson, 2005).
10Life-Cycle Impact Assessment Life-Cycle Impact Assessment (LCIA) uses the gate-to-gate LCI to explore the other aspects
of production and use regarding the following four areas: resource depletion and ecosystem,
human, and social health (Bowyer, et al. 2005). LCIA gives insights for architects, engineers,
and designers on raw materials, product choices, and disposal methods. Learning the LCIA
of a particular material allows stakeholders to make informed choices based on science rather
than anecdotal evidence. Primary data gathered through industry surveys and secondary data
collected from literature were analyzed for its Life-Cycle Impact Assessment (CORRIM
2004).
History and Evolution
When and Why Life-Cycle Research Developed Learning how our societies affect our environment has interested and driven people for
hundreds, perhaps thousands of years (e.g. collapse). Past societies have declined for various
reasons, one of which was the lack of available resources or the lack of understanding about
availability of these resources (e.g. scarcity). Consumption of natural resources is a
fundamental part of past and present societies. As the United States and world populations
grow, understanding the environmental impact of the products we manufacture and use is
critical for developing sustainable societies. Conducting LCI studies helps us provide the
most informed choices for these products. (Benedick 2000).
An early example of Life-Cycle practices involved Coca Cola and its use of glass bottles
through a study in 1969 by Harry Teasley, Jr. (Bowyer et al 2005). One part of this particular

11study examined the environmental impact of substituting single-use plastic bottles for
refillable glass bottles. Contrary to popular opinion and expectation, the study showed single-
use plastic bottles consume less hydrocarbon raw material than did glass bottles (Duda and
Shaw 1997).
Consortium for Research on Renewable Industrial Materials (CORRIM) In 1976, the National Academy of Science formed the Consortium for Research on
Renewable Industrial Materials (CORRIM) to examine energy impacts of using renewable
materials. CORRIM evaluated the energy issues for building materials and wrote a report that
documented wood’s energy efficiency (Boyd et al 1976).
In 1997, CORRIM was re-formed to update the 1976 study using LCA methods to address
environmental issues related to wood products. CORRIM is now made up of 15 wood-related
research institutions including the USDA Forest Products Laboratory. CORRIM plans to help
develop a database of peer-reviewed information quantifying both economic and
environmental impacts of wood and non-wood building materials. Rigorous guidelines were
developed by CORRIM for the researchers involved in conducting LCI studies (CORRIM
2004). CORRIM projects started in the Pacific Northwest and the Southeast focusing on
glulam, plywood, oriented strand board, softwood lumber, laminated veneer lumber, and
trusses. These LCI studies are referred to as Phase I projects.
For Phase I, CORRIM released a study comparing the energy use and environmental load of
construction and operation of a wood-framed house to a steel-framed house and a concrete-
12framed house in two different locations (Minneapolis and Atlanta) in the United States. The
results mostly favored the wood-framed house in both locations when evaluated on five
energy and environmental impact categories (Lippke et al 2004). CORRIM's efforts are
producing data to help establish environmental standards now being developed.
Phase II projects are now being conducted. These gate-to-gate LCI studies focus mostly on
the Inland West and the Northeast, and are intended to extend the present geographic
coverage. These projects include hardwood lumber and flooring, softwood lumber, oriented
strand board, and other forest resources.
Stakeholder Perspectives on Development Several major stakeholders who have an interest in the application of LCI data include
government agencies, building industries, consultants, and academia. Each stakeholder views
the LCI work differently but all have the following concerns when conducting LCI studies:
confidentiality, improper assumptions and system boundaries, misuse or misunderstanding
by others, and poor data quality. In this study, confidentiality of the mill participants and the
data provided by individual mills was stressed during all our discussions. Regardless of any
drawbacks, all stakeholders see LCI studies as opportunities. Industry values LCI studies
because of the scientific basis used in examining the environmental impacts of products and
the potential for process improvement, while government and academia would use the
resulting LCA as decision-making tools (de Beafort-Langeveld et al 2003).
13
METHODOLOGY
Basic Steps for Life-Cycle Research There are four basic steps in Life-Cycle research (Bowyer et al 2005):
1. Describe the study goal and the model scope
2. Develop product Life-Cycle model
3. Show the environmental loads based on inputs and outputs of system
4. Select proper product or process based on result-driven choices
These items are essential for providing data quality, data analysis, and data representation
needed for LCI studies to withstand rigorous scientific review. These steps were used to
guide this research project.
Hardwood Lumber Manufacturing and the Four Main Unit Processes Production of hardwood lumber starts with hardwood logs that are typically trucked to the
sawmill and stored in the log yard until sawn. Logs may be stored wet or dry depending upon
species and season. There are four main unit processes in producing hardwood lumber:
sawing, drying, energy generation, and planing (Figure 4). In the sawing process, the
hardwood logs are sawn into mostly 1-in (25.4 mm) thick rough green lumber of random
widths and mostly 8-ft (2.44-m) lengths. The sawing process usually consumes the most
electricity of all unit processes. Once the rough green lumber is scaled (to measure
production volume) and stickered for drying, the lumber is typically dried to 6-8% moisture
content on a dry basis (MCDB) using mostly energy-intensive drying methods (e.g. dry kilns).
After drying, the rough dry lumber is planed to the required dimension. The energy
14generation process provides electricity from the power grid and heat primarily produced on-
site for the other three processes.
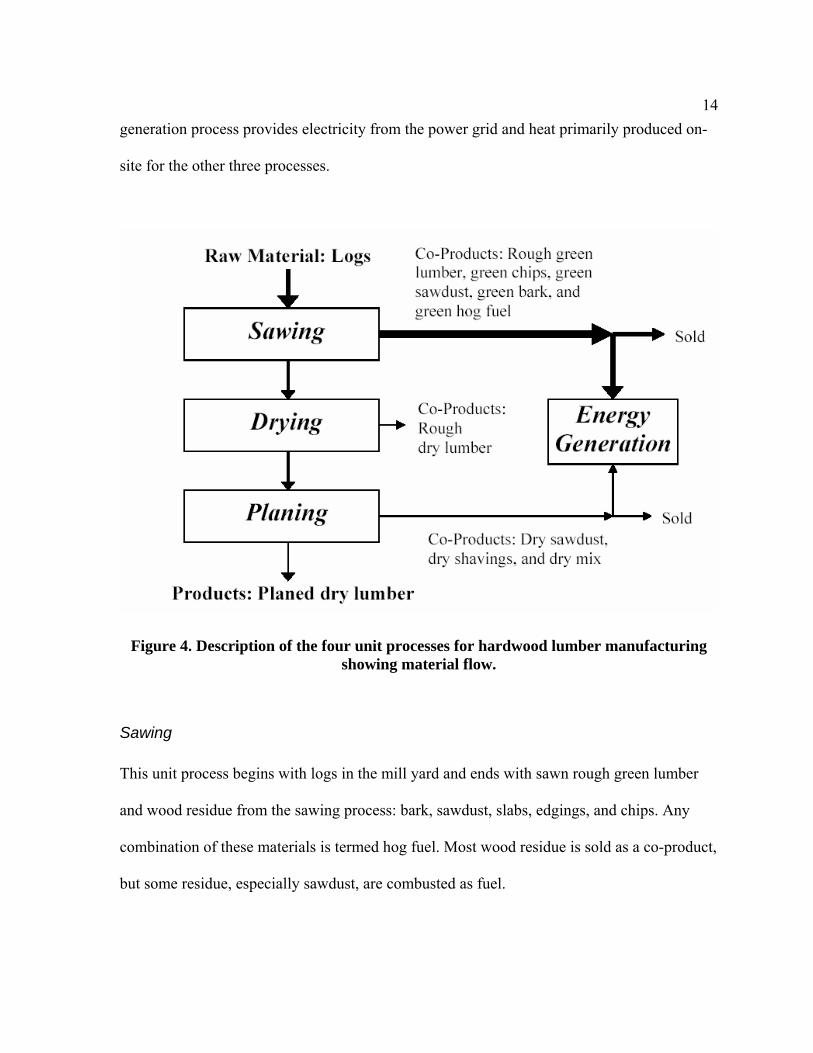
Figure 4. Description of the four unit processes for hardwood lumber manufacturing showing material flow.
Sawing This unit process begins with logs in the mill yard and ends with sawn rough green lumber
and wood residue from the sawing process: bark, sawdust, slabs, edgings, and chips. Any
combination of these materials is termed hog fuel. Most wood residue is sold as a co-product,
but some residue, especially sawdust, are combusted as fuel.
15Drying This unit process begins with rough green lumber and ends with rough dry lumber bound for
the planer mill. Drying produces most of the volatile organic compounds (VOC) generated
on-site and uses the most energy produced on-site from wood and fossil fuel combustion.
Several different drying methods are employed depending on species and wood residue use.
Energy Generation This unit process provides all on-site heat and some on-site electricity for the other three
processes by burning wood, natural gas, oil, or propane. The outputs of this unit process are
steam and hot water from boilers, combustion gases for drying, electricity from cogeneration
units, and solid waste (wood ash) and air emissions (e.g. CO2, CO, and particulate) from
combustion.
Planing This unit process begins with stickered, rough kiln-dried lumber and produces surfaced and
packaged lumber, sorted by type, size, and grade. Planing also generates planer shavings,
sawdust, and lumber trim ends (dry wood residue). This process is the final stage of
manufacturing. Some dry wood residue is combusted on-site in boilers for energy but most is
sold as co-products. A particular type of planing is termed skip planing. Some planed lumber
is only skip (hit or miss) planed from 25.4 mm (1 in.) to 23.8 mm (0.9375 in.) instead of the
standard 20.6 mm (0.8125 in.) for 4/4 hardwood lumber.
16Functional Unit
Material flows, energy use, and emission data are standardized to a per unit volume basis for
planed dry lumber of 1.0 cubic meter (m3), i.e., the final product of the hardwood lumber
manufacturing process. One cubic meter of planed dry lumber equals 0.568 nominal
thousand board feet. The United States industry standard uses nominal dimensions and
commodity lumber is sold by variations of a thousand board feet (MBF). In this study, the
standard dimensions used to convert board feet to cubic meters are the nominal dimensions
of 1 by 6 in. (25.4 by 152 mm) with actual planed dimensions of 0.8125 by 5.5 in. (20.6 by
140 mm) for an 8-ft (2.44-m) board. Rough green lumber and rough dry lumber are assumed
to be 1.0625 by 5.6875 in. (27.0 mm by 144 mm) and 1.0 by 5.625 in. (25.4 by 143 mm),
respectively, and board length is 8.17 ft (2.49 m) prior to planing (FPL 1999). Allocating all
material and energy on a per unit basis of 1.0 m3 planed dry lumber standardizes the results
to meet ISO protocols and can be used in other CORRIM studies including LCA (ISO 1998;
ISO 2005; CORRIM 2004).
System Boundaries
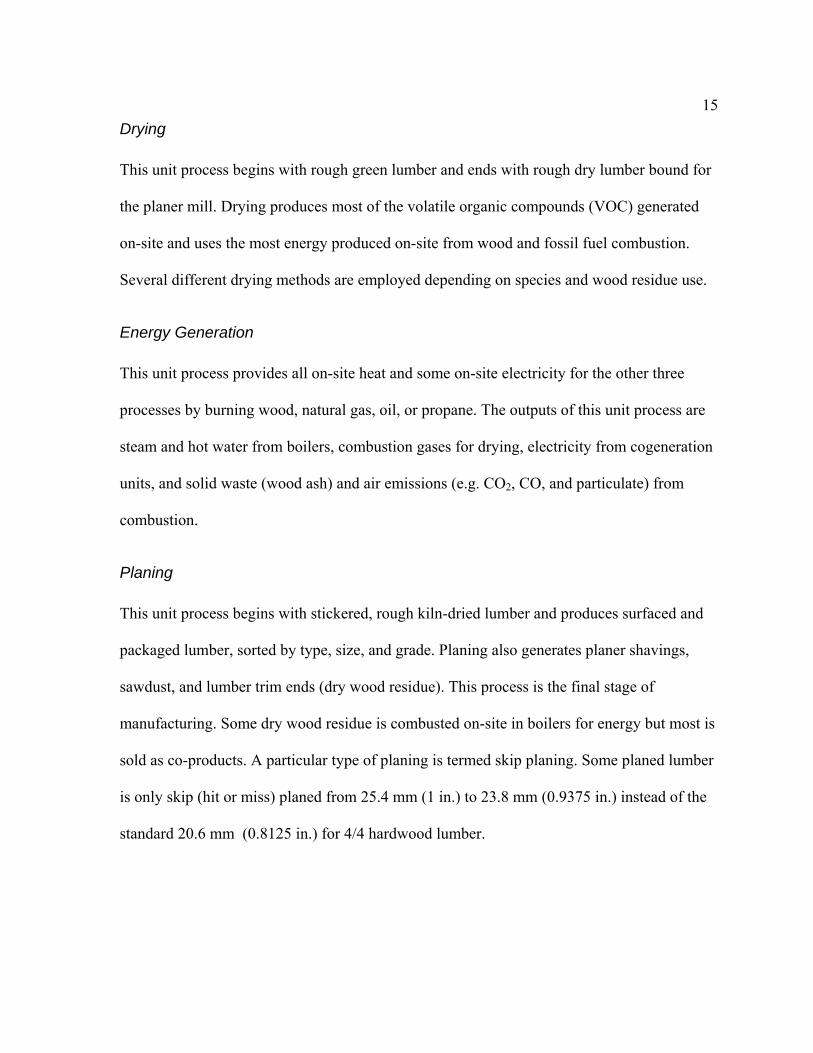
Boundary selection is important because the material and energy that cross this boundary
need to be accounted for (Figure 5) through the gate-to-gate Life-Cycle Inventory. There are
two boundaries as defined by CORRIM (Wilson and Sakimoto 2005) used to track the
environmental impact of hardwood lumber production. One is the total (cumulative) system
boundary (solid line in Fig. 5) that includes both on-site and off-site emissions for all
material and energy consumed. The site system boundary (dotted line in Fig 5) is the
17environmental impact for emissions developed just at the hardwood sawmill (i.e. on-site)
from the four unit processes. Examples of off-site emissions are grid electricity production,
transportation of logs and lumber to and from the mill, and fuels produced off-site but used
on-site.
Figure 5. System boundaries for hardwood lumber production
Data Collection
Survey Data collection was a difficult and time-consuming part of the Life-Cycle Inventory.
Developing the questionnaire (Appendix A - Page 1-7) used to collect the necessary primary
mill data took a long time. After reviewing the softwood lumber LCI questionnaire from a
previous Phase I project and receiving training on SimaPro 6.0 in December of 2004, we
18developed a shorter, revised questionnaire for the hardwood lumber industry. Jim Wilson,
Vice President of CORRIM and Professor Emeritus at Oregon State University, reviewed the
questionnaire. Afterward, a Wisconsin hardwood sawmill pre-tested the questionnaire during
the spring and summer of 2006. About 18 hours were needed to complete the draft
questionnaire by the pre-testing company.
Mill Participants In the spring of 2005, we contacted Utilization and Marketing personnel of the states with
some of the highest hardwood lumber production including Missouri, Wisconsin, and
Michigan. In the summer of 2005, we, also, contacted two hardwood lumber manufacturing
associations: the Hardwood Manufacturer Association (HMA) and the National Hardwood
Lumber Association (NHLA). See Appendix B - 1 for the official letter mailed to Susan
Regan, Executive Vice-President of the HMA. An official letter was also sent to Gary
Baldwin of NHLA on August 9, 2005. Both associations showed initial interest but we did
not have any commitments from either organization for 2005 (a plan to discuss this LCI
project with Susan Regan from HMA in mid-September was cancelled).
In the spring of 2006, we again contacted both NHLA and HMA. Another letter was sent to
Susan Regan on July 13, 2006 (Appendix B - 2). After several oral and written discussions
on this LCI study, Susan Regan invited us to Iowa for the HMA Regional Meeting held
October 2006 to discuss the project with the board members of the HMA. HMA is a trade
organization comprised of roughly 130 hardwood lumber companies in the eastern United
States that process 2.5 billion board feet of 26 hardwood species annually. The HMA board
19members from the northeastern and southeastern states decided to support the project by
having all the board members complete the questionnaire by November 30, 2006. Ms. Regan
provided us with the contact information for the board members. Several follow-up calls and
emails were completed about 1 month prior to the deadline, around the day of deadline, and
about 1 week after the deadline of November 30. Sufficient data from 20 northeastern
hardwood lumber mills were received as of January 4, 2007, to exceed the minimum
CORRIM protocol requirement to ensure adequate data quality.
Project Assumptions Four different log scales (Scribner, Scribner Decimal C, Doyle, and International ¼) used by
the 20 mills gave log inputs in thousand board feet (MBF). Common U.S. log scales estimate
the green lumber output that might be sawn from a log, whereas lumber scales measures the
actual green lumber volume produced from the log. Most other countries, including Europe,
use a cubic log scale that measures the actual log volume (minus the bark). The accuracy of
U.S log scales varies with log diameter, type of sawing method, and sawing efficiencies.
Large diameter logs typically produce more lumber for a given log scale volume than do
small diameter logs. There is a typical volume difference between the log and lumber scale
referred to as either overrun or underrun depending on whether the lumber scale or the log
scale is higher. If the lumber scale is higher, there is an overrun. In this study, a 16% overrun
was estimated. An average log conversion of 5.35 cubic meters per thousand board feet was
used based on an average log diameter of 15 in. reported from a random sample of the
participating mills and assuming a mixture of long and short logs (Spelter 2002).
20
As part of the CORRIM protocol for ensuring data quality, an overall “wood balance” is
required to fall within 5% from material input to material output. Log mass was calculated
based on the previous assumption of 5.35 cubic meters per thousand board feet and an
average green density of 864 kg per m3. Green lumber weights were developed from the
National Hardwood Grading Rules (NHLA 2007). In this study, a 3.0% difference was
calculated before and after sawing which fell within the CORRIM requirement.
Higher heating values (HHV) were used to convert volume or mass basis of a fuel to its
energy value. Higher heating value (HHV) represents the energy content of a fuel with the
combustion products such as water vapor brought to 25ºC (77ºF) while the lower heating
value (LHV) ignores the energy produced by the combustion of hydrogen in fuel. HHV is the
preferred method used in the United States.
A standard check was done on energy use for drying hardwood lumber. This study
considered energy used on-site that included drying lumber but also energy for plant heating,
walnut steaming, and electrical cogeneration. These sub-processes are typically not
associated with values found in previous studies when calculating energy used in drying.
Therefore, the three just stated sub-processes were not included in the following energy
checks.
Using the following conditions: initial moisture content on a dry basis (MCDB) of 80%, final
MCDB of 7%, boiler efficiency of 66.7%, kiln efficiency of 50%, and 15.2 MJ of energy to
21remove 1% moisture from 1.0 m3 rough green lumber (34,561 BTU for 1% moisture per
MBF) based on literature values, a total of 3,308 MJ per 1.0 m3 (7.53 million BTU per MBF)
rough green lumber was calculated (Wengert 1980). An estimated value of 3,560 MJ per 1.0
m3 (7.65 million BTU per MBF) found from actual mill data resulted in a 1.6% difference
between the literature and the actual values. Also, 9.82 MJ per kg (4,230 BTU per lb) of
water would be removed during the drying process assuming using a moisture loss of 40% on
a wet basis.
Energy use for the drying process was determined to be ±152% of the average weighted
value for the 18 mills drying lumber. This percentage indicated the large variance found was
due significantly to the different ages and types of drying technology and types of species
being dried. Average technology was assumed with processes producing similar outputs in
North America for modeling the environmental burden.
Primary data were collected through the pre-tested questionnaire in accordance with ISO
protocol and CORRIM research guidelines. Missing values were not weight averaged for that
particular process per ISO protocol to maintain good data quality. Primary data showed that
the major species represented were red oak (27.6%), white oak (8.6%), yellow poplar
(20.8%), hard maple (16.3%), soft maple (4.7%), and black cherry (5.0%) of total sawn
wood. The US Census Bureau 2005 data showed the following percentages (ignoring the
categories of not specified by kind and mixed ungraded hardwoods) of 35.2%, 16.8%,
14.4%, 7.0%, 5.2%, and 3.7%, respectively, for the northeastern region.
22Green and dry wood density and specific gravity values found in the Wood Handbook (1999)
for the 10 major wood species were used to determine the mass basis conversion from board
feet. A weighted density of 854 kg/m3 (53.3 lb/ft3) and 624 kg/m3 (38.9 lb/ft3) was used for
green and kiln dry lumber, respectively.
Volatile organic gas emissions were found through a secondary data source (Rice and Erich
2006) because primary data were not provided by the mill questionnaires.
All bark produced was assumed to be sold off-site as mulch. Bark was not given an
allocation for an environmental burden in SimaPro per CORRIM research guidelines
(CORRIM. 2004). Allocation refers to the distribution of environmental burden.
The LCI study covered one full year during the years 2005 and 2006 depending when an
operational (fiscal) year started at each hardwood lumber company and the geographical area
covered the northeastern United States shown in Figure 1.
Modeling Software Selection Modeling software was needed to generate LCI air, water, and land emission data from the
weight averaged results of material flow and energy use and type for hardwood lumber
manufacturing in a systematic and transparent way. Also, the software would follow the ISO
14040 protocols related to environmental managements when the LCI practitioner followed
23the basic four steps of life-cycle research. SimaPro was the modeling software selected and
SimaPro training was completed in December 2004.
SimaPro 7 follows the ISO 14040 standards for environmental management and
documentation. Other software programs for Life-Cycle Analysis were considered but
SimaPro has been the preferred software by CORRIM and was used in Phase I of the other
Life-Cycle Inventory projects sponsored by CORRIM. Phase I projects dealt mostly with
forest resources and residential construction in the US Pacific Northwest and Southeast.
SimaPro 7 was developed in the Netherlands and has an installed Franklin Associate
database that uses North America production data. The Franklin Associate database tracked
energy use and material flow in this study.
SimaPro allowed the use of the unit process approach in this LCI project which is more
rigorous and transparent than the simple system process approach. This transparency allows
the tracking of all individual unit processes. Simapro contains a database for a large number
of processes such as boilers (energy generation), grid electricity, and transport fuels. The
database is broken down into three main sections: project data, library data, and general data.
In this LCI study, the project data section is where all the new data were inputted. Library
data were the sources for an individual project and the Franklin Associate database library
was selected for this LCI. The last section (general data) contained common data such as
substance data and unit conversion factors (Pré Consultants 2006).
24Methodological Limitations As mentioned previously, there are some limitations that need to be addressed prior to
conducting a LCI study. Detailed explanations were given in the stated Project Assumption
sections under Methodology on how these limitations were addressed.
Data Gaps Primary data were collected from specific facilities per CORRIM research guidelines for all
material that constituted at least 95% of the product system, hardwood lumber. Where
appropriate, missing primary data from the hardwood lumber questionnaire were not used to
weight average (de Beafort-Langeveld et al 2003, CORRIM 2004, ISO 2005).
Need for Reliable and Robust Results Data representation was critical for showing the degree to which the data reflected the actual
state of the industry. Species composition, time and length of study, geographical area, and
type of technology were stated to show the similarities of the actual industry to the mill data
gathered (de Beafort-Lnageveld et al 2003).
Providing a detailed and transparent method that follows the CORRIM methodology used in
previous studies allows an independent researcher to reproduce the given results. Using the
SimaPro software program provides the necessary transparency while displaying results in
different formats, depending on what is needed by the user. Also, SimaPro provides an
extensive manual on operating the software and the background on how the program was
developed (PRė Consultant 2007).
25Confidentiality The absolute confidentiality for all mill participants who provided sensitive production data
was strongly stressed both orally and in writing. Confidentiality may have been the main
reason some mills declined to contribute their mill data for the LCI study even if the mill
owners understood the benefits. Some mill owners talked directly to us on this issue to ensure
their information was kept confidential. Only the participating hardwood lumber mill
members, Professor Bowe, and I knew what mill data was provided. No mill owner knew the
production details of the other participating mills. All the primary mill data were aggregated
and weight averaged to a per unit basis of one cubic meter planed dry hardwood lumber (de
Beafort-Langeveld et al 2003, CORRIM 2004, ISO 2005).
26RESULTS and DISCUSSION
Material Flow Mass and energy values, including emissions for hardwood lumber production, were found
by surveying 20 mills in the northeastern United States with detailed questionnaires on mass
flow and energy consumption. Survey data were modeled in SimaPro 7 to find non-wood raw
material use and emission data.
All energy and material values were weight averaged from 20 mills across 20 states in the
northeastern United States (Figure 3) using a spreadsheet. For the 20 mills, 305 million BF
rough green lumber was produced in 2005 out of a total production from this region of 5,100
million BF. This value is roughly 6% (USCB 2006a) of the total United States’ annual 2005
production that exceeded the minimum ISO protocol requirement for data representation
(ISO 1998). Also, 180 million BF and 130 million BF of rough dry lumber and planed dry
lumber, respectively, were produced. Not all sawn lumber was dried or planed prior to
shipping.
For the mass balance, the LCI study examined the four unit processes and the overall process
to track material flow. Overall, 1,170 oven-dried (OD) kg (2,633 OD lb) of incoming
hardwood logs with a density of 854 kg/m3 (53.9 lb/ft3) produced 1.0 m3 (637 bf) of planed
dry lumber (Table 1). Sawing produced 712 OD kg of rough green lumber; the drying
process did not result in any loss of wood substance. Planing reduced the 712 OD kg of
rough dry lumber to 535 OD kg of planed dry lumber, for a 25% reduction in mass. Input and
output sums of 1,301 and 1,311 of the sawing process indicated the difference in calculating
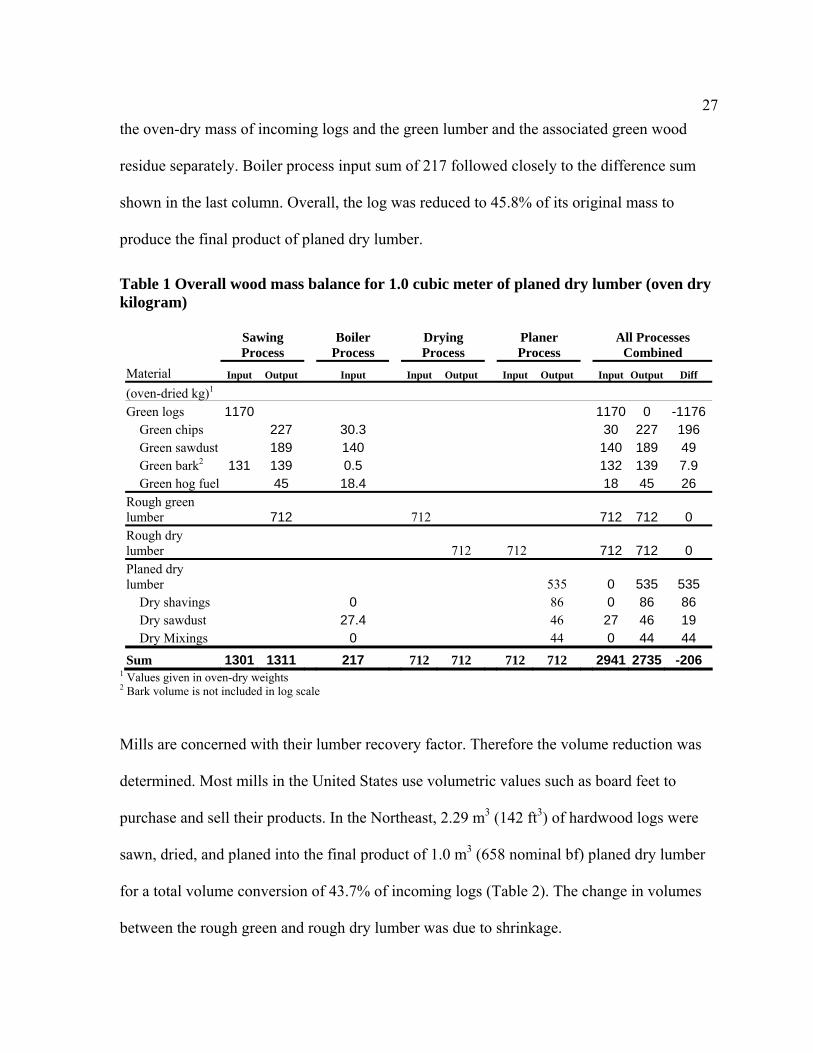
27the oven-dry mass of incoming logs and the green lumber and the associated green wood
residue separately. Boiler process input sum of 217 followed closely to the difference sum
shown in the last column. Overall, the log was reduced to 45.8% of its original mass to
produce the final product of planed dry lumber.
Table 1 Overall wood mass balance for 1.0 cubic meter of planed dry lumber (oven dry kilogram)
1 Values given in oven-dry weights 2 Bark volume is not included in log scale
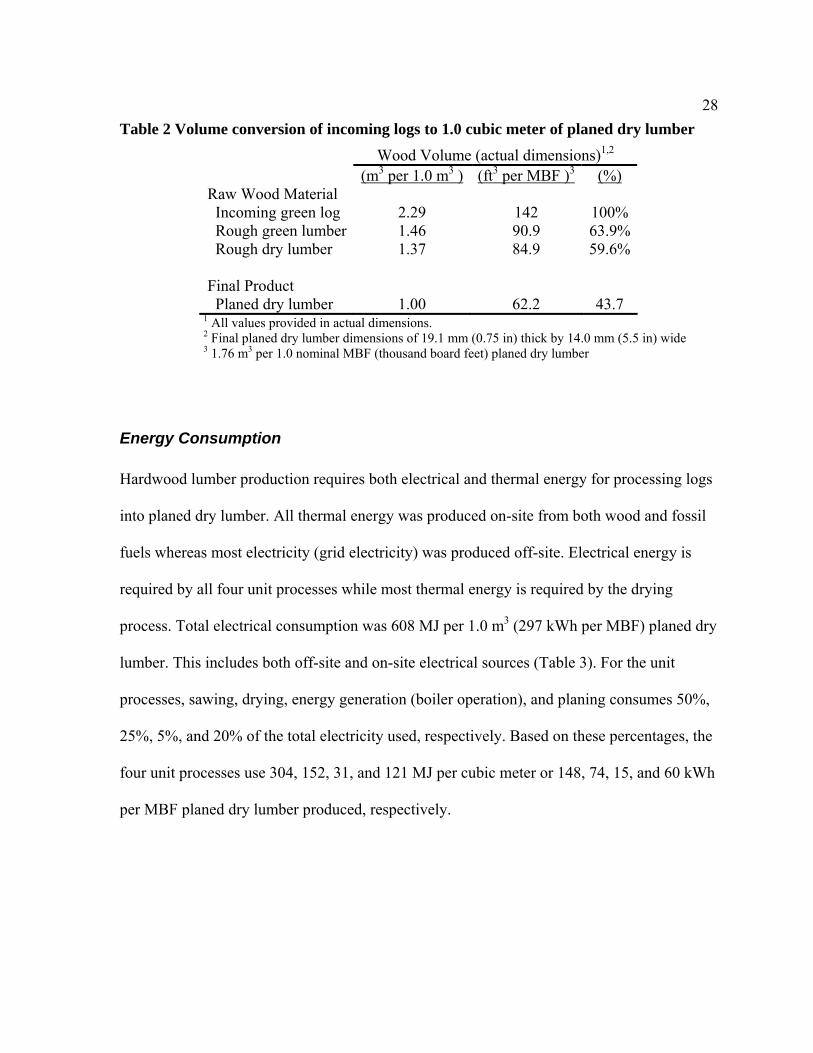
Mills are concerned with their lumber recovery factor. Therefore the volume reduction was
determined. Most mills in the United States use volumetric values such as board feet to
purchase and sell their products. In the Northeast, 2.29 m3 (142 ft3) of hardwood logs were
sawn, dried, and planed into the final product of 1.0 m3 (658 nominal bf) planed dry lumber
for a total volume conversion of 43.7% of incoming logs (Table 2). The change in volumes
between the rough green and rough dry lumber was due to shrinkage.
Sawing Process
Boiler Process
Drying Process
Planer Process
All Processes Combined
Material Input Output Input Input Output Input Output Input Output Diff
(oven-dried kg)1 Green logs 1170 1170 0 -1176 Green chips 227 30.3 30 227 196 Green sawdust 189 140 140 189 49 Green bark2 131 139 0.5 132 139 7.9 Green hog fuel 45 18.4 18 45 26 Rough green lumber 712 712 712 712 0 Rough dry lumber 712 712 712 712 0 Planed dry lumber 535 0 535 535 Dry shavings 0 86 0 86 86 Dry sawdust 27.4 46 27 46 19 Dry Mixings 0 44 0 44 44 Sum 1301 1311 217 712 712 712 712 2941 2735 -206
28Table 2 Volume conversion of incoming logs to 1.0 cubic meter of planed dry lumber
Wood Volume (actual dimensions)1,2
(m3 per 1.0 m3 ) (ft3 per MBF )3 (%) Raw Wood Material Incoming green log 2.29 142 100% Rough green lumber 1.46 90.9 63.9% Rough dry lumber 1.37 84.9 59.6% Final Product
Planed dry lumber 1.00 62.2 43.7 1 All values provided in actual dimensions. 2 Final planed dry lumber dimensions of 19.1 mm (0.75 in) thick by 14.0 mm (5.5 in) wide 3 1.76 m3 per 1.0 nominal MBF (thousand board feet) planed dry lumber
Energy Consumption
Hardwood lumber production requires both electrical and thermal energy for processing logs
into planed dry lumber. All thermal energy was produced on-site from both wood and fossil
fuels whereas most electricity (grid electricity) was produced off-site. Electrical energy is
required by all four unit processes while most thermal energy is required by the drying
process. Total electrical consumption was 608 MJ per 1.0 m3 (297 kWh per MBF) planed dry
lumber. This includes both off-site and on-site electrical sources (Table 3). For the unit
processes, sawing, drying, energy generation (boiler operation), and planing consumes 50%,
25%, 5%, and 20% of the total electricity used, respectively. Based on these percentages, the
four unit processes use 304, 152, 31, and 121 MJ per cubic meter or 148, 74, 15, and 60 kWh
per MBF planed dry lumber produced, respectively.
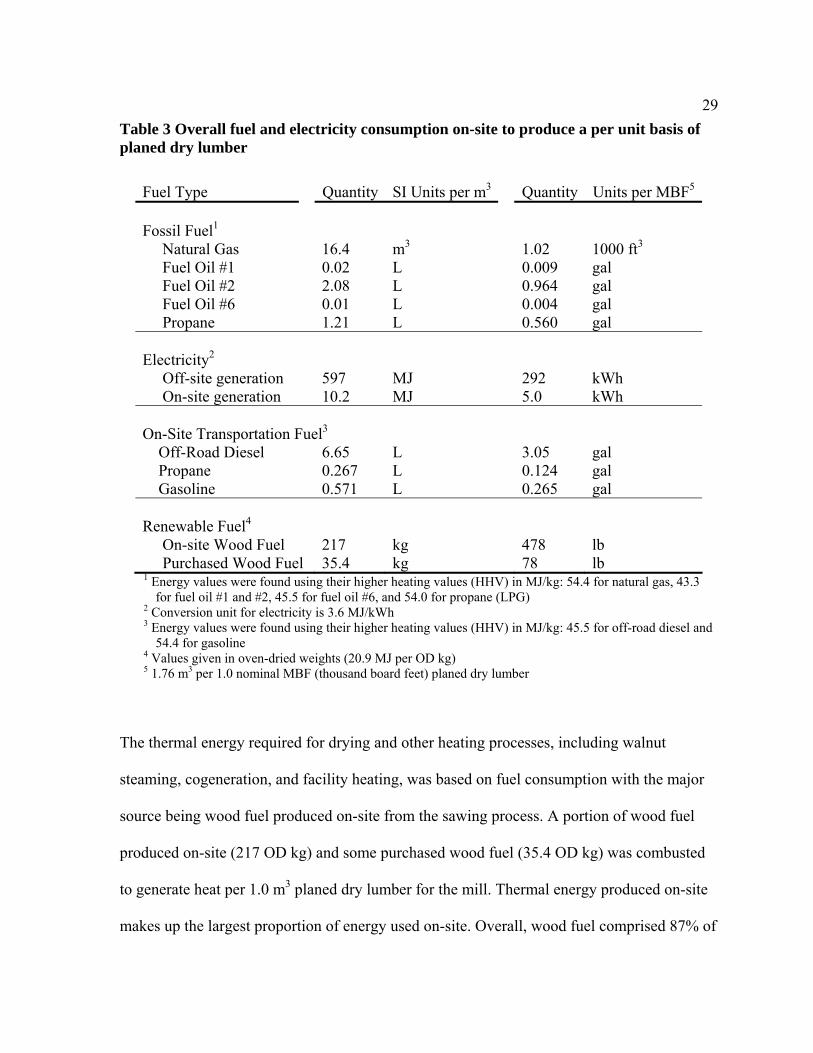
29Table 3 Overall fuel and electricity consumption on-site to produce a per unit basis of planed dry lumber
Fuel Type Quantity SI Units per m3 Quantity Units per MBF5
Fossil Fuel1
Natural Gas 16.4 m3 1.02 1000 ft3
Fuel Oil #1 0.02 L 0.009 gal Fuel Oil #2 2.08 L 0.964 gal Fuel Oil #6 0.01 L 0.004 gal Propane 1.21 L 0.560 gal Electricity2
Off-site generation 597 MJ 292 kWh On-site generation 10.2 MJ 5.0 kWh On-Site Transportation Fuel3
Off-Road Diesel 6.65 L 3.05 gal Propane 0.267 L 0.124 gal Gasoline 0.571 L 0.265 gal Renewable Fuel4 On-site Wood Fuel 217 kg 478 lb Purchased Wood Fuel 35.4 kg 78 lb 1 Energy values were found using their higher heating values (HHV) in MJ/kg: 54.4 for natural gas, 43.3
for fuel oil #1 and #2, 45.5 for fuel oil #6, and 54.0 for propane (LPG) 2 Conversion unit for electricity is 3.6 MJ/kWh 3 Energy values were found using their higher heating values (HHV) in MJ/kg: 45.5 for off-road diesel and
54.4 for gasoline 4 Values given in oven-dried weights (20.9 MJ per OD kg) 5 1.76 m3 per 1.0 nominal MBF (thousand board feet) planed dry lumber
The thermal energy required for drying and other heating processes, including walnut
steaming, cogeneration, and facility heating, was based on fuel consumption with the major
source being wood fuel produced on-site from the sawing process. A portion of wood fuel
produced on-site (217 OD kg) and some purchased wood fuel (35.4 OD kg) was combusted
to generate heat per 1.0 m3 planed dry lumber for the mill. Thermal energy produced on-site
makes up the largest proportion of energy used on-site. Overall, wood fuel comprised 87% of
30total energy consumed on-site with the next largest contributor being natural gas at 11%.
Coal was the largest source of energy used off-site (beyond the mill’s boundary) because
most grid electricity is from coal power plants in the northeastern United States.
On-site transportation of wood stock was a major fuel consumer, with off-road diesel having
the highest consumption. Propane and natural gas are also used for forklifts, front-end
loaders, trucks, and other equipment within the system boundary of the facility. Off-road
diesel consumption is 6.57 liters (L) per unit basis of planed dry lumber and is consumed at
ten times the rate of either propane or gasoline on average. Fuel consumption is broken down
for the unit processes into the following percentage; 60%, 10%, 10%, and 20% for sawing,
drying, energy generation, and planing. The corresponding values of the four processes for
off-road diesel are 3.94, 0.66, 0.66, and 1.31 L, respectively.
The location of the hardwood lumber facility affects the environmental impact because most
electricity used is generated by the electric power industry. For example, the Pacific
Northwest region produces most of their electricity from hydro (Milota et al 2005). In this
study, average composition of (off-site) electrical generation was found for the Northeast by
totaling the amount of the different fuel sources for each of the 20 states given in thousand
kWh and calculating the percentages (USDOE 2006). The most significant electrical power
contributor in the northeastern region was coal, with 58.0% of total electrical utility power
being provided by this fuel source. Other fuel sources are nuclear (23.7%), natural gas
(10.3%), petroleum (3.4%), hydro (2.7%), and other renewable resources (1.9%) (Appendix
C).
31Environmental Impact
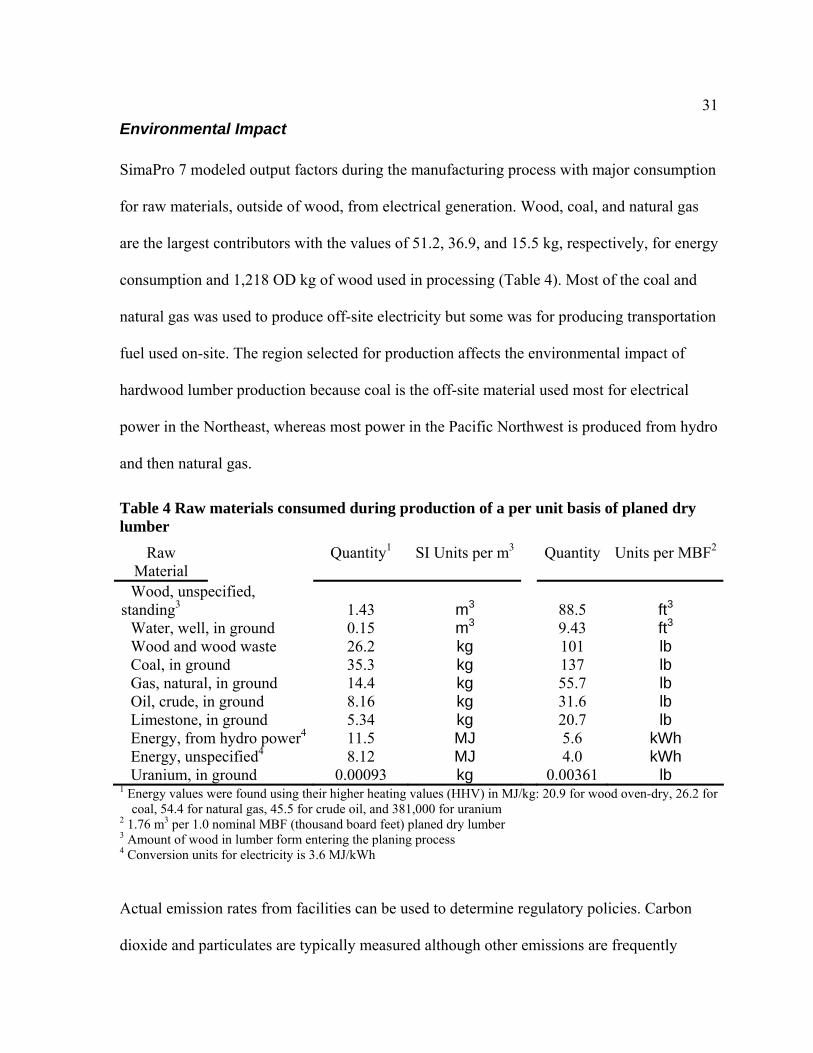
SimaPro 7 modeled output factors during the manufacturing process with major consumption
for raw materials, outside of wood, from electrical generation. Wood, coal, and natural gas
are the largest contributors with the values of 51.2, 36.9, and 15.5 kg, respectively, for energy
consumption and 1,218 OD kg of wood used in processing (Table 4). Most of the coal and
natural gas was used to produce off-site electricity but some was for producing transportation
fuel used on-site. The region selected for production affects the environmental impact of
hardwood lumber production because coal is the off-site material used most for electrical
power in the Northeast, whereas most power in the Pacific Northwest is produced from hydro
and then natural gas.
Table 4 Raw materials consumed during production of a per unit basis of planed dry lumber
Raw Material
Quantity1 SI Units per m3 Quantity Units per MBF2
Wood, unspecified, standing3 1.43 m3 88.5 ft3
Water, well, in ground 0.15 m3 9.43 ft3 Wood and wood waste 26.2 kg 101 lb Coal, in ground 35.3 kg 137 lb Gas, natural, in ground 14.4 kg 55.7 lb Oil, crude, in ground 8.16 kg 31.6 lb Limestone, in ground 5.34 kg 20.7 lb Energy, from hydro power4 11.5 MJ 5.6 kWh Energy, unspecified4 8.12 MJ 4.0 kWh Uranium, in ground 0.00093 kg 0.00361 lb
1 Energy values were found using their higher heating values (HHV) in MJ/kg: 20.9 for wood oven-dry, 26.2 for coal, 54.4 for natural gas, 45.5 for crude oil, and 381,000 for uranium
2 1.76 m3 per 1.0 nominal MBF (thousand board feet) planed dry lumber 3 Amount of wood in lumber form entering the planing process 4 Conversion units for electricity is 3.6 MJ/kWh
Actual emission rates from facilities can be used to determine regulatory policies. Carbon
dioxide and particulates are typically measured although other emissions are frequently
32monitored to ensure compliance. Carbon dioxide (CO2) emissions are separated into two fuel
sources: biogenic (biomass-derived) and anthropogenic (fossil fuel-derived). Biogenic CO2 is
carbon-neutral because the CO2 emitted is reabsorbed during the growth of the tree and
released upon the decomposition or burning of the tree. Anthropogenic CO2 is not
considered renewable thus carbon-neutral. Emission values of 428 and 139 kg were modeled
from SimaPro for CO2 (biogenic) and CO2 (anthropogenic), respectively (Table 5) based on
material flow and energy type and consumption. Research into measuring volatile organic
gases (VOC) produced from drying lumber generated the value of 1.20 kg and is species,
temperature, and moisture dependent, with the highest VOC emissions from red oak (Rice
and Erich 2006).
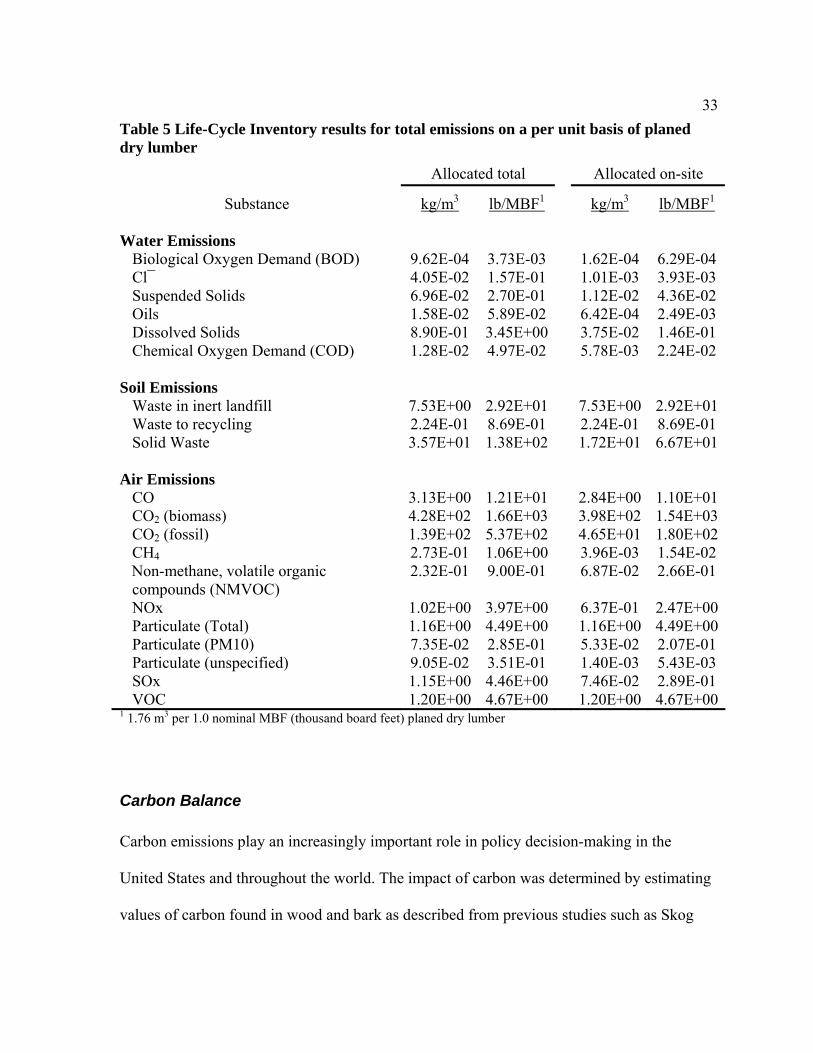
33Table 5 Life-Cycle Inventory results for total emissions on a per unit basis of planed dry lumber
Allocated total Allocated on-site
Substance kg/m3 lb/MBF1 kg/m3 lb/MBF1
Water Emissions
Biological Oxygen Demand (BOD) 9.62E-04 3.73E-03 1.62E-04 6.29E-04 Cl¯ 4.05E-02 1.57E-01 1.01E-03 3.93E-03 Suspended Solids 6.96E-02 2.70E-01 1.12E-02 4.36E-02 Oils 1.58E-02 5.89E-02 6.42E-04 2.49E-03 Dissolved Solids 8.90E-01 3.45E+00 3.75E-02 1.46E-01 Chemical Oxygen Demand (COD) 1.28E-02 4.97E-02 5.78E-03 2.24E-02
Soil Emissions
Waste in inert landfill 7.53E+00 2.92E+01 7.53E+00 2.92E+01Waste to recycling 2.24E-01 8.69E-01 2.24E-01 8.69E-01 Solid Waste 3.57E+01 1.38E+02 1.72E+01 6.67E+01
Air Emissions
CO 3.13E+00 1.21E+01 2.84E+00 1.10E+01CO2 (biomass) 4.28E+02 1.66E+03 3.98E+02 1.54E+03CO2 (fossil) 1.39E+02 5.37E+02 4.65E+01 1.80E+02CH4 2.73E-01 1.06E+00 3.96E-03 1.54E-02 Non-methane, volatile organic compounds (NMVOC)
2.32E-01 9.00E-01 6.87E-02 2.66E-01
NOx 1.02E+00 3.97E+00 6.37E-01 2.47E+00Particulate (Total) 1.16E+00 4.49E+00 1.16E+00 4.49E+00Particulate (PM10) 7.35E-02 2.85E-01 5.33E-02 2.07E-01 Particulate (unspecified) 9.05E-02 3.51E-01 1.40E-03 5.43E-03 SOx 1.15E+00 4.46E+00 7.46E-02 2.89E-01 VOC 1.20E+00 4.67E+00 1.20E+00 4.67E+00
1 1.76 m3 per 1.0 nominal MBF (thousand board feet) planed dry lumber
Carbon Balance Carbon emissions play an increasingly important role in policy decision-making in the
United States and throughout the world. The impact of carbon was determined by estimating
values of carbon found in wood and bark as described from previous studies such as Skog
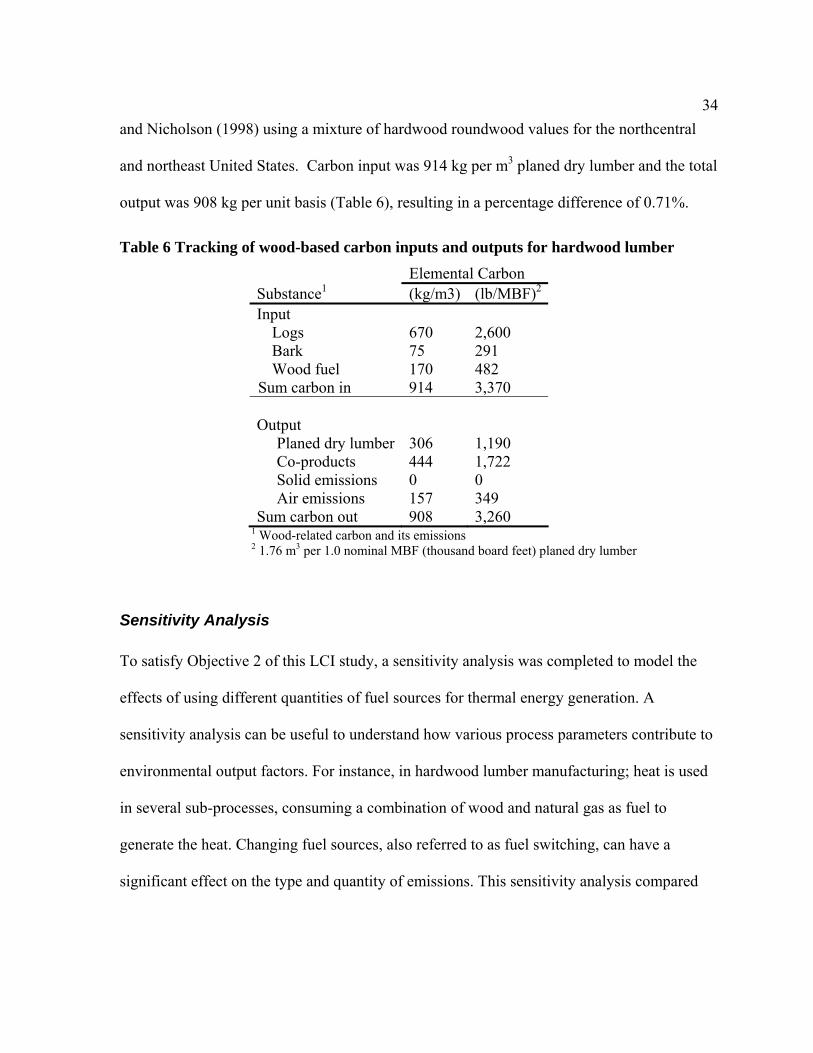
34and Nicholson (1998) using a mixture of hardwood roundwood values for the northcentral
and northeast United States. Carbon input was 914 kg per m3 planed dry lumber and the total
output was 908 kg per unit basis (Table 6), resulting in a percentage difference of 0.71%.
Table 6 Tracking of wood-based carbon inputs and outputs for hardwood lumber Elemental Carbon Substance1 (kg/m3) (lb/MBF)2
Input Logs 670 2,600 Bark 75 291 Wood fuel 170 482
Sum carbon in 914 3,370 Output Planed dry lumber 306 1,190 Co-products 444 1,722 Solid emissions 0 0 Air emissions 157 349 Sum carbon out 908 3,260
1 Wood-related carbon and its emissions 2 1.76 m3 per 1.0 nominal MBF (thousand board feet) planed dry lumber
Sensitivity Analysis To satisfy Objective 2 of this LCI study, a sensitivity analysis was completed to model the
effects of using different quantities of fuel sources for thermal energy generation. A
sensitivity analysis can be useful to understand how various process parameters contribute to
environmental output factors. For instance, in hardwood lumber manufacturing; heat is used
in several sub-processes, consuming a combination of wood and natural gas as fuel to
generate the heat. Changing fuel sources, also referred to as fuel switching, can have a
significant effect on the type and quantity of emissions. This sensitivity analysis compared
35the effects of using all on-site produced wood fuel—consisting of mostly green sawdust and
green chips from the sawing process—or natural gas as a fuel input.
For the “base” fuel mix in this LCI study, there were four fuel sources with wood fuel and
natural gas contributing the majority of the energy. Propane and fuel oil contributed about
2% with the bulk being used for facility heating. The original model based on survey data
assumed 87.2% of the fuel used was in the form of wood fuel, with 74.4% produced on-site
and the rest purchased, and 10.8% as natural gas. Most mills use only one or two types of
fuel source, whereas the original study resulted in an average model incorporating different
fuel sources taken from primary mill data for the 20 mills. There were two alternative fuel
use schemes to this “average mill” to be used in this sensitivity analysis. One alternative was
assuming total on-site wood fuel use by increasing the initial value of 240 to 300 OD kg for
the all (100%) wood fuel case to generate 5,800 MJ of energy per cubic meter (9.66 million
BTU per MBF) of planed dry lumber. The second alternative had natural gas use increase
from 16.4 to 151 m3 for the all (100%) natural gas case.
This sensitivity analysis examined three scenarios for heat generation using the base fuel
mix, all (100%) natural gas, and all (100%) on-site produced wood fuel cases. These three
scenarios were modeled: 1) comparing all (100%) natural gas to the base hardwood lumber
model, with no fuel changes and incorporating both natural gas and wood fuel, 2) comparing
all (100%) on-site produced wood fuel to the base hardwood lumber model, with no changes,
and 3) comparing all (100%) natural gas to all (100%) on-site produced wood fuel as energy
for heat.
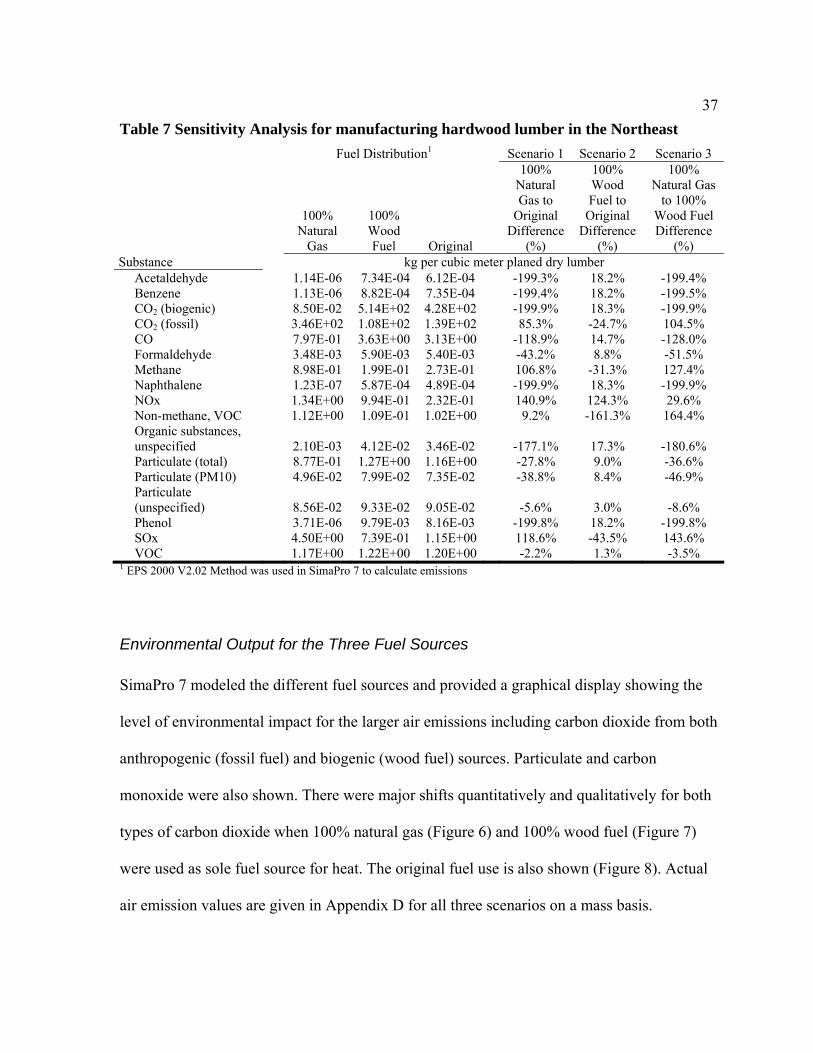
36Sensitivity Analysis Results Table 7 is a summary of the three fuel use scenarios, with a partial list of air emissions for the
Northeast. In the scenarios 1 and 2, a negative percentage difference number indicated that
the alternative fuel source released fewer emissions than did the base model. A positive
percentage difference means that the “base” or original model releases fewer emissions.
Scenario 1 indicated that less particulate and biogenic CO2 but more fossil CO2, SOx, and
NOx were produced when burning 100% natural gas compared to the base fuel mix
(original). Scenario 2 showed the opposite as more biogenic CO2 and particulate but less
fossil CO2, SOx, and NOx were produced when burning 100% wood fuel compared to the
base fuel mix (original). In scenario 3, a negative number indicates that the all natural gas
case releases fewer emissions than all on-site produced wood fuel case and a positive
percentage number means that all on-site produced wood fuel model releases fewer
emissions. Scenario 3 highlighted the difference when larger amounts of wood fuel was
consumed as the amount of fossil CO2, SOx, and NOx produced increased from Scenario 1
but less particulate and biogenic CO2 was produced when compared to Scenario 2. For all
three scenarios, the amount of VOC produced was significantly different regardless of the
fuel used because most VOC originated in the actual drying of the hardwood lumber.
37Table 7 Sensitivity Analysis for manufacturing hardwood lumber in the Northeast
Fuel Distribution1 Scenario 1 Scenario 2 Scenario 3
100% Natural
Gas
100% Wood Fuel Original
100% Natural Gas to
Original Difference
(%)
100% Wood Fuel to
Original Difference
(%)
100% Natural Gas
to 100% Wood Fuel Difference
(%) Substance kg per cubic meter planed dry lumber
Acetaldehyde 1.14E-06 7.34E-04 6.12E-04 -199.3% 18.2% -199.4% Benzene 1.13E-06 8.82E-04 7.35E-04 -199.4% 18.2% -199.5% CO2 (biogenic) 8.50E-02 5.14E+02 4.28E+02 -199.9% 18.3% -199.9% CO2 (fossil) 3.46E+02 1.08E+02 1.39E+02 85.3% -24.7% 104.5% CO 7.97E-01 3.63E+00 3.13E+00 -118.9% 14.7% -128.0% Formaldehyde 3.48E-03 5.90E-03 5.40E-03 -43.2% 8.8% -51.5% Methane 8.98E-01 1.99E-01 2.73E-01 106.8% -31.3% 127.4% Naphthalene 1.23E-07 5.87E-04 4.89E-04 -199.9% 18.3% -199.9% NOx 1.34E+00 9.94E-01 2.32E-01 140.9% 124.3% 29.6% Non-methane, VOC 1.12E+00 1.09E-01 1.02E+00 9.2% -161.3% 164.4% Organic substances, unspecified
2.10E-03 4.12E-02 3.46E-02
-177.1% 17.3% -180.6%
Particulate (total) 8.77E-01 1.27E+00 1.16E+00 -27.8% 9.0% -36.6% Particulate (PM10) 4.96E-02 7.99E-02 7.35E-02 -38.8% 8.4% -46.9% Particulate (unspecified)
8.56E-02 9.33E-02 9.05E-02
-5.6% 3.0% -8.6%
Phenol 3.71E-06 9.79E-03 8.16E-03 -199.8% 18.2% -199.8% SOx 4.50E+00 7.39E-01 1.15E+00 118.6% -43.5% 143.6% VOC 1.17E+00 1.22E+00 1.20E+00 -2.2% 1.3% -3.5%
1 EPS 2000 V2.02 Method was used in SimaPro 7 to calculate emissions
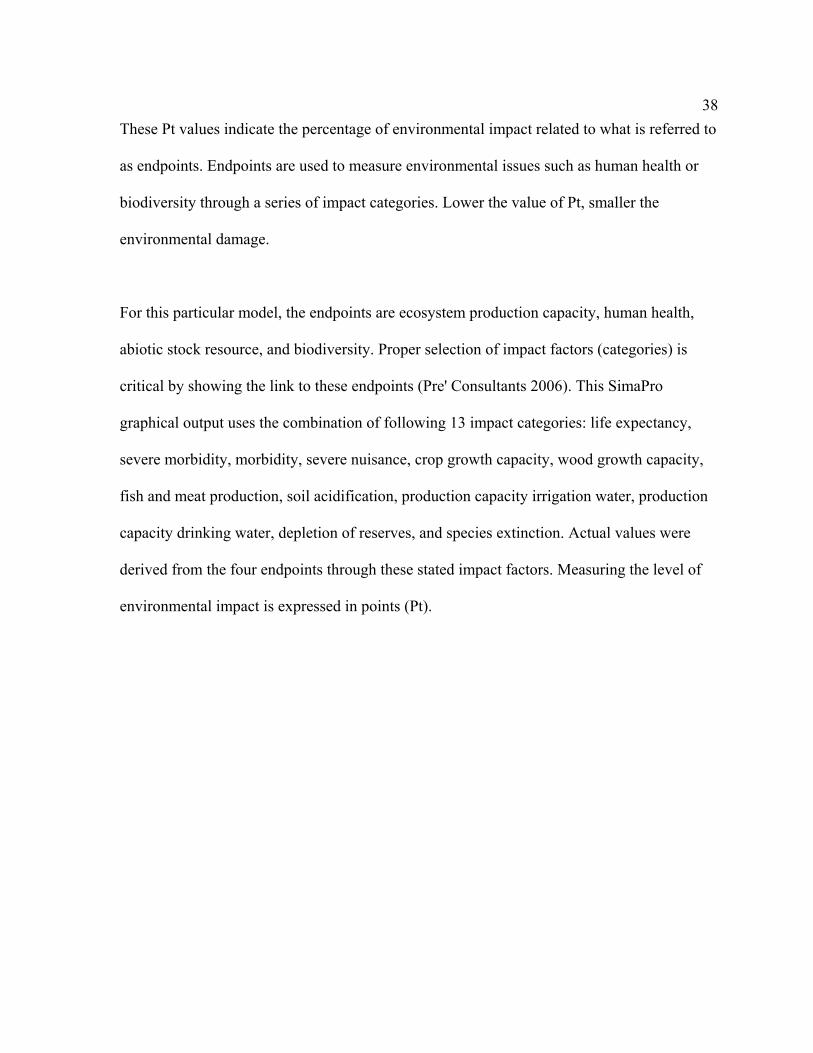
Environmental Output for the Three Fuel Sources SimaPro 7 modeled the different fuel sources and provided a graphical display showing the
level of environmental impact for the larger air emissions including carbon dioxide from both
anthropogenic (fossil fuel) and biogenic (wood fuel) sources. Particulate and carbon
monoxide were also shown. There were major shifts quantitatively and qualitatively for both
types of carbon dioxide when 100% natural gas (Figure 6) and 100% wood fuel (Figure 7)
were used as sole fuel source for heat. The original fuel use is also shown (Figure 8). Actual
air emission values are given in Appendix D for all three scenarios on a mass basis.
38These Pt values indicate the percentage of environmental impact related to what is referred to
as endpoints. Endpoints are used to measure environmental issues such as human health or
biodiversity through a series of impact categories. Lower the value of Pt, smaller the
environmental damage.
For this particular model, the endpoints are ecosystem production capacity, human health,
abiotic stock resource, and biodiversity. Proper selection of impact factors (categories) is
critical by showing the link to these endpoints (Pre' Consultants 2006). This SimaPro
graphical output uses the combination of following 13 impact categories: life expectancy,
severe morbidity, morbidity, severe nuisance, crop growth capacity, wood growth capacity,
fish and meat production, soil acidification, production capacity irrigation water, production
capacity drinking water, depletion of reserves, and species extinction. Actual values were
derived from the four endpoints through these stated impact factors. Measuring the level of
environmental impact is expressed in points (Pt).
39
Figure 6. SimaPro 7 model output showing the major air emissions and their level of environmental impact for the 100% natural gas scenario
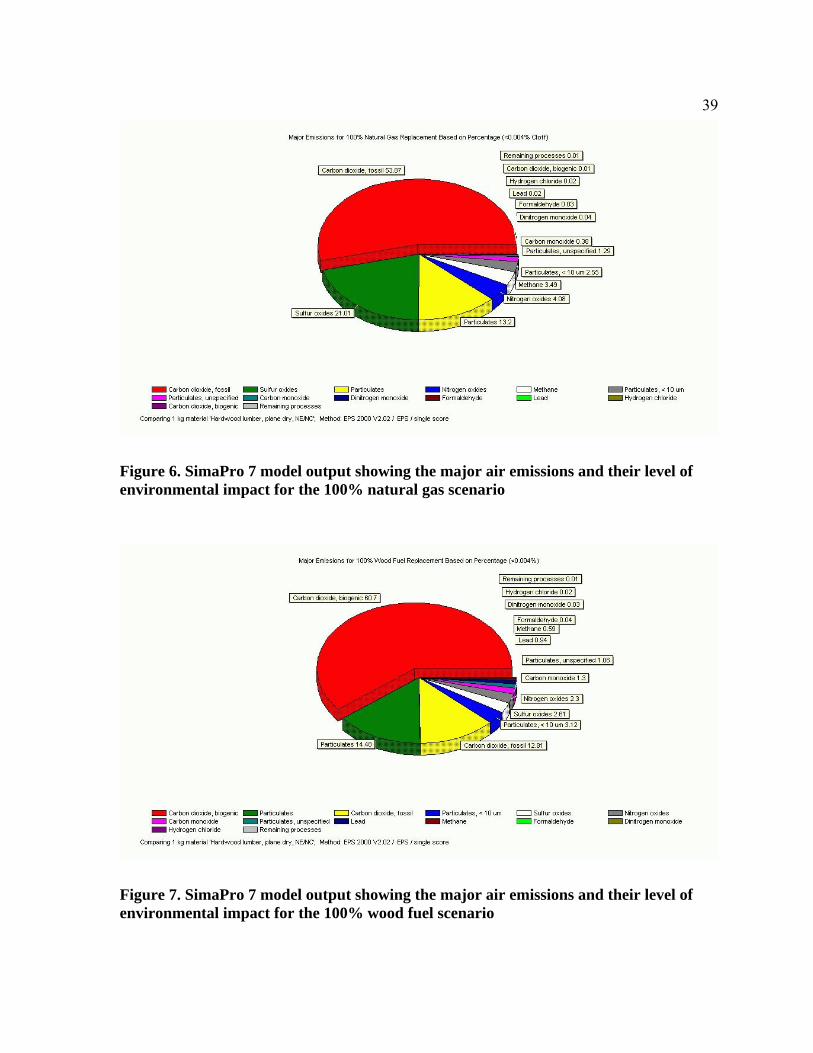
Figure 7. SimaPro 7 model output showing the major air emissions and their level of environmental impact for the 100% wood fuel scenario
40
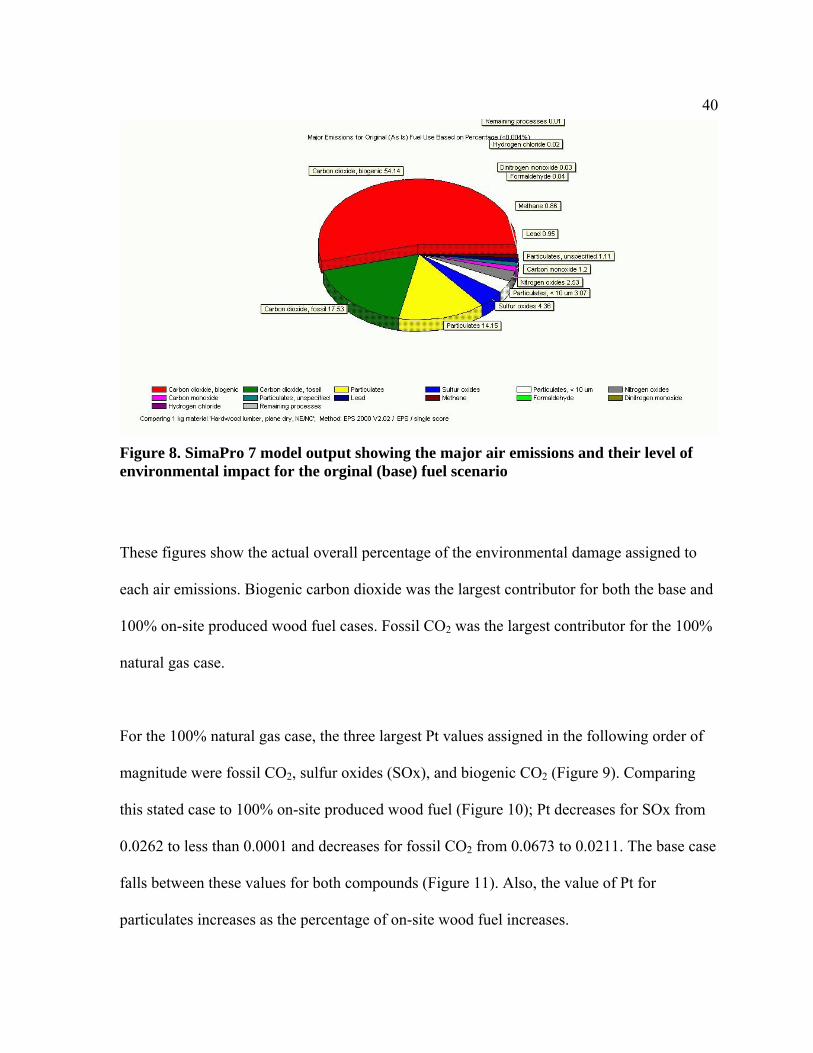
Figure 8. SimaPro 7 model output showing the major air emissions and their level of environmental impact for the orginal (base) fuel scenario
These figures show the actual overall percentage of the environmental damage assigned to
each air emissions. Biogenic carbon dioxide was the largest contributor for both the base and
100% on-site produced wood fuel cases. Fossil CO2 was the largest contributor for the 100%
natural gas case.
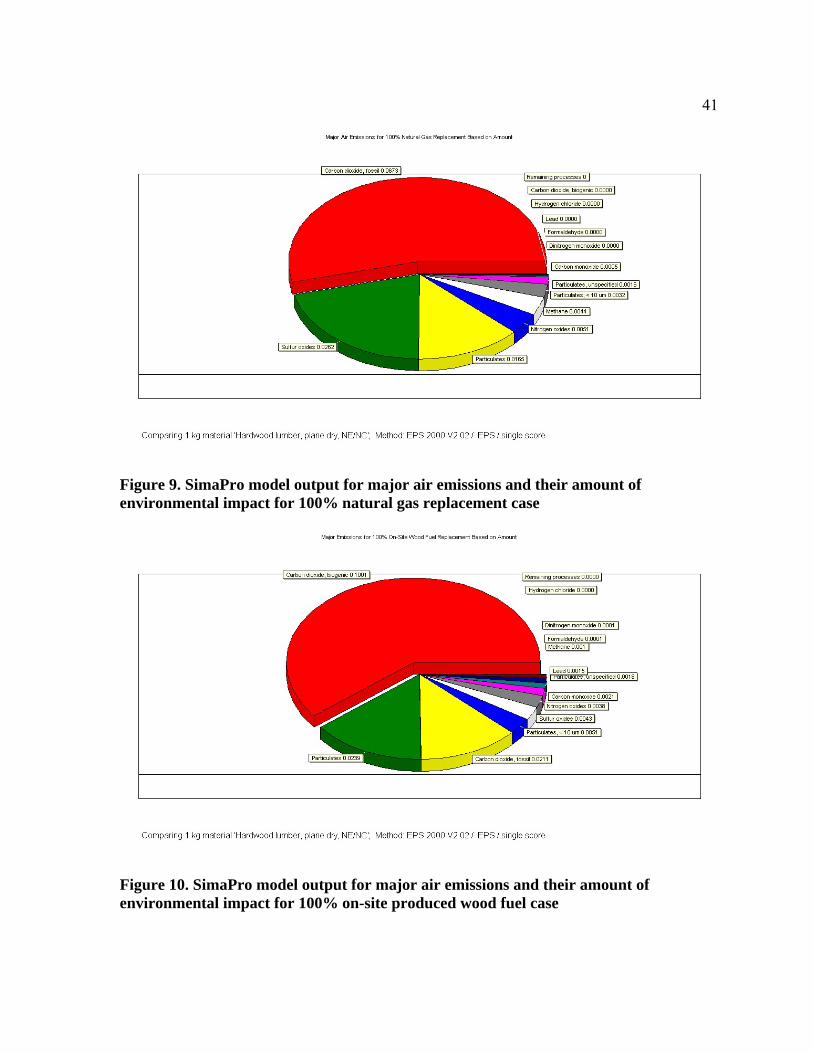
For the 100% natural gas case, the three largest Pt values assigned in the following order of
magnitude were fossil CO2, sulfur oxides (SOx), and biogenic CO2 (Figure 9). Comparing
this stated case to 100% on-site produced wood fuel (Figure 10); Pt decreases for SOx from
0.0262 to less than 0.0001 and decreases for fossil CO2 from 0.0673 to 0.0211. The base case
falls between these values for both compounds (Figure 11). Also, the value of Pt for
particulates increases as the percentage of on-site wood fuel increases.
41
Figure 9. SimaPro model output for major air emissions and their amount of environmental impact for 100% natural gas replacement case
Figure 10. SimaPro model output for major air emissions and their amount of environmental impact for 100% on-site produced wood fuel case
42
Figure 11. SimaPro model output for major air emissions and their amount of environmental impact for the original (base) fuel case
Based on these results, capturing more particulates from on-site boilers using wood fuel
would improve the environmental performance of hardwood sawmills. Furthermore, how
SimaPro determined the environmental impact through the four endpoints affects the values
of Pt. For example, placing a higher Pt number, 0.1001, for biogenic CO2 on the 100% on-
site produced wood fuel case than the Pt value, 0.0673, for fossil CO2 on the 100% natural
gas needs to further examined considering natural gas is neither renewable nor carbon-neutral
unlike wood fuel.
STUDY SUMMARY A rigorous material and energy balance was completed on 20 hardwood mills located in the
northeastern United States. The results indicate that total energy consumption varied
43significantly, depending on the species sawn, age of the boiler and dry kiln equipment, and
method of drying. For hardwood lumber, an average thermal consumption of 5,800 MJ per
cubic meter (9.66 million BTU per MBF) and electrical energy use of 608 MJ per cubic
meter (297 kWh per MBF) planed dry lumber were found. Two mills produced their own
electrical power from the wood residue produced on-site and consumed about four times the
amount of wood residue than mills that did not produce their electrical power per unit
volume of lumber dried.
Electrical consumption varied significantly, depending on whether the mill used
dehumidification, predryers, or air yards to dry lumber. Two mills using dehumidification
kilns consumed 45.3% more electrical energy compared to the other mills, although
dehumidification kilns used less than 5% of the average thermal energy. Most mills
producing red and white oak lumber used predryers and air yards to lower moisture content
prior to kiln drying to reduce time in the kilns. Mills running predyers used 64.5% more
electricity than did the average mill.
Thermal energy use also varied considerably, depending on whether the mill ran a walnut
steamer or a cogeneration unit. Four mills operated a walnut steamer. Thermal energy was
reduced by 45.3% for on-site wood fuel use from 151 to 83 OD kg per m3 planed dry lumber
when the mills steaming walnut and producing on-site electricity were not used in
calculations. This is significant because wood fuel produced on-site provides about 74% of
the total thermal energy required.
44LCI projects for softwood lumber production consumed less electrical and thermal energy in
their production (Milota et al 2005) compared to hardwood lumber (Table 7). There are
several reasons for this. One reason is that hardwood lumber requires longer drying times and
more thermal energy is consumed for the same volume of product. Another reason is that
hardwood lumber is more likely to be converted to high-grade lumber. Other reasons include
the fact that hardwood is generally more dense than softwood lumber and hardwood lumber
is sawn thinner as well so more electrical energy is consumed in the sawing process. In this
study, the Northeast used more energy to keep the facility heated during winter months
compared to the Pacific Northwest and Southeast.
Table 8 Comparison of hardwood to softwood lumber energy use Overall Energy Consumption 1,2 Electrical Energy Thermal Energy (MJ per
m3 ) (kWh per MBF
) (MJ per m3
) (BTU per MBF
) Hardwood Lumber 597 2973 5,400 9.6 million3
Softwood Lumber 3354 151 3,600 5.5 million 1 All values provided in actual dimensions. 2 Final planed dry lumber dimensions of 19.1 mm (0.75 in) thick by 14.0 mm (5.5 in) wide 3 1.76 m3 per 1.0 nominal MBF (thousand board feet) planed dry lumber and includes walnut steaming and
plant heating 4 1.623 m3 per 1.0 nominal MBF (thousand board feet) planed dry lumber; 3.6 MJ per kWh, 1054 MJ per
million BTU
Total energy consumption per cubic meter of planed dry hardwood lumber was found to be
comparable to published data (Armstrong and Brock 1989; Comstock 1975). However,
unlike previous studies, processes such as walnut steaming, facility heating, and cogeneration
were examined because their energy use was significant. Wood has two significant
advantages over non-wood substitutes; wood is carbon-neutral and carbon can be sequestered
45(captured and stored). Therefore, using wood as a fuel or in a finished wood product from
hardwood lumber could be considered a sustainable practice. Other non-wood products
typically do not have the benefits of a carbon-neutral product to use both as a fuel and a
finished product. Also, decreasing energy consumption would be of great benefit to the mills,
especially in sawing and drying.
There are several approaches to lowering energy consumption, and the mills that incorporate
these methods would ultimately have significantly lower energy use. The most energy
efficient method would be upgrading or refurbishing the mill’s aging dry kiln facilities at
mills currently using more than 1.5 times the amount of energy per MBF than the mill using
similar drying technology with similar specie composition. This may also improve lumber
quality because the newer dry kilns will probably have greater precision and accuracy in
maintaining kiln temperatures and fan speeds. Sawing lumber manually (without computer
assistance) may increase sawing errors, and thus sawing time and electrical costs. Using
improved sawing practices such as the Best Opening Face program (Harpole and Hallock
1977) and thinner saw kerfs have increased lumber yields while lowering electricity
consumption.
Another approach reduces thermal energy use. Several different drying methods can be used
depending on species, fuel costs, and wood residue use. Air drying lumber is one such
method but has not been the preferred method of drying due to drying degrade and large
quantity of drying stock required except for slow-drying species like red and white oak.
Drying degrade is a reduction in lumber quality caused by drying; greater control of the
46drying process typically reduces drying degrade. Maintaining a large lumber inventory for air
drying reduces profits due to delays in recovery investments. Air drying lumber has the
lowest control among the different drying methods, resulting in the highest level of degrade
although it provides the lowest energy use of all drying methods.
CONCLUSIONS Based on the Life-Cycle Inventory results, the following conclusions are drawn:
• More on-site wood fuel consumption would reduce fossil greenhouse gases but
increases other gases and particulate.
• Increasing the level of air drying lumber prior to kiln drying, especially for species
where color is not a problem, would lower the amount of energy required for the
drying process. Therefore improving air drying methods would lower energy use
while maintaining lumber quality and reducing the environmental impact of
hardwood lumber.
• Sawing consumes the highest proportion of electricity in the manufacturing of
hardwood lumber. Thus, installing optimization equipment would lower electrical
consumption by reducing sawing errors and time.
• Drying consumes the highest proportion of fuel. Lower overall energy consumption
by upgrading or overhauling existing old and inefficient dry kiln facilities.
• Once the competing non-wood substitutes have been inventoried, product selection
for sustainable building could be used to compare vinyl to hardwood moulding or
carpet systems to solid hardwood flooring.

47Caution is required when using wood product LCI studies and the final LCA for comparison
to non-wood products. It may be more important to know exactly how much material is
needed for the same use instead of basing comparisons on a volume or mass basis. An
example would be how much hardwood flooring would be needed compared to a carpet
system with a sub-floor. Floors and carpets are measured in square feet and yards,
respectively, in the United States. This study results give all values based on a cubic meter;
therefore, thickness of material is a critical dimension for consideration.
Another problem is distortion of data or taking results out of context without considering the
true overall environmental effect. Some marketing methods will only highlight certain
aspects of their products while minimizing others. Most likely, misuse of LCI studies will
cause a loss of faith in the LCA method unless strict guidelines are developed and adopted.
48
LITERATURE CITED ARMSTRONG, J.P., AND S.M. BROCK. 1989. Predicting fuel consumption of central
Appalachian kiln-drying enterprises. Forest Prod. J. 39(3):57-61
BENEDICK, RICHARD E. 2000. Human Population and Environmental Stresses in the
Twenty-first Century. Environmental Change & Security Project Report, Issue 6
(Summer 2000) pp.18
BOYD, C.W., P. KOCH, H.B. McKEAN, C.R. MORSCHAUSER, S.B. PRESTON, AND
WANGAARD, F.F. 1976. Wood for structural and architectural purposes. Wood
Fiber Sci. 8 Special CORRIM Panel II Report :pp. 3-72
BOWYER, J., J. HOWE, P. GUILLERY AND K. FERNHOLZ. 2005. Life-Cycle Analysis:
A Key to Better Environmental Decisions. Dovetail, Inc. 10 pp.
COMSTOCK, G.L. 1975. Energy requirements for drying of wood products. In: Wood
Residues as an Energy Source. Proc. No. P-75-13: 8-12
CONSORTIUM FOR RESEARCH ON RENEWABLE INDUSTRIAL MATERIALS
(CORRIM). 2004. Research Guidelines for Life-Cycle Inventories. CORRIM, Inc.
University of Washington, Seattle, WA. April. 47 pp.
DE BEAFORT-LANGEVELD, A.S.H, R.BRETZ, R. HISCHIER, M. HUIJBREGTS, P.
JEAN, T. TANNER, AND G.VAN HOOF. 2003. Code of Life-Cycle Inventory
practices. Penscola, FL., USA: Society of Environmental Toxicology and Chemistry
(SETAC). 160 pp.
DENIG, J., E. M. WENGERT, AND W. T. SIMPSON. 2000. Drying hardwoods lumber
Gen. Tech. Rep. FPL-GTR-118. USDA Forest Service, Forest Products Laboratory,
Madison, WI.138 pp
49DUDA, M., AND J.S. SHAW. 1997. From Cradle to Grave: Measuring Products'
Environmental Impact. USA Today Magazine. Volume124, Issue 2624, pp 54 ff.
Editorial.
FOREST PRODUCTS LABORATORY (FPL). 1999. Wood handbook: Wood as an
engineering material. Gen. Tech. Rep. FPL-GTR-113. USDA Forest Service, Forest
Products Laboratory, Madison, WI. 463 pp.
HARDWOOD MARKET REPORT (HMR). 2006. 2005: The year at a glance. 9th annual
statistical analysis of the North American hardwood marketplace. HMR. Memphis,
TN. 168 pp.
HARPOLE, G. B., AND H. HALLOCK, 1977. Investment opportunity: Best opening face
sawing. USDA Forest Serv. Res. Pap. FPL 291. 9 pp.
INTERNATIONAL ORGANIZATION FOR STANDARDIZATION (ISO). 1998.
Environmental management—Life-Cycle assessment—goal and scope definition and
inventory analysis. ISO 14041. First Edition 1998-10-01. Geneva, Switzerland. 26 pp.
________. 2005. Environmental management—Life-Cycle assessment—Requirements and
guidelines. ISO 14044. Draft International Standard. Geneva, Switzerland. 45 pp.
LIPPKE, B., J. WILSON, J. PEREZ-GARCIA, J. BOWYER, AND J. MEIL. 2004.
CORRIM: Life-Cycle Environmental Performance of Renewable Building Materials.
Forest Prod. J. Vol. 54, No. 6. pp. 7-19
McGRAW HILL CONSTRUCTION (MHC). 2006. Green Building Smartmarket Report.
New York, NY:. HD9715.U5 G69
MILOTA, M. R., C. D. WEST, AND I. D. HARTLEY. 2005. Gate-to-gate life inventory of
softwood lumber production. Wood Fiber Sci. 37 CORRIM Special Issue:pp. 47-57
50NATIONAL HARDWOOD LUMBER ASSOCIATION (NHLA). 2007. Rules for the
Measurement & Inspection of Hardwood & Cypress. NHLA. Memphis, TN. 104 pp.
NATIONAL RENEWABLE ENERGY LABORATORY (NREL). 2007. Life-Cycle
Inventory database project. http://www.nrel.gov/lci/. (27 Feb 2007).
PEUTTMANN, M.E. AND J.B. WILSON. 2005. Gate-to-gate Life-Cycle Inventory of glue-
laminated timbers production. Wood Fiber Sci. 37 CORRIM Special Issue:pp. 99-113
PRÉ CONSULTANTS. 2006. Introduction to LCA with SimaPro 7. March 2006. Plotter 12,
3821 BB Amersfoort, The Netherlands. pp. 92
____________. 2007. SimaPro 7 Life-Cycle assessment software package, Version 7. Plotter
12, 3821 BB Amersfoort, The Netherlands. http://www.pre.nl/. (27 Feb 07).
RICE, R.W. AND M. SUSAN ERICH. 2006. Estimated VOC Losses During the Drying of
Six Eastern Hardwood Species. Forest Prod. J. Vol. 56, No. 10. pp. 48-51
SKOG, K.E. AND G.A. NICHOLSON. 1998. Carbon cycling through wood products: The
role of wood and paper products in carbon sequestration. Forest Prod. J. Vol. 48, No.
7/8. pp. 75-83
SPELTER, H. 2002. Conversion of board foot logs to cubic meters in Washington State,
1970-1998. General Technical Report FPL-GTR-131. Madison, WI: USDA Forest
Service, Forest Products Laboratory.
UNITED STATES DEPARTMENT OF ENERGY (USDOE). 2006. Net Generation by
Energy Source by Type of Producer.
http://www.eia.doe.gov/cneaf/electricity/epa/generation_state.xls (15 January 2007)
UNITED STATES CENSUS BUREAU (USCB). 2006a. Lumber Production and Mill
Stocks: 2005. http://www.census.gov/industry/1/ma321t05.pdf (10 October 2006)
51UNITED STATES CENSUS BUREAU (USCB). 2006b. New Residential Construction
Index: 2006. http://www.census.gov/const/www/newresconstindex.html (19 March
2007)
WENGERT, E.M. 1980. How to reduce energy consumption in kiln-drying lumber. Research
Note FPL-RN-0228. Madison, WI: USDA Forest Service, Forest Products
Laboratory.
WILSON, J.B., AND E.T. SAKIMOTO. 2005. Gate-to-gate Life-Cycle Inventory of
softwood lumber production. Wood Fiber Sci. 37 CORRIM Special Issue:pp. 58-73
________, AND E.R. DANCER. 2005. Gate-to-gate Life-Cycle Inventory of I-joist
production. Wood Fiber Sci. 37 CORRIM Special Issue:pp. 85-98
________, AND E.R. DANCER. 2005. Gate-to-gate Life-Cycle Inventory of laminated
veneer lumber production. Wood Fiber Sci. 37 CORRIM Special Issue:pp. 114-127

52
APPENDICES Appendix A - Page 1: Primary Mill Data questionnaire: Introduction and Questionnaire
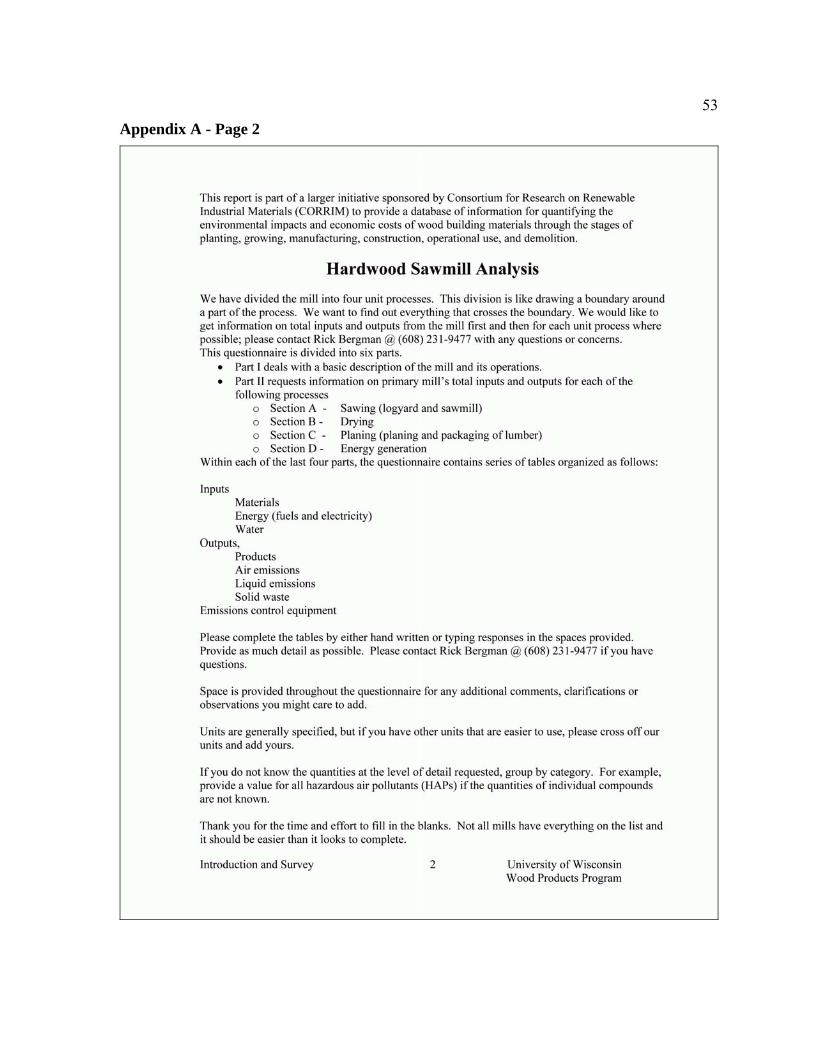
53Appendix A - Page 2

54Appendix A - Page 3

55Appendix A - Page 4
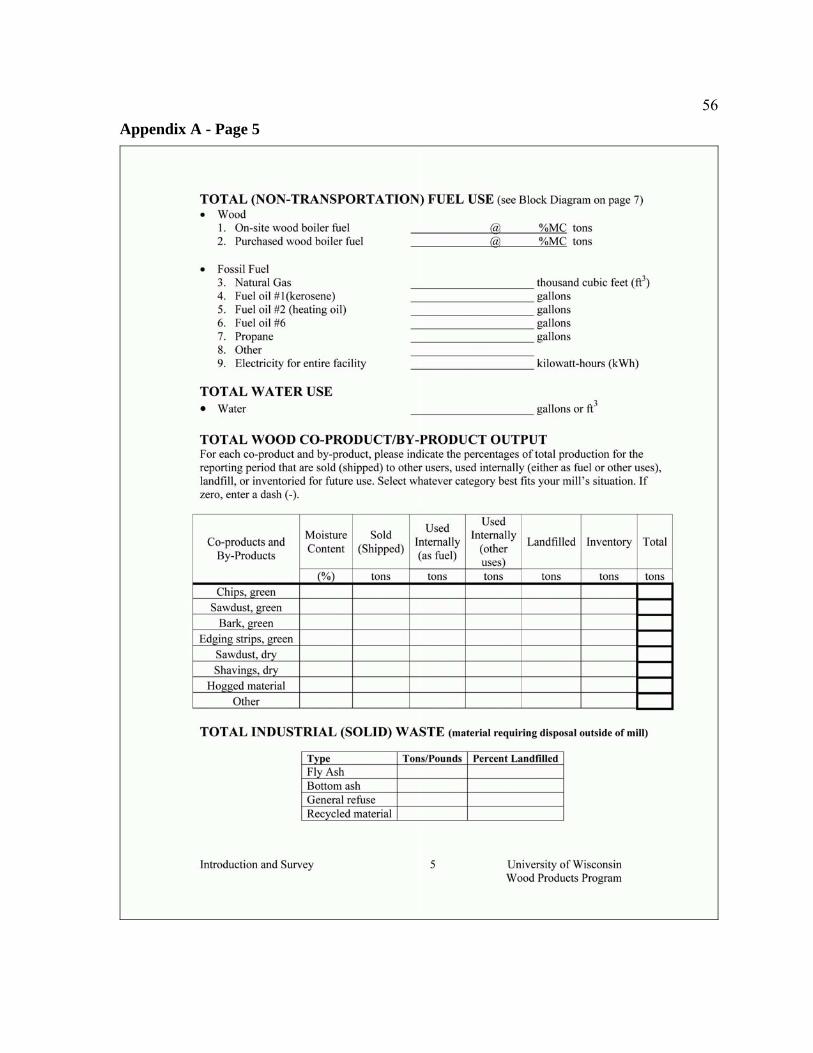
56Appendix A - Page 5
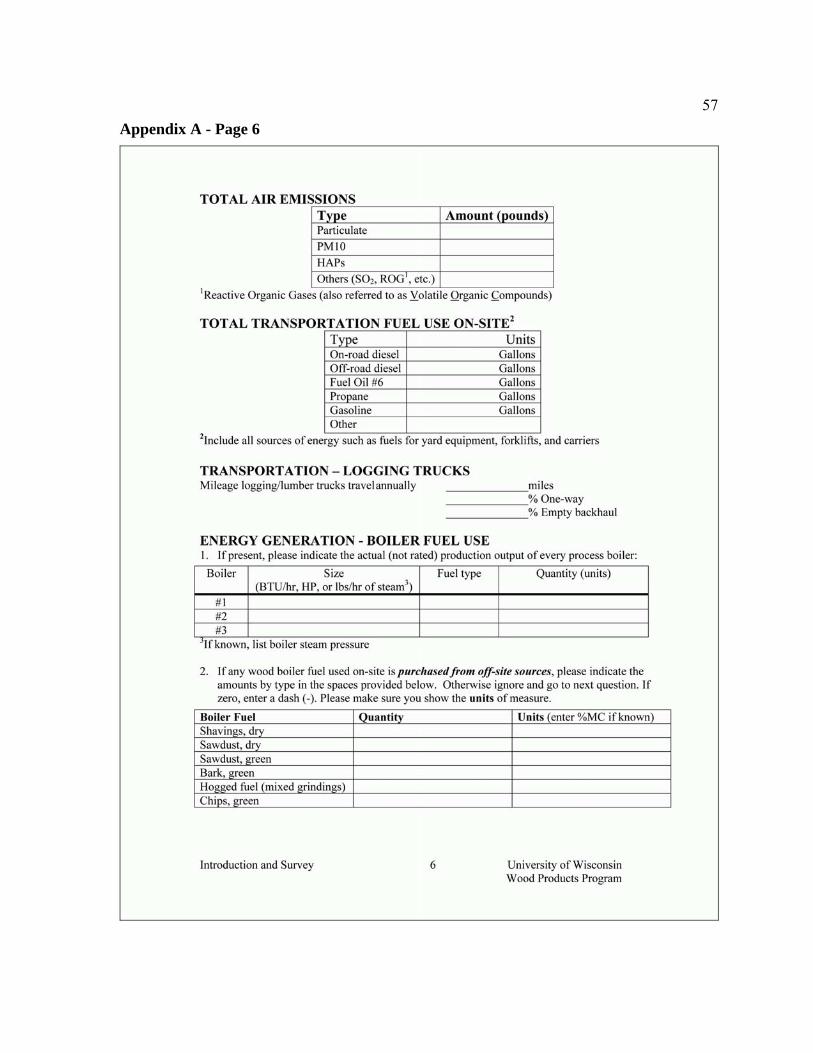
57Appendix A - Page 6

58Appendix A - Page 7
59Appendix B - 1: First letter sent to Hardwood Manufacturer Association

60Appendix B - 2: Second letter sent to Hardwood Manufacturer Association
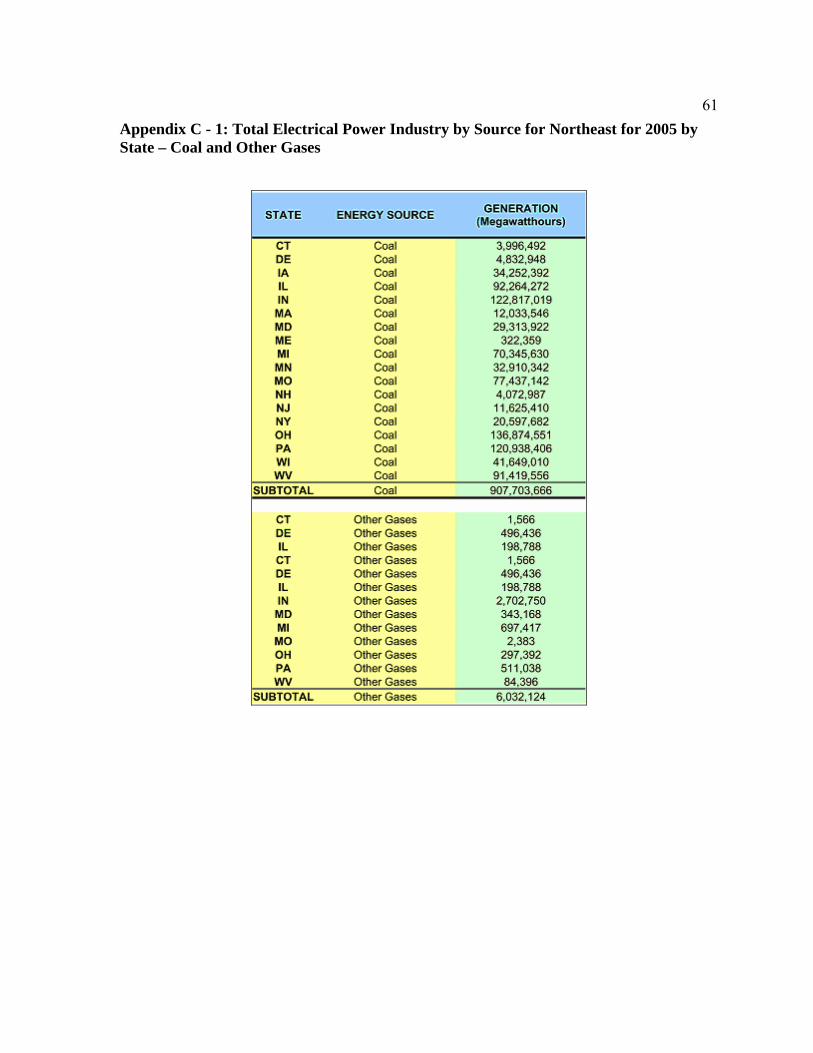
61Appendix C - 1: Total Electrical Power Industry by Source for Northeast for 2005 by State – Coal and Other Gases
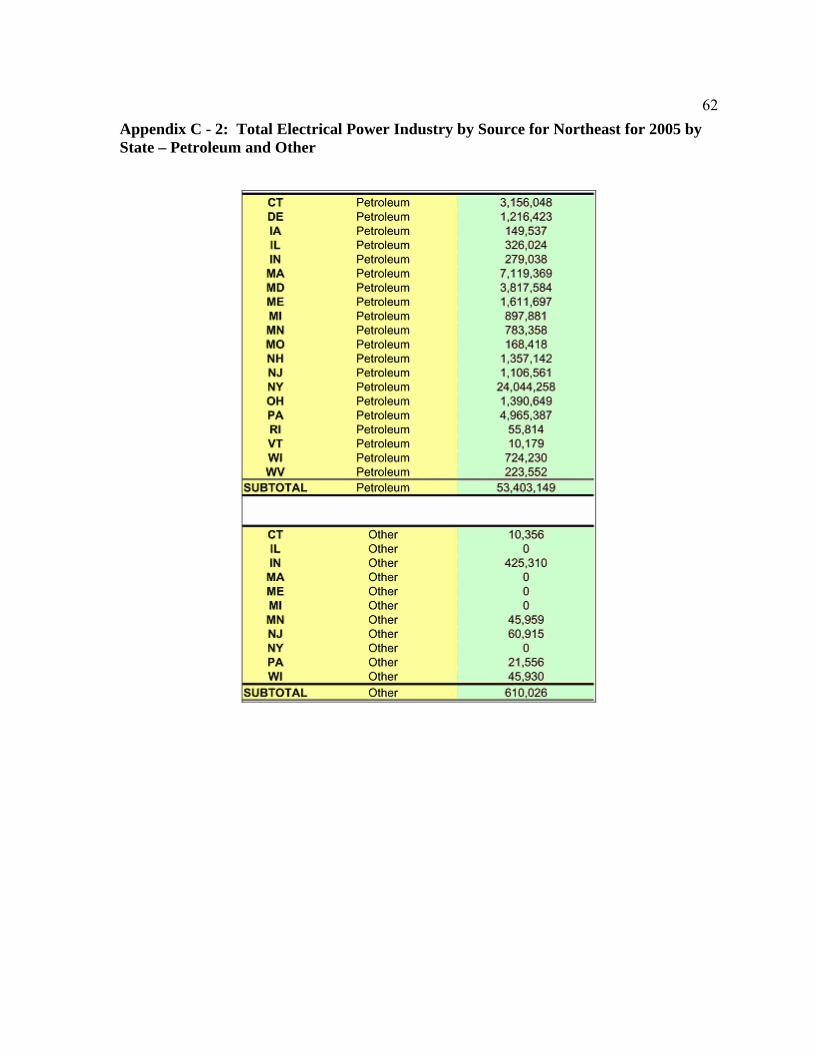
62Appendix C - 2: Total Electrical Power Industry by Source for Northeast for 2005 by State – Petroleum and Other
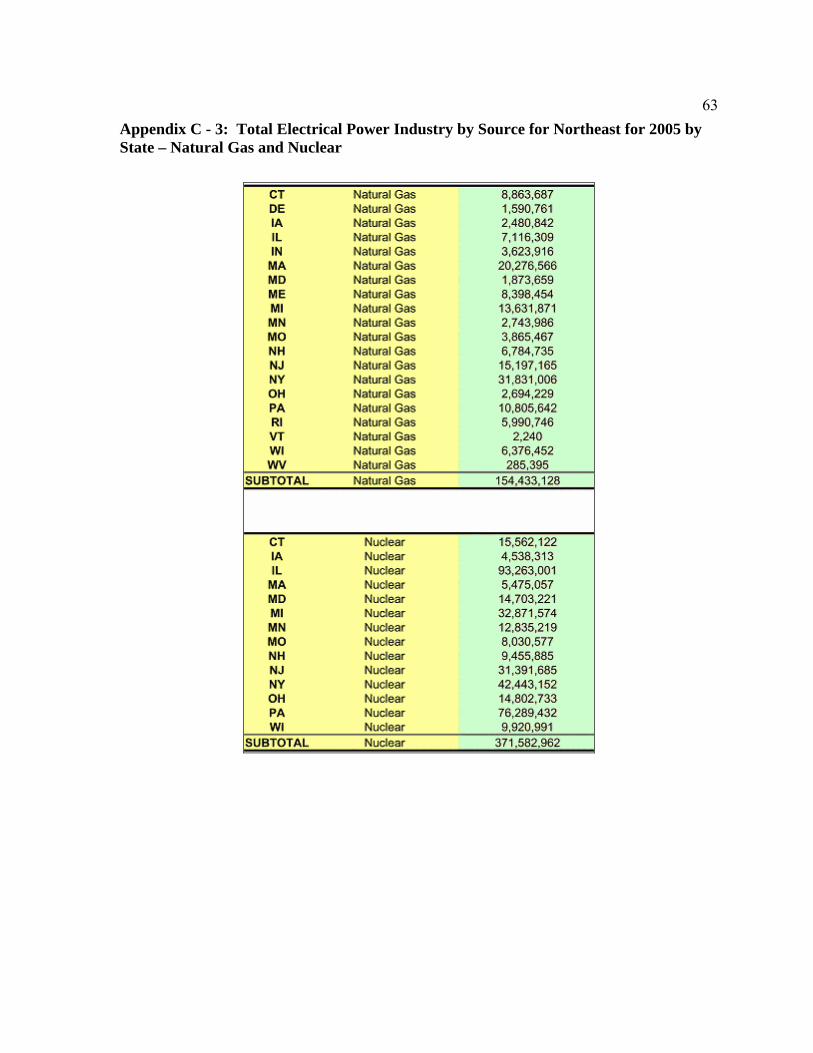
63Appendix C - 3: Total Electrical Power Industry by Source for Northeast for 2005 by State – Natural Gas and Nuclear
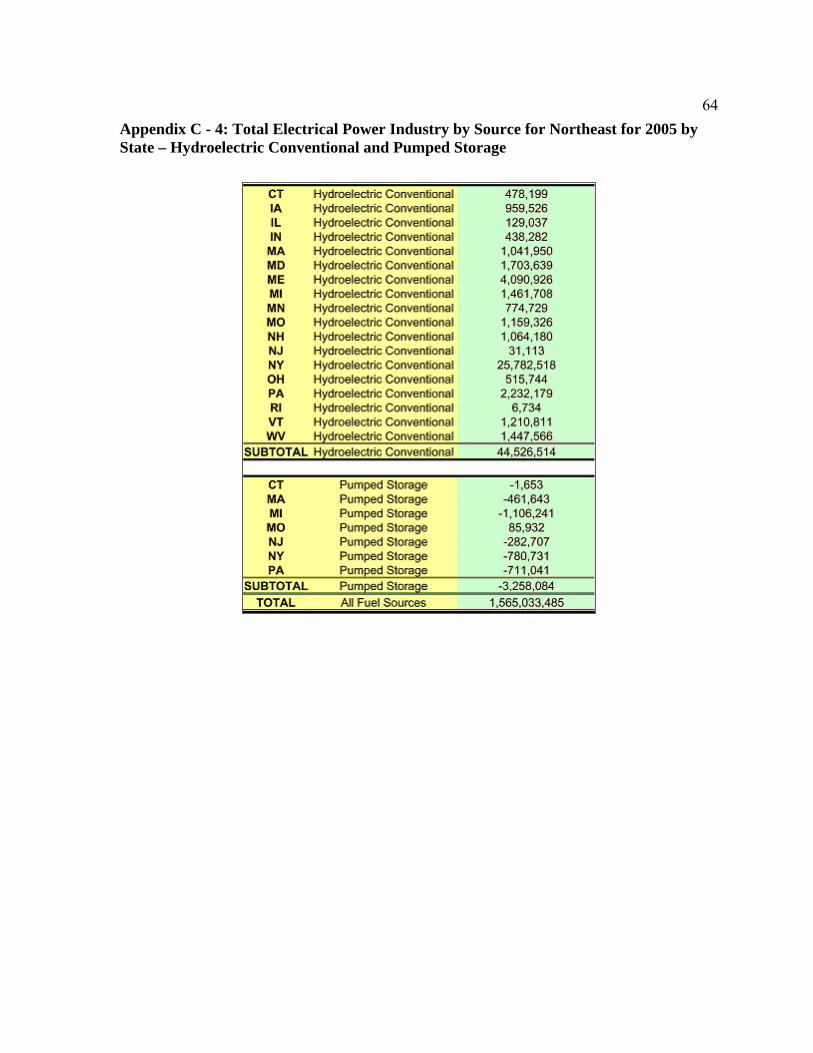
64Appendix C - 4: Total Electrical Power Industry by Source for Northeast for 2005 by State – Hydroelectric Conventional and Pumped Storage
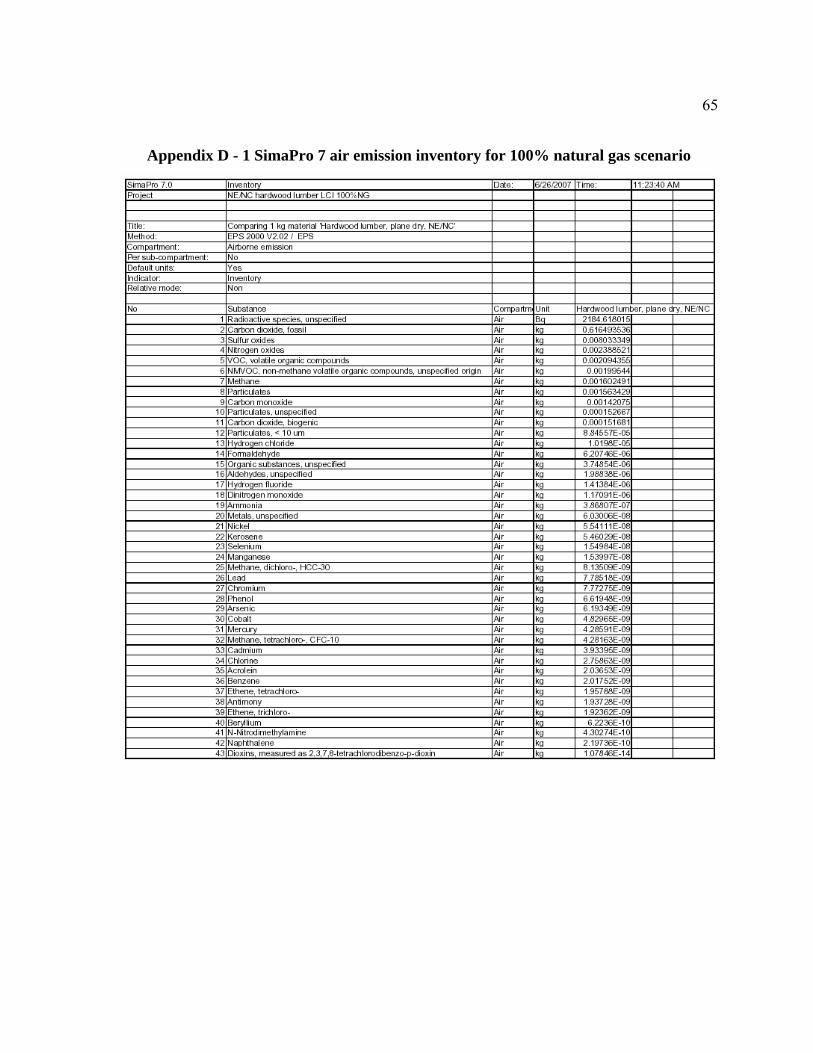
65
Appendix D - 1 SimaPro 7 air emission inventory for 100% natural gas scenario
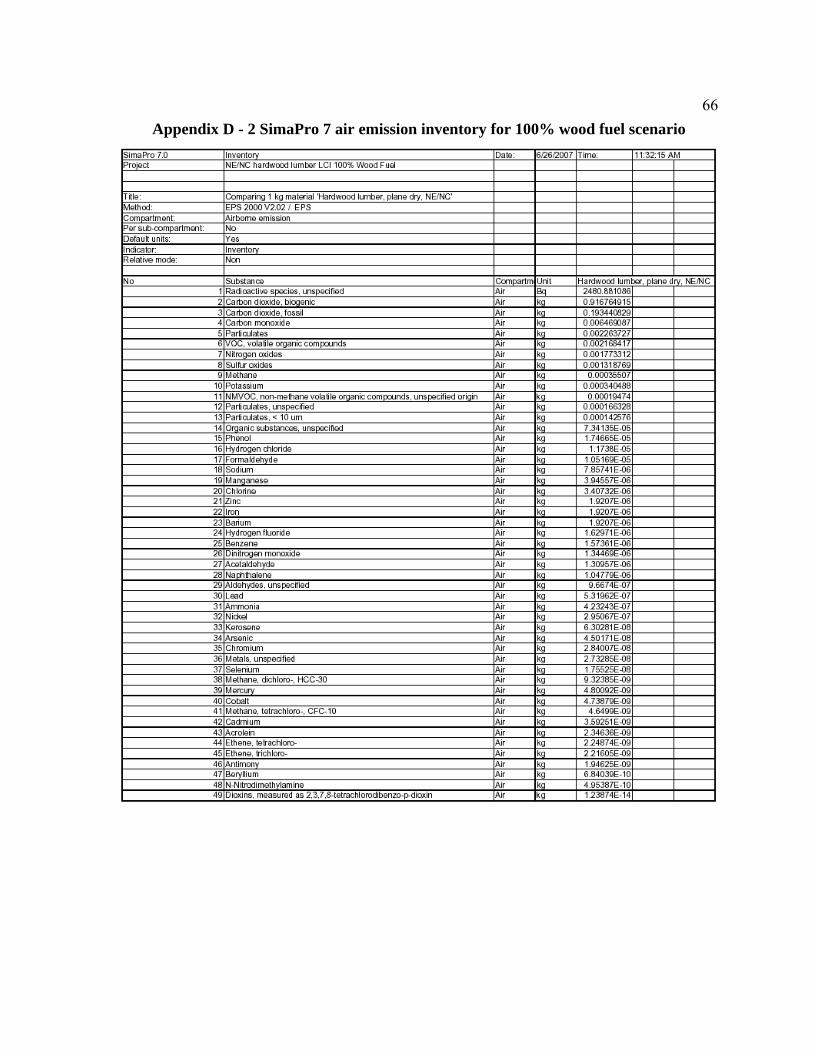
66Appendix D - 2 SimaPro 7 air emission inventory for 100% wood fuel scenario

67Appendix D - 3 SimaPro 7 air emission inventory for original (base) scenario