cradle-to-gate life cycle analysis of expanded … of eps resin lca... · client\eps-ia\kc162652...
TRANSCRIPT

CRADLE-TO-GATE LIFE CYCLE ANALYSIS OF EXPANDED POLYSTYRENE RESIN
Final Report
Submitted to:
EPS Industry Alliance
Submitted by:
Franklin Associates, A Division of ERG
Date:
December 2016

CLIENT\EPS-IA\KC162652
12.28.16 4004.00.002 ii
PREFACE
The report that follows is a life cycle assessment of expanded polystyrene (EPS) resin.
Funding for this project was provided by the EPS Industry Alliance (EPS IA). The report
was made possible through the cooperation of EPS IA member companies who provided
data for the production of EPS resin.
At Franklin Associates, A Division of ERG, the project was managed and primarily authored
by Melissa Huff, Senior Chemical Engineer. Janet Mosley provided assistance with modeling
and analysis. Anne Marie Molen assisted with data collection tasks and report preparation.
Franklin Associates gratefully acknowledges the significant contribution to this project by
Elizabeth Steiner and Diana Gentilcore of EPS IA in leading this project. Also acknowledged
are companies, Plasti-Fab Ltd., NOVA, and Styropek, who graciously provided the EPS resin
LCI data. Their effort in collecting data has added considerably to the quality of this LCA
report.
This report was prepared for EPS IA by Franklin Associates, A Division of Eastern Research
Group, Inc. (ERG) as an independent contractor. Franklin Associates makes no statements
other than those presented within the report.
December, 2016

CLIENT\EPS-IA\KC162652
12.28.16 4004.00.002 iii
TABLE OF CONTENTS
INTRODUCTION .......................................................................................................................................................................... 1
STUDY GOAL AND SCOPE ........................................................................................................................................................ 2
STUDY GOAL AND INTENDED USE ................................................................................................................................................... 3
FUNCTIONAL UNIT ................................................................................................................................................................................... 3
SCOPE AND BOUNDARIES ..................................................................................................................................................................... 3
INVENTORY AND IMPACT ASSESSMENT RESULTS CATEGORIES...................................................................................... 6
DATA SOURCES .......................................................................................................................................................................................... 8
DATA QUALITY ASSESSMENT ............................................................................................................................................................. 9
DATA ACCURACY AND UNCERTAINTY ......................................................................................................................................... 10
METHOD ...................................................................................................................................................................................................... 10
LIFE CYCLE INVENTORY AND IMPACT ASSESSMENT RESULTS .............................................................................. 14
ENERGY DEMAND ................................................................................................................................................................................... 14
SOLID WASTE ........................................................................................................................................................................................... 18
WATER CONSUMPTION ....................................................................................................................................................................... 19
GLOBAL WARMING POTENTIAL ...................................................................................................................................................... 20
ACIDIFICATION ........................................................................................................................................................................................ 21
EUTROPHICATION .................................................................................................................................................................................. 23
OZONE DEPLETION ................................................................................................................................................................................ 24
SMOG FORMATION ................................................................................................................................................................................. 25
APPENDIX: EXPANDED POLYSTYRENE (EPS) MANUFACTURE ............................................................................. 27
CRUDE OIL PRODUCTION ................................................................................................................................................................... 27
PETROLEUM REFINING (DISTILLATION, DESALTING, AND HYDROTREATING) ..................................................... 29
NATURAL GAS PRODUCTION ............................................................................................................................................................ 33
NATURAL GAS PROCESSING .............................................................................................................................................................. 37
OLEFINS PRODUCTION (ETHYLENE/PYGAS) ............................................................................................................................ 37
BENZENE PRODUCTION ...................................................................................................................................................................... 42
ETHYLBENZENE/STYRENE PRODUCTION ................................................................................................................................. 44
PENTANE PRODUCTION ...................................................................................................................................................................... 46
EXPANDED POLYSTYRENE RESIN PRODUCTION .................................................................................................................... 46
REFERENCES ............................................................................................................................................................................................. 48

CLIENT\EPS-IA\KC162652
12.28.16 4004.00.002 1
CRADLE-TO-GATE LIFE CYCLE ANALYSIS OF EXPANDED POLYSTYRENE RESIN
INTRODUCTION
This study was conducted to provide the EPS Industry Alliance (EPS IA), their members,
users of the U.S. LCI Database, and the public at large with information about the life cycle
inventory and impacts for average expanded polystyrene (EPS) resin as used within a
variety of products in North America. Life cycle assessment (LCA) is recognized as a
scientific method for making comprehensive, quantified evaluations of the environmental
benefits and tradeoffs commonly for the entire life cycle of a product system, beginning
with raw material extraction and continuing through disposition at the end of its useful life
as shown in Figure 1 below. This cradle-to-gate LCI and LCA analysis includes the life cycle
stages shown in the dashed box including the “Raw Materials Acquisition” and “Materials
Manufacture” boxes in the figure.
Figure 1. General materials flow for “cradle-to-grave” analysis of a product system.
The dashed box indicates the boundaries of this analysis.
The results of this analysis are useful for understanding production-related impacts and
are provided in a manner suitable for incorporation into full life cycle assessment studies.
The information from an LCA can be used as the basis for further study of the potential
improvement of resource use and environmental impacts associated with product systems.
It can also pinpoint areas (e.g., material components or processes) where changes would be
most beneficial in terms of reducing energy use or potential impacts.
The cradle-to-gate life cycle inventory (LCI) and impact assessment (LCIA) presented in
this study quantifies the total energy requirements, energy sources, water consumption,
atmospheric pollutants, waterborne pollutants, and solid waste resulting from the
CLIENT\EPS-IA\KC162652
12.28.16 4004.00.002 2
production of expanded polystyrene resin. It is considered a cradle-to-gate boundary
system because this analysis ends at the resin production. The system boundaries stop at
resin production so that the resin data can be linked with fabrication, use, and end-of-life
data to create full life cycle inventories for a variety of EPS products, such as insulation or
packaging. The method used for this inventory has been conducted following
internationally accepted standards for LCI and LCA methodology as outlined in the ISO
14040 and 14044 standard documents1.
A life cycle assessment (LCA) commonly examines the sequence of steps in the life cycle of
a product system, beginning with raw material extraction and continuing on through
material production, product fabrication, use, reuse or recycling where applicable, and final
disposition. This LCA boundary ends at material production. An LCA consists of four
phases:
• Goal and scope definition
• Life cycle inventory (LCI)
• Life cycle impact assessment (LCIA)
• Interpretation of results
The LCI identifies and quantifies the material inputs, energy consumption, water
consumption, and environmental emissions (atmospheric emissions, waterborne wastes,
and solid wastes) over the defined scope of the study. The LCI data for this analysis of EPS
resin is shown separately as unit processes and as a cradle-to-gate dataset in the attached
Appendix. Those unit processes that have been updated will be made available to the
National Renewable Energy Laboratory (NREL) who maintains the U.S. LCI Database.
In the LCIA phase, the inventory of emissions is classified into categories in which the
emissions may contribute to impacts on human health or the environment. Within each
impact category, the emissions are then normalized to a common reporting basis, using
characterization factors that express the impact of each substance relative to a reference
substance.
STUDY GOAL AND SCOPE
In this section, the goal and scope of the study is defined, including information on data
sources used and methodology.
1 International Standards Organization. ISO 14040:2006 Environmental management—Life cycle
assessment—Principles and framework, ISO 14044:2006, Environmental management – Life cycle
assessment – Requirements and guidelines.

CLIENT\EPS-IA\KC162652
12.28.16 4004.00.002 3
STUDY GOAL AND INTENDED USE
The purpose of this LCA is to document the LCI data and then evaluate the environmental
profiles of expanded polystyrene resin. The intended use of the study results is twofold:
• To provide the LCA community and other interested parties with average
North American LCI data for EPS resin, and
• to provide information about the environmental burdens associated with the
production of EPS resin. The LCA results for the EPS resin system can be used
as a benchmark for evaluating future updated EPS resin results for North
America.
The LCA has been conducted following internationally accepted standards for LCA as
outlined in the ISO 14040 and 14044 standards2. As there are no comparisons made and so
no comparative assertions, a panel peer review is not required for this study.
This report is the property of EPS IA and may be used by the trade association or members
or the general public at EPS IA’s discretion.
FUNCTIONAL UNIT
The function of EPS resin is its availability to be used in a number of EPS products, for
example insulation and packaging. As the boundaries only include through material
manufacture, a mass functional unit has been chosen. Results for this analysis are shown on
both a 1,000 pound and a 1,000 kilogram basis.
SCOPE AND BOUNDARIES
This LCA quantifies energy and resource use, water consumption, solid waste, and
environmental impacts for the following steps in the life cycle of the EPS resin:
• Raw material extraction (e.g., extraction of petroleum and natural gas as feedstocks for
plastic resin), and intermediate material processing, including incoming transportation for
each process, and
• EPS resin manufacture, including incoming transportation for each process.
This report presents LCI results, as well as LCA results, for the production of EPS resin. Figure 2
presents the flow diagram for the production of EPS resin. Process descriptions and individual
process tables for each box shown in the flow diagram can be found in the attached appendix.
Primary data has been collected for EPS resin production for the year 2015. Primary data was
2 International Standards Organization. ISO 14040:2006 Environmental management—Life cycle
assessment—Principles and framework, ISO 14044:2006, Environmental management – Life cycle
assessment – Requirements and guidelines.

CLIENT\EPS-IA\KC162652
12.28.16 4004.00.002 4
Figure 2. Flow diagram for the production of expanded polystyrene (EPS) resin.
From Petroleum
Refining Pentane
Production
Expanded
Polystyrene
Manufacture
Natural Gas
Production
Natural Gas
Processing
Crude Oil
Production
Olefins
(Ethylene/Pygas)
Production
Petroleum Refining
(Distillation/Desalting
/Hydrotreating)
Ethylbenzene/Styrene
Production
Benzene Production
(catalytic reforming
and pyrolysis
gasoline)

CLIENT\EPS-IA\KC162652
12.28.16 4004.00.002 5
collected between 2004 and 2006 for olefins, benzene, ethylbenzene/styrene in the ACC Plastics
Division study, Cradle-to-Gate Life Cycle Inventory of Nine Plastic Resins and Four
Polyurethane Precursors.3 All other processes shown in Figure 2 are provided using secondary
data, which is discussed in the Appendix of this report. All raw and intermediate data sets, except
pentane, are currently being updated for the ACC Plastics Division and will be available in 2017.
The following are not included in the study:
• Miscellaneous materials and additives. Selected materials such as catalysts, pigments,
or other additives which total less than one percent by weight of the net process inputs are
typically not included in the assessment. Omitting miscellaneous materials and additives
helps keep the scope of the study focused and manageable within budget and time
constraints. It is possible that production of some substances used in small amounts may
be energy and resource intensive or may release toxic emissions; however, the impacts
would have to be very large in proportion to their mass in order to significantly affect
overall results and conclusions. For this study, no use of resource-intensive or high-
toxicity chemicals or additives was identified. Therefore, the results for the resin are not
expected to be understated by any significant amount due to substances that may be used
in small amounts.
• Capital equipment, facilities, and infrastructure. The energy and wastes associated
with the manufacture of buildings, roads, pipelines, motor vehicles, industrial machinery,
etc. are not included. The energy and emissions associated with production of capital
equipment, facilities, and infrastructure generally become negligible when averaged over
the total output of product or service provided over their useful lifetimes.
• Space conditioning. The fuels and power consumed to heat, cool, and light
manufacturing establishments are omitted from the calculations in most cases. For
manufacturing plants that carry out thermal processing or otherwise consume large
amounts of energy, space conditioning energy is quite low compared to process energy.
The data collection forms developed for this project specifically requested that the data
provider exclude energy use for space conditioning, or indicate if the reported energy
requirements included space conditioning. Energy use for space conditioning, lighting,
and other overhead activities is not expected to make a significant contribution to total
energy use for the resin system.
• Support personnel requirements. The energy and wastes associated with research and
development, sales, and administrative personnel or related activities have not been
included in this study. Similar to space conditioning, energy requirements and related
emissions are assumed to be quite small for support personnel activities.
The geographic scope of the analysis is the manufacture of EPS resin in North America. The
majority of the data used in the modeling is from North American databases (U.S. LCI
database, Franklin Associates’ private database). In cases where it was necessary to use
supplemental data from a European database, the data sets were adapted to the extent
possible to represent North American inputs and practices.
3 ACC Plastics Division. Cradle-to-Gate Life Cycle Inventory of Nine Plastic Resins and Four Polyurethane
Precursors. August 2011. Found at https://plastics.americanchemistry.com/LifeCycle-Inventory-of-9-Plastics-
Resins-and-4-Polyurethane-Precursors-Rpt-Only/

CLIENT\EPS-IA\KC162652
12.28.16 4004.00.002 6
INVENTORY AND IMPACT ASSESSMENT RESULTS CATEGORIES
The full inventory of emissions generated in an LCA study is lengthy and diverse, making it
difficult to interpret emissions profiles in a concise and meaningful manner. Life cycle
impact assessment (LCIA) helps with interpretation of the emissions inventory. LCIA is
defined in ISO 14044 Section 3.4 as the “phase of life cycle assessment aimed at
understanding and evaluating the magnitude and significance of the potential
environmental impacts for a product system throughout the life cycle of the product.” In
the LCIA phase, the inventory of emissions is first classified into categories in which the
emissions may contribute to impacts on human health or the environment. Within each
impact category, the emissions are then normalized to a common reporting basis, using
characterization factors that express the impact of each substance relative to a reference
substance.
The LCI and LCIA results categories and methods applied in this study are displayed in
Table 1. This study addresses global, regional, and local impact categories. For most of the
impact categories examined, the TRACI 2.1 method, developed by the United States
Environmental Protection Agency (EPA) specific to U.S. conditions and updated in 2012, is
employed.4 For the category of Global Warming Potential (GWP), contributing elementary
flows are characterized using factors reported by the Intergovernmental Panel on Climate
Change (IPCC) in 2013 with a 100 year time horizon.5 In addition, some life cycle inventory
(LCI) results are included in the results reported in the analysis:
• Energy demand: this method is not an impact assessment, but rather is a cumulative
inventory of all forms of energy used for processing energy, transportation energy,
and feedstock energy. This analysis reports both total energy demand and non-
renewable energy demand. Non-renewable energy demand is reported separately to
assess consumption of fuel resources that can be depleted, while total energy
demand is used as an indicator of overall consumption of resources with energy
value. Energy is also categorized by individual fuel types.
• Solid waste is assessed as a sum of the inventory values associated with this
category.
• Water consumption is assessed as a sum of the inventory values associated with this
category and does not include any assessment of water scarcity issues.
4 Bare, J. C. Tool for the Reduction and Assessment of Chemical and Other Environmental Impacts
(TRACI), Version 2.1 - User’s Manual; EPA/600/R-12/554 2012. 5 IPCC, 2013: Climate Change 2013: The Physical Science Basis. Contribution of Working Group I to
the Fifth Assessment Report of the Intergovernmental Panel on Climate Change [Stocker, T.F., D.
Qin, G.-K. Plattner, M. Tignor, S.K. Allen, J. Boschung, A. Nauels, Y. Xia, V. Bex and P.M. Midgley (eds.)]. Cambridge University Press, Cambridge, United Kingdom and New York, NY, USA, 2013.

CLIENT\EPS-IA\KC162652
12.28.16 4004.00.002 7
Table 1. Summary of LCI/LCIA Impact Categories
Impact/InventoryImpact/InventoryImpact/InventoryImpact/Inventory
CategoryCategoryCategoryCategory DescriptionDescriptionDescriptionDescription UnitUnitUnitUnit
LCIA/LCI LCIA/LCI LCIA/LCI LCIA/LCI
MethodologyMethodologyMethodologyMethodology
LCI
Ca
teg
ori
es
LCI
Ca
teg
ori
es
LCI
Ca
teg
ori
es
LCI
Ca
teg
ori
es
Total eTotal eTotal eTotal energy nergy nergy nergy
demanddemanddemanddemand
Measures the total energy from point
of extraction; results include both
renewable and non-renewable
energy sources
MJ Cumulative energy
inventory
NonNonNonNon----renewable renewable renewable renewable
energy demandenergy demandenergy demandenergy demand
Measures the fossil and nuclear
energy from point of extraction MJ
Cumulative energy
inventory
Renewable energy Renewable energy Renewable energy Renewable energy
demanddemanddemanddemand
Measures the hydropower, solar,
wind, and other renewables,
including landfill gas use.
MJ Cumulative energy
inventory
Solid waste by Solid waste by Solid waste by Solid waste by
weightweightweightweight
Measures quantity of fuel, process
and postconsumer waste to a
specific fate (e.g., landfill, WTE) for
final disposal on a mass basis
kg Cumulative solid
waste inventory
Water consumptionWater consumptionWater consumptionWater consumption
Freshwater withdrawals which are
evaporated, incorporated into
products and waste, transferred to
different watersheds, or disposed
into the sea after usage
L
Cumulative water
consumption
inventory
LCIA
Ca
teg
ori
es
LCIA
Ca
teg
ori
es
LCIA
Ca
teg
ori
es
LCIA
Ca
teg
ori
es
Global warming Global warming Global warming Global warming
potentialpotentialpotentialpotential
Represents the heat trapping
capacity of the greenhouse gases.
Important emissions: CO2 fossil, CH4,
N2O
kg CO2
equivalents
(eq)
IPCC (2013) GWP
100a*
Acidification Acidification Acidification Acidification
potential potential potential potential
Quantifies the acidifying effect of
substances on their environment.
Important emissions: SO2, NOx, NH3,
HCl, HF, H2S
kg SO2 eq TRACI v2.1
Eutrophication Eutrophication Eutrophication Eutrophication
potential potential potential potential
Assesses impacts from excessive
load of macro-nutrients to the
environment. Important emissions:
NH3, NOx, COD and BOD, N and P
compounds
kg N eq TRACI v2.1
Ozone depletion Ozone depletion Ozone depletion Ozone depletion
potential potential potential potential
Measures stratospheric ozone
depletion. Important emissions: CFC
compounds and halons
kg CFC-11 eq TRACI v2.1
Smog formation Smog formation Smog formation Smog formation
potential potential potential potential
Determines the formation of reactive
substances (e.g. tropospheric ozone)
that cause harm to human health
and vegetation. Important
emissions: NOx, BTEX, NMVOC, CH4,
C2H6, C4H10, C3H8, C6H14, acetylene,
Et-OH, formaldehyde
kg O3 eq TRACI v2.1

CLIENT\EPS-IA\KC162652
12.28.16 4004.00.002 8
DATA SOURCES
The purpose of this study is to develop a life cycle profile for EPS resin using the most
recent data available for each process. A straight average was calculated from the EPS resin
production data collected from one plant each from three producers in North America—
one from Canada, Mexico, and the United States. All companies provided data for the year
2015. As of 2015 there were 8 EPS producers and 10 EPS plants in North America. The
captured production amount is approximately 20 percent of the available capacity for all
expanded polystyrene production in North America. Small amounts (less than 1 percent of
total output) of off-spec resin are produced as coproducts during this process. A mass basis
was used to allocate the credit for the coproducts.
No other primary data was collected for the EPS resin system. However, data used for
ethylene, benzene, and ethylbenzene/styrene were all collected previously by Franklin
Associates for the ACC Plastics Division study, Cradle-to-Gate Life Cycle Inventory of
Nine Plastic Resins and Four Polyurethane Precursors. These datasets will be updated
by the ACC Plastics Division in 2017. Descriptions of the data collected for these 3
intermediate chemicals are provided here.
A weighted average using production quantities was calculated from the olefins production data
collected from three leading producers (8 thermal cracking units) in North America. As of 2003,
there were 16 olefin producers and at least 29 olefin plants in the U.S. The captured production
amount is approximately 30 percent of the available capacity for olefin production. Numerous
coproduct streams are produced from the olefins hydrocracker. Fuel gas and off-gas were two of
the coproducts produced that were exported to another process for fuel. When these fuel
coproducts are exported from the hydrocracker, they carry with them the allocated share of the
inputs and outputs for their production. The separate appendices provide an in-depth discussion
of this allocation. A mass basis was used to allocate the credit to the remaining material
coproducts.
It is estimated that one-third of the benzene production is from pyrolysis gasoline and two-
thirds are produced from catalytic reforming. These percentages were used to weight the
collected datasets for benzene. Catalytic reforming is represented by 2 primary datasets
from 1992. The benzene data collected for this analysis represent 1 producer and 1 plant in
the U.S. using the pyrolysis gasoline production method. As of 2002 there were 22 benzene
producers and 38 benzene plants in the U.S. for the three standard technologies. The
captured production amount is approximately 10 percent of the available capacity for
benzene production in the U.S. Numerous aromatic coproduct streams are produced during
this process. Fuel gas and off-gas were two of the coproducts produced that were exported
to another process for fuel. When these fuel coproducts are exported from the reactor, they
carry with them the allocated share of the inputs and outputs for their production. The
separate appendices provide an in-depth discussion of this allocation. A mass basis was
used to allocate the credit the remaining aromatic products.

CLIENT\EPS-IA\KC162652
12.28.16 4004.00.002 9
Two of the three ethylbenzene/styrene datasets were collected from recent primary
sources for this project and represents 2002-2003 data, while the other dataset comes
from 1993. As of 2001 there were 8 styrene producers and 8 styrene plants in the U.S. The
styrene data collected for this module represent 2 producers and 2 plants in the U.S. The
captured production amount is approximately 25 percent of the available capacity for
styrene production in the U.S. Various coproduct streams are produced during this process.
Coproduct credit was given on a mass basis in the styrene datasets collected during this
analysis.
The remaining raw material and intermediate materials used to produce EPS resin are
from secondary sources. All process descriptions and LCI data for unit processes are
provided in the Appendix.
DATA QUALITY ASSESSMENT
ISO 14044:2006 lists a number of data quality requirements that should be addressed for
studies intended for use in public comparative assertions. The data quality goals for this
analysis were to use data that are (1) geographically representative for the EPS resin based
on the locations where material sourcing and production take place, and (2) representative
of current industry practices in these regions. As described in the previous section, 3
companies each provided current, geographically representative data for one plant
producing the EPS resin.
The background data sets were drawn from either the U.S. LCI database or Ecoinvent. The
data sets used were the most current and most geographically and technologically relevant
data sets available during the data collection phase of the project.
Consistency, Completeness, Precision: Data evaluation procedures and criteria were
applied consistently to all primary data provided by the three EPS resin producers. All
primary data obtained specifically for this study were considered the most representative
available for the systems being studied. Data sets were reviewed for completeness and
material balances, and follow-up was conducted as needed to resolve any questions about
the input and output flows, process technology, etc. The same evaluation process was used
in the development of data sets from Franklin’s private LCI database that were used in this
analysis.
Reproducibility: To maximize transparency and reproducibility, the report identifies
specific data sources, assumptions, and approaches used in the analysis to the extent
possible; however, reproducibility of study results is limited to some extent by the need to
protect certain data sets that were judged to be the most representative data sets for
modeling purposes but could not be shown due to confidentiality.
Uncertainty: Uncertainty issues and uncertainty thresholds applied in interpreting study
results are described in the following section.

CLIENT\EPS-IA\KC162652
12.28.16 4004.00.002 10
DATA ACCURACY AND UNCERTAINTY
An important issue to consider when using LCA study results is the reliability of the data. In
a complex study with literally thousands of numeric entries, the accuracy of the data and
how it affects conclusions is truly a complex subject, and one that does not lend itself to
standard error analysis techniques. Techniques such as Monte Carlo analysis can be used to
study uncertainty, but the greatest challenge is the lack of uncertainty data or probability
distributions for key parameters, which are often only available as single point estimates.
However, the reliability of the study can be assessed in other ways.
A key question is whether the LCI profiles are accurate and study conclusions are correct.
The accuracy of an environmental profile depends on the accuracy of the numbers that are
combined to arrive at that conclusion. Because of the many processes required to produce
each packaging material, many numbers in the LCI are added together for a total numeric
result. Each number by itself may contribute little to the total, so the accuracy of each
number by itself has a small effect on the overall accuracy of the total. There is no widely
accepted analytical method for assessing the accuracy of each number to any degree of
confidence. For many chemical processes, the data sets are based on actual plant data
reported by plant personnel. The data reported may represent operations for the previous
year or may be representative of engineering and/or accounting methods. All data received
are evaluated to determine whether or not they are representative of the typical industry
practices for that operation or process being evaluated.
There are several other important points with regard to data accuracy. Each number
generally contributes a small part to the total value, so errors within each averaged data
point are generally minor and do not affect the overall analysis of the results. For process
steps that make a larger than average contribution to the total, special care is taken with
the data quality.
There is another dimension to the reliability of the data. Certain numbers do not stand
alone, but rather affect several numbers in the system. An example is the amount of
material required for a process. This number will affect every step in the production
sequence prior to the process. Errors such as this that propagate throughout the system are
more significant in steps that are closest to the end of the production sequence. These data
are reviewed and compared to reliable sources by the practitioner and/or discussed with
the data providers as necessary to assure their accuracy.
In summary, for the particular data sources used and for the specific methodology
described in this report, the results of this report are believed to be as accurate and
reasonable as possible.
METHOD
The LCA has been conducted following internationally accepted standards for LCA as
outlined in the ISO 14040 and 14044 standards, which provide guidance and requirements

CLIENT\EPS-IA\KC162652
12.28.16 4004.00.002 11
for conducting LCA studies. However, for some specific aspects of LCA, the ISO standards
have some flexibility and allow for choices to be made. These include the method used to
allocate inputs and environmental releases among more than one useful product produced
by a process, the method used to account for the energy contained in material feedstocks,
and the method used to allocate environmental burdens for recycled content. The following
sections describe the approach to each issue used in this study. Many of these issues are
specific to the intermediate chemicals used (e.g. olefins from hydrocrackers).
Raw Material Use for Internal Energy
Some of the raw material inputs for the hydrocracker are combusted within the
hydrocracker, which in turn produced an amount of energy, decreasing the amount of
purchased energy required for the reaction. Data providers listed this energy as fuel gas or
offgas and supplied the heating value of this gas. Using this information, Franklin
Associates calculated the amount of raw material combusted within the hydrocracker to
produce offgas energy.
This internal energy is included in the analysis by including the production of the raw
materials combusted to produce the energy as well as the energy amount attributed to the
combustion of those raw materials. Unlike the raw materials that become part of the
product output mass, no material feedstock energy is assigned to the raw materials inputs
that are combusted within the process. Instead they are assigned an “Internal offgas use”
energy, due to their combustion within the process instead of use to create the plastic resin.
Recovered Energy Exported from System Boundaries
Some of the unit process tables in the appendices shows a line for recovered energy. This
recovered energy is energy (heat or steam) that data providers in the ACC Plastics Division
study reported as being exported from the boundaries of the system, so it would replace
purchased fuels for another process outside the system. Because it is not known what form
of purchased energy the recovered energy would replace, no credit has been given besides
recording the recovered energy amount. Credit is given to the resin/precursor by
subtracting the recovered energy from the process and total energy for a net reduction in
energy.
When fuel coproducts, such as offgas, are exported from the hydrocarbon production, they
carry with them the allocated share of the inputs and outputs for their production. The
ratio of the mass of the exported fuel over the total mass output was removed from the
total inputs and outputs of the process, and the remaining inputs and outputs are allocated
over the material products (Equation 1).
[ ] [ ] productsremainingtoattributed
Total
EO IOM
MIO =
−× 1 (Equation 1)
where
IO = Input/Output Matrix to produce all products/coproducts

CLIENT\EPS-IA\KC162652
12.28.16 4004.00.002 12
MEO = Mass of Exported Offgas
MTotal = Mass of all Products and Coproducts (including fuels)
No energy credit is applied for the exported fuels, since both the inputs and outputs for the
exported fuels have been removed from the data set.
Electricity Grid Fuel Profile
Electricity production and distribution systems in North America are interlinked. Users of
electricity, in general, cannot specify the fuels used to produce their share of the electric
power grid. Data for this analysis was collected from plants in the U.S., Canada, and Mexico.
Although it is possible to use grids specific to Canada, the U.S. and Mexico, horizontal
averaging of data was used for this analysis, which means the three EPS resin data sets
were averaged before linking the fuels to the electricity grid. This was necessary to protect
confidentiality of the data sets collected. After reviewing the differences in the electricity
grids available and noting the use of cogeneration by some plants, the U.S. average fuel
consumption by electrical utilities was assumed for the electricity within this analysis. This
electricity data set uses the eGRID 2010 database.
Electricity generated on-site at a manufacturing facility is represented in the process data
by the fuels used to produce it. In some data sets, a portion of on-site generated electricity
is sold to the electricity grid. Credits for sold on-site electricity are accounted for in the
calculations for the fuel mix.
Electricity/Heat Cogeneration
Cogeneration is the use of steam for generation of both electricity and heat. The most
common configuration is to generate high temperature steam in a cogeneration boiler and
use that steam to generate electricity. The steam exiting the electricity turbines is then
used as a process heat source for other operations. Significant energy savings occur
because in a conventional operation, the steam exiting the electricity generation process is
condensed, and the heat is dissipated to the environment.
For LCI purposes, the fuel consumed and the emissions generated by the cogeneration
boiler need to be allocated to the two energy-consuming processes: electricity generation
and subsequent process steam. An energy basis was used for allocation in this analysis.
In order to allocate fuel consumption and environmental emissions to both electricity and
steam generation, the share of the two forms of energy (electrical and thermal) produced
must be correlated to the quantity of fuel consumed by the boiler. Data on the quantity of
fuel consumed and the associated environmental emissions from the combustion of the
fuel, the amount of electricity generated, and the thermal output of the steam exiting
electricity generation must be known in order to allocate fuel consumption and
environmental emissions accordingly. These three types of data are discussed below.

CLIENT\EPS-IA\KC162652
12.28.16 4004.00.002 13
1. Fuels consumed and emissions generated by the boiler: The majority of
data providers for this study reported natural gas as the fuel used for
cogeneration. According to 2012 industry statistics, natural gas accounted for
65 percent of industrial cogeneration, while coal and waste gases accounted
for the largest portion of the remaining fuels used. For this analysis, the data
for the combustion of natural gas in industrial boilers was used to determine
the environmental emissions from natural gas combustion in cogeneration
boilers. For cases in which coal is used in cogeneration boilers, the data for
the combustion of bituminous coal in industrial boilers is recommended. For
cases in which waste gas is used in cogeneration boilers, the data for the
combustion of LPG (liquefied petroleum gas) in industrial boilers is
recommended.
2. Kilowatt-Hours of Electricity Generated: In this analysis, the data
providers reported the kilowatt-hours of electricity from cogeneration. The
Btu of fuel required for this electricity generation was calculated by
multiplying the kilowatt-hours of electricity by 6,826 Btu/kWh (which
utilizes a thermal to electrical conversion efficiency of 50 percent). This Btu
value was then divided by the Btu value of fuel consumed in the cogeneration
boiler to determine the electricity allocation factor.
3. Thermal Output of Steam Exiting Electricity Generation: In this analysis,
the data providers stated the pounds and pressure of steam from
cogeneration. The thermal output (in Btu) of this steam was calculated from
enthalpy tables (in most cases steam ranged from 1,000 to 1,200 Btu/lb). An
efficiency of 80 percent was used for the industrial boiler to calculate the
amount of fuel used. This Btu value was then divided by the Btu value of fuel
consumed in the cogeneration boiler to determine the steam allocation
factor.

CLIENT\EPS-IA\KC162652
12.28.16 4004.00.002 14
LIFE CYCLE INVENTORY AND IMPACT ASSESSMENT RESULTS
This section presents baseline results for the following LCI and LCIA results for both 1,000
pounds and 1,000 kilograms of EPS resin studied:
Life cycle inventory results:
• Cumulative energy demand
• Non-renewable energy demand
• Renewable energy demand
• Total energy by fuel type
• Solid waste by weight
• Water consumption
Life cycle impact assessment results:
• Global warming potential
• Acidification potential
• Eutrophication potential
• Ozone depletion potential
• Smog formation potential
Throughout the results sections, the tables and figures break system results out into the
following categories:
• Raw and intermediate materials production
• EPS resin production
ENERGY DEMAND Cumulative Energy Demand
Cumulative energy demand results include all renewable and non-renewable energy
sources used for process and transportation energy, as well as material feedstock energy.
Process energy includes direct use of fuels as well as use of fossil fuels, hydropower,
nuclear, wind, solar, and other energy sources to generate electricity used by processes.
The feedstock energy is the energy content of the resources removed from nature and used
as material feedstocks for the EPS resin (e.g., the energy content of oil and gas used as
material feedstocks).
The average total energy required to produce EPS resin is 41.8 million Btu per 1,000
pounds of resin or 96.9 GJ per 1,000 kilograms of resin. Table 2 shows total energy demand
for the life cycle of the EPS resin. The resin production has been split out from the raw and
intermediate chemicals required for the resin. Almost 94 percent of this total energy is
required to produce the raw and intermediate materials, while approximately 6 percent is
needed to produce the resin itself.

CLIENT\EPS-IA\KC162652
12.28.16 4004.00.002 15
Non-renewable energy demand results include the use of fossil fuels (petroleum, natural
gas, and coal) for process energy, transportation energy, and as material feedstocks (e.g., oil
and gas used as feedstocks for plastics), as well as use of uranium to generate the share of
nuclear energy in the average U.S. kWh. The main difference from cumulative energy
demand is that renewable biomass combustion energy (e.g., from combustion of wood
wastes), landfill gas used for process energy, and electricity derived from renewable energy
sources (primarily hydropower, wind, and solar) are not included in the non-renewable
energy demand results. The renewable energy demand contains those sources as
mentioned above. More than 97 percent of the total energy comes from non-renewable
sources. The main portion of the renewable energy comes from landfill gas used within the
resin production.
Table 2. Total Energy Demand for EPS Resin
Natural gas and petroleum used as raw material inputs for the production of EPS are
included in the totals for the raw and intermediate materials in Table 3. The energy from
these raw materials are called material feedstock energy. Figure 3 provides the breakdown
of the amount of total energy required for material feedstock energy versus the process
Total Energy
Non-
Renewable
Energy
Renewable
Energy
MM Btu MM Btu MM Btu
Raw and Intermediate Materials 39.1 39.0 0.092
Resin Production 2.7 1.9 0.85
41.8 40.8 0.94
Total Energy
Non-
Renewable
Energy
Renewable
Energy
MJ MJ MJ
Raw and Intermediate Materials 90,671 90,458 213
Resin Production 6,273 4,296 1,976
96,943 94,755 2,189
Total Energy
Non-
Renewable
Energy
Renewable
Energy
% % %
Raw and Intermediate Materials 93.5% 93.3% 0.2%
Resin Production 6.5% 4.4% 2.0%
100% 97.7% 2.3%Total
Basis: 1,000 pounds
Basis: 1,000 kilograms
Percentage
Total
Total

CLIENT\EPS-IA\KC162652
12.28.16 4004.00.002 16
and fuel energy amounts needed to produce EPS resin. As is the case for many of the plastic
resins, more than half of the total energy is associated with material feedstock.
Figure 3. Energy type for EPS Resin
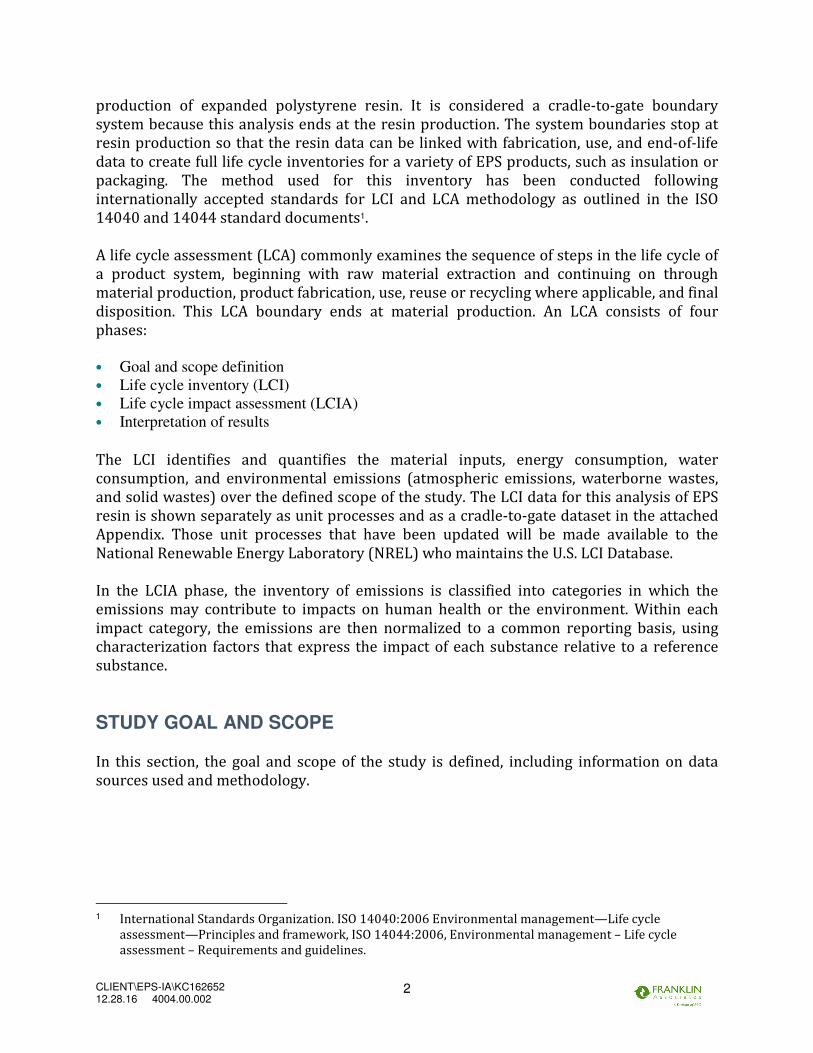
Energy Demand by Fuel Type
Table 4 and Figure 4 provide the total energy demand by fuel type for the EPS resin.
Natural gas and petroleum fuels make up over 90 percent of the total energy used. As
shown in Figure 3, this is partially due to the material feedstock energy (over half of the
energy use) using those fuels to create the plastic. These material feedstock fuels are part
of the energy shown for raw materials. The resin production energy shown in table 4 and
figure 4 represents the energy required for transportation of raw materials to resin
manufacturers, the energy required to produce the resin itself, and the fuels needed to
manufacture the resin.
Petroleum-based fuels (e.g. diesel fuel) are also the dominant energy source for
transportation. Non-fossil sources, such as hydropower, nuclear and other (geothermal,
wind, etc.) shown in Table 4 are used to generate purchased electricity along with the fossil
fuels. Other renewable also includes landfill gas used for process energy in the resin
production.
CLIENT\EPS-IA\KC162652
12.28.16 4004.00.002 17
Table 4. Energy Demand by Fuel Type for EPS Resin
Figure 4. Energy Separated by Fuel Type for EPS Resin
CLIENT\EPS-IA\KC162652
12.28.16 4004.00.002 18
SOLID WASTE
Solid waste results include the following types of wastes:
• Process wastes that are generated by the various processes from raw material
acquisition through production of EPS resin (e.g., sludges and residues from chemical
reactions and material processing steps)
• Fuel-related wastes from the production and combustion of fuels used for process
energy and transportation energy (e.g., refinery wastes, coal combustion ash)
No postconsumer wastes of the resin are included in this analysis due to the use of a cradle-
to-resin boundary.
The process solid waste, those wastes produced directly from the cradle-to-resin
processes, includes wastes that are incinerated both for disposal and for waste-to-energy,
as well as landfilled. These categories have been provided separately where possible. Solid
wastes from fuel combustion (e.g. ash) are assumed to be landfilled.
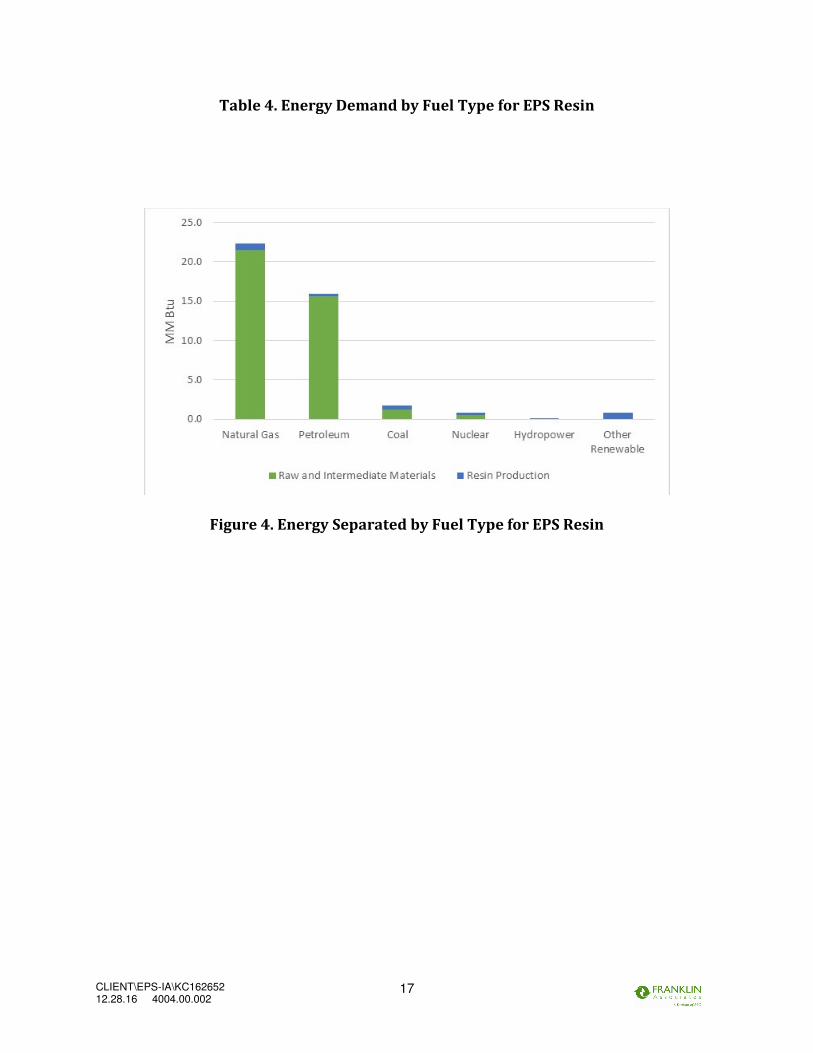
Results for solid waste by weight are shown in Table 5 and Figure 5. The solid wastes have
been separated in to hazardous and non-hazardous waste categories, as well as by raw and
intermediate materials versus resin production. Over three-quarters of the solid wastes
come from the raw and intermediate materials. Most of the solid wastes are largely
associated with production and combustion of fuels and the production of crude oil and
natural gas used as feedstocks for the plastic resin.
Table 5. Solid Wastes for EPS Resin
Total Solid
Waste
Waste-to-
EnergyIncineration Landfill
Hazardous
Waste Total
Waste-to-
EnergyIncineration Landfill
Non-
Hazardous
Waste Total
lb lb lb lb lb lb lb lb lb
Raw and Intermediate Materials 105.8 0.006 0.046 0.020 0.071 0.002 3.11 102.6 105.7
Resin Production 29.0 0.011 0.21 0.018 0.24 0 0.34 28.39 28.73
134.8 0.017 0.26 0.038 0.31 0.002 3.45 131.0 134.5
Total Solid
Waste
Waste-to-
EnergyIncineration Landfill
Hazardous
Waste Total
Waste-to-
EnergyIncineration Landfill
Non-
Hazardous
Waste Total
kg kg kg kg kg kg kg kg kg
Raw and Intermediate Materials 105.8 0.006 0.046 0.020 0.071 0.002 3.11 102.6 105.7
Resin Production 29.0 0.011 0.21 0.018 0.24 0 0.34 28.39 28.73
134.8 0.017 0.26 0.038 0.31 0.002 3.45 131.0 134.5
Total Solid
Waste
Waste-to-
EnergyIncineration Landfill
Hazardous
Waste Total
Waste-to-
EnergyIncineration Landfill
Non-
Hazardous
Waste Total
% % % % % % % % %
Raw and Intermediate Materials 78.5% 0.004% 0.034% 0.015% 0.05% 0.001% 2.31% 76.1% 78.4%
Resin Production 21.5% 0.008% 0.16% 0.013% 0.18% 0% 0.25% 21.07% 21.3%
100% 0.012% 0.19% 0.028% 0.23% 0.001% 2.56% 97.2% 99.8%
Total
Basis: 1,000 pounds
Basis: 1,000 kilograms
Percentage of Total
Non-Hazardous Wastes
Hazardous Wastes
Hazardous Wastes
Non-Hazardous Wastes
Non-Hazardous Wastes
Total
Total
Hazardous Wastes
CLIENT\EPS-IA\KC162652
12.28.16 4004.00.002 19
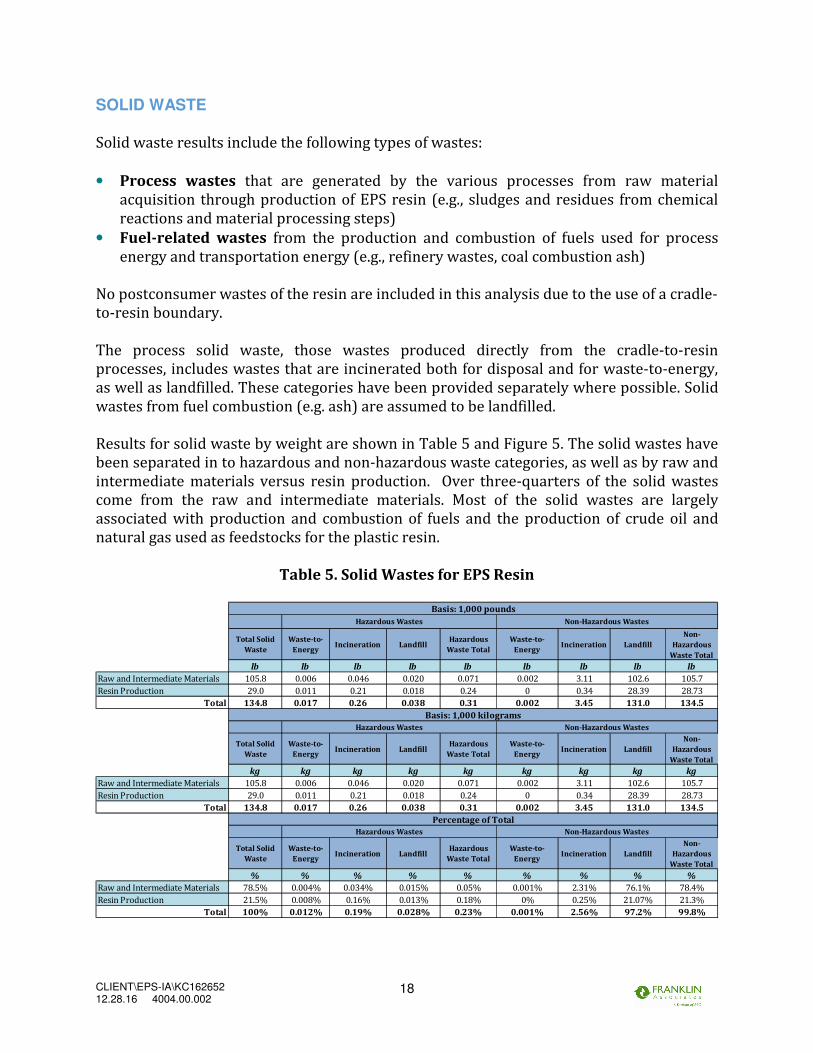
Solid wastes are shown separated by hazardous and non-hazardous wastes in Table 5. This
separation was done only where primary data was collected, or if a secondary data source
was clear that the solid waste was of a hazardous nature. Much of the process solid wastes
from oil and natural gas were classified as non-hazardous due to exclusions found in RCRA
hazardous wastes regulations or other EPA hazardous wastes regulations. Less than 0.3
percent of the total solid wastes were considered process hazardous wastes.
Figure 5. Solid Wastes Separated by Disposal Fate for EPS Resin
Figure 5 provides a breakout of the total solid wastes by the disposal fate. As much of the
solid wastes come from the fuel production and combustion, over 97 percent of the total
solid wastes is landfilled. Only 0.01 percent of the total solid waste is used to create energy,
while the remaining solid waste is incinerated with no energy capture.
WATER CONSUMPTION
Consumptive use of water in this study includes freshwater that is withdrawn from a water
source or watershed and not returned to that source. Consumptive water use includes
water consumed in chemical reactions, water that is incorporated into a product or waste
stream, water that becomes evaporative loss, and water that is discharged to a different
watershed or water body than the one from which it was withdrawn. Water consumption
results shown for each life cycle stage include process water consumption as well as water
consumption associated with production of the electricity and fuels used in that stage.
Electricity-related water consumption includes evaporative losses associated with thermal
generation of electricity from fossil and nuclear fuels, as well as evaporative losses due to
establishment of dams for hydropower.

CLIENT\EPS-IA\KC162652
12.28.16 4004.00.002 20
Water consumption results are shown in Table 6 and Figure 6. Process water consumption
dominates in the raw and intermediate material stage requiring 83 percent of the
consumed water. The extraction of natural gas and crude oil consume over 40 percent of
the water consumption for the EPS resin system, while electricity production utilizes 20
percent of the water. Resin production uses 17 percent of the total water consumed with
about 8 percent associated with the production of the resin and 7 percent associated with
generation of electricity used in the resin production.
Table 6. Water Consumption for EPS Resin
Figure 6. Water Consumption for EPS Resin
GLOBAL WARMING POTENTIAL
The primary atmospheric emissions reported in this analysis that contribute over 99% of
the total global warming potential for each system are fossil fuel-derived carbon dioxide,
Basis: 1,000
Pounds
Basis: 1,000
kilograms
Percentage of
Total
Gallons Liters %
Raw and Intermediate Materials 15,521 9,022 83%
Resin Production 3,199 1,859 17%
18,720 10,881 100%
Total Water Consumption
Total

CLIENT\EPS-IA\KC162652
12.28.16 4004.00.002 21
methane, and nitrous oxide. Any non-fossil carbon dioxide emissions, such as those from
the burning of wood-derived fuel, is a return of carbon dioxide to the atmosphere in the
same form as it was originally removed from the atmosphere during the biomass growth
cycle; therefore, carbon dioxide emissions from combustion or decomposition of biomass-
derived products are not considered a net contributor to global warming.
The 100-year global warming potential (GWP) factors for each of these substances as
reported in the Intergovernmental Panel on Climate Change (IPCC) 20136 are: fossil carbon
dioxide 1, fossil methane 28, and nitrous oxide 265. The GWP factor for a substance
represents the relative global warming contribution of a pound of that substance compared
to a pound of carbon dioxide. The weights of each greenhouse gas are multiplied by its
GWP factor to arrive at the total GWP results. The majority of the greenhouse gas emissions
and GWP for each system are fuel-related emissions rather than process emissions.
Table 7 and Figure 7 show life cycle GWP results for the EPS resin. Raw and intermediate
material production accounts for the largest share of GWP (90 percent), while the resin
manufacturing releases 10%. The GWP emissions from the raw material stage are mainly
associated with fossil fuel resources used as fuel and as feedstock production for the plastic
resin. Natural gas combustion releases 35 percent of the GWP emissions.
Table 7. Global Warming Potential for EPS Resin
ACIDIFICATION
Acidification assesses the potential of emissions to contribute to the formation and deposit
of acid rain on soil and water, which can cause serious harm to plant and animal life as well
as damage to infrastructure. Acidification potential modeling in TRACI incorporates the
results of an atmospheric chemistry and transport model, developed by the U.S. National
Acid Precipitation Assessment Program (NAPAP), to estimate total North American
6 IPCC, 2013: Climate Change 2013: The Physical Science Basis. Contribution of Working Group I to
the Fifth Assessment Report of the Intergovernmental Panel on Climate Change [Stocker, T.F., D. Qin, G.-K. Plattner, M. Tignor, S.K. Allen, J. Boschung, A. Nauels, Y. Xia, V. Bex and P.M. Midgley
(eds.)]. Cambridge University Press, Cambridge, United Kingdom and New York, NY, USA, 2013.
Basis: 1,000
Pounds
Basis: 1,000
kilograms
Percentage of
Total
lb CO2 eq kg CO2 eq %
Raw and Intermediate Materials 2,937 2,937 90%
Resin Production 324 324 10%
3,261 3,261 100%
Global Warming Potential
Total

CLIENT\EPS-IA\KC162652
12.28.16 4004.00.002 22
Figure 7. Global Warming Potential for EPS Resin
terrestrial deposition due to atmospheric emissions of NOx and SO2, as a function of the
emissions location.7,8
Acidification impacts are typically dominated by fossil fuel combustion emissions,
particularly sulfur dioxide (SO2) and nitrogen oxides (NOx). Emissions from combustion of
fossil fuels, especially coal, to generate grid electricity is a significant contributor to
acidification impacts for all systems. Table 8 shows total acidification potential results for
the EPS resin. Results are shown graphically in Figure 8. Raw and intermediate material
production accounts for 84 percent of the total acidification potential, with the resin
production creating only 16 percent. Almost one-quarter of the acidification potential
comes from coal production.
Table 8. Acidification Potential for EPS Resin
7 Bare JC, Norris GA, Pennington DW, McKone T. (2003). TRACI: The Tool for the Reduction and
Assessment of Chemical and Other Environmental Impacts, Journal of Industrial Ecology, 6(3–4): 49–78.
Available at URL: http://mitpress.mit.edu/journals/pdf/jiec_6_3_49_0.pdf. 8 Bare JC. (2002). Developing a consistent decision-making framework by using the US EPA’s TRACI,
AICHE. Available at URL: http://www.epa.gov/nrmrl/std/sab/traci/aiche2002paper.pdf.
Basis: 1,000
Pounds
Basis: 1,000
kilograms
Percentage of
Total
lb SO2 eq kg SO2 eq %
Raw and Intermediate Materials 10.04 10.04 84%
Resin Production 1.91 1.91 16%
11.95 11.95 100%
Acidification Potential
Total

CLIENT\EPS-IA\KC162652
12.28.16 4004.00.002 23
Figure 8. Acidification Potential for EPS Resin
EUTROPHICATION
Eutrophication occurs when excess nutrients are introduced to surface water causing the
rapid growth of aquatic plants. This growth (generally referred to as an “algal bloom”)
reduces the amount of dissolved oxygen in the water, thus decreasing oxygen available for
other aquatic species. The TRACI characterization factors for eutrophication are the
product of a nutrient factor and a transport factor.9 The nutrient factor is based on the
amount of plant growth caused by each pollutant, while the transport factor accounts for
the probability that the pollutant will reach a body of water. Atmospheric emissions of
nitrogen oxides (NOx) as well as waterborne emissions of nitrogen, phosphorus, ammonia,
biochemical oxygen demand (BOD), and chemical oxygen demand (COD) are the main
contributors to eutrophication impacts.
Eutrophication potential results for EPS resin are shown in Table 9 and illustrated in Figure
9. Eutrophication impacts for the EPS resin are mainly from raw and intermediate material
production (82 percent), while the resin production makes up the remaining amount of 18
percent. The largest share of raw material eutrophication is from benzene production and
from the combustion of fuels in transportation.
9 Bare JC, Norris GA, Pennington DW, McKone T. (2003). TRACI: The Tool for the Reduction and
Assessment of Chemical and Other Environmental Impacts, Journal of Industrial Ecology, 6(3–4): 49–78.
Available at URL: http://mitpress.mit.edu/journals/pdf/jiec_6_3_49_0.pdf.

CLIENT\EPS-IA\KC162652
12.28.16 4004.00.002 24
Table 9. Eutrophication Potential for EPS Resin
Figure 9. Eutrophication Potential for EPS Resin
OZONE DEPLETION Stratospheric ozone depletion is the reduction of the protective ozone within the
stratosphere caused by emissions of ozone-depleting substance (e.g. CFCs and halons). The
ozone depletion impact category characterizes the potential to destroy ozone based on a
chemical’s reactivity and lifetime. Damage related to ozone depletion can include skin
cancer, cataracts, material damage, immune system suppression, crop damage, and other
plant and animal effects.
Table 10 shows total ODP results for EPS resin broken out by life cycle stage. The results
are shown graphically in Figure 10. Ozone depletion results for the EPS resin are
dominated by raw and intermediate material production, contributing approximately 98
Basis: 1,000
Pounds
Basis: 1,000
kilograms
Percentage of
Total
lb N eq kg N eq %
Raw and Intermediate Materials 0.31 0.31 82%
Resin Production 0.07 0.07 18%
0.38 0.38 100%
Eutrophication Potential
Total
CLIENT\EPS-IA\KC162652
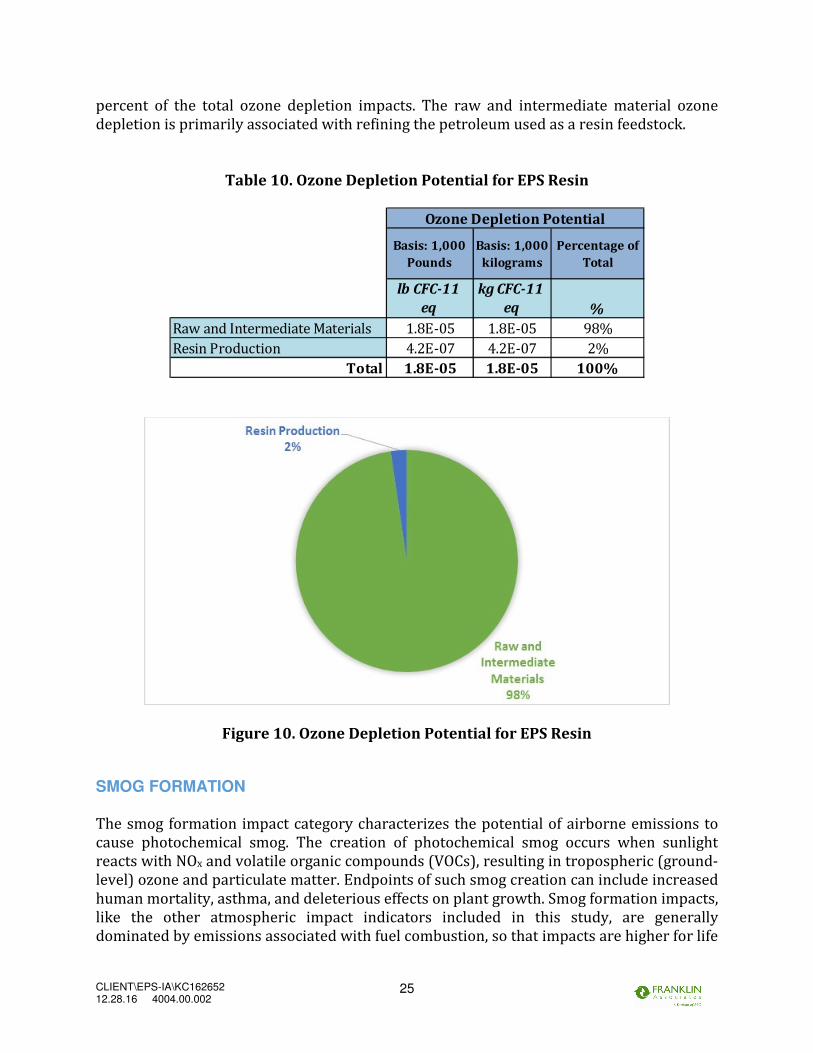
12.28.16 4004.00.002 25
percent of the total ozone depletion impacts. The raw and intermediate material ozone
depletion is primarily associated with refining the petroleum used as a resin feedstock.
Table 10. Ozone Depletion Potential for EPS Resin
Figure 10. Ozone Depletion Potential for EPS Resin
SMOG FORMATION The smog formation impact category characterizes the potential of airborne emissions to
cause photochemical smog. The creation of photochemical smog occurs when sunlight
reacts with NOx and volatile organic compounds (VOCs), resulting in tropospheric (ground-
level) ozone and particulate matter. Endpoints of such smog creation can include increased
human mortality, asthma, and deleterious effects on plant growth. Smog formation impacts,
like the other atmospheric impact indicators included in this study, are generally
dominated by emissions associated with fuel combustion, so that impacts are higher for life
Basis: 1,000
Pounds
Basis: 1,000
kilograms
Percentage of
Total
lb CFC-11
eq
kg CFC-11
eq %
Raw and Intermediate Materials 1.8E-05 1.8E-05 98%
Resin Production 4.2E-07 4.2E-07 2%
1.8E-05 1.8E-05 100%
Ozone Depletion Potential
Total

CLIENT\EPS-IA\KC162652
12.28.16 4004.00.002 26
cycle stages and components that have higher process fuel and transportation fuel
requirements. In this case, NOx makes up over 90% of the smog formation emissions. Smog
formation potential results for the EPS resin are shown by stage in Table 11 and illustrated
in Figure 11.
Approximately 75 percent of smog formation potential is from production of raw and
intermediate materials, while the remaining 25 percent comes from the resin production.
For the raw and intermediate material stage, 35 percent of the smog formation potential is
associated with the combustion of natural gas required for the production of various raw
and intermediate chemicals. For resin manufacturing, emissions from combustion of
transport fuels release more than half of those smog formation emissions. Electricity
production and the process energy at the EPS resin production facility each release over 15
production of the smog formation from resin production.
Table 11. Smog Formation Potential for EPS Resin
Figure 11. Smog Formation Potential for EPS Resin
Basis: 1,000
Pounds
Basis: 1,000
kilograms
Percentage of
Total
lb O3 eq kg O3 eq %
Raw and Intermediate Materials 123 123 75%
Resin Production 41.7 41.7 25%
165 165 100%Total
Photochemical Smog Potential

CLIENT\EPS-IA\KC162652
12.28.16 4004.00.002 27
APPENDIX: EXPANDED POLYSTYRENE (EPS) MANUFACTURE
This appendix discusses the manufacture of expanded polystyrene (EPS) resin. Examples of
EPS resin end-uses include insulation, food packaging, and transport packaging.
Approximately 953 million pounds of expanded polystyrene were produced in the U.S. and
Canada in 2014 (Reference A-1). The material flow for EPS resin is shown in Figure 2 in the
Goal and Scope section. The total system process data (cradle-to-EPS) for EPS are displayed
in Table 21 at the end of this appendix. These data include all process- and fuel-related
energy or emissions for the total boundaries of the EPS resin system. Individual process
tables on the bases of 1,000 pounds and 1,000 kilograms are also shown within this
appendix. The following processes are included in this appendix:
• Crude oil production
• Petroleum refining (distillation, desalting, and hydrotreating)
• Natural gas production
• Natural gas processing
• Olefin (Ethylene/Pygas) production
• Benzene production
• Ethylbenzene/Styrene production
• Pentane production
• Expanded polystyrene resin production
LCI data for all processes listed above, with the exception of pentane and EPS resin, are
currently being updated for a project for ACC Plastics Division. Updated LCI datasets for
these processes will be available by the end of 2017. Process datasets shown in this
appendix are from the current U.S. LCI Database.
CRUDE OIL PRODUCTION
Oil is produced by drilling into porous rock structures generally located several thousand
feet underground. Once an oil deposit is located, numerous holes are drilled and lined with
steel casing. Some oil is brought to the surface by natural pressure in the rock structure,
although most oil requires energy to drive pumps that lift oil to the surface. Once oil is on
the surface, it is separated from water and stored in tanks before being transported to a
refinery. In some cases, it is immediately transferred to a pipeline that transports the oil to
a larger terminal.
There are two primary sources of waste from crude oil production. The first source is the
“oil field brine,” or water that is extracted with the oil. The brine goes through a separator
at or near the well head in order to remove the oil from the water. These separators are
very efficient and leave minimal oil in the water.
CLIENT\EPS-IA\KC162652
12.28.16 4004.00.002 28
According to the American Petroleum Institute, 17.9 billion barrels of brine water were
produced from crude oil production in 1995 (Reference A-2). This equates to a ratio of 5.4
barrels of water per barrel of oil. The majority of this brine is produced by onshore oil
production facilities. Only a small percentage of onshore brine is discharged to surface
water. The majority is injected into wells specifically designed for production-related
waters (Reference A-3). The remaining brine is produced from offshore oil production
facilities, and most of this is released to the ocean (Reference A-4). Therefore, all
waterborne wastes from crude oil production are attributable to the water released from
offshore production (Reference A-5). Because crude oil is frequently produced along with
natural gas, a portion of the data is allocated to natural gas production (Reference A-2).
Evolving technologies are reducing the amount of brine that is extracted during oil
recovery and minimizing the environmental impact of discharged brine. For example,
downhole separation is a technology that separates brine from oil before bringing it to the
surface; the brine is injected into subsurface injection zones. The freeze-thaw evaporation
(FTE) process is another technology that reduces the discharge of brine water by using a
freeze crystallization process in the winter and a natural evaporation process in the
summer to extract fresh water from brine water; the fresh water can be used for
horticulture or agriculture applications (Reference A-6).
There are also waterborne emissions associated with drilling wastes. Suspensions of solids,
chemicals, and other materials in a base of water, oil, or synthetic-based material are
referred to as drilling fluids or drilling muds. These are formulated to lubricate and cool the
drill bit, carry drill cuttings from the hole to the surface, and maintain downhole
hydrostatic pressure. (Reference A-7). The volume of drilling waste is small in comparison
to oil field brine (Reference A-2). Less than 1% of drilling fluids from onshore production
are discharged to water, while about 90% of offshore drilling fluids are discharged
(References A-4, A-8). Toxic metal pollutants are released due to the use of barite, which is
employed to control the density of drilling fluids. (Reference A-7).
The primary source of atmospheric process emissions from oil extraction operations is gas
produced from oil wells. The majority of this gas is recovered for sale, but some is released
to the atmosphere. Atmospheric emissions from crude oil production are primarily
hydrocarbons, attributed to the natural gas produced from combination wells and relate to
line or transmission losses and unflared venting. Carbon dioxide is also released, primarily
from storage tank venting. The amount of methane released from crude oil production was
calculated from EPA’s Inventory of U.S. Greenhouse Gas Emissions and Sinks, which has
data specific to oil field emissions (Reference A-9).
The requirements for transporting crude oil from the production field to the Gulf Coast of
the United States (where most petroleum refining in the United States occurs) were
calculated from foreign and domestic supply data, port-to-port distance data, and domestic
petroleum movement data (References A-10 and A-11). Based on 2001 foreign and
domestic supply data, 62 percent of the United States crude oil supply is from foreign
sources, 6 percent is from Alaska, and the remaining 32 percent is from the lower 48 states.
These percentages were used to apportion transportation requirements among different

CLIENT\EPS-IA\KC162652
12.28.16 4004.00.002 29
transportation modes. With the exception of Canada, which transports crude oil to the
United States by pipeline, foreign suppliers transport crude oil to the United States by
ocean tanker. (In 2001, Saudi Arabia, Mexico, Canada, Venezuela, and Nigeria were the top
five foreign suppliers of crude oil to the United States.) The transportation of crude oil from
Alaska to the lower 48 states is also accomplished by ocean tanker. Domestic
transportation of crude oil is accomplished by pipeline and barge.
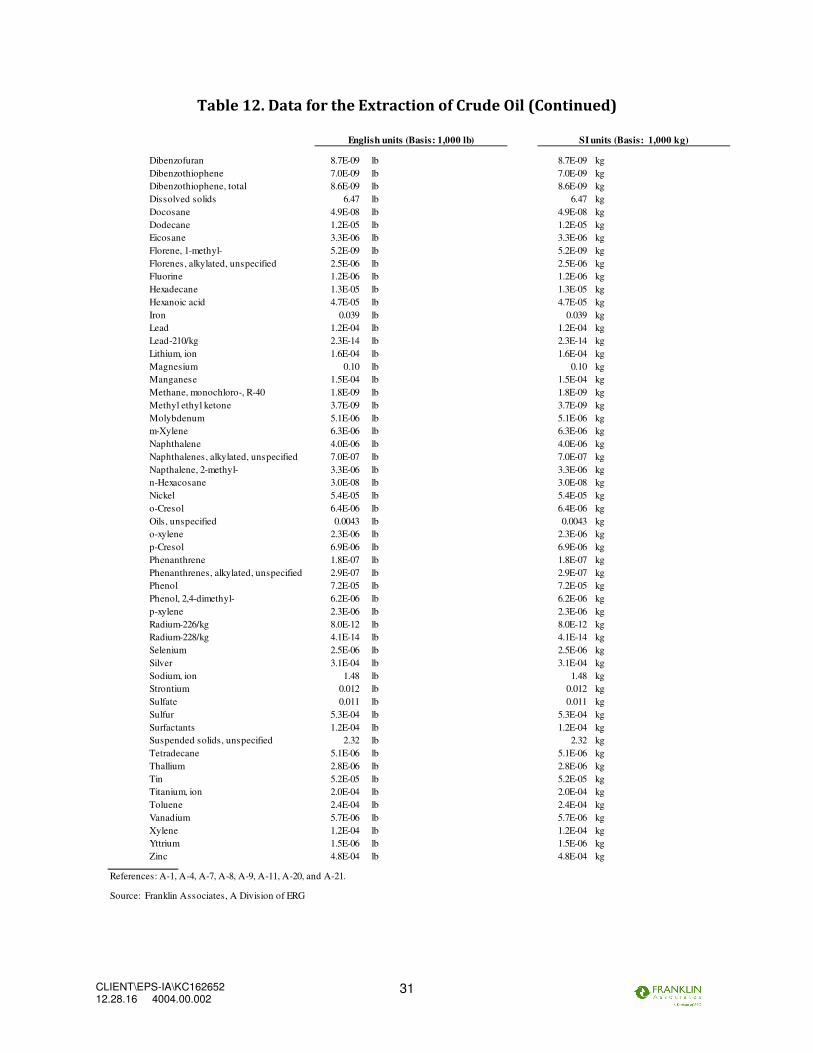
Table 12 shows the energy requirements and emissions for the extraction of crude oil.
PETROLEUM REFINING (DISTILLATION, DESALTING, AND HYDROTREATING)
Gasoline and diesel are the primary outputs from refineries; however, other major products
include kerosene, aviation fuel, residual oil, lubricating oil, and feedstocks for the
petrochemical industry. Data specific to the production of each type of refinery product are not
available. Such data would be difficult to characterize because there are many types of
conversion processes in oil refineries that are altered depending on market demand, quality of
crude input, and other variables. Thus, the following discussion is applicable to all refinery
products.
A petroleum refinery processes crude oil into thousands of products using physical and/or
chemical processing technology. A petroleum refinery receives crude oil, which is comprised of
mixtures of many hydrocarbon compounds and uses distillation processes to separate pure
product streams. Because the crude oil is contaminated (to varying degrees) with compounds
of sulfur, nitrogen, oxygen, and metals, cleaning operations are common in all refineries. Also,
the natural hydrocarbon components that comprise crude oil are often chemically changed to
yield products for which there is higher demand. These processes, such as polymerization,
alkylation, reforming, and visbreaking, are used to convert light or heavy crude oil fractions
into intermediate weight products, which are more easily handled and used as fuels and/or
feedstocks (Reference A-22).

CLIENT\EPS-IA\KC162652
12.28.16 4004.00.002 30
Table 12. Data for the Extraction of Crude Oil
Total Total
Energy Usage Energy Energy
Thousand Btu GigaJoules
Energy of Material Resource
Petroleum 1,035 lb 18,770 1,035 kg 43.7
Total Resource 18,770 43.7
Process Energy
Electricity (grid) 17.7 kwh 188 39.0 kwh 0.44
Natural gas 525 cu ft 588 32.8 cu meters 1.37
Distillate oil 0.15 gal 24.6 1.29 liter 0.057
Residual oil 0.10 gal 16.4 0.80 liter 0.038
Gasoline 0.082 gal 11.7 0.68 liter 0.027
Total Process 829 1.93
Environmental Emissions
Atmospheric Emissions
Methane 5.27 lb 5.27 kg
Carbon Dioxide 1.11 lb 1.11 kg
Solid Wastes
Landfilled 26.1 lb 26.1 kg
Waterborne Wastes
2-Hexanone 1.4E-06 lb 1.4E-06 kg
4-Methyl-2-Pentanone 1.9E-07 lb 1.9E-07 kg
Acetone 4.6E-07 lb 4.6E-07 kg
Aluminum 0.021 lb 0.021 kg
Ammonia 0.0028 lb 0.0028 kg
Antimony 1.3E-05 lb 1.3E-05 kg
Arsenic, ion 4.6E-05 lb 4.6E-05 kg
Barium 0.28 lb 0.28 kg
Benzene 2.6E-04 lb 2.6E-04 kg
Benzene, 1-methyl-4-(1-methylethyl)- 4.6E-09 lb 4.6E-09 kg
Benzene, ethyl- 1.4E-05 lb 1.4E-05 kg
Benzene, pentamethyl- 3.4E-09 lb 3.4E-09 kg
Benzenes, alkylated, unspecified 4.3E-05 lb 4.3E-05 kg
Benzoic acid 2.2E-04 lb 2.2E-04 kg
Beryllium 2.9E-06 lb 2.9E-06 kg
Biphenyl, total 2.8E-06 lb 2.8E-06 kg
BOD5, Biological Oxygen Demand 0.025 lb 0.025 kg
Boron 6.9E-04 lb 6.9E-04 kg
Bromide 0.031 lb 0.031 kg
Cadmium, ion 7.1E-06 lb 7.1E-06 kg
Calcium, ion 0.50 lb 0.50 kg
Chloride 6.07 lb 6.07 kg
Chromium 5.6E-04 lb 5.6E-04 kg
Cobalt 4.9E-06 lb 4.9E-06 kg
COD, Chemical Oxygen Demand 0.042 lb 0.042 kg
Copper, ion 6.2E-05 lb 6.2E-05 kg
Cyanide 3.3E-09 lb 3.3E-09 kg
Decane 6.4E-06 lb 6.4E-06 kg
English units (Basis: 1,000 lb) SI units (Basis: 1,000 kg)
CLIENT\EPS-IA\KC162652
12.28.16 4004.00.002 31
Table 12. Data for the Extraction of Crude Oil (Continued)
Dibenzofuran 8.7E-09 lb 8.7E-09 kg
Dibenzothiophene 7.0E-09 lb 7.0E-09 kg
Dibenzothiophene, total 8.6E-09 lb 8.6E-09 kg
Dissolved solids 6.47 lb 6.47 kg
Docosane 4.9E-08 lb 4.9E-08 kg
Dodecane 1.2E-05 lb 1.2E-05 kg
Eicosane 3.3E-06 lb 3.3E-06 kg
Florene, 1-methyl- 5.2E-09 lb 5.2E-09 kg
Florenes, alkylated, unspecified 2.5E-06 lb 2.5E-06 kg
Fluorine 1.2E-06 lb 1.2E-06 kg
Hexadecane 1.3E-05 lb 1.3E-05 kg
Hexanoic acid 4.7E-05 lb 4.7E-05 kg
Iron 0.039 lb 0.039 kg
Lead 1.2E-04 lb 1.2E-04 kg
Lead-210/kg 2.3E-14 lb 2.3E-14 kg
Lithium, ion 1.6E-04 lb 1.6E-04 kg
Magnesium 0.10 lb 0.10 kg
Manganese 1.5E-04 lb 1.5E-04 kg
Methane, monochloro-, R-40 1.8E-09 lb 1.8E-09 kg
Methyl ethyl ketone 3.7E-09 lb 3.7E-09 kg
Molybdenum 5.1E-06 lb 5.1E-06 kg
m-Xylene 6.3E-06 lb 6.3E-06 kg
Naphthalene 4.0E-06 lb 4.0E-06 kg
Naphthalenes, alkylated, unspecified 7.0E-07 lb 7.0E-07 kg
Napthalene, 2-methyl- 3.3E-06 lb 3.3E-06 kg
n-Hexacosane 3.0E-08 lb 3.0E-08 kg
Nickel 5.4E-05 lb 5.4E-05 kg
o-Cresol 6.4E-06 lb 6.4E-06 kg
Oils, unspecified 0.0043 lb 0.0043 kg
o-xylene 2.3E-06 lb 2.3E-06 kg
p-Cresol 6.9E-06 lb 6.9E-06 kg
Phenanthrene 1.8E-07 lb 1.8E-07 kg
Phenanthrenes, alkylated, unspecified 2.9E-07 lb 2.9E-07 kg
Phenol 7.2E-05 lb 7.2E-05 kg
Phenol, 2,4-dimethyl- 6.2E-06 lb 6.2E-06 kg
p-xylene 2.3E-06 lb 2.3E-06 kg
Radium-226/kg 8.0E-12 lb 8.0E-12 kg
Radium-228/kg 4.1E-14 lb 4.1E-14 kg
Selenium 2.5E-06 lb 2.5E-06 kg
Silver 3.1E-04 lb 3.1E-04 kg
Sodium, ion 1.48 lb 1.48 kg
Strontium 0.012 lb 0.012 kg
Sulfate 0.011 lb 0.011 kg
Sulfur 5.3E-04 lb 5.3E-04 kg
Surfactants 1.2E-04 lb 1.2E-04 kg
Suspended solids, unspecified 2.32 lb 2.32 kg
Tetradecane 5.1E-06 lb 5.1E-06 kg
Thallium 2.8E-06 lb 2.8E-06 kg
Tin 5.2E-05 lb 5.2E-05 kg
Titanium, ion 2.0E-04 lb 2.0E-04 kg
Toluene 2.4E-04 lb 2.4E-04 kg
Vanadium 5.7E-06 lb 5.7E-06 kg
Xylene 1.2E-04 lb 1.2E-04 kg
Yttrium 1.5E-06 lb 1.5E-06 kg
Zinc 4.8E-04 lb 4.8E-04 kg
References: A-1, A-4, A-7, A-8, A-9, A-11, A-20, and A-21.
Source: Franklin Associates, A Division of ERG
English units (Basis: 1,000 lb) SI units (Basis: 1,000 kg)

CLIENT\EPS-IA\KC162652
12.28.16 4004.00.002 32
This module includes data for desalting, atmospheric distillation, vacuum distillation, and
hydrotreating. These are the most energy-intensive processes of a petroleum refinery,
representing over 95 percent of the total energy requirements of U.S. petroleum refineries
(Reference A-23). Data for cracking, reforming, and supporting processes are not available
and are not included in this module. The following figure is a simplified flow diagram of the
material flows and processes included in this module.
Air pollution is caused by various petroleum refining processes, including vacuum
distillation, catalytic cracking, thermal cracking processes, and sulfur recovery. Fugitive
emissions also contribute significantly to air emissions. Fugitive emissions include leaks
from valves, seals, flanges, and drains, as well as leaks escaping from storage tanks or
during transfer operations. The wastewater treatment plant for a refinery is also a source
of fugitive emissions (Reference A-24). Emissions of atmospheric and waterborne
emissions for petroleum refineries were derived from U.S. EPA and Department of Energy
publications (References A-21 and A-25 through A-28).
This module expresses data on the basis 1,000 pounds of general refinery product as well
as data allocated to specific refinery products. The data are allocated to specific refinery
products based on the percent by mass of each product in the refinery output. The mass
allocation method assigns energy requirements and environmental emissions equally to all
refinery products -- equal masses of different refinery products are assigned equal energy
and emissions.
Mass allocation is not the only method that can be used for assigning energy and emissions
to refinery products. Heat of combustion and economic value are two additional methods
for co-product allocation. Using heat of combustion of refinery products yields allocation
factors similar to those derived by mass allocation, demonstrating the correlation between
mass and heat of combustion. Economic allocation is complicated because market values
fluctuate with supply and demand, and market data are not available for refinery products
Atmospheric
Distillation
PETROLEUM REFINERY
Vacuum
Distillation
Desalting Hydrotreating
Simplified flow diagram for petroleum refinery operations for the production of fuels.
All arrows represent material flows. The percentages of refinery products represent percent by mass of total refinery output.
* "Other" category includes still gas, petroleum coke, asphalt, and petrochemical feedstocks .
Crude Oil
Gasoline (42.1%)
Distillate Oil / Diesel (21.9%)
LPG (2.7%)
Residual Oil (4.9%)
Kerosene / Jet Fuel (9.1%)
Other * (19.4%)

CLIENT\EPS-IA\KC162652
12.28.16 4004.00.002 33
such as asphalt. This module does not apply the heat of combustion or economic allocation
methods because they have no apparent advantage over mass allocation.
Co-product function expansion is yet another method for allocating environmental burdens
among refinery products. Co-product function expansion is more complex than mass, heat
of combustion, or economic allocation; it evaluates downstream processes and product
substitutes in order to determine the percentage of total energy and emissions to assign to
each refinery product. This module does not use the co-product function expansion method
because it is outside the scope of this project.
There are advantages and disadvantages for each type of allocation method. Until detailed
data are available for the material flows and individual processes within a refinery, life
cycle practitioners will have to resort to allocation methods such as those discussed above.
The energy requirements and emissions for the refining of petroleum are found in Table
13.
NATURAL GAS PRODUCTION
Natural gas is a widely used energy resource, since it is a relatively clean, efficient, and
versatile fuel. The major component of natural gas is methane (CH4). Other components of
natural gas include ethane, propane, butane, and other heavier hydrocarbons, as well as water
vapor, carbon dioxide, nitrogen, and hydrogen sulfides.
Natural gas is extracted from deep underground wells and is frequently co-produced with
crude oil. Because of its gaseous nature, natural gas flows quite freely from wells which
produce primarily natural gas, but some energy is required to pump natural gas and crude oil
mixtures to the surface. An estimated 80 percent of natural gas is extracted onshore and 20
percent is extracted offshore (Reference A-15).
Atmospheric emissions from natural gas production result primarily from unflared venting.
Methane and non-combustion carbon dioxide emissions from natural gas extraction are
generally process related, with the largest source of these emissions from normal operations,
system upsets, and routine maintenance. Waterborne wastes result from brines that occur
when natural gas is produced in combination with oil. In cases where data represent both
crude oil and natural gas extraction, the data module allocates environmental emissions based
on the percent weight of natural gas produced. The data module also apportions
environmental emissions according to the percent share of onshore and offshore extraction.
Energy data for natural gas production were calculated from fuel consumption data for the
crude oil and natural gas extraction industry (Reference A-34). The energy and emissions data
for the production of natural gas is displayed in Table 14.

CLIENT\EPS-IA\KC162652
12.28.16 4004.00.002 34
Table 13. Data for the Refining of Petroleum Products
Material Inputs
Crude Oil 1,018 lb 1,018 kg
Total Total
Energy Usage Energy Energy
Thousand Btu GigaJoules
Process Energy
Electricity (grid) 64.9 kwh 691 143 kwh 1.61
Natural gas 178 cu ft 199 11.1 cu meters 0.46
LPG 0.14 gal 14.9 1.15 liter 0.035
Residual oil 3.26 gal 560 27.2 liter 1.30
Total Process 1,465 3.41
Incoming Transportation Energy
Barge 0.38 ton-miles 1.23 tonne-km
Diesel 3.1E-04 gal 0.048 0.0025 liter 1.1E-04
Residual oil 0.0010 gal 0.17 0.0085 liter 4.0E-04
Ocean freighter 1,499 ton-miles 4823 tonne-km
Diesel 0.28 gal 45.2 2.38 liter 0.11
Residual 2.56 gal 440 21.4 liter 1.02
Pipeline-petroleum products 200 ton-miles 642 tonne-km
Electricity 4.35 kwh 44.5 9.59 kwh 0.10
Total Transportation 530 1.23
Environmental Emissions
Atmospheric Emissions
Ammonia 0.0036 lb 0.0036 kg
Antimony 2.0E-06 lb 2.0E-06 kg
Arsenic 2.6E-07 lb 2.6E-07 kg
Benzene 0.0011 lb 0.0011 kg
Carbon dioxide, fossil 0.25 lb 0.25 kg
Carbon monoxide 0.42 lb 0.42 kg
Chromium 6.8E-07 lb 6.8E-07 kg
Ethylene dibromide 4.3E-06 lb 4.3E-06 kg
Methane, chlorotrifluoro-, CFC-13 2.2E-05 lb 2.2E-05 kg
Methane, fossil 0.037 lb 0.037 kg
Methane, tetrachloro-, CFC-10 1.4E-06 lb 1.4E-06 kg
Nickel 5.8E-06 lb 5.8E-06 kg
Nitrogen oxides 0.42 lb 0.42 kg
0.68 lb 0.68 kg
Particulates, < 10 um 0.031 lb 0.031 kg
Particulates, < 2.5 um 0.023 lb 0.023 kg
Polycyclic organic matter, unspecified 5.6E-05 lb 5.6E-05 kg
SO2 0.25 lb 0.25 kg
Solid Wastes
Landfilled 5.60 lb 5.60 kg
Waterborne Emissions
Ammonia 0.015 lb 0.015 kg
BOD5, Biological Oxygen Demand 0.034 lb 0.034 kg
Chromium 3.0E-06 lb 3.0E-06 kg
COD, Chemical Oxygen Demand 0.23 lb 0.23 kg
Lead 9.8E-07 lb 9.8E-07 kg
Mercury 6.0E-08 lb 6.0E-08 kg
Oils, unspecified 0.011 lb 0.011 kg
Phenol 2.3E-04 lb 2.3E-04 kg
Selenium 1.6E-06 lb 1.6E-06 kg
Sulfide 1.9E-04 lb 1.9E-04 kg
Suspended solids, unspecified 0.028 lb 0.028 kg
Vanadium 5.4E-05 lb 5.4E-05 kg
References: A-9, A-19, A-20, and A-29 through A-33
Source: Franklin Associates, A Division of ERG
NMVOC, non-methane volatile organic
compounds, unspecified origin
English units (Basis: 1,000 lb) SI units (Basis: 1,000 kg)

CLIENT\EPS-IA\KC162652
12.28.16 4004.00.002 35
Table 14. Data for the Extraction of Natural Gas
Total Total
Energy Usage Energy Energy
Thousand Btu GigaJoules
Energy of Material Resource
Natural Gas 1,038 lb 21,416 1,038 kg 49.8
Total Resource 21,416 49.8
Process Energy
Electricity (grid) 17.7 kwh 188 39.0 kwh 0.44
Natural gas 525 cu ft 588 32.8 cu meters 1.37
Distillate oil 0.15 gal 24.6 1.29 liter 0.057
Residual oil 0.10 gal 16.4 0.8 liter 0.038
Gasoline 0.082 gal 11.7 0.68 liter 0.027
Total Process 829 1.93
Environmental Emissions
Atmospheric EmissionsMethane 3.40 lb 3.40 kg
Carbon dioxide (fossil) 17.0 lb 17.0 kg
Solid Wastes
Landfilled 26.1 lb 26.1 kg
Waterborne Wastes
2-Hexanone 1.7E-06 lb 1.7E-06 kg
4-Methyl-2-Pentanone 7.4E-07 lb 7.4E-07 kg
Acetone 1.8E-06 lb 1.8E-06 kg
Aluminum 0.023 lb 0.023 kg
Ammonia 0.0025 lb 0.0025 kg
Antimony 1.4E-05 lb 1.4E-05 kg
Arsenic, ion 4.7E-05 lb 4.7E-05 kg
Barium 0.31 lb 0.31 kg
Benzene 2.6E-04 lb 2.6E-04 kg
Benzene, 1-methyl-4-(1-methylethyl)- 1.8E-08 lb 1.8E-08 kg
Benzene, ethyl- 1.5E-05 lb 1.5E-05 kg
Benzene, pentamethyl- 1.3E-08 lb 1.3E-08 kg
Benzenes, alkylated, unspecified 4.7E-05 lb 4.7E-05 kg
Benzoic acid 2.6E-04 lb 2.6E-04 kg
Beryllium 3.0E-06 lb 3.0E-06 kg
Biphenyl 3.1E-06 lb 3.1E-06 kg
BOD5, Biological Oxygen Demand 0.024 lb 0.024 kg
Boron 8.0E-04 lb 8.0E-04 kg
Bromide 0.030 lb 0.030 kg
Cadmium, ion 7.3E-06 lb 7.3E-06 kg
Calcium, ion 0.50 lb 0.50 kg
Chloride 6.30 lb 6.30 kg
Chromium 6.2E-04 lb 6.2E-04 kg
Cobalt 5.6E-06 lb 5.6E-06 kg
COD, Chemical Oxygen Demand 0.040 lb 0.040 kg
Copper, ion 6.7E-05 lb 6.7E-05 kg
Cyanide 1.3E-08 lb 1.3E-08 kg
Decane 7.4E-06 lb 7.4E-06 kg
Dibenzofuran 3.3E-08 lb 3.3E-08 kg
Dibenzothiophene 2.7E-08 lb 2.7E-08 kg
Dibenzothiophene, total 9.4E-09 lb 9.4E-09 kg
Dissolved solids 6.23 lb 6.23 kg
Docosane 1.9E-07 lb 1.9E-07 kg
Dodecane 1.4E-05 lb 1.4E-05 kg
English units (Basis: 1,000 lb) SI units (Basis: 1,000 kg)
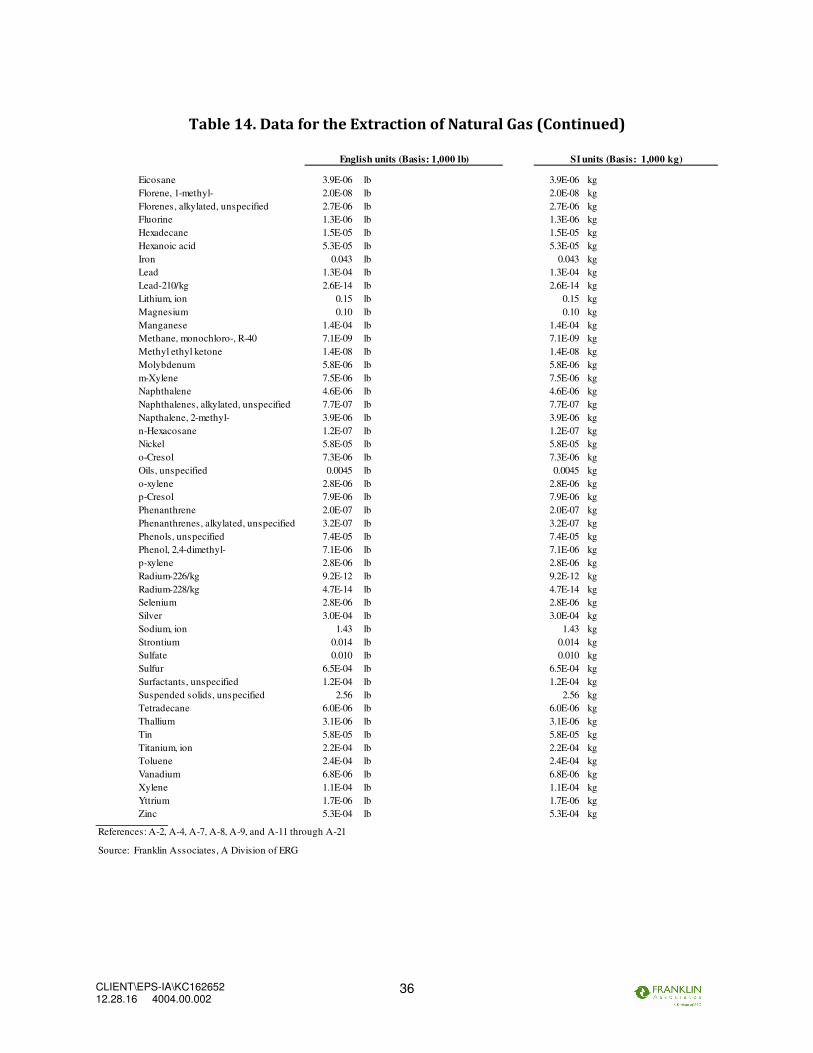
CLIENT\EPS-IA\KC162652
12.28.16 4004.00.002 36
Table 14. Data for the Extraction of Natural Gas (Continued)
Eicosane 3.9E-06 lb 3.9E-06 kg
Florene, 1-methyl- 2.0E-08 lb 2.0E-08 kg
Florenes, alkylated, unspecified 2.7E-06 lb 2.7E-06 kg
Fluorine 1.3E-06 lb 1.3E-06 kg
Hexadecane 1.5E-05 lb 1.5E-05 kg
Hexanoic acid 5.3E-05 lb 5.3E-05 kg
Iron 0.043 lb 0.043 kg
Lead 1.3E-04 lb 1.3E-04 kg
Lead-210/kg 2.6E-14 lb 2.6E-14 kg
Lithium, ion 0.15 lb 0.15 kg
Magnesium 0.10 lb 0.10 kg
Manganese 1.4E-04 lb 1.4E-04 kg
Methane, monochloro-, R-40 7.1E-09 lb 7.1E-09 kg
Methyl ethyl ketone 1.4E-08 lb 1.4E-08 kg
Molybdenum 5.8E-06 lb 5.8E-06 kg
m-Xylene 7.5E-06 lb 7.5E-06 kg
Naphthalene 4.6E-06 lb 4.6E-06 kg
Naphthalenes, alkylated, unspecified 7.7E-07 lb 7.7E-07 kg
Napthalene, 2-methyl- 3.9E-06 lb 3.9E-06 kg
n-Hexacosane 1.2E-07 lb 1.2E-07 kg
Nickel 5.8E-05 lb 5.8E-05 kg
o-Cresol 7.3E-06 lb 7.3E-06 kg
Oils, unspecified 0.0045 lb 0.0045 kg
o-xylene 2.8E-06 lb 2.8E-06 kg
p-Cresol 7.9E-06 lb 7.9E-06 kg
Phenanthrene 2.0E-07 lb 2.0E-07 kg
Phenanthrenes, alkylated, unspecified 3.2E-07 lb 3.2E-07 kg
Phenols, unspecified 7.4E-05 lb 7.4E-05 kg
Phenol, 2,4-dimethyl- 7.1E-06 lb 7.1E-06 kg
p-xylene 2.8E-06 lb 2.8E-06 kg
Radium-226/kg 9.2E-12 lb 9.2E-12 kg
Radium-228/kg 4.7E-14 lb 4.7E-14 kg
Selenium 2.8E-06 lb 2.8E-06 kg
Silver 3.0E-04 lb 3.0E-04 kg
Sodium, ion 1.43 lb 1.43 kg
Strontium 0.014 lb 0.014 kg
Sulfate 0.010 lb 0.010 kg
Sulfur 6.5E-04 lb 6.5E-04 kg
Surfactants, unspecified 1.2E-04 lb 1.2E-04 kg
Suspended solids, unspecified 2.56 lb 2.56 kg
Tetradecane 6.0E-06 lb 6.0E-06 kg
Thallium 3.1E-06 lb 3.1E-06 kg
Tin 5.8E-05 lb 5.8E-05 kg
Titanium, ion 2.2E-04 lb 2.2E-04 kg
Toluene 2.4E-04 lb 2.4E-04 kg
Vanadium 6.8E-06 lb 6.8E-06 kg
Xylene 1.1E-04 lb 1.1E-04 kg
Yttrium 1.7E-06 lb 1.7E-06 kg
Zinc 5.3E-04 lb 5.3E-04 kg
References: A-2, A-4, A-7, A-8, A-9, and A-11 through A-21
Source: Franklin Associates, A Division of ERG
English units (Basis: 1,000 lb) SI units (Basis: 1,000 kg)

CLIENT\EPS-IA\KC162652
12.28.16 4004.00.002 37
NATURAL GAS PROCESSING
Once raw natural gas is extracted, it is processed to yield a marketable product. First, the
heavier hydrocarbons such as ethane, butane and propane are removed and marketed as
liquefied petroleum gas (LPG). Then the water vapor, carbon dioxide, and nitrogen are
removed to increase the quality and heating value of the natural gas. If the natural gas has a
high hydrogen sulfide content, it is considered “sour.” Before it is used, hydrogen sulfide is
removed by adsorption in an amine solution—a process known as “sweetening.”
Atmospheric emissions result from acid gas removal processes and flaring of hydrogen
sulfide (H2S), the regeneration of glycol solutions, and fugitive emissions of methane.
Methane and carbon dioxide emissions from natural gas processing were calculated based
on emissions reported in the U.S. Greenhouse Gas Inventory . For natural gas that is
sweetened, the majority of the H2S removed is used for production of sulfur (Reference A-
35). Sulfur dioxide emissions were calculated for flaring of H2S that is not used for
recovered sulfur production (Reference A-36). Glycol solutions are used to dehydrate
natural gas, and the regeneration of these solutions result in the release of BTEX (benzene,
toluene, ethylbenzene, and xylene) as well as a variety of less toxic organics (Reference A-
37, A-38). Negligible particulate emissions are produced from natural gas plants, and the
relatively low processing temperatures (<1,200 degrees Fahrenheit) prevent the formation
of nitrogen oxides (NOx).
Natural gas is transported primarily by pipeline, but a small percentage is compressed and
transported by insulated railcars and tankers (References A-39 and A-40). Transportation
data were calculated from the net annual quantities of natural gas imported and exported
by each state (Reference A-41).
Energy data for natural gas processing were calculated from fuel consumption data for the
natural gas liquids extraction industry (Reference A-12). Table 15 shows the energy and
emissions data for processing natural gas. Sulfur was given no coproduct allocation in this
process. The amount of H2S in the sour natural gas varies widely depending on where it is
extracted.
OLEFINS PRODUCTION (ETHYLENE/PYGAS)
The primary process used for manufacturing olefins (including ethylene and pyrolysis
gasoline or pygas) is the thermal cracking of saturated hydrocarbons such as ethane,
propane, naphtha, and other gas oils.
Typical production of ethylene, propylene, and other coproducts begins when
hydrocarbons and steam are fed to the cracking furnace. After being heated to
temperatures around 1,000° Celsius, the cracked products are quenched in heat
exchangers which produce high pressure steam. Fuel oil is separated from the main gas
stream in a multi-stage centrifugal compressor. The main gas stream then undergoes
hydrogen sulfide removal and drying. The final step involves fractional distillation of the
various reaction products.

CLIENT\EPS-IA\KC162652
12.28.16 4004.00.002 38
Table 15. Data for the Processing of Natural Gas
Within the hydrocracker, an offgas is produced from the raw materials entering. A portion
of this offgas is used within the hydrocracker to produce steam, while the remaining
portion is exported from the hydrocracker as a coproduct, as discussed below. The offgas
used within the hydrocracker is shown in the data tables as “Internal offgas use.” This
offgas is shown as a weight of natural gas and petroleum input to produce the energy, as
well as the energy amount produced from those weights.
Data was collected from individual plants, and a mass allocation was used to provide an
output of 1,000 pounds/kilograms of each olefin product. Then a weighted average using
ethylene or pygas production amounts for each plant was applied to the individual olefins
plant production data collected from three leading producers (8 thermal cracking units) in
North America. Numerous coproduct streams are produced during this process. Fuel gas
and off-gas were two of the coproducts produced that were exported to another process for
fuel use. When these fuel coproducts are exported from the hydrocracker, they carry with
Material Inputs
Natural gas 1,005 lb 1,005 kg
Total Total
Energy Usage Energy Energy
Thousand Btu GigaJoules
Process Energy
Electricity (grid) 9.67 kwh 103 21.3 kwh 0.24
Natural gas 554 cu ft 620 34.6 cu meters 1.44
Distillate oil 0.0060 gal 0.96 0.050 liter 0.0022
Residual oil 0.0059 gal 1.02 0.050 liter 0.0024
Gasoline 0.0057 gal 0.81 0.048 liter 0.0019
Total Process 726 1.69
Environmental Emissions
Atmospheric Emissions
BTEX 0.34 lb 0.34 kg
Benzene 0.096 lb 0.096 kg
Toluene 0.15 lb 0.15 kg
Ethylbenzene 0.012 lb 0.012 kg
Xylene 0.087 lb 0.087 kg
Methane 1.88 lb 1.88 kg
SO2 1.90 lb 1.90 kg
VOC 0.77 lb 0.77 kg
Carbon Dioxide 53.0 lb 53.0 kg
References: A-12 through A-15, A-20, A-33, A-37, A-39, A-40, A-42, A-43, and A-44.
Source: Franklin Associates, A Division of ERG
English units (Basis: 1,000 lb) SI units (Basis: 1,000 kg)

CLIENT\EPS-IA\KC162652
12.28.16 4004.00.002 39
them the allocated share of the inputs and outputs for their production. The ratio of the
mass of the exported fuel over the total mass output was removed from the total inputs and
outputs of the hydrocracker, and the remaining inputs and outputs are allocated over the
material hydrocracker products (Equation 1).
[ ] [ ] productserhydrocrackremainingtoattributed
Total
EO IOM
MIO =
−× 1 (Equation 1)
where
IO = Input/Output Matrix to produce all products/coproducts
MEO = Mass of Exported Offgas
MTotal = Mass of all Products and Coproducts (including fuels)
No energy credit is applied for the exported fuels, since both the inputs and outputs for the
exported fuels have been removed from the data set. Table 16 shows the averaged energy
and emissions data for the production of ethylene. Table 17 displays the averaged energy
and emissions data for the production of pygas.
As of 2003, there were 16 olefin producers and at least 29 olefin plants in the U.S.
(Reference A-45). While data was collected from a relatively small sample of plants, the
olefins producers who provided data for this module verified that the characteristics of
their plants are representative of a majority of North American olefins production. All data
collected were individually reviewed by the data providers.
To assess the quality of the data collected for olefins, the collection method, technology,
industry representation, time period, and geography were considered. The data collection
methods for olefins include direct measurements, information provided by purchasing and
utility records, and estimates. The standard production technology for olefins is the steam
cracking of hydrocarbons (including natural gas liquids and petroleum liquids). The data in
this module represent steam cracking of natural gas and petroleum. All data submitted for
olefins represent the year 2003 and U.S. and Canada production.

CLIENT\EPS-IA\KC162652
12.28.16 4004.00.002 40
Table 16. Data for the Production of Ethylene
Material Inputs (1)
Refined Petroleum Products 186 lb 186 kg
Processed Natural Gas 830 lb 830 kg
Water Consumption 195 gal 1,627 liter
Total Total
Energy Usage Energy Energy
Thousand Btu GigaJoules
Process Energy
Electricity (grid) 35.7 kwh 380 78.8 kwh 0.88
Electricity (cogeneration) 30.6 kwh 209 67.4 kwh 0.49
Natural Gas 2,272 cu ft 2,545 142 cu meters 5.92
Gasoline 0.011 gal 1.56 0.091 liter 0.0036
Diesel 0.0095 gal 1.51 0.079 liter 0.0035
Internal Offgas use (2)
From Oil 26.1 lb 800 26.1 kg 1.86
From Natural Gas 119 lb 3,645 119 kg 8.49
Recovered Energy 12.4 thousand Btu 12.4 29 MJ 0.029
Total Process 7,569 17.6
Incoming Transportation Energy
Combination truck 7.64 ton-miles 24.6 tonne-km
Diesel 0.080 gal 12.7 0.67 liter 0.030
Rail 6.59 ton-miles 21.2 tonne-km
Diesel 0.016 gal 2.60 0.14 liter 0.0060
Barge 15.6 ton-miles 50.3 tonne-km
Diesel 0.013 gal 1.99 0.10 liter 0.0046
Residual oil 0.042 gal 7.14 0.35 liter 0.017
Pipeline-natural gas 475 ton-miles 1,527 tonne-km
Natural gas 327 cu ft 367 20.4 cu meter 0.85
Ethylene Products
Pipeline-Petroleum Products 22.7 ton-miles 73.2 tonne-km
Electricity 0.50 kwh 5.08 1.09 kwh 0.012
Environmental Emissions
Atmospheric Emissions - Process
Carbon Monoxide 0.0010 lb (3) 0.0010 kg
Chlorine 1.0E-04 lb (3) 1.0E-04 kg
HCFC-022 1.0E-06 lb (3) 1.0E-06 kg
Hydrogen Chloride 1.0E-06 lb (3) 1.0E-06 kg
Hydrogen 0.0040 lb 0.0040 kg
Hydrocarbons (NM) 0.091 lb 0.091 kg
Methane 0.0010 lb (3) 0.0010 kg
Other Organics 0.0010 lb (3) 0.0010 kg
Particulates (unspecified) 0.0084 lb 0.0084 kg
Particulates (PM10) 0.10 lb (3) 0.10 kg
Sulfur Oxides 0.0041 lb 0.0041 kg
VOC 0.010 lb (3) 0.010 kg
Atmospheric Emissions - Fuel-Related (4)
Carbon Dioxide (fossil) 648 lb 648 kg
Carbon Monoxide 0.39 lb 0.39 kg
Nitrogen Oxides 0.60 lb 0.60 kg
PM 2.5 0.0093 lb 0.0093 kg
Sulfur Oxides 0.059 lb 0.059 kg
Solid Wastes
Landfilled 0.28 lb 0.28 kg
Burned 3.62 lb 3.62 kg
Waste-to-Energy 0.023 lb 0.023 kg
Waterborne Wastes
Acetone 1.0E-08 lb (3) 1.0E-08 kg
Benzene 1.0E-05 lb (3) 1.0E-05 kg
BOD 6.7E-04 lb 6.7E-04 kg
COD 0.010 lb (3) 0.010 kg
Ethylbenzene 1.0E-05 lb (3) 1.0E-05 kg
Naphthalene 1.0E-08 lb (3) 1.0E-08 kg
Phenol 0.0010 lb (3) 0.0010 kg
Styrene 1.0E-06 lb (3) 1.0E-06 kg
Suspended Solids 0.0045 lb 0.0045 kg
Toluene 1.0E-04 lb (3) 1.0E-04 kg
Total Organic Carbon 0.0010 lb (3) 0.0010 kg
Xylene 1.0E-06 lb (3) 1.0E-06 kg
(1) Specific input materials from oil refining and natural gas processing include ethane, propane,
liquid feed, heavy raffinate, and DNG.
(2)
(3) This emission was reported by fewer than three companies. To indicate known emissions
while protecting the confidentiality of individual company responses, the emission is reported
only by order of magnitude.
(4)
References: A-46 through A-50.
Source: Franklin Associates, A Division of ERG
the off gas, as well as the natural gas.
These fuel-related emissions were provided by the plants. These take into account the combustion of
English units (Basis: 1,000 lb) SI units (Basis: 1,000 kg)
A portion of the material feed combusts within the hydrocracker and produces an offgas, which
provides an internal energy source
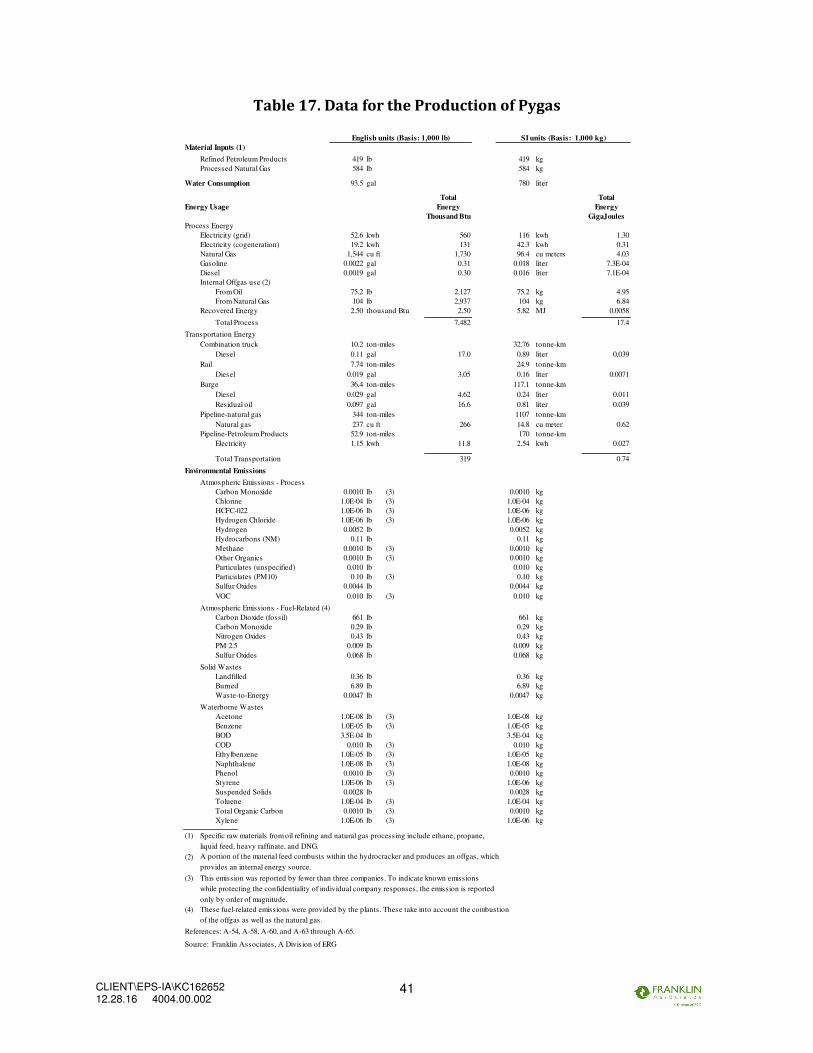
CLIENT\EPS-IA\KC162652
12.28.16 4004.00.002 41
Table 17. Data for the Production of Pygas
Material Inputs (1)
Refined Petroleum Products 419 lb 419 kg
Processed Natural Gas 584 lb 584 kg
Water Consumption 93.5 gal 780 liter
Total Total
Energy Usage Energy Energy
Thousand Btu GigaJoules
Process Energy
Electricity (grid) 52.6 kwh 560 116 kwh 1.30
Electricity (cogeneration) 19.2 kwh 131 42.3 kwh 0.31
Natural Gas 1,544 cu ft 1,730 96.4 cu meters 4.03
Gasoline 0.0022 gal 0.31 0.018 liter 7.3E-04
Diesel 0.0019 gal 0.30 0.016 liter 7.1E-04
Internal Offgas use (2)
From Oil 75.2 lb 2,127 75.2 kg 4.95
From Natural Gas 104 lb 2,937 104 kg 6.84
Recovered Energy 2.50 thousand Btu 2.50 5.82 MJ 0.0058
Total Process 7,482 17.4
Transportation Energy
Combination truck 10.2 ton-miles 32.76 tonne-km
Diesel 0.11 gal 17.0 0.89 liter 0.039
Rail 7.74 ton-miles 24.9 tonne-km
Diesel 0.019 gal 3.05 0.16 liter 0.0071
Barge 36.4 ton-miles 117.1 tonne-km
Diesel 0.029 gal 4.62 0.24 liter 0.011
Residual oil 0.097 gal 16.6 0.81 liter 0.039
Pipeline-natural gas 344 ton-miles 1107 tonne-km
Natural gas 237 cu ft 266 14.8 cu meter 0.62
Pipeline-Petroleum Products 52.9 ton-miles 170 tonne-km
Electricity 1.15 kwh 11.8 2.54 kwh 0.027
Total Transportation 319 0.74
Environmental Emissions
Atmospheric Emissions - Process
Carbon Monoxide 0.0010 lb (3) 0.0010 kg
Chlorine 1.0E-04 lb (3) 1.0E-04 kg
HCFC-022 1.0E-06 lb (3) 1.0E-06 kg
Hydrogen Chloride 1.0E-06 lb (3) 1.0E-06 kg
Hydrogen 0.0052 lb 0.0052 kg
Hydrocarbons (NM) 0.11 lb 0.11 kg
Methane 0.0010 lb (3) 0.0010 kg
Other Organics 0.0010 lb (3) 0.0010 kg
Particulates (unspecified) 0.010 lb 0.010 kg
Particulates (PM10) 0.10 lb (3) 0.10 kg
Sulfur Oxides 0.0044 lb 0.0044 kg
VOC 0.010 lb (3) 0.010 kg
Atmospheric Emissions - Fuel-Related (4)
Carbon Dioxide (fossil) 661 lb 661 kg
Carbon Monoxide 0.29 lb 0.29 kg
Nitrogen Oxides 0.43 lb 0.43 kg
PM 2.5 0.009 lb 0.009 kg
Sulfur Oxides 0.068 lb 0.068 kg
Solid Wastes
Landfilled 0.36 lb 0.36 kg
Burned 6.89 lb 6.89 kg
Waste-to-Energy 0.0047 lb 0.0047 kg
Waterborne Wastes
Acetone 1.0E-08 lb (3) 1.0E-08 kg
Benzene 1.0E-05 lb (3) 1.0E-05 kg
BOD 3.5E-04 lb 3.5E-04 kg
COD 0.010 lb (3) 0.010 kg
Ethylbenzene 1.0E-05 lb (3) 1.0E-05 kg
Naphthalene 1.0E-08 lb (3) 1.0E-08 kg
Phenol 0.0010 lb (3) 0.0010 kg
Styrene 1.0E-06 lb (3) 1.0E-06 kg
Suspended Solids 0.0028 lb 0.0028 kg
Toluene 1.0E-04 lb (3) 1.0E-04 kg
Total Organic Carbon 0.0010 lb (3) 0.0010 kg
Xylene 1.0E-06 lb (3) 1.0E-06 kg
(1) Specific raw materials from oil refining and natural gas processing include ethane, propane,
liquid feed, heavy raffinate, and DNG.
(2)
provides an internal energy source.
(3) This emission was reported by fewer than three companies. To indicate known emissions
while protecting the confidentiality of individual company responses, the emission is reported
only by order of magnitude.
(4)
References: A-54, A-58, A-60, and A-63 through A-65.
Source: Franklin Associates, A Division of ERG
of the offgas as well as the natural gas.
These fuel-related emissions were provided by the plants. These take into account the combustion
A portion of the material feed combusts within the hydrocracker and produces an offgas, which
English units (Basis: 1,000 lb) SI units (Basis: 1,000 kg)

CLIENT\EPS-IA\KC162652
12.28.16 4004.00.002 42
BENZENE PRODUCTION
Benzene is the most widely used aromatic petrochemical raw material. The two major
sources of benzene are catalytic reformate and pyrolysis gasoline (Reference A-51).
Additional benzene is produced by the dealkylation of the toluene.
In the reforming process, naphtha is fed through a catalyst bed at elevated temperatures
and pressures. The most common type of reforming process is platforming, in which a
platinum-containing catalyst is used. Products obtained from the platforming process
include aromatic compounds (benzene, toluene, xylene), hydrogen, light gas, and liquefied
petroleum gas. The aromatics content of the reformate varies and is normally less than 45
percent. The reformate from the platforming process undergoes solvent extraction and
fractional distillation to produce pure benzene, toluene, and other coproducts.
Pyrolysis gasoline is a byproduct of the steam cracking of hydrocarbons for the production
of ethylene and propylene. Raw pyrolysis gas is composed of a mixture of C5 to C8
hydrocarbons, including several aromatic compounds. To separate the aromatics from the
resulting mixture, a very polar solvent (commonly an alcohol) is used to dissolve the
aromatic components. The aromatics can then be separated from the solvent using
fractional distillation. The solvent is recovered and re-used.
Table 18 represents the energy requirements and environmental emissions for producing
benzene. Only catalytic reforming and pyrolysis gasoline are considered as the source of
benzene in this analysis. These sources account for 70 percent of the world production of
benzene (Reference A-52). It is estimated that one-third of this production is from
pyrolysis gasoline and two-thirds are produced from catalytic reforming (Reference A-53).
The collected datasets were weighted using these fractions.
Numerous aromatic coproduct streams are produced during this process. Fuel gas and off-
gas were two of the coproducts produced that were exported to another process for fuel
use. When these fuel coproducts are exported from the aromatics separation process, they
carry with them the allocated share of the inputs and outputs for their production. The
ratio of the mass of the exported fuel over the total mass output was removed from the
total inputs and outputs, and the remaining inputs and outputs are allocated over the
material aromatics products (Equation 1).
[ ] [ ] productsromaticsaremainingtoattributed
Total
EO IOM
MIO =
−× 1 (Equation 1)
where
IO = Input/Output Matrix to produce all products/coproducts
MEO = Mass of Exported Offgas
MTotal = Mass of all Products and Coproducts (including fuels)

CLIENT\EPS-IA\KC162652
12.28.16 4004.00.002 43
No energy credit is applied for the exported fuels, since both the inputs and outputs for the
exported fuels have been removed from the data set. Table 19 shows the averaged energy
and emissions data for the production of benzene.
Table 18. Data for the Production of Benzene
Material Inputs
Naphtha 667 lb 667 kg
Pygas from Hydrocracker 335 lb 335 kg
Water Consumption 0.75 gal 6.26 liter
Total Total
Energy Usage Energy Energy
Thousand Btu GigaJoules
Process Energy
Electricity (grid) 7.22 kwh 74.3 15.9 kwh 0.17
Electricity (cogeneration) 4.4 kwh 29.7 9.6 kwh 0.069
Natural gas 631 cu ft 707 39.4 cu meters 1.65
Distillate oil 0.40 gal 63.5 3.34 liter 0.15
Residual oil 3.87 gal 664 32.3 liter 1.55
Internal Offgas use (1)
From Oil 16.0 lb 400.6 16.0 kg 0.93
From Natural Gas 22.1 lb 553.4 22.1 kg 1.29
Total Process 2,492 3.23
Transportation Energy
Combination truck 9.32 ton-miles 30.0 tonne-km
Diesel 0.098 gal 15.5 0.82 liter 0.036
Rail 47.0 ton-miles 151 ton-miles
Diesel 0.12 gal 18.5 0.38 gal 59.6
Barge 50.3 ton-miles 162 tonne-km
Diesel 0.040 gal 6.40 0.13 gal 20.6
Residual oil 0.13 gal 23.0 0.43 gal 73.9
Pipeline-petroleum products 73.7 ton-miles 237 tonne-km
Electricity 1.61 kwh 16.5 3.54 kwh 0.038
Total Transportation 79.9 154
Environmental Emissions
Atmospheric Emissions
Chlorine 1.0E-04 lb (2) 1.0E-04 kg
Carbon Dioxide 45.2 lb 45.2 kg
Carbon Monoxide 0.010 lb (2) 0.010 kg
NM Hydrocarbons 0.010 lb (2) 0.010 kg
Nitrogen Oxides 0.062 lb 0.062 kg
Hydrogen 1.0E-06 lb (2) 1.0E-06 kg
Particulates (unknown) 0.019 lb 0.019 kg
PM2.5 0.010 lb (2) 0.010 kg
PM10 0.0010 lb (2) 0.0010 kg
Sulfur Oxides 0.44 lb 0.44 kg
Solid Wastes
Landfilled 0.43 lb 0.43 kg
Burned 0.051 lb 0.051 kg
Waterborne Wastes
Benzene 1.0E-06 lb (2) 1.0E-06 kg
BOD 0.47 lb 0.47 kg
COD 1.08 lb 1.08 kg
Dissolved solids 0.11 lb 0.11 kg
Oil 0.018 lb 0.018 kg
Sulfides 0.0010 lb (2) 0.0010 kg
Suspended Solids 0.0010 lb (2) 0.0010 kg
TOC 1.0E-05 lb (2) 1.0E-05 kg
(1)
provides an internal energy source.
(2) This emission was reported by fewer than three companies. To indicate known emissions
while protecting the confidentiality of individual company responses, the emission is reported
only by order of magnitude.
References: A-54 through A-57
Source: Franklin Associates, A Division of ERG
A portion of the material feed combusts within the hydrocracker and produces an offgas, which
English units (Basis: 1,000 lb) SI units (Basis: 1,000 kg)
CLIENT\EPS-IA\KC162652
12.28.16 4004.00.002 44
As of 2002 there were 22 benzene producers and 38 benzene plants in the U.S. for the three
standard technologies (Reference A-58). The benzene data collected for this module
represent 1 producer and 1 plant in the U.S. While data was collected from a small sample
of plants, the benzene producer who provided data for this module verified that the
characteristics of their plant is representative of the extraction of benzene from pyrolysis
gasoline for North American benzene production. The average dataset was reviewed and
accepted by the benzene data provider.
One of the three datasets was collected for this project and represents 2003 data, while the
other two datasets comes from 1992. The 2003 data were collected from direct
measurements and engineering estimates. The collection methods for the 1992 data are
unknown.
ETHYLBENZENE/STYRENE PRODUCTION
The production of styrene monomer is accomplished through a series of processes. The
first is the production of ethylbenzene by the alkylation of benzene with ethylene. In this
process, benzene initially passes through a drying column. From the drying column, the
benzene and ethylene are mixed in a reactor with a suitable catalyst. This reaction is
exothermic and occurs at relatively low pressures and temperatures. Unreacted benzene is
removed and recycled back to the process. The ethylbenzene is then separated from the
solution. The heavy bottoms, tars, and vent gases are burned while the solution is recycled
back to the reactor.
Styrene is produced by dehydrogenation of ethylbenzene. The ethylbenzene is mixed with
steam, then allowed to come in contact with a catalyst in a reactor. This reaction is carried
out at high temperature under vacuum. The heat is recovered from this reaction, and the
hydrocarbon solution is sent to a series of fractionation units. The first separation removes
the small amount (4 to 6 percent) of toluene and benzene produced by cracking. This
toluene/benzene stream is typically sent back to the benzene plant. The second separation
removes unreacted ethylbenzene and recycles it back into the system. Purified styrene
monomer is recovered in the third and final phase. Bottoms or tar residue is removed from
this third phase (Reference A-59).
Table 19 displays the energy requirements and environmental emissions for the
production of styrene including the production of ethylbenzene. Two of the three
ethylbenzene/styrene datasets were collected for this project and represents 2002-2003
data, while the other dataset comes from 1993. The 2003 data were collected from direct
measurements, purchasing/utility records, and engineering estimates. The collection
methods for the 1993 data are unknown. Various coproduct streams are produced during
this process. A mass basis was used to partition the credit for these coproducts.

CLIENT\EPS-IA\KC162652
12.28.16 4004.00.002 45
Table 19. Data for the Production of Ethylbenzene/Styrene
As of 2001 there were 8 styrene producers and 8 styrene plants in the U.S. (Reference A-
60). The styrene data collected for this module represent 2 producers and 2 plants in the
U.S. While data was collected from a small sample of plants, the styrene producers who
provided data for this module verified that the characteristics of their plants are
representative of North American styrene production. The average dataset was reviewed
and accepted by the styrene data providers.
Material Inputs
Ethylene 293 lb 293 kg
Benzene 783 lb 783 kg
Total Total
Energy Usage Energy Energy
Thousand Btu GigaJoules
Process Energy
Electricity (grid) 74.2 kwh 764 164 kwh 1.78
Electricity (cogeneration) 0.10 kwh 0.68 0.22 kwh 0.0016
Natural gas 6,835 cu ft 7,655 427 cu meters 17.8
Total Process 8,419 19.6
Incoming Transportation Energy
Barge 45.0 ton-miles 145 tonne-km
Diesel 0.036 gal 5.72 0.30 liter 0.013
Residual oil 0.12 gal 20.6 1.00 liter 0.048
Pipeline-petroleum products 18.0 ton-miles 57.8 tonne-km
Electricity 0.39 kwh 4.01 0.86 kwh 0.0093
Total Transportation 30.3 0.070
Environmental Emissions
Atmospheric Emissions
Carbon Monoxide 0.27 lb 0.27 kg
Carbon Dioxide 261 lb 261 kg
NM Hydrocarbons 0.010 lb (1) 0.010 kg
Nitrogen Oxides 0.10 lb (1) 0.10 kg
Particulates (unknown) 0.010 lb (1) 0.010 kg
Sulfur Oxides 1.0E-04 lb (1) 1.0E-04 kg
VOC 0.0093 lb 0.0093 kg
Solid Wastes
Landfilled 1.61 lb 1.61 kg
Burned 0.44 lb 0.44 kg
Waterborne Wastes
Ethylbenzene 0.0010 lb (1) 0.0010 kg
Styrene 0.0010 lb (1) 0.0010 kg
Suspended Solids 0.010 lb (1) 0.010 kg
(1) This emission was reported by fewer than three companies. To indicate known emissions
while protecting the confidentiality of individual company responses, the emission is reported
only by order of magnitude.
References: A-61 through A-63
Source: Franklin Associates, A Division of ERG
English units (Basis: 1,000 lb) SI units (Basis: 1,000 kg)

CLIENT\EPS-IA\KC162652
12.28.16 4004.00.002 46
PENTANE PRODUCTION
Pentane is used in plastics as a blowing agent or plasticizer or as an additive in fuels. There
are a number of blowing agents available to the foam industry for the production of foam
polystyrene products. A partial list of blowing agents includes isopentane, n-pentane,
isobutene, n-butane, and hydrochlorofluorocarbons. Other materials such as carbon
dioxide may also be used in part to reduce the required quantity of blowing agent. N-
pentane is the blowing agent used in this analysis.
N-pentane can be produced during the refining of crude oil or processing of natural
gas; in this study it is assumed that it is produced using a 60:40 mix of natural gas to
petroleum (Reference A-56). No specific process data for pentane is available.
EXPANDED POLYSTYRENE RESIN PRODUCTION
Styrene monomer is polymerized to polystyrene by the process of suspension
polymerization. Suspension polymerization utilizes an aqueous system with the monomer
in a dispersed phase which results in a dispersed solid phase polymer. This dispersion is
maintained through the use of agitation and water soluble stabilizers. The product from
suspension polymerization is a bead polymer impregnated with a blowing agent. A flame
retardant is generally added to the EPS resin production.
The polymerization data used in this analysis is for a batch suspension polymerization and
was obtained directly from EPS resin manufacturers. The average energy and emissions for
the production of 1,000 pounds and 1,000 kilograms of expanded polystyrene resin by
suspension process are shown in Table 20. The 2015 data were collected from direct
measurements, purchasing/utility records, calculations from equipment specifications, and
engineering estimates. Off-spec resin was produced as a coproduct streams during this
process. A mass basis was used to partition the credit for this coproduct.
Due to the use of cogeneration electricity by less than the three EPS resin plants, the
cogeneration electricity has been included with the electricity produced from the average
US grid for the purposes of confidentiality. Likewise, landfill gas is used by less than the
three EPS resin plants and so to keep the amount confidential has been included in the
natural gas amount.
A straight average was calculated using the EPS resin production data collected from three
leading producers in North America—one from Canada, Mexico, and the United States. All
companies provided data for the year 2015. As of 2015 there were 8 EPS producers and 10
EPS plants in North America. The captured production amount is approximately 20 percent
of the available capacity for all expanded polystyrene production in North America.
(Reference A-66). While data was collected from a small sample of plants, the EPS resin
producers who provided data for this module verified that the characteristics of their
plants are representative of North American EPS resin production. The average dataset was
reviewed and accepted by the data providers.

CLIENT\EPS-IA\KC162652
12.28.16 4004.00.002 47
Table 20. Data for the Production of Expanded Polystyrene (EPS) Resin
Material Inputs
Styrene 944 lb 944 kg
Pentane 68.3 lb 68.3 kg
Flame Retardant 4.49 lb 4.49 kg
Nitrogen 29.4 lb 29.4 kg
Water Consumption 99 gal 829 liter
Total Total
Energy Usage Energy Energy
Thousand Btu GigaJoules
Process Energy
Electricity from Grid and Cogen 91.7 kwh 897 202 kwh 2.09
Natural Gas / Landfill Gas 1,228 cu ft 1,253 76.6 cu meters 2.92
Total Process 2,150 5.00
Transportation Energy
Combination truck 9.51 ton-miles 30.6 tonne-km
Diesel 0.10 gal 15.9 0.83 liter 0.037
Rail 503 ton-miles 1,619 tonne-km
Diesel 1.25 gal 198 10.41 liter 1653
Barge 227 ton-miles 730 tonne-km
Diesel 0.18 gal 28.8 1.52 liter 240.6
Residual oil 0.60 gal 104 5.04 liter 865
Pipeline-petroleum products 0.056 ton-miles 0.18 tonne-km
Electricity 0.0012 kwh 0.013 0.0027 kwh 2.9E-05
Total Transportation 346 2,758
Environmental Emissions
Atmospheric Emissions
Pentane 5.29 lb 5.29 kg
Styrene 0.13 lb 0.13 kg
Particulates 0.087 lb 0.087 kg
Carbon Dioxide 10.0 lb (1) 10.0 kg
Volitile Organic Compounds (VOC's) 0.01 lb (1) 0.01 kg
Solid Wastes
Non-Hazardous--Landfill 1.00 lb (1) 1.00 kg
Non-Hazardous--Sold for Recycling/Reuse 0.90 lb 0.90 kg
1.00 lb (1) 1.00 kg
Hazardous--Waste to Energy 0.01 lb (1) 0.01 kg
Hazardous - Landfilled 0.01 lb (1) 0.01 kg
Hazardous - Incinerated 0.10 lb (1) 0.10 kg
Waterborne Wastes
BOD 0.01 lb (1) 0.01 kg
COD 0.1 lb (1) 0.1 kg
Suspended Solids 0.01 lb (1) 0.01 kg
Phosphates 0.001 lb (1) 0.001 kg
(1)
References: A-63
Source: Franklin Associates, A Division of ERG
Non-Hazardous--Incinerated
This emission was reported by fewer than three companies. To indicate known emissions while protecting the
confidentiality of individual company responses, the emission is reported only by order of magnitude.
English units (Basis: 1,000 lb) SI units (Basis: 1,000 kg)

CLIENT\EPS-IA\KC162652
12.28.16 4004.00.002 48
REFERENCES
A-1 American Chemistry Council article. Searched October 2016.
https://www.americanchemistry.com/jobs/economicstatistics/plastics-
statistics/year-in-review.pdf
A-2. Overview of Exploration and Production Waste Volumes and Waste
Management Practices in the United States. Based on API Survey of Onshore and
Coastal Exploration and Production Operations for 1995 and API Survey of Natural
Gas Processing Plants for 1995. Prepared by ICF Consulting for American Petroleum
Institute. May 2002.
A-3. Personal communication between Franklin Associates, Ltd. and L. Gibson. U.S.
Environmental Protection Agency. NPDES Permits Branch. Dallas, Texas.
A-4. Data Summary of Offshore Drilling Waste Disposal Practices. Prepared for U.S.
EPA Engineering and Analysis Division and U.S. Department of Energy Office of
Fossil Energy by John Veil, Argonne National Laboratory. November 1998.
A-5. Energy Information Administration. Petroleum Supply Annual 1993. Volume 1.
June, 1994.
A-6. Environmental Benefits of Advanced Oil and Gas Exploration and Production
Technology. U.S. Department of Energy: Office of Fossil Energy. 1998.
A-7. Development Document for Final Effluent Limitations Guidelines and Standards for
the Coastal Subcategory of the Oil and Gas Extraction Point Source Category, EPA
821-R-96-023, page VII-12
A-8. A White Paper Describing Produced Water from Production of Crude Oil,
Natural Gas, and Coal Bed Methane. Prepared for U.S. Department of Energy
National Energy Technology Laboratory under Contract W-31-109-Eng-38 by
Argonne National Laboratory. January 2004.
A-9. Inventory of U.S. Greenhouse Gas Emissions and Sinks: 1990-2000, U.S.
Environmental Protection Agency, Office of Atmospheric Programs, EPA 430-R-02-
003, April 2002.
A-10. Energy Information Administration. Petroleum Supply Annual 2001. Volume 2.
A-11. World Ports Distances (www.distances.com). Intership Ltd.
A-12. 1997 Census of Mineral Industries. Crude Petroleum & Natural Gas Extraction.
Energy Information Administration. EC97N-2111A.
A-13. Oil and Gas Journal 1998 Databook.

CLIENT\EPS-IA\KC162652
12.28.16 4004.00.002 49
A-14. Profile of the Oil and Gas Extraction Industry, October 2000,
EPA/310-R-99-006.
A-15. Life Cycle Inventory of Biodiesel and Petroleum Diesel, NREL/SR-580-24094.
A-16. Energy Information Administration. Petroleum Supply Annual 2001. Volume 1.
A-17. Alaska pipeline website: [http://www.alyeska-pipe.com/pipelinefacts.html]
A-18. Distances are from http://www.indo.com/cgi-bin/dist and are "as the crow flies".
A-19. Annual Energy Review 2001. Table 5.8: Refinery Input and Output. Energy
Information Administration.
A-20. Petroleum Refining, Pollution Prevention and Abatement Handbook. WORLD
BANK GROUP. 1998.
A-21. Inventory of U.S. Greenhouse Gas Emissions and Sinks: 1990-2009, U.S.
Environmental Protection Agency, Office of Atmospheric Programs. Tables 3-42 and
3-44 (emissions from petroleum systems).
A-22. Industrial Resource Recovery Practices: Petroleum Refineries and Related
Industries. Prepared for U.S. Environmental Protection Agency, Office of Solid Waste,
Washington, D.C. by Franklin Associates, Ltd., January 1983.
A-23. Calculation by Franklin Associates based on annual energy consumption data
provided by U.S. Department of Energy (Energy and Environmental Profile of the
U.S. Petroleum Industry. U.S. Department of Energy Office of Industrial
Technologies. December 1998.)
A-24. Compilation of Air Pollutant Emission Factors, Volume I: Stationary Point and
Area Sources. Fifth Edition. U.S. Environmental Protection Agency. July 1995.
A-25. Technical Support Document for the 2004 Effluent Guidelines Program Plan. EPA-
821-R-04-014. August 2004. Section 7 Petroleum Refining. Table 7-28 reporting
Toxic Release Inventory emissions for 2000.
A-26. Energy and Environmental Profile of the U.S. Petroleum Refining Industry.
Prepared for U.S. Department of Energy by Energetics Incorporated. November
2007.
A-27. U.S. EPA 2002 National Emissions Inventory booklet, accessed June 2011 at
http://www.epa.gov/ttn/chief/net/2002neibooklet.pdf

CLIENT\EPS-IA\KC162652
12.28.16 4004.00.002 50
A-28. U.S. EPA National Emissions Inventory trends tables, accessed June 2011 at
http://www.epa.gov/ttn/chief/trends/index.html
A-29. Energy and Environmental Profile of the U.S. Petroleum Industry. U.S.
Department of Energy Office of Industrial Technologies. December 1998.
A-30. Estimating Externalities of Oil Fuel Cycles. Oak Ridge National Laboratory and
Resources for the Future. August 1996.
A-31. Association of Oil Pipelines Annual Report 2000.
A-32. ASTM-IP Petroleum Measurement Tables.
A-33. AP 42, Chapter 5, Petroleum Refining, Natural Gas Processing. U.S. Environmental
Protection Agency, January 1995.
A-34. 1997 Census of Mineral Industries. Crude Petroleum & Natural Gas Extraction.
Energy Information Administration. EC97N-2111A. 1997.
A-35. USGS 2008 Minerals Yearbook. U.S. Department of the Interior, U.S. Geological
Survey. Sulfur chapter. Accessed June 2011 at
http://minerals.usgs.gov/minerals/pubs/commodity/sulfur/myb1-2008-sulfu.pdf
A-36. SO2 Emissions in Natural Gas Production Industry - Background Information
for Proposed Standards. EPA-450/3-82-023a. November 1983. Table G-1 (based
on results of a gas plant survey by the American Petroleum Institute).
A-37. EPA Project Summary: Glycol Dehydrator BTEX and VOC Emission Testing Results
at Two Units in Texas and Louisiana, Rueter, Reif, and Myers. EPA/600/SR-95/046.
May 1995.
A-38 Associated Wastes Report: Dehydration and Sweetening Wastes. US EPA.
January 2000. Section 2.3.
A-39. Tobin, J. Natural Gas Transportation - Infrastructure Issues and Operational
Trends. Natural Gas Division, EIA, October, 2001.
A-40. The U.S. Petroleum and Natural Gas Industry (Table 2), Energy Information
Administration, 1999.
A-41. Energy Information Administration: Natural Gas Division. October 2001.
A-42. Energy Information Administration, Natural Gas Annual 2000.
A-43. Hydrocarbon Processing. Cost-effectively Reduce Emissions for Natural Gas
Processing. McMillan and Henderson. October 1999.

CLIENT\EPS-IA\KC162652
12.28.16 4004.00.002 51
A-44. Rand McNally Illustrated Atlas of the World. 1992. (Map of U.S.)
A-45. Chemical Profile: Ethylene. Chemical Market Reporter. September 29, 2003. Page 27.
A-46. Information and data collected from ACC member and non-member companies
producing olefins. 2004-2005.
A-47. Information and data collected from ACC member and non-member companies
producing HDPE. 2004-2005.
A-48. Information and data collected from ACC member and non-member companies
producing LDPE. 2004-2005.
A-49. Information and data collected from ACC member and non-member companies
producing LLDPE. 2004-2005.
A-50. Information and data collected from ACC member and non-member companies
producing PP. 2004-2005.
A-51. Kent, James A, ed. Riegel’s Handbook of Industrial Chemistry. Tenth Edition.
Kluwar Academic/Plenum Publishers, New York, 2003.
A-52. Seigel, Jason. “High Benzene Tags will Affect Downstream Products’ Costs.” From the
website www.purchasing.com/article/CA436076.html July 15, 2004.
A-53. SRI, 2004 as referenced in Toxicological Profile for Benzene. 4. Production,
Import/Export, Use and Disposal. 2007. From the website:
www.atsdr.cdc.gov/toxprofiles/tp3.pdf.
A-54. Distances calculated using the websites:
http://www.indo.com/distance/ and http://www.mapquest.com/.
A-55. Data compiled by Franklin Associates, Ltd., based on contact with confidential
catalytic reforming sources. 1992.
A-56. Franklin Associates estimate.
A-57. Information and data collected from ACC member and non-member companies
producing benzene. 2004-2005.
A-58. Chemical Profile: Benzene. Chemical Market Reporter. November 11, 2002. Page
38.
A-59. Hydrocarbon Processing. “Petrochemical Processes 1997.” March 1997.

CLIENT\EPS-IA\KC162652
12.28.16 4004.00.002 52
A-60. Chemical profile information taken from the website:
http://www.the-innovation-group.com/welcome.htm.
A-61. Data compiled by Franklin Associates, Ltd., based on contact with confidential
ethylbenzene/styrene sources. 1993.
A-62. Information and data collected from ACC member and non-member companies
producing ethylbenzene/styrene. 2004-2005.
A-63. Information and data collected from EPS IA member companies producing EPS
resin. 2016.
A-64 Chemical Profile: Ethylene. Chemical Market Reporter. September 29, 2003. Page
27.
A-65 Information and data collected from ACC member and non-member companies
producing olefins. 2004-2005.
A-66 Review of EPS resin producer websites in North America. August, 2016.

CLIENT\EPS-IA\KC162652
12.28.16 4004.00.002 53
Table 21. Total System Process Data of Expanded Polystyrene (EPS) Resin
Substance Compartment Unit 1,000 lb 1,000 kg
Energy, from biomass Raw MJ 18.0 39.6
Energy, from hydro power Raw MJ 84.7 187
Energy, from purified and compressed
landfill gas Raw MJ 860 1,897
Energy, geothermal Raw MJ 5.00 11.0
Energy, kinetic (in wind), converted Raw MJ 30.8 67.9
Energy, recovered Raw MJ 4.29 9.46
Energy, solar, converted Raw MJ 0.40 0.88
Gas, natural, 48.68 MJ per kg, in ground
(EMR) Raw kg 197 434
Gas, natural/m3 Raw m3 390 859
Oil, crude Raw kg 62.9 139
Oil, crude, 43.66 MJ per kg, in ground
(EMR) Raw kg 323 713
Unprocessed bituminous coal, in ground Raw kg 83.2 183
Unprocessed lignite Raw kg 9.90 21.8
Uranium oxide, 332 GJ per kg, in ore Raw kg 0.0025 0.0055
Water, consumption Raw m3 1.81 3.99
Water, consumptive use, unspecified
origin/m3 Raw m3 3.14 6.92
Water, cooling, unspecified natural
origin/m3 Raw m3 0.037 0.081
2-Chloroacetophenone Air kg 2.7E-10 5.9E-10
5-methyl Chrysene Air kg 8.8E-10 1.9E-09
Acenaphthene Air kg 2.0E-08 4.5E-08
Acenaphthylene Air kg 1.0E-08 2.2E-08
Acetaldehyde Air kg 2.2E-05 4.9E-05
Acetophenone Air kg 5.7E-10 1.3E-09
Aldehydes, unspecified Air kg 5.6E-04 0.0012
Ammonia Air kg 0.0031 0.0069
Ammonium chloride Air kg 1.3E-04 2.9E-04
Anthracene Air kg 8.4E-09 1.8E-08
Antimony Air kg 1.4E-06 3.2E-06
Arsenic Air kg 2.1E-05 4.7E-05
Benzene Air kg 0.043 0.095
Benzene, chloro- Air kg 8.4E-10 1.8E-09
Benzene, ethyl- Air kg 0.0053 0.012

CLIENT\EPS-IA\KC162652
12.28.16 4004.00.002 54
Substance Compartment Unit 1,000 lb 1,000 kg
Benzo(b,j,k)fluoranthene Air kg 4.4E-09 9.7E-09
Benzo(g,h,i)perylene Air kg 1.1E-09 2.4E-09
Benzyl chloride Air kg 2.7E-08 5.9E-08
Beryllium Air kg 1.1E-06 2.4E-06
Biphenyl Air kg 6.8E-08 1.5E-07
Bromoform Air kg 1.5E-09 3.3E-09
Butadiene Air kg 1.1E-06 2.5E-06
Cadmium Air kg 9.3E-06 2.0E-05
Carbon dioxide, biogenic Air kg 65.6 145
Carbon dioxide, fossil Air kg 1,227 2,705
Carbon disulfide Air kg 5.0E-09 1.1E-08
Carbon monoxide Air kg 0.52 1.15
Carbon monoxide, biogenic Air kg 0.027 0.060
Carbon monoxide, fossil Air kg 0.65 1.44
CFCs Air kg 1.5E-09 3.3E-09
Chlorine Air kg 5.8E-05 1.3E-04
Chloroform Air kg 2.2E-09 5.0E-09
Chromium Air kg 2.1E-05 4.6E-05
Chromium VI Air kg 3.2E-06 7.0E-06
Chrysene Air kg 4.0E-09 8.8E-09
Cobalt Air kg 2.1E-05 4.6E-05
Copper Air kg 1.9E-07 4.3E-07
Cumene Air kg 2.0E-10 4.5E-10
Cyanide Air kg 9.5E-08 2.1E-07
Dimethyl ether Air kg 3.6E-05 7.9E-05
Dinitrogen monoxide Air kg 0.019 0.041
Dioxin, 2,3,7,8 Tetrachlorodibenzo-p- Air kg 7.1E-11 1.6E-10
Ethane, 1,1,1-trichloro-, HCFC-140 Air kg 7.6E-10 1.7E-09
Ethane, 1,2-dibromo- Air kg 1.5E-06 3.4E-06
Ethane, 1,2-dichloro- Air kg 1.5E-09 3.4E-09
Ethane, chloro- Air kg 1.6E-09 3.5E-09
Ethene, tetrachloro- Air kg 1.9E-06 4.2E-06
Fluoranthene Air kg 2.8E-08 6.3E-08
Fluorene Air kg 3.6E-08 8.0E-08
Fluoride Air kg 4.6E-06 1.0E-05
Fluorine Air kg 1.1E-06 2.4E-06
Formaldehyde Air kg 5.5E-04 0.0012
Furan Air kg 1.7E-10 3.8E-10
HCFC/HFC (unspecified) Air kg 9.0E-08 2.0E-07

CLIENT\EPS-IA\KC162652
12.28.16 4004.00.002 55
Substance Compartment Unit 1,000 lb 1,000 kg
Hydrazine, methyl- Air kg 6.5E-09 1.4E-08
Hydrocarbons, unspecified Air kg 7.6E-04 0.0017
Hydrogen Air kg 0.0011 0.0024
Hydrogen chloride Air kg 0.050 0.11
Hydrogen fluoride Air kg 0.0060 0.013
Hydrogen sulfide Air kg 7.8E-05 1.7E-04
Indeno(1,2,3-cd)pyrene Air kg 2.4E-09 5.4E-09
Isophorone Air kg 2.2E-08 4.9E-08
Kerosene Air kg 6.3E-05 1.4E-04
Lead Air kg 2.4E-05 5.3E-05
Magnesium Air kg 4.4E-04 9.7E-04
Manganese Air kg 3.0E-05 6.6E-05
Mercaptans, unspecified Air kg 7.9E-06 1.7E-05
Mercury Air kg 5.4E-06 1.2E-05
Methane Air kg 0.61 1.34
Methane, biogenic Air kg 0.50 1.10
Methane, bromo-, Halon 1001 Air kg 6.1E-09 1.3E-08
Methane, chlorodifluoro-, HCFC-22 Air kg 2.4E-07 5.2E-07
Methane, chlorotrifluoro-, CFC-13 Air kg 7.8E-06 1.7E-05
Methane, dichloro-, HCC-30 Air kg 2.6E-05 5.7E-05
Methane, fossil Air kg 7.87 17.4
Methane, monochloro-, R-40 Air kg 2.0E-08 4.5E-08
Methane, tetrachloro-, CFC-10 Air kg 5.9E-07 1.3E-06
Methanol Air kg 6.2E-06 1.4E-05
Methyl ethyl ketone Air kg 1.5E-08 3.3E-08
Methyl methacrylate Air kg 7.6E-10 1.7E-09
Naphthalene Air kg 6.9E-06 1.5E-05
Nickel Air kg 2.5E-04 5.6E-04
Nitrogen oxides Air kg 2.76 6.08
Nitrous oxide Air kg 3.9E-04 8.6E-04
NMVOC, non-methane volatile organic
compounds, unspecified origin Air kg 0.31 0.68
Organic acids Air kg 4.8E-07 1.1E-06
Organic substances, unspecified Air kg 8.6E-04 0.0019
PAH, polycyclic aromatic hydrocarbons Air kg 4.9E-06 1.1E-05
Particulates Air kg 0.039 0.087
Particulates, < 10 um Air kg 0.14 0.30
Particulates, < 2.5 um Air kg 0.11 0.25
Particulates, > 10 um Air kg 0.040 0.088

CLIENT\EPS-IA\KC162652
12.28.16 4004.00.002 56
Substance Compartment Unit 1,000 lb 1,000 kg
Pentane Air kg 2.40 5.29
Phenanthrene Air kg 1.1E-07 2.4E-07
Phenol Air kg 6.1E-10 1.3E-09
Phenols, unspecified Air kg 1.1E-05 2.5E-05
Phthalate, dioctyl- Air kg 2.8E-09 6.1E-09
Polycyclic organic matter, unspecified Air kg 2.0E-05 4.4E-05
Propanal Air kg 1.4E-08 3.2E-08
Propene Air kg 7.5E-05 1.7E-04
Pyrene Air kg 1.3E-08 2.9E-08
Radioactive species, unspecified Air Bq 2,262,374 4,987,681
Radionuclides (Including Radon) Air kg 0.0035 0.0078
Selenium Air kg 5.4E-05 1.2E-04
Styrene Air kg 0.059 0.13
Sulfur dioxide Air kg 2.10 4.63
Sulfur oxides Air kg 1.34 2.96
Sulfuric acid, dimethyl ester Air kg 1.8E-09 4.0E-09
t-Butyl methyl ether Air kg 1.3E-09 2.9E-09
Toluene Air kg 0.067 0.15
Toluene, 2,4-dinitro- Air kg 1.1E-11 2.4E-11
Trichloroethane Air kg 1.2E-09 2.7E-09
Vinyl acetate Air kg 2.9E-10 6.4E-10
VOC, volatile organic compounds Air kg 0.46 1.02
Xylene Air kg 0.039 0.085
Zinc Air kg 1.3E-07 2.9E-07
1-Methylfluorene Water kg 1.5E-08 3.3E-08
2-Hexanone Water kg 2.2E-06 4.9E-06
2-Methylnaphthalene Water kg 2.1E-06 4.5E-06
4-Methyl-2-pentanone Water kg 9.8E-07 2.2E-06
Acetone Water kg 2.3E-06 5.2E-06
Acidity, unspecified Water kg 3.7E-07 8.2E-07
Alkalinity Water kg 0.010 0.023
Alkalinity, unspecified Water kg 3.0E-04 6.5E-04
Alkylated benzenes Water kg 3.1E-06 6.8E-06
Alkylated fluorenes Water kg 1.8E-07 3.9E-07
Alkylated naphthalenes Water kg 5.0E-08 1.1E-07
Alkylated phenanthrenes Water kg 2.1E-08 4.6E-08
Aluminium Water kg 0.025 0.056
Ammonia Water kg 0.0096 0.021
Ammonium, ion Water kg 2.8E-05 6.2E-05

CLIENT\EPS-IA\KC162652
12.28.16 4004.00.002 57
Substance Compartment Unit 1,000 lb 1,000 kg
Barium Water kg 0.33 0.74
Benzene Water kg 4.5E-04 9.8E-04
Benzene, 1-methyl-4-(1-methylethyl)- Water kg 1.0E-08 2.3E-08
Benzene, ethyl- Water kg 4.6E-04 0.0010
Benzene, pentamethyl- Water kg 7.7E-09 1.7E-08
Benzenes, alkylated, unspecified Water kg 3.8E-05 8.4E-05
Benzoic acid Water kg 3.4E-04 7.5E-04
Beryllium Water kg 4.1E-06 9.0E-06
Biphenyl Water kg 2.5E-06 5.5E-06
BOD5, Biological Oxygen Demand Water kg 0.22 0.48
Boron Water kg 0.0010 0.0023
Bromide Water kg 0.054 0.12
Cadmium Water kg 1.1E-05 2.5E-05
Calcium Water kg 0.85 1.88
Chloride Water kg 10.0 22.1
Chromium Water kg 6.6E-04 0.0015
Chromium VI Water kg 4.6E-07 1.0E-06
Cobalt Water kg 7.4E-06 1.6E-05
COD, Chemical Oxygen Demand Water kg 0.56 1.23
Copper Water kg 1.1E-04 2.4E-04
Cyanide Water kg 1.1E-06 2.4E-06
Decane Water kg 5.9E-06 1.3E-05
Dibenzofuran Water kg 4.4E-08 9.7E-08
Dibenzothiophene Water kg 4.1E-08 9.0E-08
Docosane Water kg 1.1E-07 2.4E-07
Dodecane Water kg 1.1E-05 2.5E-05
Eicosane Water kg 3.1E-06 6.8E-06
Fluorene Water kg 1.0E-06 2.3E-06
Fluorene, 1-methyl- Water kg 1.2E-08 2.6E-08
Fluorenes, alkylated, unspecified Water kg 2.2E-06 4.9E-06
Fluoride Water kg 4.6E-04 0.0010
Fluorine Water kg 3.7E-09 8.2E-09
Hardness Water kg 1.32 2.92
Hexadecane Water kg 1.2E-05 2.7E-05
Hexanoic acid Water kg 7.0E-05 1.6E-04
Hydrocarbons, unspecified Water kg 1.0E-04 2.2E-04
Iron Water kg 0.050 0.11
Lead Water kg 1.6E-04 3.6E-04
Lead-210/kg Water kg 2.1E-14 4.7E-14

CLIENT\EPS-IA\KC162652
12.28.16 4004.00.002 58
Substance Compartment Unit 1,000 lb 1,000 kg
m-Xylene Water kg 5.8E-06 1.3E-05
Magnesium Water kg 0.17 0.37
Manganese Water kg 9.9E-04 0.0022
Mercury Water kg 3.3E-07 7.2E-07
Metallic ions, unspecified Water kg 0.0010 0.0022
Methane, monochloro-, R-40 Water kg 9.4E-09 2.1E-08
Methyl ethyl ketone Water kg 1.9E-08 4.1E-08
Molybdenum Water kg 7.7E-06 1.7E-05
n-Decane Water kg 3.8E-06 8.3E-06
n-Docosane Water kg 1.4E-07 3.1E-07
n-Dodecane Water kg 7.2E-06 1.6E-05
n-Eicosane Water kg 2.0E-06 4.4E-06
n-Hexacosane Water kg 1.6E-07 3.4E-07
n-Hexadecane Water kg 7.8E-06 1.7E-05
n-Octadecane Water kg 1.9E-06 4.3E-06
n-Tetradecane Water kg 3.1E-06 6.9E-06
Naphthalene Water kg 6.1E-06 1.3E-05
Naphthalene, 2-methyl- Water kg 3.1E-06 6.9E-06
Naphthalenes, alkylated, unspecified Water kg 6.3E-07 1.4E-06
Nickel Water kg 7.5E-05 1.7E-04
Nitrate Water kg 0.0010 0.0022
Nitrogen Water kg 0.0010 0.0022
Nitrogen, total Water kg 7.0E-05 1.5E-04
o-Cresol Water kg 9.6E-06 2.1E-05
o-Xylene Water kg 2.2E-06 4.9E-06
Octadecane Water kg 3.1E-06 6.7E-06
Oils, unspecified Water kg 0.017 0.037
p-Cresol Water kg 1.0E-05 2.3E-05
p-Cymene Water kg 1.3E-08 2.9E-08
p-Xylene Water kg 2.2E-06 4.8E-06
Pentamethylbenzene Water kg 9.7E-09 2.1E-08
Phenanthrene Water kg 1.9E-07 4.1E-07
Phenanthrenes, alkylated, unspecified Water kg 2.6E-07 5.7E-07
Phenol Water kg 3.5E-04 7.7E-04
Phenol, 2,4-dimethyl- Water kg 9.4E-06 2.1E-05
Phenols, unspecified Water kg 9.5E-05 2.1E-04
Phosphate Water kg 0.0012 0.0027
Radioactive species, Nuclides,
unspecified Water Bq 4,092 9,021

CLIENT\EPS-IA\KC162652
12.28.16 4004.00.002 59
Substance Compartment Unit 1,000 lb 1,000 kg
Radium 226 Water kg 4.7E-12 1.0E-11
Selenium Water kg 1.3E-05 3.0E-05
Silver Water kg 5.4E-04 0.0012
Sodium Water kg 2.58 5.68
Strontium Water kg 0.018 0.040
Styrene Water kg 4.3E-04 9.4E-04
Sulfate Water kg 0.076 0.17
Sulfide Water kg 4.0E-04 8.9E-04
Sulfur Water kg 8.5E-04 0.0019
Surfactants Water kg 2.3E-04 5.0E-04
Suspended solids, unspecified Water kg 13.6 30.0
Tetradecane Water kg 4.8E-06 1.1E-05
Thallium Water kg 3.2E-06 7.1E-06
Tin Water kg 6.6E-05 1.5E-04
Titanium Water kg 2.4E-04 5.2E-04
TOC, Total Organic Carbon Water kg 2.5E-04 5.5E-04
Toluene Water kg 4.4E-04 9.6E-04
Total biphenyls Water kg 2.0E-07 4.4E-07
Vanadium Water kg 2.8E-05 6.2E-05
Xylene Water kg 2.1E-04 4.5E-04
Yttrium Water kg 2.3E-06 5.0E-06
Zinc Water kg 6.1E-04 0.0013
Hazardous waste to incineration Waste kg 0.12 0.26
Hazardous waste to landfill Waste kg 0.017 0.038
Hazardous waste to WTE Waste kg 0.0076 0.017
Solid waste fuel Waste kg 8.42 18.6
Solid waste process, to incineration Waste kg 0.19 0.43
Solid waste process, to landfill Waste kg 13.7 30.3
Solid Waste Sold for Recycling or Reuse Waste kg 0.41 0.90
Solid waste, fuel Waste kg 30.8 67.9
Solid waste, process to incineration Waste kg 1.37 3.03
Solid waste, process to landfill Waste kg 6.60 14.5
Solid waste, process to waste-to-energy
incineration Waste kg 8.6E-04 0.0019