degradation mechanism of expanded polystyrene (eps) foam
TRANSCRIPT

University of Tennessee, Knoxville University of Tennessee, Knoxville
TRACE: Tennessee Research and Creative TRACE: Tennessee Research and Creative
Exchange Exchange
Doctoral Dissertations Graduate School
12-2007
Degradation Mechanism of Expanded Polystyrene (EPS) Foam in Degradation Mechanism of Expanded Polystyrene (EPS) Foam in
Lost Foam Casting, PIPS Approach for Synthesis and Novel Lost Foam Casting, PIPS Approach for Synthesis and Novel
Expansion Techniques for Cellular Foam Expansion Techniques for Cellular Foam
Indraneel Sen University of Tennessee - Knoxville
Follow this and additional works at: https://trace.tennessee.edu/utk_graddiss
Part of the Polymer and Organic Materials Commons
Recommended Citation Recommended Citation Sen, Indraneel, "Degradation Mechanism of Expanded Polystyrene (EPS) Foam in Lost Foam Casting, PIPS Approach for Synthesis and Novel Expansion Techniques for Cellular Foam. " PhD diss., University of Tennessee, 2007. https://trace.tennessee.edu/utk_graddiss/299
This Dissertation is brought to you for free and open access by the Graduate School at TRACE: Tennessee Research and Creative Exchange. It has been accepted for inclusion in Doctoral Dissertations by an authorized administrator of TRACE: Tennessee Research and Creative Exchange. For more information, please contact [email protected].
To the Graduate Council:
I am submitting herewith a dissertation written by Indraneel Sen entitled "Degradation
Mechanism of Expanded Polystyrene (EPS) Foam in Lost Foam Casting, PIPS Approach for
Synthesis and Novel Expansion Techniques for Cellular Foam." I have examined the final
electronic copy of this dissertation for form and content and recommend that it be accepted in
partial fulfillment of the requirements for the degree of Doctor of Philosophy, with a major in
Polymer Engineering.
Roberto Benson, Dayakar Penumadu, Major Professor
We have read this dissertation and recommend its acceptance:
Joseph E. Spruiell, Kevin M.Kit, Bin Hu
Accepted for the Council:
Carolyn R. Hodges
Vice Provost and Dean of the Graduate School
(Original signatures are on file with official student records.)

To the Graduate Council:
I am submitting herewith a dissertation written by Indraneel Sen entitled “Degradation Mechanism of Expanded Polystyrene (EPS) Foam in Lost Foam Casting, PIPS Approach for Synthesis and Novel Expansion Techniques for Cellular Foam.” I have examined the final electronic copy of this dissertation for form and content and recommend that it be accepted in partial fulfillment of the requirements for the degree of doctor of Philosophy, with a major in Polymer Engineering. Roberto Benson, Major Professor Dayakar Penumadu, Co-advisor We have read this dissertation And recommend its acceptance
Joseph E. Spruiell Kevin M.Kit Bin Hu Accepted for the Council: Carolyn R. Hodges, Vice Provost and
Dean of the Graduate School
(Original signatures are on file with official student records.)

Degradation Mechanism of Expanded Polystyrene (EPS) Foam in
Lost Foam Casting, PIPS Approach for Synthesis and Novel Expansion Techniques for Cellular Foam
A Dissertation Presented for the
Doctor of Philosophy Degree
The University of Tennessee, Knoxville
Indraneel Sen December 2007

ii
Acknowledgements I am grateful to my father who provided me with education and my mother
who gave me life. Their unconditional love and encouragement has been
the main support for my research and higher education. I am grateful to
Mother Nature for showing me the difference between education and
wisdom. I acknowledge the immense patience of my advisors Dr.Roberto
Benson and Dr.Dayakar Penumadu in guiding me towards the completion
of my educational program and supporting me through difficult situations
in academics and in personal life. I am indebted to Dr.Penumadu for
showing me the meaning of engineering ethics by being an example and to
Dr.Benson for taking a teacher student relationship to new heights of
warmth in his best possible way. I am also grateful to the entire polymer
engineering faculty at the University of Tennessee and specially my
committee members, Dr.Joe Spruiell , Dr.Kevin Kit and Dr.Bin Hu for
their support and guidance. Dr.Rao Arimilli , Dr.Majid Keyhani from
Department of Mechanical engineering and Dr. David Keffer from
Chemical engineering helped in my work with their sincere guidance. I
am also grateful for the warmth and support I received from the
departmental staff and my colleagues. Special mentions are Mike Neal,
Greg Jones, Doug Fielden, Ken Thomas, Frank Holloway, Sandy, Carla,
Chris, Robyn and Tommy Washington.
iii
Abstract
Lost Foam Casting (LFC) is a metal casting technology that facilitates
fabrication of near-net shape metal castings using expanded polystyrene
(EPS) foam patterns that are coated with refractory slurry and is effective
for producing aluminum or iron castings of complicated geometry.
However, the LFC process can produce considerable amount of scrap due
to casting defects. Removing the EPS thermal decomposition products
through the ceramic coating ahead of the advancing metal front during the
liquid metal pour is a key factor in obtaining a defect free casting.
Developing a fundamental understanding of foam degradation mechanism
is essential in improving LFC process.
Modeling of the LFC process till date has completely neglected the effect
of styrene on the overall thermal degradation of EPS foam. The
dissolution effect of styrene is investigated by presenting the
thermodynamic principles of polymer solution theory along with
experiments to verify its impact on polystyrene degradation. By
subjecting EPS Foam samples directly either to thermal radiation or to
styrene vapor, it is demonstrated that styrene’s solubility of polystyrene
significantly alters the degradation mechanism of EPS foam in LFC
process and thus can control the metal fill process leading to reduction of
defects in castings.

iv
LFC process uses expanded polystyrene foam patterns in which isomers of
pentane are used as blowing agents to achieve the expansion. In order to
expand polystyrene, steam is used as a heat source and the expansion
process takes place via conduction of heat from the surface of unexpanded
polystyrene beads into the bulk. Pentane isomers are volatile organic
compounds and green house gases that are either liberated directly into
the atmosphere or combusted using expensive setup. The environmental
impact of the current process using pentane as an expansion agent has
been considered and a new method for manufacturing of EPS foam has
been developed with benign expansion agent. Laboratory experiments are
demonstrated where PS pellets are successfully expanded into foam.
Novel heating technology using microwave radiation is proposed and
implemented in order to achieve efficient volumetric heating for the
manufacturing of foam with target density.
v
Table of Contents Chapter 1 Introduction .. . . . . . . . . . . . . . . . . . . . . . . . . . . . . . . . . . . . . . . . . . . . . . . . . . . . . . . . . . . . . . . . . . . . . . . 1
Chapter 2 Background of the Study .. . . . . . . . . . . . . . . . . . . . . . . . . . . . . . . . . . . . . . . . . . . . . . . . . . . . . 6
2.1 Current Method for Synthesis of EPS ... . . . . . . . . . . . . . . . . . . . . . . . . . . . . . . . . . . . . . . . . 7
2.1.1 Synthesis of expandable polystyrene beads .. . . . . . . . . . . . . . . . . . . . . . . . . . . . 7
2.1.2 Pre-expansion of polystyrene beads .. . . . . . . . . . . . . . . . . . . . . . . . . . . . . . . . . . . . . . 9
2.1.3 Molding of pre-expanded beads .. . . . . . . . . . . . . . . . . . . . . . . . . . . . . . . . . . . . . . . . . . 12
2.2 Expansion Agent .. . . . . . . . . . . . . . . . . . . . . . . . . . . . . . . . . . . . . . . . . . . . . . . . . . . . . . . . . . . . . . . . . . . . . 15
2.3 Water Expandable Polystyrene (WEPS) .. . . . . . . . . . . . . . . . . . . . . . . . . . . . . . . . . . . . . 16
2.4 Lost Foam Casting (LFC).. . . . . . . . . . . . . . . . . . . . . . . . . . . . . . . . . . . . . . . . . . . . . . . . . . . . . . . . . 18
2.5 Thermal Degradation of Polystyrene Foam ... . . . . . . . . . . . . . . . . . . . . . . . . . . . . . . 23
2.5.1 Components of degradation products .. . . . . . . . . . . . . . . . . . . . . . . . . . . . . . . . . . . 23
2.6 Use of brominated flame retardants . . . . . . . . . . . . . . . . . . . . . . . . . . . . . . . . . . . . . . . . . . . 26
2.7 Role of refractory coating in LFC ... . . . . . . . . . . . . . . . . . . . . . . . . . . . . . . . . . . . . . . . . . . . 28
Chapter 3 Thermal degradation of EPS foam in LFC: Effect of Styrene . 33
3.1 Introduction .. . . . . . . . . . . . . . . . . . . . . . . . . . . . . . . . . . . . . . . . . . . . . . . . . . . . . . . . . . . . . . . . . . . . . . . . . . . 34
3.2 Theory .. . . . . . . . . . . . . . . . . . . . . . . . . . . . . . . . . . . . . . . . . . . . . . . . . . . . . . . . . . . . . . . . . . . . . . . . . . . . . . . . . . . 39
3.2.1 Comparison by the Hildebrand solubility parameter .. . . . . . . . . . . . . . 39
3.2.2 Behavior of polymer chains in solvents .. . . . . . . . . . . . . . . . . . . . . . . . . . . . . . . 46
3.3 Experimental . . . . . . . . . . . . . . . . . . . . . . . . . . . . . . . . . . . . . . . . . . . . . . . . . . . . . . . . . . . . . . . . . . . . . . . . . . . 48
3.3.1 Exposure to Infrared Radiation .. . . . . . . . . . . . . . . . . . . . . . . . . . . . . . . . . . . . . . . . . . . 49
3.3.2 Exposure to Styrene Vapor .. . . . . . . . . . . . . . . . . . . . . . . . . . . . . . . . . . . . . . . . . . . . . . . . . 50
3.3.3 Partially Filled EPS Foam Pattern .. . . . . . . . . . . . . . . . . . . . . . . . . . . . . . . . . . . . . . . 51
3.3.4 Measurement of Temperature Distribution inside Intact Foam 52
3.4 Results and discussion .. . . . . . . . . . . . . . . . . . . . . . . . . . . . . . . . . . . . . . . . . . . . . . . . . . . . . . . . . . . . . 54
3.4.1 Morphological Changes .. . . . . . . . . . . . . . . . . . . . . . . . . . . . . . . . . . . . . . . . . . . . . . . . . . . . . 54
3.4.2 Changes in glass transition .. . . . . . . . . . . . . . . . . . . . . . . . . . . . . . . . . . . . . . . . . . . . . . . . . 58
3.4.3 Molecular Weight Analysis by Gel Permeation Chromatography
.. . . . . . . . . . . . . . . . . . . . . . . . . . . . . . . . . . . . . . . . . . . . . . . . . . . . . . . . . . . . . . . . . . . . . . . . . . . . . . . . . . . . . . . . . . . . . . . . 58
3.4.4 Temperature Distribution inside intact foam ... . . . . . . . . . . . . . . . . . . . . . . 60

vi
3.5 Conclusions and future recommendations .. . . . . . . . . . . . . . . . . . . . . . . . . . . . . . . . . . 63
Chapter 4 Novel expansion process for polystyrene .. . . . . . . . . . . . . . . . . . . . . . . . . . . . 67
4.1 Introduction .. . . . . . . . . . . . . . . . . . . . . . . . . . . . . . . . . . . . . . . . . . . . . . . . . . . . . . . . . . . . . . . . . . . . . . . . . . . 68
4.1.1 Motivation and Objectives .. . . . . . . . . . . . . . . . . . . . . . . . . . . . . . . . . . . . . . . . . . . . . . . . . 68
4.1.2 Selection of the expansion agent . . . . . . . . . . . . . . . . . . . . . . . . . . . . . . . . . . . . . . . . . . 74
4.2 Background theory: . . . . . . . . . . . . . . . . . . . . . . . . . . . . . . . . . . . . . . . . . . . . . . . . . . . . . . . . . . . . . . . . . . 76
4.2.1 Polymerization Induced Phase Separation (PIPS) .. . . . . . . . . . . . . . . . . 76
4.2.2 Theory of heating by Microwave radiation .. . . . . . . . . . . . . . . . . . . . . . . . . . . 89
4.3 Experimental . . . . . . . . . . . . . . . . . . . . . . . . . . . . . . . . . . . . . . . . . . . . . . . . . . . . . . . . . . . . . . . . . . . . . . . . . 105
4.3.1 Free radical bulk polymerization .. . . . . . . . . . . . . . . . . . . . . . . . . . . . . . . . . . . . . . 105
4.3.2 Determination of phase diagram for PS, 2-butanol system ... . 111
4.3.3 Expansion and molding of novel expandable polystyrene .. . . . 112
4.4 Results and Discussion .. . . . . . . . . . . . . . . . . . . . . . . . . . . . . . . . . . . . . . . . . . . . . . . . . . . . . . . . . . 114
4.4.1 Free radical polymerization .. . . . . . . . . . . . . . . . . . . . . . . . . . . . . . . . . . . . . . . . . . . . . . 114
4.4.2 Determination of Phase Diagram... . . . . . . . . . . . . . . . . . . . . . . . . . . . . . . . . . . . . . 124
4.4.3 Expansion results from microwave experiments .. . . . . . . . . . . . . . . . . 129
4.5 Synthesis and morphological characterization of cellular foam ... 134
4.5.1 Synthesis of expandable PS granules .. . . . . . . . . . . . . . . . . . . . . . . . . . . . . . . . . 134
4.5.2 Morphological characterization of cellular foam using SEM . 136
4.6 Conclusions and future recommendations .. . . . . . . . . . . . . . . . . . . . . . . . . . . . . . . . 138
Vita.. . . . . . . . . . . . . . . . . . . . . . . . . . . . . . . . . . . . . . . . . . . . . . . . . . . . . . . . . . . . . . . . . . . . . . . . . . . . . . . . . . . . . . . . . . . . . . 145
vii
List of Tables Table 2.1 Application for EPS foam depending on compact foam diameter .................... 8
Table 2.2 Considerations in selecting physical expansion agents .................. 16
Table 2.3 EPS Degradation Products (Partial list) .............................................. 25
Table 3.1 Solubility parameters for PS and solvents .......................................... 44
Table 3.2 Calculated distances from solvent point to center of solubili ty
sphere .............................................................................................................................. 44
Table 3.3 Calculated Flory-Huggins Interaction Parameter.............................. 45
Table 3.4 Comparison of molecular weight distribution and styrene presence at various
positions within a polystyrene foam pattern ..................................................................... 61
Table 3.5 Colecular weight distribution and styrene presence at various positions within
the unmodified polystyrene foam pattern ......................................................................... 61
Table 3.6 Temperature distribution in foams as function of steam time .......................... 61
Table 3.7 Characteristic thermal properties of foam using the proposed
model ............................................................................................................................... 63
Table 4.1 Gross gaseous emissions arising from the production of 1 kg of EPS. ........... 73
Table 4.2 Relevant physical properties of 2-butanol compared to n-pentane .................. 77
Table 4.3 Interaction parameter (χ1 2) for alcohols in PS at different temperature ......... 85
Table 4.4 Hansen parameters of monomer, polymer and expansion agents at 25ºC ....... 89
Table 4.5 Relevant properties of potential expansion agents compared to PS ............... 100
Table 4.6 Sample ID with concentration of expansion agent for determination of phase
diagram experiment. ....................................................................................................... 112
Table 4.7 GPC results for polystyrene samples .............................................................. 115
Table 4.8 TGA report of 2-Butanol weight percentage (samples same as Table 4.7) .... 118
Table 4.9 Morphological characterizations of 2-Butanol phases in PS matrix at room
temperature ..................................................................................................................... 123
Table 4.10 Temperature dependence of binodal and spinodal compositions for PS-2-
butanol system ................................................................................................................ 123
viii
List of Figures Figure 2.1 Schematic illustration of expandable polystyrene bead
synthesis process [After Huntsman, 2001].. . . . . . . . . . . . . . . . . . . . . . . . . . . . . . . . . . . . . . . . . . . . 8
Figure 2.2 SEM image for a typical expandable polystyrene bead
containing pentane as expansion agent. . . . . . . . . . . . . . . . . . . . . . . . . . . . . . . . . . . . . . . . . . . . . . . . . . 9
Figure 2.3 SEM image of an expanded polystyrene bead produced by the
existing pre-expansion process .. . . . . . . . . . . . . . . . . . . . . . . . . . . . . . . . . . . . . . . . . . . . . . . . . . . . . . . . . 10
Figure 2.4 Expansion curve for a typical expandable polystyrene bead
expanded with steam [After Huntsman, 2001] .. . . . . . . . . . . . . . . . . . . . . . . . . . . . . . . . . . . . 11
Figure 2.5.a SEM image of a cut and fractured surface of rigid expanded
polystyrene foam showing fusion of foam beads forming a mesh of
dodecahedron structures. b. Image shows fused cell walls and detail of the
inner closed cell structure. . . . . . . . . . . . . . . . . . . . . . . . . . . . . . . . . . . . . . . . . . . . . . . . . . . . . . . . . . . . . . . . . 14
Figure 2.6 Schematic of basic foam degradation model in lost foam
casting [Chen, 2005] .. . . . . . . . . . . . . . . . . . . . . . . . . . . . . . . . . . . . . . . . . . . . . . . . . . . . . . . . . . . . . . . . . . . . . . . . 19
Figure 2.7 Illustration showing different steps in LFC process.. . . . . . . . . . . . . 22
Figure 2.8 Benzoyl peroxide free radical formation .. . . . . . . . . . . . . . . . . . . . . . . . . . . . 24
Figure 2.9 Tetrabromo cyclooctane (TBCO) .. . . . . . . . . . . . . . . . . . . . . . . . . . . . . . . . . . . . . . . 28
Figure 3.1 Flow-3D modeling for LFC showing advancing metal front
through collapsing EPS foam ... . . . . . . . . . . . . . . . . . . . . . . . . . . . . . . . . . . . . . . . . . . . . . . . . . . . . . . . . . . 34
Figure 3.2 Neutron radiography image showing formation of fast diffusion
pathways in foam pattern during LFC [Luo and Penumadu, 2007] .. . . . . . . . 37
Figure 3.3 Schematic i llustrating the plotting of a solubili ty sphere in a 3-
D Hansen plot Ideal solvent coordinates lie on the sphere surface while
bad and good solvent coordinates lie outside and inside the sphere
respectively .. . . . . . . . . . . . . . . . . . . . . . . . . . . . . . . . . . . . . . . . . . . . . . . . . . . . . . . . . . . . . . . . . . . . . . . . . . . . . . . . . . . . 43
Fig.3.4 Experimental setup for exposure of EPS to thermal radiation .. . . 49
Fig. 3.5 Schematic of experimental setup for exposure to styrene vapor. 50
Figure 3.6 a. partially filled EPS foam pattern; b. close-up view of the
degrading front . . . . . . . . . . . . . . . . . . . . . . . . . . . . . . . . . . . . . . . . . . . . . . . . . . . . . . . . . . . . . . . . . . . . . . . . . . . . . . . . 53

ix
Figure 3.7 Position of the samples selected for used GPC studies.. . . . . . . . . 53
Figure 3.8 Schematic of experimental setup for measuring temperature
distribution inside intact foam (Benson et al. , 2004) .. . . . . . . . . . . . . . . . . . . . . . . . . . . 55
Figure 3.9 Thermocouple readings to obtain temperature profile at critical
surface temperature (Tsc) .. . . . . . . . . . . . . . . . . . . . . . . . . . . . . . . . . . . . . . . . . . . . . . . . . . . . . . . . . . . . . . . . . 55
Figure 3.10 SEM micrograph showing morphological changes in of EPS
foam exposed to: (a) infrared radiation from a 2” diameter cylindrical
source of Aluminum at 750ºC for 2 sec. (b) same thermal conditions for 4
sec. (c) for 8 sec. (d) Styrene vapor for 2 sec. (e) Styrene vapor for 4 sec.
(f) Styrene vapor for 8 sec.. . . . . . . . . . . . . . . . . . . . . . . . . . . . . . . . . . . . . . . . . . . . . . . . . . . . . . . . . . . . . . . . 57
Figure 3.11 Sample DSC results showing (a) Tg at 101C for intact foam
and (b) broadening of Tg for Foam exposed to styrene vapors for 4 sec (c)
for 8 sec .. . . . . . . . . . . . . . . . . . . . . . . . . . . . . . . . . . . . . . . . . . . . . . . . . . . . . . . . . . . . . . . . . . . . . . . . . . . . . . . . . . . . . . . . . 59
Figure 3.12 SEM images of EPS cellular structure as a function of steam
time. (a) Low steam time (underexpanded, 11 sec). (b) Normal steam time
(Optimum expansion, 17sec). (c) High steam time (Partial collapse after
maximum expansion, 20 sec) . . . . . . . . . . . . . . . . . . . . . . . . . . . . . . . . . . . . . . . . . . . . . . . . . . . . . . . . . . . . 62
Figure 3.13 Temperature distribution within intact foam as a function of
processing conditions .. . . . . . . . . . . . . . . . . . . . . . . . . . . . . . . . . . . . . . . . . . . . . . . . . . . . . . . . . . . . . . . . . . . . . . 64
Figure 4.1 Schematic showing current process of steam generation and
transmission as a multi step process. . . . . . . . . . . . . . . . . . . . . . . . . . . . . . . . . . . . . . . . . . . . . . . . . . . 70
Figure 4.2 Illustration showing expansion of polymer bead using novel
concept…………………………………………………………………………..78
Figure 4.3 Schematic illustrating the plotting of a solubility sphere in a 3-D Hansen plot……………………………………………………………………..99
Figure 4.4 Dipole polarization effect on water molecule. a. Water dipole
moment is aligned to the field; b. Dipole moment rotates in order to
follow the field; c. Dipole moment rotates in opposite direction trying to
align with the field .. . . . . . . . . . . . . . . . . . . . . . . . . . . . . . . . . . . . . . . . . . . . . . . . . . . . . . . . . . . . . . . . . . . . . . . . . . 92

x
Figure 4.5 Ionic conduction effects on Chlorine ion. a. Negatively charged
Chlorine ion is attracted to the positive portion of microwave; b. is
repelled by the negative section of microwave; c. causing oscillation of
the ion through the liquid media .. . . . . . . . . . . . . . . . . . . . . . . . . . . . . . . . . . . . . . . . . . . . . . . . . . . . . . . 94
Figure 4.6 Precision furnace used for polymerization and determination of
phase diagram experiments. Inset shows phase separation in 10%
concentration sample while lower concentration samples are clear. . . . . . 107
Figure 4.7 Reaction vial dimensions, b. pellet dimensions .. . . . . . . . . . . . . . . . . 107
Figure 4.8 Sample image showing threshold technique to obtain phase
distribution in 10% 2-butanol concentration sample a. SEM image b.
processed binary image. . . . . . . . . . . . . . . . . . . . . . . . . . . . . . . . . . . . . . . . . . . . . . . . . . . . . . . . . . . . . . . . . . . 111
Figure 4.9 Standard microwave reaction vessel with sample inside. . . . . . 113
Figure 4.10 Typical feedback control results for microwave expansion
process .. . . . . . . . . . . . . . . . . . . . . . . . . . . . . . . . . . . . . . . . . . . . . . . . . . . . . . . . . . . . . . . . . . . . . . . . . . . . . . . . . . . . . . . . . 113
Figure 4.11 Image shows phase separation in 8% sample at room
temperature. 7% and 6% samples are clear. . . . . . . . . . . . . . . . . . . . . . . . . . . . . . . . . . . . . . . . 115
Figure 4.12 Thermo gravimetric analysis results showing weight loss of 2-
butanol a. Sample containing 12% by vol. b. 16% by vol. and c. 18% by
vol. of 2-butanol . . . . . . . . . . . . . . . . . . . . . . . . . . . . . . . . . . . . . . . . . . . . . . . . . . . . . . . . . . . . . . . . . . . . . . . . . . . . 117
Figure 4.13 DSC results for expandable PS with varying concentration of
2-Butanol . . . . . . . . . . . . . . . . . . . . . . . . . . . . . . . . . . . . . . . . . . . . . . . . . . . . . . . . . . . . . . . . . . . . . . . . . . . . . . . . . . . . . . 118
Figure 4.14 .a Modulated DSC results showing irreversible nature of peak
at 48 ºC (b) Time- temperature programming for modulated DSC. .. . . . . . 120
Figure 4.15 SEM images showing PIPS of varying concentrations of 2-
butanol in PS .. . . . . . . . . . . . . . . . . . . . . . . . . . . . . . . . . . . . . . . . . . . . . . . . . . . . . . . . . . . . . . . . . . . . . . . . . . . . . . . . 121
Figure 4.16 SEM images showing PIPS of varying concentrations of 2-
Butanol in PS .. . . . . . . . . . . . . . . . . . . . . . . . . . . . . . . . . . . . . . . . . . . . . . . . . . . . . . . . . . . . . . . . . . . . . . . . . . . . . . . . 122
Figure 4.17 Plot of phase diagram (cloud point) for 2-butanol in PS matrix
at constant molecular weight Mn = 105,993 (avg.) and PD =2.117 .. . . . . 125

xi
Figure 4.18 Estimation of interaction parameter for PS-2-butanol system
... . . . . . . . . . . . . . . . . . . . . . . . . . . . . . . . . . . . . . . . . . . . . . . . . . . . . . . . . . . . . . . . . . . . . . . . . . . . . . . . . . . . . . . . . . . . . . . . . . . 125
Figure 4.19 Composition dependence of free energy of mixing for PS-2-
butanol system ... . . . . . . . . . . . . . . . . . . . . . . . . . . . . . . . . . . . . . . . . . . . . . . . . . . . . . . . . . . . . . . . . . . . . . . . . . . . . 127
Figure 4.20 Comparison of the cloud point composition with calculated
binodal and spinodal compositions as a function of temperature .. . . . . . . . 128
Figure 4.21 a. PS pellet in glass tube mold; b. Pellet expanded into foam
taking up shape of mold. . . . . . . . . . . . . . . . . . . . . . . . . . . . . . . . . . . . . . . . . . . . . . . . . . . . . . . . . . . . . . . . . . 129
Figure 4.22 Image showing expansion of PS with varying concentrations
of 2-butanol in cylindrical shape. a. expandable pellets, b. pellets
expanded into foam ... . . . . . . . . . . . . . . . . . . . . . . . . . . . . . . . . . . . . . . . . . . . . . . . . . . . . . . . . . . . . . . . . . . . . . 131
Figure 4.23 Images of foam samples with varying 2-butanol concentration
(a) 4% 2-butanol before microwave, (b) 4% sample after microwave
showing internal void formation (c) 6% 2-butanol Top view after
microwave (d) 6% 2-butanol side view showing non uniform expansion
(e) 8% 2-butanol top surface of foam, (f) 8% 2-butanol cut surface of
foam... . . . . . . . . . . . . . . . . . . . . . . . . . . . . . . . . . . . . . . . . . . . . . . . . . . . . . . . . . . . . . . . . . . . . . . . . . . . . . . . . . . . . . . . . . . . 132
Figure 4.24 (a) Microwave expansion by dipole rotation. (b) Microwave
expansion by ionic conduction and dipole rotation .. . . . . . . . . . . . . . . . . . . . . . . . . . . . 133
Figure 4.25 Comparison of energy required for expansion in case of
microwave heating without (a) and with (b) ionic salts . . . . . . . . . . . . . . . . . . . . . . 135
Figure 4.26 Granules of expandable PS separated using standard sieves135
Figure 4.27 SEM images of expanded foam showing cellular morphology
at various magnifications .. . . . . . . . . . . . . . . . . . . . . . . . . . . . . . . . . . . . . . . . . . . . . . . . . . . . . . . . . . . . . . . 137

1
Chapter 1 Introduction
Polymeric foam is typically prepared from thermoplastic polymer with the
introduction or generation of a gas within a polymer matrix. At present,
the use of polymeric foam continues to grow at a rapid pace due to their
desirable material properties such as light weight, excellent
strength/weight ratio, superior thermal and acoustic insulation, and
damping properties ideal for vibration isolation or shock absorption.
Selections of polymers suitable for industrial foam applications depend on
their chemical, mechanical and thermal properties, ease of
manufacturability, and economic factors. A wide range of densities of
polymeric foam are produced varying from 2 kg/m3 to 960 kg/m3. Open
cell foams were the cell are connected by open channels, are generally
flexible and widely used in cushioning and acoustic insulation. Closed
cell foams with cells encased in thin permeable films of solid polymer,
are generally rigid and used for packaging, and thermal insulation (Brody
and Marsh, 1997). In addition to commercial applications, polymeric
foams are also finding a niche in specialized technological applications
like space research and electronics. Expanded polystyrene (EPS) foam was
introduced in 1931 (Munters, 1935) and was extensively commercialized
in the United States after World War II.
EPS has a higher flexural modulus at room temperature than other

2
thermoplastics (Wagner et. al. , 2000). This is due to PS being an
amorphous polymer which undergoes biaxial stretch induced hardening
when foam cells are formed Its higher rigidity along with its closed
cellular structure leads to excellent thermal insulation and shock
absorption properties ideal for use in packaging applications. The non-
polar chemical nature of polystyrene and having a closed cellular
structure in expanded form makes it hydrophobic and impermeable to
water under ambient conditions. Thus it is effectively used in food
packaging industry and for applications in floatation devices. EPS foam is
also used in the casting industry for making patterns of complicated
geometry in Lost Foam Casting (LFC).
LFC is a metal casting technology that facilitates fabrication of near-net
shape parts by using expanded polystyrene (EPS) patterns coated with
refractory slurry and packed in un-bonded sand that is subsequently
compacted by mechanical vibration. LFC was developed from the
principles of Investment Casting. Investment Casting is a process that has
been practiced for thousands of years, with lost wax process being one of
the oldest known metal forming techniques. Detailed explanation of the
LFC process is presented in Chapter 2 as a background for the present
study. LFC can be a cost effective process for producing aluminum or iron
castings of complicated geometry. However, the LFC process can produce
considerable amount of scrap due to casting defects. These casting defects

3
are attributed to the entrapment of the EPS degradation products inside
the casting. Removing the EPS thermal decomposition products through
the ceramic coating ahead of the advancing metal front during the liquid
metal pour is a key factor in obtaining a defect free casting. Ceramic
coatings absorb liquid fractions by wicking as they are formed. The liquid
fractions degrade slowly into gaseous products and disperse into the sand.
The coating also allows direct removal of the gaseous degradation
products formed during the LFC process. (Cai et al. , 2002) Developing a
fundamental understanding of the foam degradation behavior is essential
in improving the LFC process. An integrated approach for reducing
defects in LFC thus involves:
1. Chemical modifications of expandable polystyrene to eliminate or
minimize formation of defects and
2. Manufacturing process control and optimization of foam and
coating physical properties
LFC process uses expanded polystyrene foam patterns in which isomers of
pentane are used as blowing agents to achieve the expansion. In order to
expand polystyrene, steam is used as a heat source and the expansion
process takes place via conduction of heat from the surface of unexpanded
polystyrene beads into the bulk. Pentane isomers are volatile organic
compounds and green house gases that are either liberated directly into
the atmosphere or combusted using expensive setup (EPA report, 2005).
4
In both cases the plant producing EPS emits greenhouse gases into the
lower stratosphere (Snijder, 2003).
The second Chapter of this dissertation provides background information
necessary to all the subsequent chapters. In Chapter 2 the existing method
for manufacturing EPS foam is reviewed and a recent attempt towards
development of environmentally friendly foaming process is introduced.
Chapter 2 also provides an introduction to the lost foam casting process
and chemical degradation mechanism for polystyrene.
Modeling of the LFC process till date has completely neglected the effect
of styrene on the overall thermal degradation of EPS foam. Chapter 3
discusses this dissolution effect by presenting the thermodynamic
principles of polymer solution theory along with experiments to verify the
impact of styrene on polystyrene degradation. It is demonstrated that
styrene significantly alters the degradation mechanism of EPS in the LFC
process and thus dictates the success of obtaining defect free casting.
Chapter 4 considers the environmental impact of the current process using
pentane as an expansion agent and introduces a new method for
manufacturing of EPS foam. Laboratory experiments are demonstrated
where PS pellets are successfully expanded into foam. In this research an
optimized new approach for manufacturing EPS foam is investigated
where a benign and recyclable expansion agent is used to expand

5
polystyrene and novel heating technology is developed in order to achieve
efficient volumetric heating for the expansion to take place during foam
preparation. Chapter 4 investigates a novel method for foam production to
achieve a cellular morphology and overall foam uniformity that may
contribute to a better control over metal flow during LFC and thus reduce
flow related casting defects.
REFERENCES
Brody, A.L and K.S.Marsh (1997) “The Wiley Encyclopedia of Packaging Technology”, Second Edition Munters, C.G and J. G. Tandberg (1935) “Heat Insulation”, US Patent. 2,023,204 Wagner, H. et al. (2000) “The strain-hardening behavior of linear and long-chain-branched polyolefin melts in extensional flows” Rheologica Acta Volume 39, Number 2 / March Cai, M. et al . (2002) ” Physical and Chemical Analysis of the Thermal Degradation Products of Expanded Polystyrene Patterns with Short Thermal Exposures” Transactions of the American Foundry Society and the One Hundred Sixth Annual Casting Congress; Kansas City, MO; USA; 4-7 May 2002. pp. 1463-1481. EPA (2005) “Maricopa County Environmental Services Department Title V Operating Permit Program Evaluation, Final Report”, 75 Hawthorne Street, San Francisco, CA Snijders, E.J. (2003) “Water Expandable Polystyrene (WEPS) Computational and Experimental Analysis of Bubble Growth” Graduate Thesis. University of Eindhoven

6
Chapter 2 Background of the Study

7
2.1 Current Method for Synthesis of EPS
Polystyrene can be foamed either by extrusion processes or by expansion
from beads. Current study is focused on foam produced by the expansion
technique.
2.1.1 Synthesis of expandable polystyrene beads
Expanded polystyrene (EPS) foam is manufactured from atactic
polystyrene prepared via free radical polymerization in a standard
suspension process. Spherical, expandable polystyrene beads are prepared
from liquid styrene monomer suspended in an aqueous medium containing
a suitable suspension stabilizer, an expansion agent, and a free-radical
initiator. During the polymerization process a controlled hydrocarbon
pressure is applied to incorporate approximately 7% by weight of the
blowing agent in the beads. The most common expansion agents used are
pentane isomers. A schematic of the EPS production process is presented
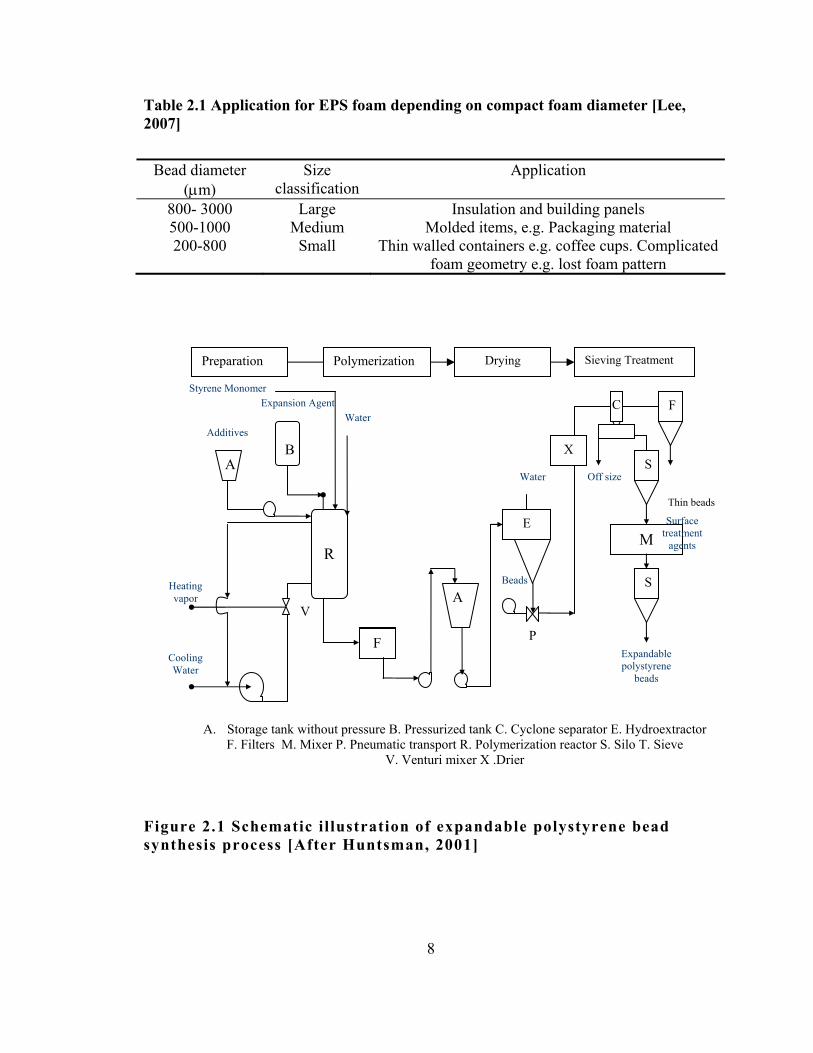
in Fig.2.1. The specific applications of EPS foam are determined by the
diameter of the expandable beads and the expansion agent. The
manufactured grades and their specific applications are il lustrated in
Table 2.1. Scanning electron micrograph of a typical expandable
polystyrene bead containing pentane as expansion agent is presented in
Fig 2.2.
8
Table 2.1 Application for EPS foam depending on compact foam diameter [Lee, 2007]
Bead diameter (μm)
Size classification
Application
800- 3000 Large Insulation and building panels 500-1000 Medium Molded items, e.g. Packaging material 200-800 Small Thin walled containers e.g. coffee cups. Complicated
foam geometry e.g. lost foam pattern
Figure 2.1 Schematic illustration of expandable polystyrene bead synthesis process [After Huntsman, 2001]
Heating vapor
Cooling Water
Thin beads
Sieving Treatment Drying Preparation
F
R
A B
Styrene Monomer
Water Additives
Expansion Agent
F
Polymerization
A
E
X
M
S
S
Off size
F
Water
Surface treatment
agents
Expandable polystyrene
beads
Beads
A. Storage tank without pressure B. Pressurized tank C. Cyclone separator E. Hydroextractor F. Filters M. Mixer P. Pneumatic transport R. Polymerization reactor S. Silo T. Sieve
V. Venturi mixer X .Drier
C
V
P

9
Figure 2.2 SEM image for a typical expandable polystyrene bead containing pentane as expansion agent
2.1.2 Pre-expansion of polystyrene beads
In the pre-expansion stage the expandable polystyrene beads are
introduced into a vertical tank with an agitator having a controlled steam
input. The pre-expansion stage is required to ensure a closed cell structure
and to achieve the required uniform density at macro scale. Scanning
electron micrograph of a typical expanded polystyrene bead is presented
in Fig 2.3. The expandable bead has a glass transition temperature at
approximately 85ºC while the boiling point of pentane isomers is
approximately 38ºC. Being heated with steam at 100°C the internal vapor
pressure in the beads increases. The vapor pressure of the blowing agent
forces the PS matrix to expand as it reaches glass transition and a uniform
400μm
0.8mm

10
Figure 2.3 SEM image of an expanded polystyrene bead produced by the existing pre-expansion process
cellular structure with irregular polyhedral-shaped closed cells is formed
[Benning, 1969]. The cell size can be regulated between 50μm and 750
μm by means of the expansion time and nucleating agents [Crevecoeur et
al. , 1998]. The target density is achieved by controlling the steam flow
rate and the feed rate of the raw beads. The final density is also a function
of the initial size of the beads and blowing agent content. Controlling the
process time is an important factor since the beads might reach their
minimum density limit and subsequently collapse due to pressure drop as
the expansion agent diffuses out of the porous system (Fig 2.4). The
expansion characteristics of PS, like foam stability and cell uniformity,

11
10
11
12
13
14
15
16
17
18
0 5 10 15
Time of expansion (min)
App
aren
t den
sity
(kg/
m3 )
Figure 2.4 Expansion curve for a typical expandable polystyrene bead expanded with steam [After Huntsman, 2001]
are also influenced by the rheological properties of the polymer matrix.
During the expansion process, expansion of a viscous medium takes place
and a certain degree of melt strength or elasticity is required to prevent
viscous flow failure of the cell walls [Benning, 1969]. The viscous flow
properties of the polymer, as a function of temperature, are affected by its
molecular weight and polydispersity. Stafford et al. [1998] investigated
the effect of molecular weight, polydispersity and plasticizers on the
microcellular structure of polystyrene. They concluded that molecular
weight and polydispersity do not significantly affect the foaming process.

12
However, the presence of low molecular weight plasticizers was found to
greatly influence the final structure of the foam. Viscous flow can be
facilitated by the presence of plasticizers in the matrix [Blihi et al. ,
1994]. The viscous strength of the PS matrix during expansion can be
enhanced by crosslinking or grafting of the PS chains [Benning, 1969] or
by blending with PPE (poly 2, 6- dimethyl-1, 4-phenylene ether)
[Crevecoeur et al . , 1999]. Such blending also increases the glass
transition by a few degrees and possibility of cell wall collapse can be
reduced. The pre-expansion process is generally carried out in a
continuous screw type pre expander machine. The pre-expanded beads
exiting the pre-expander are usually fed to a fluidized bed drier where
they are gently dried.
The pre-expanded beads leaving the fluidized bed drier is transferred to
plastic mesh holding bins and allowed to reach steady state at ambient
temperature. Depending upon the target density and thus bead size, this
process can take four hours to three days. This stabilization stage is
required for the elimination of excess water contained in and on the
surface of the pre-puffed beads that is detrimental to the final molding
process. For molding of high-density foams this stage also allows for the
excess blowing agent to dissipate [Huntsman, 2001].
2.1.3 Molding of pre-expanded beads
Block molds are made from either steel or an aluminum alloy. The mold

13
walls are usually Teflon™ -coated or stainless steel and have many small
ports, nozzles or slits less than 1mm dimension for steam to enter and air
to escape. Behind each wall a chamber is provided for vapor inlet and
condensation water outlet.
Molding Cycle consists of
a. Filling Cycle - Filling the mold involves the closing of the mold and
transport of the aged pre-puff beads into the cavity by controlled airflow.
b. Vacuum Cycle - A pressure drop inside the mold cavity is accomplished
by a vacuum pump. This vacuum stage removes the air and water from the
mold facilitating subsequent fusion.
c. Steaming Cycle - With the condensation outlets closed, the mold is
subjected to steam until atmospheric pressure is reached. Steam pressure
is then increased by sending the steam into the two side steam chambers
with the outlet condensation valves open. The pre puffed beads reach
glass transition and with no space for further expansion, fusion of bead
walls occur.
d. Autoclave Cycle – During this stabilization period all condensation
outlet valves are closed and the vapor pressure is maintained for 3 to 10
seconds.
e. Cooling Cycle – During this cycle, the condensation outlet valves are

14
Figure 2.5.a SEM image of a cut and fractured surface of rigid expanded polystyrene foam showing fusion of foam beads forming a mesh of dodecahedron structures. b. Image shows fused cell walls and detail of the inner closed cell structure.
a
b

15
opened, decreasing the pressure inside the mold. The valves are then
closed again and the vacuum is applied til l mold pressure reaches
approximately 0.1bar. Any residual condensate remaining in the mold is
thus evacuated. The mold pressure is allowed to reach atmospheric
conditions, the mold is opened and rigid EPS foam (Fig 2.5) is ejected
using ejector pins.
The entire molding cycle generally lasts from 3 to 15 minutes, depending
on the product. The temperature of the block at the time of ejection is
approximately 90ºC-95ºC and the cells still contain a partial vacuum.
Fresh molded foam parts are usually allowed to stabilize for at least 24
hours in an atmosphere free of cold drafts to allow gradual cooling.
[Huntsman, 2001]
2.2 Expansion Agent
Hydrocarbons like pentane isomers or butane, classified under physical
expansion agents, are used for expansion of polystyrene beads. Criteria
for selection of a blowing agent are illustrated in Table 2.2. A major
disadvantage of pentane isomers is their high flammability and high
volatility. Pentane isomers are suspected to contribute to smog and to the
generation of stratospheric ozone. Within the next few years the polymer
industries will be forced by new regulations to drastically reduce the level
of volatile organic compound emission [Crevecoeur et al. , Part 1, 1999].

16
Table 2.2 Considerations in selecting physical expansion agents
Physical Volatility, Boiling point, Latent heat, Thermal conduction, Critical Temperature
Chemical Henry Law constant, Reactivity, Stability, Solubility parameter Transport Diffusivity, Plasticization Safety Flammability, Toxicity Regulatory Ozone formation, Green house, Smog, Odor, FDA Availability Cost, Ease of handling, Storage
2.3 Water Expandable Polystyrene (WEPS)
Motivated by environmental concerns, Emile Snijders in her Doctoral
dissertation titled “Water Expandable Polystyrene (WEPS) Computational
and Experimental Analysis of Bubble Growth” [Snijders, 2003] presented
detailed experimental and theoretical work on a novel expansion method
for polystyrene using water as an expansion agent. The experimental study
included synthesis of WEPS beads by a novel two-step process. Water is
completely insoluble in styrene monomer. The first step in the process
was [Crevecoeur et al. , 1999] bulk polymerization where a physical
surfactant was added to disperse water droplets in partially polymerized
styrene thus yielding a stable emulsion. Partial polymerization was
carried out to increase the viscosity of the liquid media sufficient enough
to stabilize the emulsion. In the second step this emulsion was suspended
in water in the presence of a suitable suspension stabilizer and standard
suspension polymerization was carried out in order to obtain beads. The
following are the problems reported in literature related to WEPS.

17
1. In commercial expandable polystyrene beads the expansion agent used
is pentane isomers that form a single-phase solid solution with the
polystyrene matrix. This is due to the high room temperature solubility in
polystyrene. The expansion agent (Water) in WEPS is completely
insoluble in styrene and polystyrene and thus has to be mechanically
dispersed in the polymer matrix. This creates an inhomogeneous
dispersion varying widely in phase size, concentration and distribution
that finally result in large non-uniformity in cell structures of expanded
beads.
2. The Glass transition temperature Tg for commercially available
expandable PS beads is reduced from 100°C to approximately 70°C by the
plasticizing effects of pentane. This enables the use of saturated steam at
100°C to be used as a source for heat in expansion and fusion process. For
WEPS, the Tg of the bead is 100°C since water has no plasticizing effect
on PS. Thus saturated steam was proposed to be replaced by either “hot
air or superheated steam at temperatures substantially above 100°C”
[Snijders, 2003] However, due to high diffusion coefficient of water
through PS at elevated temperatures (above Tg) dry hot air lead to loss of
blowing agent without foaming due to high diffusion rate at the high
concentration gradient. Thus, superheated steam that is considerably more
expensive to generate was considered the only option as a heat source.
The problem identified with superheated steam was that of generating

18
sufficient pressure differential for expansion to take place. The expansion
process, as applied for conventional EPS with saturated steam at
atmospheric pressure as heating medium, cannot be applied for WEPS
because identical pressures inside and outside the beads would exist in
this case. “Moreover, since the Tg of PS is equal to the condensation
temperature of water at atmospheric pressure, an increased risk of foam
collapse can be expected during cooling of the foam.” [Crevecoeur et al.,
1999]
2.4 Lost Foam Casting (LFC)
Lost foam casting is a technology that facilitates fabrication of near-net
shape parts by using expanded polystyrene (EPS) patterns coated with
refractory slurry and packed in unbonded sand that is compacted by
mechanical vibration (Fig. 2.6). EPS foam used in the LFC process is
made from amorphous, linear polystyrene with a molecular weight ranging
from 150,000 to 500,000. For a typical Aluminum casting, EPS foam has a
density in the range of 0.020–0.030 g/cc and an average cell diameter
ranges from 250 – 1500 μm depending on the product. If subjected to
heat, EPS bead loses structural rigidity at about 120°C, becomes viscous
at about 220°C, and almost fully volatilizes at about 430°C. The average
heat of degradation of the EPS foam is ~190cal/g. The heat from the
molten metal that is poured into the mold, acts as a source for chemical
degradation of the polymeric foam and the metal eventually takes the

19
Figure 2.6 Schematic of basic foam degradation model in lost foam casting [Chen, 2005]
shape of the pattern. The objective for LFC is to shift value-added content
of a final product from machining, finishing and assembly operations to
the casting. Components with internal complexity and high machining
parameters as well as assemblies with the potential for integration are
ideal candidates for the LFC process. LFC also offers design engineers an
opportunity to produce a detailed and refined design, as the foam patterns
can be made in several parts and then glued together. By optimizing the
LFC process machining and assembly costs can be reduced. Due to the use
loose sand in the LFC process, it is environmentally friendlier than
conventional sand casting, which uses resin bonded sand that can have a
negative impact on the environment. The LFC sand can thus be recycled.
A comparative study in energy usage for both lost foam casting and

20
conventional green sand casting shows that LFC results in total energy
savings of 27%, a productivity increase of 46% and cast metal saving by
7% [Campbell, 2000]. The benefits of the LFC process have led
manufacturers such as General Motors, Mercury Marine, BMW and Kohler
to embrace the process for casting their engine components. For instance,
General Motors started to produce the 4.3L, V-6 diesel cylinder head
using aluminum Lost Foam Casting at Massena, New York in 1981.
According to Smith [Smith, 1996], General Motors had nine different
products in Lost Foam production including aluminum cylinder head,
aluminum cylinder block, aluminum driven sprocket supports for
automatic transmission, iron crankshaft, iron differential case, and iron
clutch housing for automatic transmission. Saturn Corp, a subsidiary
company of General Motors, produced the engine blocks and heads at
rates of up to 90 sets/hr. General Motors obtained success with its – the
Vortec 4200 Inline 6 engine– by using LFC process.
A complex lost foam casting pattern is generally an assembly of smaller
sections glued together and dipped into water-based refractory slurry and
dried to provide a rigid coating. After drying operation, the coated foam
pattern is placed in a steel casting chamber and packed with unbonded
silica sand to fill all the pattern cavities. The sand is compacted by
mechanical vibration to provide mechanical structure to the compacted
mold. Molten metal is then poured down through the sprue. The foam

21
pattern degrades and permeates into the loose sand through the coating
absorbing heat from the molten metal and eventually the target shape is
obtained as metal replaces the expendable pattern. The final casting
product is obtained by removing the sand and sand blasting off the
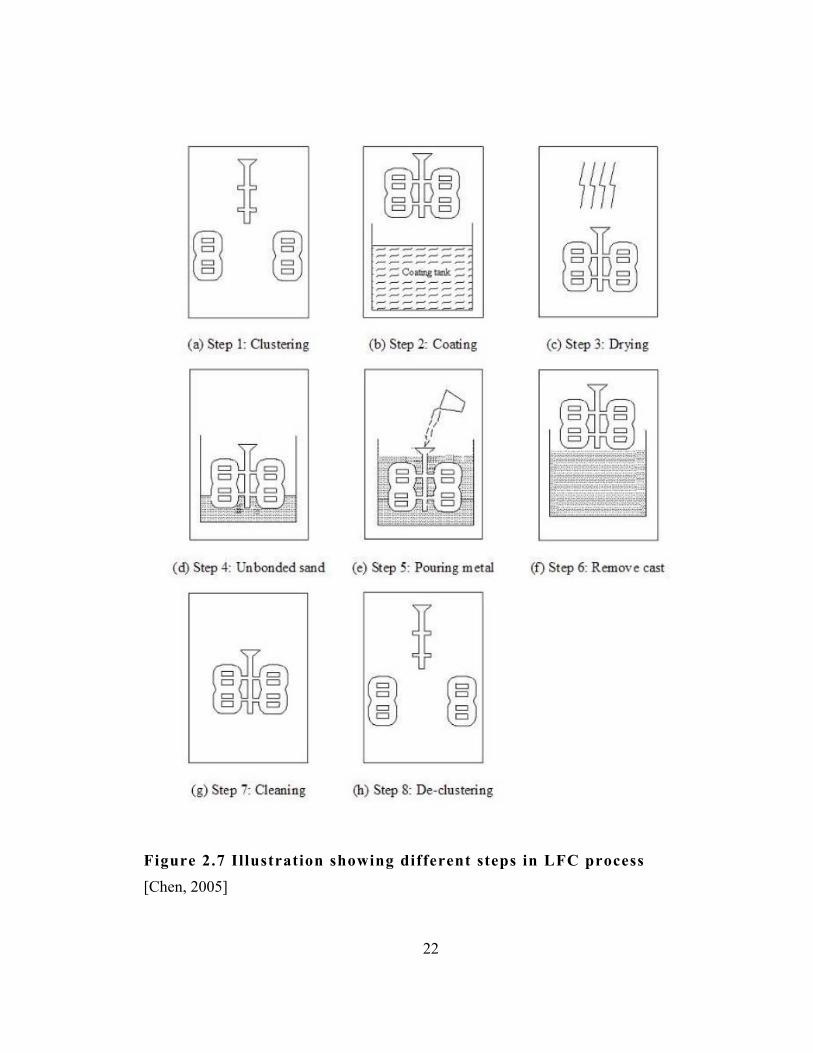
refractory coating. The sequence of steps involved in the LFC process is
illustrated in Fig. 2.7. During the LFC process the molten metal serves as
a heat source and the foam pattern undergoes both physical and chemical
changes, due to thermal degradation and oxidation. The foam pattern
degrades into gas and liquid byproducts and vents into loose sand through
the refractory coating after the molten metal is poured into mold. The
metal filling rate is controlled by a dynamic balance between the rate of
degradation of the foam pattern and rate of removal of the degradation
products. The rate of degradation is controlled by parameters such as
temperature, EPS composition, molecular weight, pattern density and
extent of fusion between the foam cells. Rate of formation of degradation
ultimately to the quality of the castings [Brown, 1992; Shivkumar, 1990].
The refractory coating controls the flow of the metal front by regulating
flow of the polymer degradation products out of the mold and also
provides structural rigidity to the mold so that i t does not collapse under
product is proportional to the molten metal temperature where as the rate
of removal is determined mainly by the permeability and thermal
diffusivity properties of the porous refractory coat and sand surrounding
the coa t ing . Also the in i t i a l foam morpho logy and subsequen t loca l
22
Figure 2.7 Illustration showing different steps in LFC process [Chen, 2005]

23
alterations in the foam pattern, induced by heating are deemed critical to
the transport mechanism of the degradation products through the foam and
the weight of packing sand. The optimized regulation of the degradation
products out of the casting cavity has been reported as a major control
process in order to minimize casting defects [Littleton et al. , 1997; Liu et
al. , 1998].
Other factors such as the chemical nature of the foam material and density
uniformity of the patterns also affect the quality of the castings.
[Sonnenberg, 2003; Benson, et al. 2004]
2.5 Thermal Degradation of Polystyrene Foam
The thermal stability of commercial PS depends on various factors such as
presence of excess initiator, additives, presence of number of weak bonds,
method of synthesis, residual chemicals etc. EPS generally contains
minute amount of residual initiators. Sometimes these initiators are
deliberately added to enhance dissociation into free radicals when heat is
applied. Usually these initiators are peroxides (Fig 2.8).
2.5.1 Components of degradation products The thermal degradation of polystyrene is a radical chain process, which
includes steps such as initiation, propagation, transfer and termination.
Generally at temperatures below 300°C degradation is a decrease in the
degree of polymerization. At temperatures greater than 300°C

24
Figure 2.8 Benzoyl peroxide free radical formation
intermolecular transfer results in a large drop in the molecular weight.
Further, degradation generates monomer, dimers, oligomers, and other low
molecular weight fragments. The degradation process is controlled by
several competing reactions. Kruz et al. reported a comprehensive model
for the degradation mechanism [Kruz, 2002]. Thermal decomposition of
polystyrene foam under controlled atmosphere and temperature conditions
have been studied [Alajbeg, 1985] by collecting the volatiles and
analyzing the components. The thermal degradation products of EPS have
been analyzed under various conditions and a summary is presented in
Table 2.3. In all these cases, styrene monomer is the major volatile
product. The degradation products also contained oligomers of styrene
such as dimer and trimer, toluene, benzene, ethyl benzene and methyl
styrene. The organic products were very complex mixtures with several
hundred components amounting from less than 0.01% to more than 50% of
the mixture. This data on volatiles is useful in non-combusting situations
like in LFC.

25
Table 2.3 EPS Degradation Products (Partial l ist) [Alajbeg , 1985]
Degradation Byproducts
EPS in N2 % At 950°C
EPS in Air % At 950°C
Styrene 52.48 52.18 Toluene 12.05 12.34 Dimer 0.01 0.01 Trimer 0.14 0.01 Bistyryl 0.1 0.01 Ethyl benzene 5.99 4.75 Methyl styrene 4.32 3.94 Indene 0.84 1.18 Aromatic ketone1 0 0.02 Aromatic ketone2 0.002 0.03 C10H10 0.22 0.23 Naphthalene 1.2 2.28 Phenanthrene 0.37 2.05 Benzoyl peroxide 0.15 0
The products of EPS degradation, results are from Table 2.3 are
summarized as follows:
• Most of the products are aromatic hydrocarbons. Predominant ones
are styrene monomer and its homologues, styrene dimers and
trimers.
• Styrene comprises approximately 52% of the collected products as a
result of EPS depolymerization process.
• Many fused aromatic ring compounds such as indene, naphthalene,
phenanthrene, and some with alkyl compounds are formed.
• In presence of air the oxidized decomposition products formed is

26
only about 2% of the total mixture. Oxygen reacts to give rise to
phenols, alcohols, aldehydes, ketones and benzoic acid in
appreciable amounts.
• It appears that degradation occurring does not get exposed to air
since the oxidative degradation products are so low in concentration
• It is evident from the high percentages of styrene and toluene
formed that depolymerization is predominant, and then
dehydrogenation, followed by cyclization.
2.6 Use of brominated flame retardants [Sonnenberg, 2003]
Major product of thermal decomposition of EPS is styrene monomer,
dimers, and various other fragments. The molecular weight reduction is
exponential at the initial stage of the degradation by random chain
scission and becomes linear after a threshold stage when unzipping
occurs. Longer chain degradation products are liquid existing at
temperatures above 145ºC. The existence of thermal degradation products
in the liquid state is considered a major cause for defects in LFC. One of
the major quality problems in these castings is fold formation that occurs
when pouring molten aluminum. A fold can occur when two metal fronts
come together and do not completely wet one another. Brominated flame-
retardants have been successfully used to eliminate fold formation in
LFC. Brominated flame-retardants effectiveness depends on the quantity
of the Bromine atoms they contain and also, very strongly, on the control
27
of the halogen release. Other considerations when choosing a flame
retardant is cost and the effect of the flame retardant on physical
properties, especially the solubility of the FR in the PS melts. The lower
melting flame-retardants tend to be more soluble. Also they have positive
effects on lowering the melt viscosity of fragments. But the soluble
flame-retardants may cause blooming defect, i .e., migration onto the
surface of molded parts. Solubility of the flame retardant can also
interfere on heat resistance of the EPS. Bromine based flame-retardants
(FR) act primarily by chemically interfering with the radical chain
mechanism that occurs in the gas phase during combustion. The Br
additive in the EPS releases free bromine radicals in the temperature
range of about 650°C - 800°C In case of LFC Brominated flame retardants
accelerate the kinetics of the reaction towards producing smaller chains
by terminating free radicals through oxidation. The fragments of the
degradation products are smaller and gaseous at LFC temperatures, hence
passed easily through the refractory coating. Organic brominated
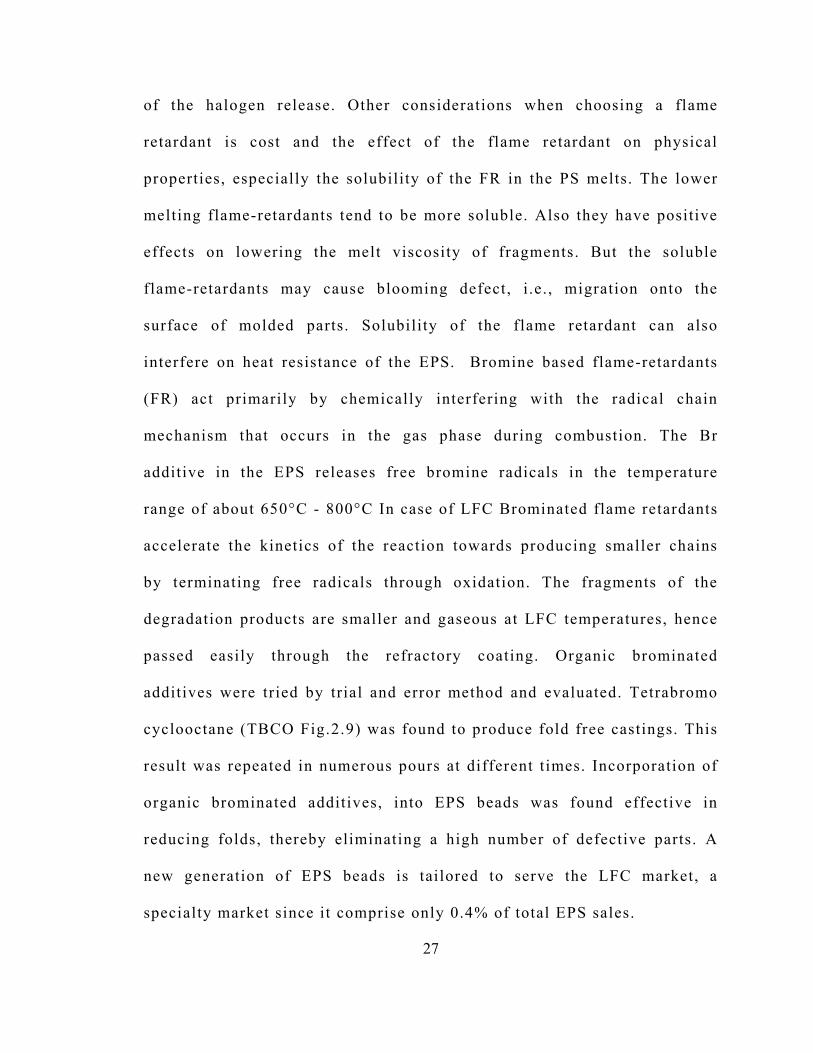
additives were tried by trial and error method and evaluated. Tetrabromo
cyclooctane (TBCO Fig.2.9) was found to produce fold free castings. This
result was repeated in numerous pours at different t imes. Incorporation of
organic brominated additives, into EPS beads was found effective in
reducing folds, thereby eliminating a high number of defective parts. A
new generation of EPS beads is tailored to serve the LFC market, a
specialty market since it comprise only 0.4% of total EPS sales.

28
Figure 2.9 Tetrabromo cyclooctane (TBCO)
2.7 Role of refractory coating in LFC
Refractory coating applied on the foam pattern surface plays an important
role in the success of LFC process. Defects that are commonly observed in
the LFC process are strongly correlated to the coating properties. The
coating requires appropriate mechanical properties in order to resist the
stress from the un-bonded confining sand during metal fi l l as the
polystyrene pattern degrades. The structural integrity and thermal
stability of the coating provides resistance to compaction and thermal
expansion forces during casting thus preventing coating fracture and
metal infiltration into the surrounding sand [Goria et al. , 1986]. The
coating should, at the same time, have optimal permeability to allow
transport of the degradation products of EPS through the coating into the
sand and control the flow of molten metal by regulating the gas
backpressure. Inadequate coating permeability has been reported to
produce defects such as porosity, mis-fill , cold laps, and folds. Metal
solidification before the complete expulsion of degraded materials
through the coating causes porosity defects. A misrun is an incomplete fill

29
of the cavity during pouring. Cold lap is a discontinuity on the casting
surface that is a result of the metal being too cold to fuse at the
confluence of two streams of metal fronts. High coating permeability, on
the other hand leads to surface blisters and formation of a thin oxide layer
beneath the cope surface of the casting. [Littleton et al. , 1997]. High
coating permeability may also cause turbulence in metal flow during
pouring that subsequently shall increase the probability of folds
formations. Folds are formed due to entrapment of degradation products
between metal fronts and manifest as thin sheet-like discontinuities
composed of carbon and aluminum and/or magnesium oxides [Bennett et
al. , 2000]. These flaws cause fatigue failure of the casting when subjected
to cyclic thermal loading and/or mechanical stress.
The thermal diffusivity of the coating also determines the quality of the
castings. Heat transfer between the molten metal and sand and thus
solidification kinetics is guided by the coating thermal properties.
Moreover, the specific heat of the coating also determines the heat
content and its temperature and is extremely important in understanding
degradation behavior and transport of liquid degradation products that
wick into the coating during the LFC process. The insulating properties of
coating also control the dendrite arm spacing and appropriate cooling
rates need to be provided to obtain suitable strength and elongation
properties. The mechanical properties, permeabili ty and thermal

30
conductivity of coating are affected by the coating thickness, besides its
chemical and physical properties. Increasing coating thickness will
increase coating strength. At the same time, increasing coating thickness
will decrease coating permeability while also increasing the overall
thermal resistance of the coating [Tschopp et al. , 2002]. The coating
thickness can be optimized to obtain ideal permeability, wicking
properties, and thermal diffusivity of the coating by controlling the
coating viscosity and solids content [Tschopp, 2002].
REFERENCES
Alajbeg, A. and Stipak, B., (1985) “Thermal Decomposition of Polystyrene Foam under Controlled atmosphere and Temperature”, Journal of Analytical and Applied Pyrolysis, 283-306 Bennett, S., et al. , (2000) “Pyrolysis Defects in Aluminum Lost Foam Castings”, Transactions of the American Foundrymen's Society, Vol. 108: p. 795 - 804. Benning, C.J., (1969) “Plastic foams: the physics and chemistry of product performance and process technology”, vol. 1. New York: Wiley-Interscience Benson, R.S. et al. , (2004) ”Thermal and Morphological Characterization of EPS Foam and Relationship With Processing Parameters” Transactions of the American Foundry Society and the One Hundred Eighth Annual Metal casting Congress; Rosemont, IL; USA; pp. 1097-1112 Blihi, S. et al. , (1994) “Expandable beads “ Eur Pat EP63444 A2 Brown, J.R., (1992) “Lost Foam Casting Process”, Metals and Materials, Issue 8: p. 550 -555. Cai, M., (2002) “Physical and Chemical Analysis of the Thermal Degradation Products of Expanded Polystyrene Patterns with Short Thermal Exposures“ Transactions of the American Foundry Society and

31
the One Hundred Sixth Annual Casting Congress; Kansas City, MO; USA; pp. 1463-1481. Campbell, J. , (2000) “The concept of net shape for castings”, Materials and Design, p. 373 – 380 Chen, X., (2004) “ Characterization of porous media and refractory materials “ Ph.D. Thesis, University of Tennessee Crevecoeur J.J. et al. , (1999) “Water expandable polystyrene (WEPS) Part 1.Strategy and procedures “, Polymer Volume 40, Issue 13, Pages 3685-3689 Crevecoeur J.J. et al. , (1999) “Water expandable polystyrene (WEPS) Part 3. Expansion behavior”, Polymer, Volume 40, Issue 13, pp. 3697-3702(6) Goria, C.A. et al. , (1986) “Coating Permeability: A Critical Parameter of the Evaporative Pattern Process” , Transactions of the American Foundrymen's Society, Vol. 94: p. 589 – 600 Huntsman technical bulletin, (2001) “Introduction to Expandable Polystyrene”, 1-1.0 Krevelin, V., (1980) “Properties of Polymers”, 2nd Edition, Elsevier Scientific Publishing Company Kruse, T.M. et al. , (2002) “Mechanistic Modeling of Polymer Degradation: A Comprehensive Study of Polystyrene”, Macromolecules, 35, 7830-7844
Lee et al . , (2007) “ Polymeric foams” Chapter 3 1s t edition Littleton, H. et al. , (1997) “Process Control for Precision Lost Foam Castins - Part II” Foundry Management & Technology, 125(2): p. 41- 45. Liu, J. et al. , (1998) “A study of Foam-Metal-Coating Interaction in the LFC Process”, Transactions of the American Foundrymen's Society, Issue 105: p. 419 - 426. Shivkumar et al. , (1990) “The Lost-Foam Casting of Aluminum Alloy Components”, Journal of Materials, p. 38-44.

32
Smith, B.V., (1996) “Developing Lost Foam Casting Processes”. in BCIRA International Conference. Viking, Great Britain. Snijders, E.J., (2003) “Water Expandable Polystyrene (WEPS) Computational and Experimental Analysis of Bubble Growth” Ph.D. Thesis. University of Eindhoven Sonnenberg, F., (2003) “Recent Innovations with EPS Lost Foam Beads”, Paper 03-006 (11) Page 1 of 17, AFS Transactions, American Foundry Society, Des Plaines IL USA Stafford C.M. et al. , (1998) “Expansion of polystyrene using supercritical carbon dioxide: effects of molecular weights, polydispersity, and low molecular weight components”, Macromolecules 32 pp. 7610–7616. Sun, Y., (1992) “Investigation of Wetting and Wicking Properties of Refractory Coating in the EPC Process” , Transactions of the American Foundrymen's Society, Issue 100: p. 297 - 308. Tschopp, M.A. et al. , (2002) “Mechanisms of Misrun Formation in Aluminum Lost Foam Casting” Transactions of the American Foundrymen's Society, Vol. 110: p. 1371 - 1386. Tschopp, M.A., (2002) “Fluidity of Aluminum A356 in the Lost Foam Casting Process” Transactions of the American Foundrymen's Society, Vol.110: p. 1387 - 1398.

33
Chapter 3 Thermal degradation of EPS foam in LFC: Effect of Styrene

34
3.1 Introduction
Early modeling of the LFC process was done by Ohnaka [1993] and Sun et
al. [1996] simulating the effect of backpressure in the Lost Foam Casting
(LFC) process. Davami and Mirbagheri [2003] modified the advanced
solution algorithm (ASOLA-VOF) technique and a finite difference code
called FLOW3D developed by The Flow Science Institute [Nichols]
offered a mold filling simulation (Fig.3.1). Wang et al. [1993] modified
the existing computer program for simulation of a conventional sand
casting to simulate the fluid flow and heat transfer during mold filling.
Liu et al. [2002] developed a simple 1-D mathematical model predicting
Figure 3.1 Flow-3D modeling for LFC showing advancing metal front through collapsing EPS foam

35
metal front velocity and backpressure of decomposed gasses for the LFC
process. Recently Mirbagheri et al. [2006] proposed a model “capable of
considering the effect of various parameters, such as burning foam rate,
gas foam pressure, permeability and thickness of refractory coating and
foam density”. To date, available modeling of the LFC process takes into
account only heat transfer from the molten metal front and pressure from
the gaseous degradation products front neglecting any heat transfer or
dissolution effect from styrene. The simplifying assumptions associated
with the current modeling of LFC are presented below:
1. Thermal conduction inside the foam is ignored, assuming it is
negligible.
2. The foam is assumed to melt at a fixed temperature, instantly
releasing all i ts latent heat similar to the behavior of a pure
substance.
3. The complex physics at the metal foam interface, the formation of
liquid and gaseous products and the escape of volatiles through the
coating, foam and sand are all lumped into one single parameter-
the overall metal/foam heat transfer coefficient.
4. The advancement of the metal front is controlled by velocity, which
is derived from the rate of foam degradation. Foam degradation rate
is a function of specific heat and overall metal/foam heat transfer
coefficient.

36
The motivation behind the present study is to obtain better understanding
of the foam degradation behavior in order to generate higher accuracy in
modeling of the LFC process. The present study focuses on the effects of
styrene vapors on the morphological alteration of the EPS. Experimental
results are also presented describing the growth of temperature profile
inside intact foam.
The LFC process is considered to occur within a confined space with
permeable boundaries. During the process evolution of low molecular
weight degradation products is experienced. The flow dynamics of
polystyrene fractions and volatiles through the EPS patterns during mold
filling is affected by the physical and chemical heterogeneity in the
degrading pattern. The styrene vapors are absorbed by the EPS foam
pattern leading to morphological changes and opening up of fast diffusion
pathways [Benson et al. , 2004]. Fig 3.2 shows a neutron radiographic
image capturing generation and transmission of volatiles through these
fast diffusion pathways instead of a uniform degradation front within the
foam pattern. These paths lead to faster escape of volatiles from the mold
space that in turn is expected to govern the metal flow through the pattern
by altering the backpressure. As the styrene vapors are absorbed by EPS
foam, the glass transition temperature decreases and deformation occurs at
lower temperature. This is verified by differential scanning calorimeter
(DSC) experiments with PS samples exposed to styrene vapors. Under

37
Figure 3.2 Neutron radiography image showing formation of fast diffusion pathways in foam pattern during LFC [Luo and Penumadu, 2007]
casting conditions depolymerization of the collapsed polymer foam results
in formation of gaseous degradation products and significant amounts of a
partially depolymerized viscous residue. [Alajbeg, 1985; Cai, 2002] The
viscous residue consists of dimmer, trimer, tetramer and other oligomers
(see Table 2.3). Styrene comprises approximately 52% of the degradation
products as a result of PS depolymerization process. Many fused aromatic
ring compounds such as indene, naphthalene, phenanthrene, and some
with alkyl compounds are formed. In presence of air the oxidized
decomposition products formed is only about 2% of the total mixture.
Diffusion pathways

38
Oxygen entrapped inside the mold reacts with the polymer degradation
products to give rise to phenols, alcohols, aldehydes, ketones and benzoic
acid. Significant amount of partially depolymerized fragments may remain
inside the cast even after the mold has been filled. The gaseous
degradation products formed at the metal front at temperatures below
750ºC may consist primarily of monomer. At temperatures greater than
750ºC, the monomer molecules undergo additional fragmentation yielding
lighter hydrocarbons [Mehta, 1994]. The degradation of polystyrene is
known to be a multiple step process consisting of random chain scission
with generation of oligomers and unzipping of polymer chain with
generation of styrene monomer . The size of the oligomers and amount of
styrene generated during thermal degradation of polystyrene depend on
the temperature as well as the rate of temperature increase. At
temperatures between 300ºC – 400ºC, polystyrene has been reported to
yield approximately 45 wt% of styrene monomer [Cameron, 1967]. All
published research report that a considerable fraction of styrene shall be
generated during the LFC process. Styrene dissolves polystyrene and
styrene-oligomers to form a viscous liquid. The complete expulsion of the
liquid fractions from the mold cavity is determined by the molecular chain
sizes in the viscous liquid and their chemical and physical interaction
with the ceramic coating. For understanding the LFC process it is thus
essential to take into account the dissolution effects of styrene vapor on
the base EPS foam.

39
3.2 Theory
3.2.1 Comparison by the Hildebrand solubili ty parameter
The Hildebrand solubility parameter (δ) [Hildebrand, 1916] is a numerical
value that indicates the relative solvency behavior of a specific solvent at
25ºC. It is derived from the cohesive energy density of the solvent, which
in turn is derived from the heat of vaporization.
Hildebrand proposed the square root of the cohesive energy density as a
numerical value indicating the solvency behavior of a specific solvent.
21
][Vm
RTHc −Δ==δ (3.1)
where:
c=Cohesive energy density
ΔH=Heat of vaporization
R=Ideal Gas constant
T=Temperature
Vm = Molar volume
The cohesive energy density of a liquid is a numerical value that indicates
the energy of vaporization in calories per cubic centimeter, and is a direct
reflection of the degree of van der Waals forces holding the molecules of
the liquid together. For polymers the cohesive energy density as a
function of temperature is not available since the polymer undergoes
molecular degradation before it vaporizes at standard atmospheric

40
pressure. Thus the Hildebrand solubility parameters were determined by
experiments. Hansen [1967] divided the total Hildebrand parameter value
into three additive parts: a dispersion force component, hydrogen bonding
component, and a polar component given by equation 3.2.
δt2=δd2 +δp2 + δh2 (3.2)
where,
δt= Total Hildebrand parameter
δd= dispersion component
δp= polar component
δh = hydrogen bonding component
van der Waals forces result from the additive effects of the three types of
components viz. dispersion forces, polar forces, and hydrogen bonding
forces. Non-polar molecules, such as polystyrene, have strong
intermolecular attractions although dipole moment is negligible. Random
changes in electron cloud distribution cause mobile polar fluctuations
along the molecular chain. Although no permanent polar configuration is
formed, numerous temporary dipoles are created constantly, and
disappear. In two interacting molecular chains, random polarities in each
molecule tend to induce corresponding polarities in the other, causing the
molecular polarities to fluctuate together. These induced attractions are
called London dispersion forces, or induced dipole-induced dipole forces.
41
The degree of "polarity" that these temporary dipoles confer on a
molecule is related to the chain length. A longer molecule, i .e. a molecule
of higher molecular weight, shall have a greater number of temporary
dipoles, and thus greater intermolecular attractions.
In polar molecules dipole-dipole forces, called Keesom interactions, are
symmetrical attractions that depend on the same properties in each
molecule. Because Keesom interactions are related to molecular
arrangements, they are temperature dependent. Higher temperatures lead
to increased molecular vibrations and thus a decrease in Keesom
interactions. However, any molecule, even if non-polar, will be
temporarily polarized in the vicinity of a polar molecule, and the induced
and permanent dipoles will be mutually attracted. These dipole-induced
dipole forces, called Debye interactions, are not as temperature dependant
as Keesom interactions since the induced dipole is free to shift and rotate
around non-polar molecules.
A particularly strong type of polar interaction occurs in case of hydrogen
bonding. In such cases, the hydrogen's sole electron is drawn toward an
electronegative atom like oxygen or a halogen, leaving the strongly
charged hydrogen nucleus exposed. This exposed positive nucleus can
exert a considerable attraction on electrons in other molecules, forming a
protonic bridge that is substantially stronger than most other types of
dipole interactions. Hydrogen bonding and Debye interactions in

42
Polystyrene are negligible, and is only existent due to impurities and
presence of polar initiator molecules. The solubility parameter is a
numerical value that indicates the relative solvency behavior of a specific
solvent and is directly correlated to van der Wall’s interactions. [Jensen,
1984]
A 3-D graph can be plotted with the Hansen parameters forming the three
coordinate axes. The Hildebrand parameter for each solvent can be plotted
in this 3-D space by using the individual Hansen parameters as
coordinates. For a polymer a sphere called solubility sphere can be
geometrically constructed in this 3-D space. (Fig.3.3) The coordinates at
the center of the solubility sphere are located by means of three
component parameters ( d, p, h) of the polymer, and the radius of the
sphere is indicated, called the interaction radius (R). A polymer has a
high probability to be soluble in a solvent if the Hansen parameters for
the solvent lie within the solubility sphere for the polymer. In order to
determine this (without building a model) i t must be calculated whether
the distance of the solvent point from the center of the polymer solubility
sphere (DS - P) is less than the interaction radius for the polymer. Values of
R for different polymers have been experimentally determined by trial
with many different solvents and reported in li terature. Gharagheizi and
Angaji [2006] used intrinsic viscosities of the polymer in different
solvents and the molar volumes of the solvents to develop a correlation

43
Figure 3.3 Schematic illustrating the plotting of a solubility sphere in a 3-D Hansen plot Ideal solvent coordinates lie on the sphere surface while bad and good solvent coordinates lie outside and inside the sphere respectively
between Hansen parameters and the polymer interaction radius. The radius
of interaction for PS is R =12.7(MPa1 /2)
D(S-P) = [4(δds - δdp)2 + (δps - δpp)2 + (δhs - δhp)2]½ (3.3)
where
DS - P = Distance between solvent and center of polymer solubility sphere
∂xs=Hansen component parameter for solvent
∂xp=Hansen component parameter for polymer If the distance (DS - P)
Table 3.1 tabulates the values of the Hansen solubility parameters for
reagents under consideration. Comparing the calculated results in Table
3.2 it is evident that styrene is a stronger solvent for PS than either THF

44
Table 3.1 Solubility parameters for PS and solvents[Jensen, 1984]
Species δt((MPa1/2) δd(MPa1/2) δp(MPa1/2) δh(MPa1/2) Acetone 20 15.5 10.4 7 Tetrahydrofuran 19.4 16.8 5.7 8.0 Styrene 19 18.6 1 4.1 Water 47.8 15.6 16.0 42.3 Polystyrene 17.6 21.3 5.8 4.3
Table 3.2 Calculated distances from solvent point to center of solubility sphere
Solvent (s) (DS - P) (MPa1/2) Styrene (Athermal solvent) 7.26 THF (Good Solvent) 9.73 Acetone (Ideal θ solvent) 12.75 Water (Non solvent) 40.96
or Acetone. It should be noted that THF is a standard good solvent used
for different chemical analysis technique for PS including gel permeation
chromatography (GPC).
According to Flory, for a polymer-solvent system to be miscible
throughout the entire compositional range, the polymer-solvent interaction
parameter (χ) must be less than 0.522. The polymer-solvent interaction
parameter can be written as: [Mark, 1996].
χ = 0.34 +Vi
RTδi −δ j( )2
(3.4)
Where the enthalpic contribution χH is given by

45
χ H =Vi
RTδi −δ j( )2
(3.5)
Where Vi is the molar volume of the solvent i
R is the Ideal gas constant
T is the absolute temperature
δi is the total Hildebrand solubility parameter for the solvent i and
δj is the total Hildebrand solubility parameter for the polymer j
Using equation 3.5, the interaction parameter χ was calculated at various
temperatures and tabulated in Table 3.3. All values of interaction
parameter χ for the PS-styrene system within the calculated temperature
range are lower than the critical value of 0.5. This indicates that styrene
is a good solvent for polystyrene over the entire temperature range of
298K to 473K. Also it is important to note that χ decreases with
increasing temperature. At higher temperatures, interaction parameter
decreases favoring conditions for dissolution.
Table 3.3 Calculated Flory-Huggins Interaction Parameter
T (K)
χΗ χ
298 0.133 0.473
373
0.106 0.446
473 0.084 0.432

46
3.2.2 Behavior of polymer chains in solvents [Rubinstein and Colby,
2003].
“Linear polymer melts and concentrated solutions have practically ideal
chain conformation because the interactions between monomers are almost
completely screened by surrounding chains”. Considering ideal chain
behavior in a polymer melt, the mean end-to-end chain distance (‹Rm›)for
a polymer molecule will be given by
‹Rm2› ≈ C∞ n l 2 (3.6)
Where C∞ is Flory’s characteristic ratio, n is the number of main chain
bonds and l is the bond length.
In a Polystyrene melt with molecular weight of Mw=200,000, n≈ 2,000,
C∞ = 9.5 and 1.54Al =o
the mean end-to-end distance for a chain is
estimated to be
Rm = 212.3 Ao
A good solvent for a polymer is defined as one in which a polymer chain
coil swells in order to maximize the number of polymer-fluid contacts. A
polymer chain coils in good solvent has larger size while in a
thermodynamically bad solvent they behave like solid spheres. Flory's
Theta solvent marks the boundary between the good and bad solvents.

47
Considering acetone as a Theta solvent for PS at room temperature and a
semidilute solution the mean end to end chain distance(Ro) is given by
Ro = bn1/2 (3.7)
where b is the Kuhn length for monomer styrene.
For PS with n = 2,000 and considering b = 18 Ao
we get
Ro = 805 Ao
When a polymer repeat unit is chemically identical with the solvent, there
are practically no energetic interactions between the solvent and a solute
and the solution behaves as an athermal solution where the excluded
volume (v) of the polymer becomes independent of temperature. PS in
styrene monomer forms an athermal solution where the mean end-to-end
chain distance is given by
0.588aR bn≈ (3.8)
For PS considering b = 18 Ao
and n = 2,000 we get
aR ≈ 1571.4 Ao
= 0.16μm
Thus the estimated swelling ratio for a polystyrene chain dissolved in
styrene is given by

48
/ 7.4a mR R ≈
Polymer chains begins to overlap when their volume fraction ϕ exceeds
the volume fraction of repeat units inside each isolated coil, called the
overlap concentration ϕ*.
ϕ* = nb3/Ra3 (3.9)
For PS under consideration ϕ* = 0.003 or 0.3%
Mehta and Shivkumar had indicated the possibility of achieving maximum
of 80% styrene under the lost foam casting conditions. [Mehta, 1994].
Considering a minimum of 0.3% of polystyrene in solution with styrene, it
is evident that in case of LFC the semi-dilute regime with chain overlap
shall be experienced. The analysis of polymer chain swelling is critical in
understanding the expulsion mechanism of viscous liquid residue through
the LFC ceramic coating and thus can provide valuable information for
modeling the LFC process.
3.3 Experimental
Materials
The EPS foam patterns were obtained from a supplier in the shape of
plates of dimension 80x60x8 mm. Sections of these plates were used to
investigate the effects of styrene and infrared radiation on the
morphology. Styrene monomer of high purity (≥ 99%) was purchased

49
from Sigma-Aldrich. Sections of foam were also used to obtain
temperature profiles inside foam when subjected to heating by infrared
radiation. EPS foam pattern was coated with ceramic coating to obtain a
lost foam mold for partially filled casting experiment.
3.3.1 Exposure to Infrared Radiation
Sections of EPS foam samples were exposed to radiation from molten
aluminum (Al 356 alloy) maintained at 750oC in a cylindrical furnace
(Fig. 3.4). The heat source was positioned vertically at a distance of
approximately 10” below the horizontally positioned EPS foam plate. The
Fig.3.4 Experimental setup for exposure of EPS to thermal radiation

50
Fig. 3.5 Schematic of experimental setup for exposure to styrene vapor
3.3.2 Exposure to Styrene Vapor
radiation source was circular in geometry with a diameter of 2”. Time of
exposure was varied manually by using a stopwatch. A glass cylinder of
dimensions 8” x 3” as shown in Fig.3.4 was used to obtain a separation
distance of 10” between the radiation source and EPS foam samples.
Sections of EPS samples were exposed to styrene vapor emanating from
boiling styrene at 145oC. A volume of 10ml of styrene monomer was
taken in a 4” diameter glass Petri dish. A glass cylinder (See Fig. 3.5) of
dimensions 8” x 3” was used to provide a separated volume to generate
saturated styrene vapors. The cylinder was covered with a metal plate
which was manually replaced quickly by sample EPS plates, on

51
observation of simultaneous signs of boiling and condensation of styrene
vapors inside the glass cylinder, indicating saturation by vapors. Exposure
time was varied manually using a stopwatch. DSC experiments were
carried out with samples collected from exposed EPS foam to check for
alterations in glass transition temperature due to plasticization effect of
styrene of PS. A Mettler DSC 821 was used. The heating rate was
10oC/min and for each sample two heating runs from 30oC to 120oC were
recorded with 100 ml/min N2 as the purge gas. An isotherm at 30oC was
run for 15 minutes to obtain thermal equilibrium within the sample.
Indium was used for temperature and heat of fusion calibration.
The morphological changes related to exposure to styrene vapor were
documented using scanning electron microscope. A Leo Scanning
Electron Microscope 1525 was used to study the morphological changes of
the EPS foams exposed to radiant heat and styrene vapor. All micrographs
were obtained using voltage of 20.K volts.
3.3.3 Partially Filled EPS Foam Pattern
The samples were generated by partially filling the lost foam molds
during the lost foam casting process. After cooling the remaining EPS
foam patterns were removed and subjected to Gel Permeation
Chromatography (GPC) analysis to obtain for changes in the molecular
characteristics such number average molecular weight, weight average
molecular weight and molecular weight distribution. GPC analysis was

52
performed on sections removed from the partially degraded pattern (Fig.
3.6, Fig. 3.7). The samples were measured using a Waters modular GPC.
Temperature of column and detector were kept at 40oC. Solvent was THF
at 1ml/minute with an injection volume of 50ml and a sample
concentration of 2 mg/ml. The columns were calibrated with Toyo Soda
polystyrene standards.
3.3.4 Measurement of Temperature Distribution inside Intact Foam
An experimental setup, consisting of a radiant heat source, thermocouples
and a data acquisition device was used to obtain one dimensional
temperature profile inside square section foam samples. Foam samples of
different steam time were first characterized for morphological variations
using SEM imaging. Foam samples were cut out from patterns of different
steam time with a surgical blade, dimensions of samples being 3.81 cm x
1.27 cm x 1.27 cm. One of the square surfaces was kept as original
pattern surface and marked as Top Surface. The other surfaces were then
wrapped with insulating tapes to approach a one-dimensional heat flow
model. Six graduations were marked on the insulation surface at
separations of 0.3175 cm starting from the Top Surface. A center-line
was drawn and 0.625 cm deep holes were drilled into the sample with
8mm drill bit. Six thermocouples (30 gauge) were inserted into the holes
while one was placed on the Top Surface with the welded junction
inserted into the foam. The Thermocouples were marked and fed into a

53
Figure 3.6 a. partially filled EPS foam pattern; b. close-up view of the degrading front
Figure 3.7 Position of the samples selected for used GPC studies
54
Temperature Measurement system (SCXI-100 by National Instruments).
The Temperature measurement system consists of a Terminal Block
(SCXI-1303) with Thermistor Cold Junction Compensation, A Signal
Conditioning Module (SCXI-1202), a DAQ board (PCI6035E) and Data
Logger Software. The radiant heat source was a stainless steel cylinder
with a 500W heating element connected to a temperature control system.
The sample was mounted on a cylindrical base using double-sided tape.
The heat source was secured above the sample with a separation distance
of 1” (See Figure 3.8). The distance between the heat source and foam
surface was kept constant and temperature of the heat source was steadily
increased from 150°C to the temperature when first sights of bead
deformation were seen at the foam Top Surface . The foam was then
allowed to cool by cooling the heat source and allowing the foam to reach
a steady state (see Fig. 3.9).
The temperature at which the first signs of bead collapse occurred
(critical surface temperature, Tsc) was noted and temperature distribution
in the foam corresponding to that particular surface temperature was
plotted.
3.4 Results and discussion
3.4.1 Morphological Changes
Recent investigations from our laboratory clearly provide support for
difference in morphological changes in EPS foam patterns subjected to
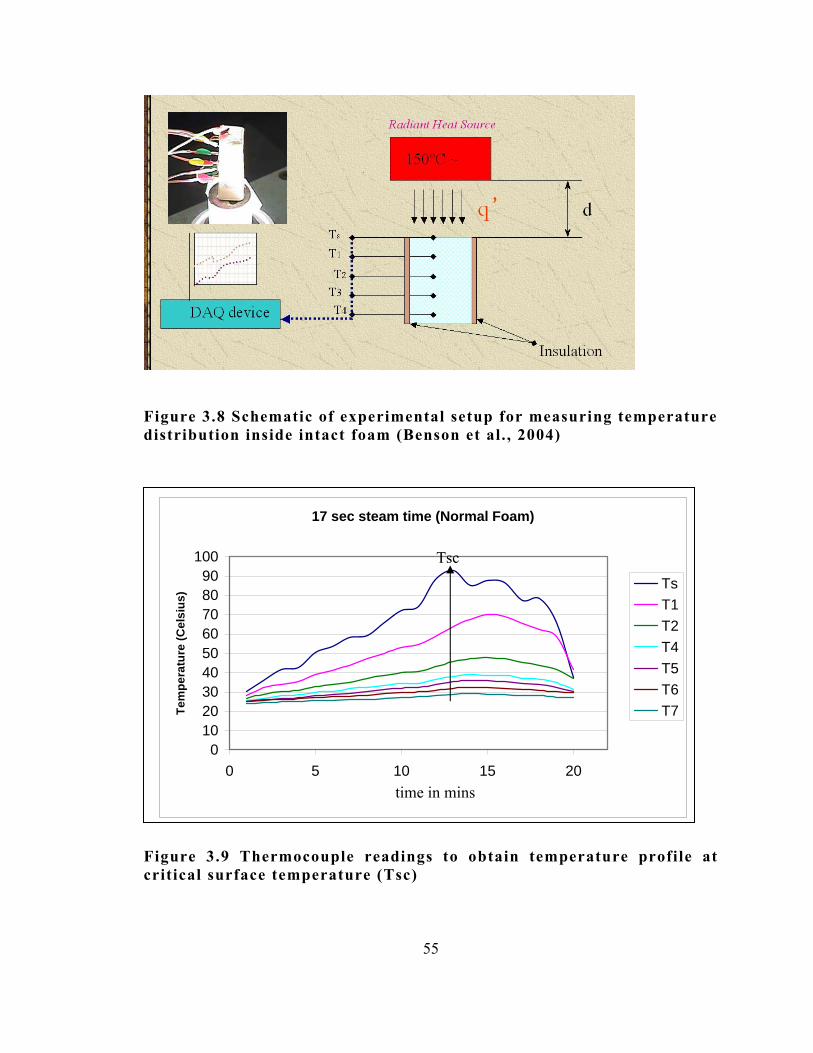
55
Figure 3.8 Schematic of experimental setup for measuring temperature distribution inside intact foam (Benson et al. , 2004)
Figure 3.9 Thermocouple readings to obtain temperature profile at critical surface temperature (Tsc)
17 sec steam time (Normal Foam)
0102030405060708090
100
0 5 10 15 20time in mins
Tem
pera
ture
(Cel
sius
) TsT1T2T4T5T6T7
Tsc

56
radiant heat and styrene vapors. The morphological changes from
exposure to thermal radiation and styrene vapors are presented in Fig.
3.10. The EPS foam samples exposed to infrared radiation at 750oC
exhibits morphological changes that include reduction in bead size and
separation at the junction between fused beads. The morphological
changes generated by thermal radiation were observed approximately 2
seconds after initial exposure to the source. Expanded bead structure
collapse has been reported to be noticeable above 140 - 150oC. The
average bead size for a polymer with density of 0.021 g/cc decreases from
1.4 mm at 140oC to 0.5 mm at 200oC. The average beads return to their
unexpanded size at approximately 250oC. At 260oC the beads melt to
produce a viscous residue [Mehta, 1994].
The morphological alterations observed in EPS foams exposed to thermal
radiation and styrene vapor are markedly different. The irradiated foam
shows a pattern with distinct contraction of the beads. The morphology of
the EPS foams exposed to styrene vapor exhibit highly distorted beads
attached through a fibril-like structure. Morphological changes induced by
exposure to styrene vapor occur over a similar period of time although the
temperature of the styrene source was only at 145oC compared to the
molten metal source at 750oC. This is expected since styrene is a solvent
for polystyrene and its absorption should lead to loss of EPS structural
integrity.

57
Figure 3.10 SEM micrograph showing morphological changes in of EPS foam exposed to: (a) infrared radiation from a 2” diameter cylindrical source of Aluminum at 750ºC for 2 sec. (b) same thermal conditions for 4 sec. (c) for 8 sec. (d) Styrene vapor for 2 sec. (e) Styrene vapor for 4 sec. (f) Styrene vapor for 8 sec.
da
b e
f c

58
3.4.2 Changes in glass transition
Solvents can drastically reduce the glass transition of a polymer [Mark,
1996]. The absorption of styrene by the EPS foam lowers the glass
transition temperature (Tg) of polystyrene through a plasticizing effect.
The decrease in the Tg should support structural collapse of foam during
the LFC. The DSC result shown in Fig.3.11 clearly depicts absence of Tg
step near 100oC in the foam samples exposed to styrene vapor for 4 sec
and 8 sec. Evidence from neutron radiography images obtained during real
time pouring of metal studies and image analysis results indicate the
presence of a gap between the position of the foam and metal front. (Fig
3.2) In the case of partial filling a similar gap between the fronts of the
solidified metal and PS pattern was observed (Fig 3.6). This gap can only
be justified if the rigid foam pattern never comes in direct contact with
the molten metal.
Thus the morphological changes in the PS foam pattern are due to contact
with volatile degradation products. Current studies in modeling of LFC
process also support this justification. [Liu, 2002; Cai, 2002; Mirbagheri,
2006]
3.4.3 Molecular Weight Analysis by Gel Permeation Chromatography
The concentration of styrene monomer for foams samples obtained from
the partially filled patterns exhibits position dependence.

59
Figure 3.11 Sample DSC results showing (a) Tg at 101C for intact foam and (b) broadening of Tg for Foam exposed to styrene vapors for 4 sec (c) for 8 sec
c
b
a

60
The higher concentration of styrene is obtained from position closest to
the metal front. Decrease in styrene concentration is obtained for samples
taken middle and back position. Comparison of the molecular weights of
samples taken from the same three positions presented in Table 3.4 clearly
indicates that samples closest to metal front undergo reduction in the
molecular weigh and broadening of the molecular weight distribution.
The molecular weights of samples taken from position (middle and back)
further away from the metal front remained unchanged (Table 3.4). The
molecular weight and styrene concentration of the unmodified polystyrene
foam remains constant (Table 3.5). These results indicate the presence of
a styrene concentration gradient within the foam during lost foam casting.
This observation is expected since the LFC process is performed in
confined space and polystyrene is known to yield at least 40% styrene
monomer upon thermal degradation [Grassie, 1956]
3.4.4 Temperature Distribution inside intact foam
Foams of three different steam times were used in this experiment. The
morphological variations in the cellular structure in these foams are
evident from SEM imaging (Fig. 3.12). The temperature distribution within
the foams prepared at steam times of 11, 17, and 20 seconds is
summarized in Table 3.6. The temperatures provided in the Table 3.6
represent the actual reading of the thermocouples at the initiation of bead
collapse (Tsc) at surface. The temperature distribution clearly exhibits a
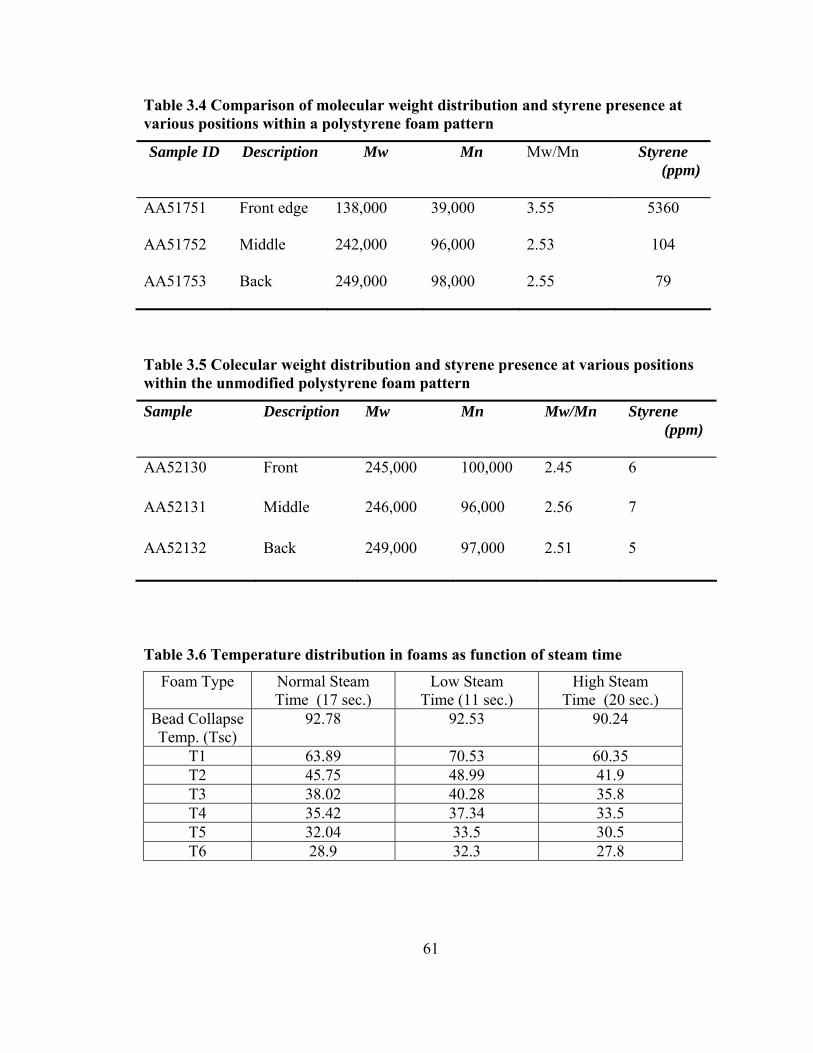
61
Table 3.4 Comparison of molecular weight distribution and styrene presence at various positions within a polystyrene foam pattern
Sample ID
Description
Mw
Mn
Mw/Mn
Styrene (ppm)
AA51751
Front edge
138,000
39,000
3.55
5360
AA51752
Middle
242,000
96,000
2.53
104
AA51753
Back
249,000
98,000
2.55
79
Table 3.5 Colecular weight distribution and styrene presence at various positions within the unmodified polystyrene foam pattern
Sample
Description
Mw
Mn
Mw/Mn
Styrene (ppm)
AA52130
Front
245,000
100,000
2.45
6
AA52131
Middle
246,000
96,000
2.56
7
AA52132
Back
249,000
97,000
2.51
5
Table 3.6 Temperature distribution in foams as function of steam time
Foam Type Normal Steam Time (17 sec.)
Low Steam Time (11 sec.)
High Steam Time (20 sec.)
Bead CollapseTemp. (Tsc)
92.78 92.53 90.24
T1 63.89 70.53 60.35 T2 45.75 48.99 41.9 T3 38.02 40.28 35.8 T4 35.42 37.34 33.5 T5 32.04 33.5 30.5 T6 28.9 32.3 27.8

62
Figure 3.12 SEM images of EPS cellular structure as a function of steam time. (a) Low steam time (underexpanded, 11 sec). (b) Normal steam time (Optimum expansion, 17sec). (c) High steam time (Partial collapse after maximum expansion, 20 sec) [Benson, et al. 2004]
a
c
b

63
Table 3.7 Characteristic thermal properties of foam using the proposed model
Foam Type Low Steam Time
Foam (11 seconds) Normal Steam Time Foam (17 seconds)
High Steam Time Foam (20 seconds)
Cell Collapse Temp. (Tsc)
92.53 92.78 90.24
A -31.87 -32.482 -32.79 B 84.541 90.34 88.053 Correlation Coefficient 0.9491 0.9679 0.9637
dependence on the steam time. The temperature distribution data that was
experimentally obtained was modeled using simple mathematical
expression to characterize the foams. The mathematical expression was
chosen to represent the foam property using two parameters (A and B) and
Tsc. The result of the mathematical analysis is presented graphically in
Figure 3.13 and the corresponding parameters are tabulated in Table 3.7.
The parameters A and B are envisaged as having the potential use in the
future characterization of foams.
3.5 Conclusions and future recommendations
Theory and experimental results from morphological study, GPC and DSC
prove that styrene is an athermal/good solvent for polystyrene and its
effect is significant in the degradation mechanism of the foam pattern and
thus casting quality in LFC. The effect of styrene has to be accounted for
in developing a comprehensive model for the LFC process.

64
y = -32.482Ln(x) + 90.34R2 = 0.9679
y = -32.794Ln(x) + 88.053R2 = 0.9637
y = -31.87Ln(x) + 84.541R2 = 0.9491
2030405060708090
100
0 1 2 3 4 5 6Thermocouple positions along length of sample
Tem
pera
ture
(Cel
sius
)
Log. (+3 (20 sec) foam) Log. (Normal (17 sec) Foam) Log. (-6(11 sec) foam)
Figure 3.13 Temperature distribution within intact foam as a function of processing conditions
Morphological and thermal characterization of intact foam clearly shows
the variation of temperature profiles within intact foam as a function of
steam time. Experimental parameters were developed for characterizing
EPS foam for different steam times.
Future recommendation includes research and development of constitutive
models accounting for styrene dissolution effects in LFC process at
various temperatures. Contributions in the field of modeling the LFC
process would be to generate an overall heat transfer coefficient as a
modeling parameter that takes into account the dissolution effect of
styrene. The thermal conductivity and diffusivity of the intact foam as

65
well as that of the “kinetic zone” can be experimentally determined and
can be included as modeling parameters. A transient plane source
technique (Eg. Hot disk, http://www.hotdisk.se/) is recommended for
measurement of thermal properties for different zones of the degrading
foam. The radiation effects from the degrading front should be considered
instead of the radiation from the molten metal front in order to determine
the velocity of the receding rigid foam front.
REFERENCES Alajbeg, A. and Stipak, B., (1985) “Thermal Decomposition of Polystyrene Foam under Controlled atmosphere and Temperature”, Journal of Analytical and Applied Pyrolysis, p.283-306 Cai, M., (2002) “Physical and Chemical Analysis of the Thermal Degradation Products of Expanded Polystyrene Patterns with Short Thermal Exposures“ Transactions of the American Foundry Society and the One Hundred Sixth Annual Casting Congress; Kansas City, MO; USA; pp. 1463-1481. Cameron, G. G. and MacCallum, J. R., (1967)“Thermal Degradation of Polystyrene”, J. Macromol. Sci., Rev. Macromol. Chem., C1(2), 327 Champion, R. P., (2000) “Permeation Through Polymers for Process Industry Applications”, Materials Technology Institute, Inc., p7 Davami, P and Mirbagheri, S.M.H., (2003) “Simulation of mould filling in Lost Foam casting”, Journal of Cast Metals Res 16 (5), pp. 1–12. Flory, P.J., (1953) “Principles Of Polymer Chemistry”, Cornell University Press (pg. 596) Grassie, N., (1956) Chemistry of High Polymer Degradation Processes, Interscience Publishers, Inc. N.Y. p.79
Hansen, C.M., (1967) “The Three-Dimensional Solubility Parameter and Solvent Diffusion Coefficient”, Ph.D. Thesis Danish Technical Press, Copenhagen, Denmark, Copenhagen

66
Hildebrand, J.H., (1916) “Solubility”, Journal of American Chemical Society, 38 (1916) 1452 Krevelin, V., (2003) “Properties of Polymers”, 3rd Edition, Elsevier Scientific Publishing Company Mark, J.E., (1996) “Physical Properties of Polymers Handbook”, American Institute of Physics, Woodbury, NY. Mehta S,. and Shivkumar, S., (1994) “Thermal degradation of foamed polymethyl methacrylate in the expendable pattern casting process “, J. of Materials Engineering and Performance, 3(3), 329 – 333 Mirbagheri, S.M.H. et al. , (2006) “Modelling of foam degradation in lost foam casting process”, Materials & Design Volume 27, Issue 2, Pages 115-124 Liu, Y. et al. , (2002) “Defects of EPC casting”, J. Mater Sci 37, p. 2997 Luo, X., Penumadu, D., (2007) “Visualization of the Multiphase Flow in the Lost Foam Casting Process by Neutron Radiography and Image Processing”, Materials Science and Technology Conference, Detroit, MI Nichols, B.D. and Hirt C.W. “FLOW3D”, software, Flow Science, Inc. Available from: http://www.flow3d.comhttp://www.flow3d.com. Ohnaka, I. et al. , (1993) “Modeling of Fluid Flow and Solidification in Casting“ Proceedings of the 6th international conference on modeling of casting, welding and advance solidification , p. 337. Sun, Y. et al. ,(1996) “Measuring foam gas pressure in cast iron”, AFS Transactions 104, p. 271. Wang, C.M. et al. , (1993) editors. “Proceedings of the 6th international conference on modeling of casting, welding and advance solidification” (MMMS);. p. 477

67
Chapter 4 Novel expansion process for polystyrene
68
4.1 Introduction
4.1.1 Motivation and Objectives
Generally spherical, expandable polystyrene beads are prepared from
liquid monomer suspended in an aqueous medium, containing an
expansion agent. The most common expansion agents used are pentane
isomers which are liberated into the atmosphere. These blowing agents are
classified as green house gases [Greenhouse Gas Technology Center
Southern Research Institute, 2002] and volatile organic compounds (VOC)
that contribute to smog. VOC also contribute to the generation of lower
stratospheric ozone [Snijders, 2003]. Pentane emissions from EPS
producing plants are generally uncontrolled. As an example the following
text is quoted from a recent report from Environmental Protection Agency
(EPA) while reviewing the compliance of two expanded polystyrene (EPS)
producing plants. “Two of these plants gave fairly extensive information
and, of these, one reported an overall uncontrolled VOC emission rate of
9.8 g/kg of product. For the other, an overall uncontrolled VOC emission
rate of 7.7 g/kg is indicated.” [EPA, 1983 a, b] A major disadvantage of
pentane isomers is their low flash point and high evaporation rate (see
Table 4.2). Pentane isomers are five carbon saturated hydrocarbons and
are excellent fuels with heat of combustion of 48.8 kJ/gm for n-pentane.
(In comparison, octane, an eight carbon saturated hydrocarbon and a
standard automobile fuel has heat of combustion value of 47.9 KJ/gm)
[CRC Handbook, 2006-07]. Since pentane forms explosive mixtures with

69
air, precautions must be taken whenever it is used. “For example, after
storage containers are opened, a time lag of 10 minutes is suggested to
allow fumes or pentane vapors to dissipate out of the containers. Care
must be taken to prevent static electricity and sparks from igniting the
blowing agent vapors” [Benning, 1969]. Three general classes of pentane
emissions from EPS foam production are as follows:
“manufacturing emissions; prompt foam cell losses, which are losses that
typically occur during storage and shipping; and banked emissions, which
are losses that occur through slow diffusion of blowing agents out of the
foam over the life of the product” [EPA, 1990]. In coming years the
polymer industry will be forced by new regulations to drastically reduce
the level of VOC emission [Snijders, 2003].
The current production process of foam uses steam as the energy source
for expansion of solid polystyrene beads. The machinery associated with
steam generation and transmission takes up a substantial floor space as
well as ceiling space in ducting. It is a common industrial practice to
reduce components in the process chain through industrial engineering
design since lesser components decrease maintenance cost, probability of
process shut down due to component failure and probability of product
rejection due to defect (See Fig 4.1). A list of gaseous emissions
originating in the existing process of manufacturing of EPS foam is
presented in Table 4.1 [Boustead, 1999]. Protection of industry human

70
Figure 4.1 Schematic showing current process of steam generation and transmission as a multi step process.

71
resource and reduction of flammable emissions require expensive plant
ventilation and gas collection systems. An appropriate approach for
reducing the health hazards associated with production of EPS foam is to
replace currently used expansion agents. A chemical reagent that is
benign, recyclable and susceptible to selective heating by appropriate
electromagnetic (EM) radiation has been identified and its
infusion/dispersion during polymerization of styrene to PS with target
molecular weight and distribution has been developed in this study.
Heating by EM radiation would lead to a fast (induction) volumetric
heating in comparison with the slower diffusion heating (conduction) that
takes place from the surface of the polymer beads to the core, in the
current industrial process of polystyrene bead expansion. An identical
principle is applicable during the molding process where microwave
radiation may be used to expand the pre-expanded beads further, until
fusion of beads occurs, to produce rigid foam. Development of a novel
production process that would eliminate the intermediate pre-expansion
step and carry out the entire expansion and fusion process inside the mold
is recommended in section 4.6 of this chapter. This new process is
expected to lead to an environmentally friendly, economic and efficient
production process, reducing raw material cost, cost of maintaining
stringent safety standards and reducing shop floor space.
Sn i jders , [2003] i n her doc to ra l thes i s p resen ted exper imenta l and

72
theoretical work on a novel expansion method for polystyrene using water
as an expansion agent. The problems associated with this method have
been described earlier in Chapter 2. Meyer and Kinslow [1991] developed
the foaming of polystyrene using supercritical CO2. “Supercritical CO2 is
a non-toxic, environmentally benign solvent with a unique ability to
diffuse rapidly through small voids because of its high diffusivity and
negligible surface tension” [Abbett et al, 2003]. Expansion using
supercritical CO2 is mainly based on extrusion principles and is ideal for
making foam of simple geometry like boards and pellets [Meyer and
Kinslow, 1991]. Recently, a microwave foaming process has been
described for making molded starch foams from extruded pellets [Zhou,
2004]. The study presented in this dissertation is another PS foaming
technological development for making rigid EPS foam of complex
geometry, with an alternative approach that addresses environmental
issues of greenhouse emission and provides a mechanism to overcome
problems faced when water was used as an expansion agent.
From the perspective of LFC, it has been reported that the morphology of
the cellular foam and variations in local density drastically affects foam
degradation and thus the quality of the casting [Benson, 2004]. For
example “patterns having a low degree of fusion degraded with an average
recession velocity of 2.8 cm/s, about 25% faster than the normally fusion
patterns” [Sun, 2005] . A novel method for foam production is hereby

73
Table 4.1 Gross gaseous emissions arising from the production of 1 kg of EPS. [Boustead, 1999]
Emission Total in gm. Dust 1.8 CO 1.6 CO2 2,500 SOX 9.7 NOX 12
*Hydrocarbons 4.5 *Methane 9.5
* Byproducts from commercial expansion agents.
investigated to achieve a cellular morphology and overall foam uniformity
that may contribute to a better control over metal flow during LFC and
thus reduce flow related casting defects.
In summary, the objectives of the developed technology are to:
1. Identify a benign expansion agent that can be heated by microwave
radiation
2. Maximize recovery and recycling of a novel expansion agent
3. Maximize efficiency with microwave radiation as volumetric
heating source
4. Minimize workshop space with microwave expansion
5. Minimize maintenance cost by single component design
6. Eliminate cost of expensive tooling and stainless steel molds by
using economic radiation transparent thermoset polymer or glass
molds
74
4.1.2 Selection of the expansion agent
Many different organic solvents were considered as potential expansion
agents. Non-polar molecules such as aromatic hydrocarbons (e.g.
Benzene, Toluene, Diethyl Ether) were excluded due to their toxicity and
incompatibility with microwave heating. Organic solvents like aldehydes,
ketones and halogenated hydrocarbons (e.g. Methyl Ethyl Ketone,
Methylene Chloride and Chloroform) were rejected due to their toxicity,
volatility and/or high flammability. Alcohols were selected for the study
based on their volatility, flammability, boiling point, toxicity and
commercial availability. 2-butanol, 2-propanol and ethanol were
identified as the most appropriate expansion agents. Experiments were
conducted using 2-butanol as a model expansion agent. The criteria for
selection of 2-butanol as an expansion agent is mentioned below:
Pure 2-butanol boils at 99°C, which is close to the glass transition
temperature of polystyrene, which is approximately 100°C. This
temperature correlation is used as a fundamental principle to obtain
expansion using selective heating by electromagnetic radiation. The 2-
butanol phases volumetrically absorb EM radiation and heat the polymer
matrix through conduction. As the liquid 2-butanol changes phase to gas
above its boiling point, the polymer matrix simultaneously reaches the
glass transition and becomes rubbery, allowing the gaseous phase to
expand the matrix under a pressure differential.

75
2-butanol is an alcohol with a dipole moment of 1.8 Debye (water 1.8546
Debye) [CRC Handbook, 2006-07] and is thus susceptible to microwave
heating. Alcohols have a very distinct infrared absorption band for wave
numbers in the range of 3200 cm-1 and 3600 cm-1. Thus selective heating
by IR sources in addition to microwave is also a possibility. It should be
noted that the heating mechanism using IR radiation is by selective
absorption of energy, which is fundamentally different from heating
mechanism in case of microwave radiation. Microwave heating uses the
principles of ionic conduction and molecular interaction through dipole
rotation. Fundamental aspect of microwave heating is explained in section
4.2.2. 2-butanol was found to be completely soluble in the styrene
monomer and it has been shown in this study that 2-butanol is soluble in
polystyrene of a target molecular weight, below a critical saturation
concentration. This principle was used to achieve polymerization induced
phase separation (PIPS). The phase separation is expected to produce
morphology with an even distribution of the spherical alcohol phase
(droplets) within the polymer matrix. Chan and Rey [1996] described the
process of condensation polymerization of a tri-functional monomer in
presence of an inert and low molar mass solvent. Their model proposed
spherical phase separated morphologies distributed in a polymer matrix.
Unlike pentane isomers (current expansion agent), 2-butanol is a
nonvolatile, low flammable and nontoxic organic alcohol (Table 4.2) In
76
addition 2-butanol can be easily recovered and recycled by using a room
temperature trap, due to its high boiling point and low volatility. In
addition economic benefits could be achieved due to relaxation of the
rigorous flammable safety standards, currently practiced in the EPS foam
industry. The molar mass of 2-butanol (74.12gm/mol) is very close to the
molar mass of pentane (72.15gm/mol). The higher boiling point and lower
volatility of 2-butanol is due to the hydrogen bonding present as a result
of the hydroxyl group. The high molar mass accounts for slower expulsion
of 2-butanol from PS matrix as compared to water in WEPS. High rate of
water escape through PS at elevated temperatures (above Tg) leads to
loss of blowing agent without foaming.
4.2 Background theory:
4.2.1 Polymerization Induced Phase Separation (PIPS)
When a polymerization reaction is carried out from a monomer, in the
presence of a miscible oligomer, a soluble polymer or a small molecule
like a solvent, a phase separation process usually occurs as the
polymerization proceeds. This leads to phase separated morphologies and
distribution of the separated phases depending strongly on the initial
composition, reaction kinetics and thermodynamics (Fig.4.2).
PIPS can occur via two different modes, namely Spinodal Decomposition
(SD) and Nucleation and Growth (NG). NG process can be subdivided

77
Table 4.2 Relevant physical properties of 2-butanol compared to n-pentane [CRC Handbook; SIRI MSDS]
Name 2-butanol n-pentane
Molecular Formula
C4H10O
C5H8
Molecular weight gm/mol
74.12 72.15
Boiling Point 99°C 36°C
Specific gravity 0.808 0.626
Flash point 26° C - 49°C
Explosion limits 1.7% - 9.8% 1.4 %-8.3%
Auto ignition temperature
405° C 260° C
Evaporation rate Butyl acetate = 1
0.67 28.6
Vapor pressure at 99°C in mm Hg
797 882
Loss Tangent at 2.45 GHz
0.447 0
General Toxicology Irritant by inhalation, ingestion or through skin absorption.
Harmful by inhalation, ingestion or skin absorption. Irritant. Narcotic in high concentration.
Risk Phrases Flammable Irritating to eyes, skin and respiratory system
Extremely flammable Harmful by inhalation, to skin, if swallowed
Toxicity Oral- rat- concentration 50 percent kill 2193 mg kg-1
Inhalation-rat-lethal concentration 50 percent kill 364 gm/m3/4hr

78
Figure 4.2 Illustration showing expansion of polymer bead using novel concept
into homogeneous and heterogeneous nucleation and growth. PIPS by SD
mechanism takes place by a continuous and spontaneous process and the
developed morphologies generally display a co-continuous connected
structure. NG mechanism on the other hand is a slower random process
that takes place at the metastable region of a phase diagram of the binary
mixture, and is characterized by non connected separated phases
[Rubinstein, 2003]. NG rate has a high dependence on the interfacial
tension between the polymer and the separating phase. It has been
reported in case of rubber modified epoxy, that for an interfacial tension
value of γ1 2 = “0.4mN/m practically no phase separation occurs by the
nucleation-growth mechanism, and demixing proceeds by spinodal
decomposition.” [Verchere et. al. , 1991].
Polymerization-induced phase separation is used in practice to synthesize
Polymer matrix is heated via conduction from 2-butanol
h
hν
2-butanol absorbs radiation selectively
Polymer matrix reaches glass transition and 2-butanol reaches boiling point simultaneously
Solid bead expands to form expanded foam bead.

79
useful materials such as high-impact polystyrene (HIPS), rubber-modified
thermosets, thermoplastic-thermoset blends, polymer-dispersed liquid
crystals, thermally reversible light scattering films and nanostructured
thermosets. The morphology and dynamics of polymerization-induced
phase separation in the initially homogeneous solution of a non-reactive
component in reactive monomers have been investigated by Luo (2006).
In PIPS, instability of the system has been reported to be driven by the
progressive increase of the average molecular weight of the polymerizing
species [Verchere et. al. , 1991]. After initiation of polymerization, the
non-equilibrium phase separated structure will manifest depending on the
competition between phase separation dynamics and polymerization
reaction kinetics [Luo, 2006]. Rey and co workers used numerical
analysis of PIPS based on an idealized assumption of reaction-driven
phase separation using time-dependent Cahn–Hillard (CH) equation.
The CH equation for the rate of change of polymer volume fraction ϕ1 is
given by
112
1
. . Ft
ϕ δδϕ
∂= ∇ Λ ∇
∂ (4.1)
where F is the Flory-Huggins free energy of mixing, 12Λ is the mutual
diffusion coefficient that can be expressed in terms of the self diffusion
coefficients of the individual polymer and solvent. They showed that both
the spatial distribution and morphology in PIPS are sensitive to the
magnitudes of the diffusion coefficient and reaction rate constant. [Oh

80
and Rey, 2000]. Kyu and Lee reported time-resolved light scattering
results for the case of PIPS of methylene dianiline in carboxyl terminated
polybutadiene acrylonitrile. They observed reduction of the initial length
scale at the early period of the reaction. By incorporating the
polymerization kinetics into the Cahn–Hilliard equation, they analyzed
the dynamics of phase separation and attributed the phenomena of
reduction of the initial phase separated length scale to nucleation initiated
spinodal decomposition (NISD). In their later experiments, the reduction
of initial length scale was considered as criterion whether the phase
separation goes through the nucleation growth (NG) mechanism or not
[Kyu and Lee, 1996]. However, Luo reported that NISD was not the
unique mechanism for the reduction in initial length scale of separated
phase and the evidence for NG mechanism cannot be directly concluded
by observation of reduction of initial length scale. [Luo, 2006].
Flory-Huggins theory predicts an equilibrium phase diagram for a
particular polymer and solvent system. In our case the solvent is also the
expansion agent. The thermodynamic phase diagram of polymer solution
exhibiting a critical solution temperature can be established from equation
4.2, the Flory-Huggins free energy of mixing: [Strobl, 1997].
Δ F = kT [ 11 2 2ln ln
nϕ ϕ ϕ ϕ+ + 12 1 2χ ϕ ϕ ] (4.2)
where, n is the statistical polymer segment length, 1ϕ and 2ϕ are the

81
volume fractions of polymer and the solvent (expansion agent in this
study) respectively and 12χ is the Flory-Huggins (FH) interaction
parameter between the polymer and the solvent. In general the equilibrium
state of the mixture depends on the sign of the free energy of mixing ΔF
at a particular composition of interest. A negative value of the free energy
favors a homogenous mixed system.
The first term in the equation [ 11 2 2ln ln
nϕ ϕ ϕ ϕ+ ] is the total mean field
entropic contribution while the second term ( 12 1 2χ ϕ ϕ ) is the residual free
energy of mixing, representing the effect of local interactions and motion
of the monomers. Typically in polymer solutions the value of n is large
and ϕ1 << ϕ2 . However in this study the situation is reversed where the
value of ϕ2 is in the range of 0.07 to 0.08 i.e. ϕ2 << ϕ1 . The first
(entropic) term of the FH equation is negative and always favors mixing.
In case of styrene-2-butanol system this term is non trivial since n=1.
The mean field entropic (first) term in equation 4.2 is calculated based on
the assumption that the conformational entropy of a polymer is identical
both in the mixed and pure states. Another important assumption is that
there is no volume change during mixing. These are good assumptions in
this study since the solvent phase has very low volume fraction.
The second term in the FH equation involves the FH interaction parameter
χ12, which has an energetic origin and can have positive (opposing

82
mixing), zero (ideal mixtures) or negative (promoting mixing) values. “If
there is a net attraction between species (i .e. they like each other better
than they like themselves), χ12 < 0 and a single phase mixture is favorable
for all compositions. More often there is a net repulsion between the
species (they like themselves more than each other) and the Flory
interaction parameter is positive” [ Rubinstein, 2003] The later is the case
for PIPS and the equilibrium state of the mixture does not depend any
more on the sign of the free energy of mixing ΔF at a particular
composition of interest, but on the functional dependence of this free
energy on the composition ϕ.
Differentiating FH equation for ideal polymer solution (only entropic
contribution) we get
]1)1ln(1ln[ 11
1
−−−+=∂Δ∂ ϕ
ϕϕ nn
kTF (4.3)
It is evident from equation 4.3 that purely entropic contribution diverges
at both extremes of composition (i.e. as ϕ1 → 0, 1ϕ∂
Δ∂ F→ −∞ and as
ϕ1 → 1, 1ϕ∂
Δ∂ F→ ∞). This indicates “a small amount of either species will
always dissolve even when there are strong unfavorable energetic
interactions [Rubinstein, 2003].

83
The FH interaction parameter is given by
12 ( ) /c cA A T Tχ χ= + − (4.4)
Or in terms of Hildebrand solubility parameters [Mark, 1996]
( )212 34.0 spRT
Vi δδχ −+= (4.5)
A is the entropy correction factor, T the absolute temperature, Tc is the
critical temperature, Vi is the volume for the polymer chain segment, δp
and δ s are the total Hildebrand solubility parameters for the polymer and
the solvent respectively and cχ is the critical interaction parameter given
by
210.5(1 )c nχ = + (4.6)
It should be noted that equation 4.5 does not work in mixtures with strong
polar or hydrogen bond interactions. [Rubinstein, 2003] This equation
cannot be applied to PS-2-butanol or styrene/2-butanol systems where
hydrogen bonding and polar interactions are strong [Krevelen, 2003].
Considering 8% by volume of 2-butanol the free energy for styrene-2-
butanol system can be written as
ΔF = kT[-0.254+0.065x χ1 2] (4.7)

84
Thus the critical value for χ12 exceeding which phase separation shall
occur can be estimated by setting ΔF =0
Or χ12 ≈4
This value is substantially larger than expected χ12 values (χ1 2 = 0.713
estimated using equation 4.5) and it was clearly observed during
experiments that styrene and 2-butanol form a homogeneous mixture at
room temperature.
Chan and coworkers showed that a major contribution for phase separation
is due to the change in the Flory-Huggins interaction parameter χ12
resulting from associated changes in the chemical structure produced by
polymerization [Chan, 1996]. Bernardo [2007] experimentally determined
the interaction parameter (χ12) for a series of alcohols and polystyrene
(Mw =230,000) system (Table 4.3). The values of the interaction
parameter (χ12) for 2-butanol-PS system at different temperatures were
estimated to be approximately equal to that of 1-butanol due to lack of
data in literature. The difference in literature values of interaction
parameter between 1-propanol and 2-propanol served as measure for
estimation. It has been experimentally shown in this study that phase
separation at room temperature do not occur until a critical concentration
of approximately 8% by volume of 2-butanol is reached. Below this
critical composition PS-2-butanol system (Mw=200K) exists in a

85
Table 4.3 Interaction parameter (χ12) for alcohols in PS at different temperature [Bernardo, 2007] Alcohol χ12 at 65ºC χ12 at 75ºC χ12 at 95ºC1-propanol 1.6502 1.5408 1.3066 2-propanol 1.7470 1.5958 1-butanol 1.5356 1.4449 1.2039 2-butanol (estimated) 1.6 1.49 1.2039
homogeneous single-phase mixture. Verchere and co workers [1991]
analyzed PIPS in rubber modified epoxies. They reported that the change
in mean field entropy, due to growth of polymeric chains is more
significant in their case of PIPS than changes in the value of χ1 2. The
occurrence of uniform spherical phase separated structures in a
continuous polymer matrix has encouraged many authors to describe the
PIPS process using NG mechanism. However, Verchere and co workers
concluded that inspection of SEM images to determine the mode of PIPS
to be either NISD or NG may be grossly misleading.
They recommended a detailed analysis of thermodynamics and kinetic
process during polymerization in order to conclude the mechanism leading
to formation of separated phases in PIPS.
In this study, PIPS technique has been used in order to achieve a uniform
distribution of separated phases of 2-butanol in polystyrene matrix instead
of mechanical dispersion as in WEPS. In case of WEPS, water is

86
completely insoluble in styrene monomer. The first step in the WEPS
process was bulk polymerization where a surfactant was added to disperse
water droplets in partially polymerized styrene thus yielding a stable
emulsion [Crevecoeur, 1999]. Partial polymerization was carried out to
increase the viscosity of the liquid media sufficient enough to stabilize
the emulsion. In the second step this emulsion was suspended in water in
the presence of a suitable suspension stabilizer and standard suspension
polymerization was carried out in order to obtain beads. The detailed
thermodynamic and kinetic modeling of PIPS in PS-2-butanol system is
outside the scope of this dissertation. Thus a simpler comparative
treatment using room temperature solubility parameters is used to support
the already discussed process of phase separation in PS-2-butanol system.
Later in this chapter thermodynamics of phase separation has been
analyzed by comparison of theory with experimental results.
Solubility and thus phase separation can be expressed in terms of the
Hildebrand parameter denoted by δt [ Hildebrand, 1916]. Practically it is
possible to use this parameter without a thorough understanding of the
molecular dynamics (MD) on which it is based. Hansen [1967] divided the
total Hildebrand parameter value into three additive parts: a dispersion
force component, hydrogen bonding component, and a polar component
given by equation 4.8.
δt2= δd2 +δp2 + δh2 (4.8)

87
where
δt = Total Hildebrand parameter
δd = dispersion component
δp = polar component
δh = hydrogen bonding component
The Hildebrand parameter for each solvent at 25ºC can be plotted in a 3-D
space by using the individual Hansen parameters as coordinates. For a
polymer, a solubility sphere can be geometrically constructed in this 3-D
space (Fig.4.3).
The coordinates at the center of the solubility sphere are designated by
means of three component parameters (δd, δp, δh) of the polymer, and
radius of the sphere, called the interaction radius (R). A polymer has a
high probability to be soluble in a solvent at 25ºC, if the Hansen
parameters for the solvent lie within the solubility sphere for the polymer.
In order to determine this (without rigorous MD simulations) the distance
of the solvent point from the center of the polymer solubility sphere (DS-
P) needs to be evaluated and should be less than the interaction radius for
the polymer. Values of R for different polymers have been experimentally
determined by trial with many different solvents and reported in
literature. Gharagheizi et al. [2006] used intrinsic viscosities of the
polymer in different solvents and the molar volumes of the solvents to

88
Figure 4.3 Schematic i llustrating the plotting of a solubility sphere in a 3-D Hansen plot.
develop a correlation between Hansen parameters and the polymer
interaction radius. The radius of interaction for PS is reported to be R
=12.7 MPa1/2 [Krevelen, 2003]
Ideal solvent coordinates lie on the sphere surface while bad and good
solvent coordinates lie outside and inside the sphere respectively.
D(S-P) = [4(δds - δdp)2 + (δps - δpp)2 + (δhs - δhp)2]½ (4.9)
Where D( S- P ) = Distance between solvent and center of polymer solubility
sphere
δxs=Hansen component parameter for solvent
δxp=Hansen component parameter for polymer
δd
δp
δh
R
Bad solvent
Good solvent Ideal
solvent
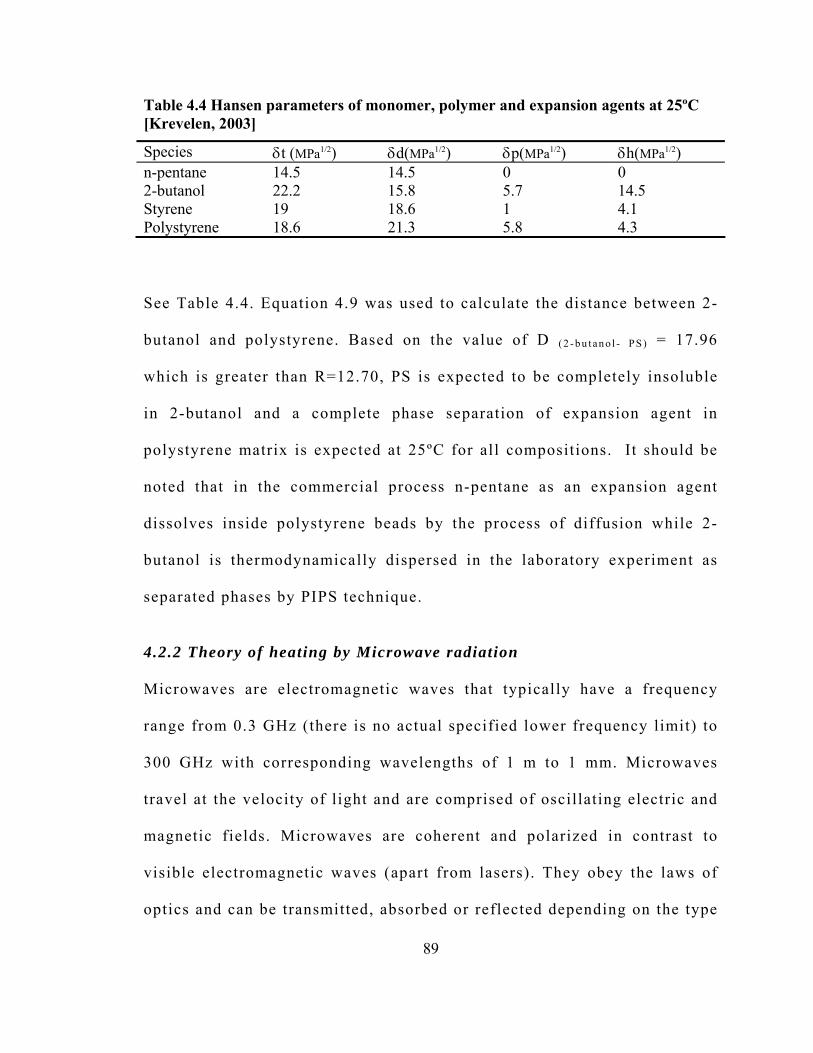
89
Table 4.4 Hansen parameters of monomer, polymer and expansion agents at 25ºC [Krevelen, 2003]
Species δt (MPa1/2) δd(MPa1/2) δp(MPa1/2) δh(MPa1/2) n-pentane 14.5 14.5 0 0 2-butanol 22.2 15.8 5.7 14.5 Styrene 19 18.6 1 4.1 Polystyrene 18.6 21.3 5.8 4.3
See Table 4.4. Equation 4.9 was used to calculate the distance between 2-
butanol and polystyrene. Based on the value of D ( 2 - b u t an o l - P S ) = 17.96
which is greater than R=12.70, PS is expected to be completely insoluble
in 2-butanol and a complete phase separation of expansion agent in
polystyrene matrix is expected at 25ºC for all compositions. It should be
noted that in the commercial process n-pentane as an expansion agent
dissolves inside polystyrene beads by the process of diffusion while 2-
butanol is thermodynamically dispersed in the laboratory experiment as
separated phases by PIPS technique.
4.2.2 Theory of heating by Microwave radiation
Microwaves are electromagnetic waves that typically have a frequency
range from 0.3 GHz (there is no actual specified lower frequency limit) to
300 GHz with corresponding wavelengths of 1 m to 1 mm. Microwaves
travel at the velocity of light and are comprised of oscillating electric and
magnetic fields. Microwaves are coherent and polarized in contrast to
visible electromagnetic waves (apart from lasers). They obey the laws of
optics and can be transmitted, absorbed or reflected depending on the type
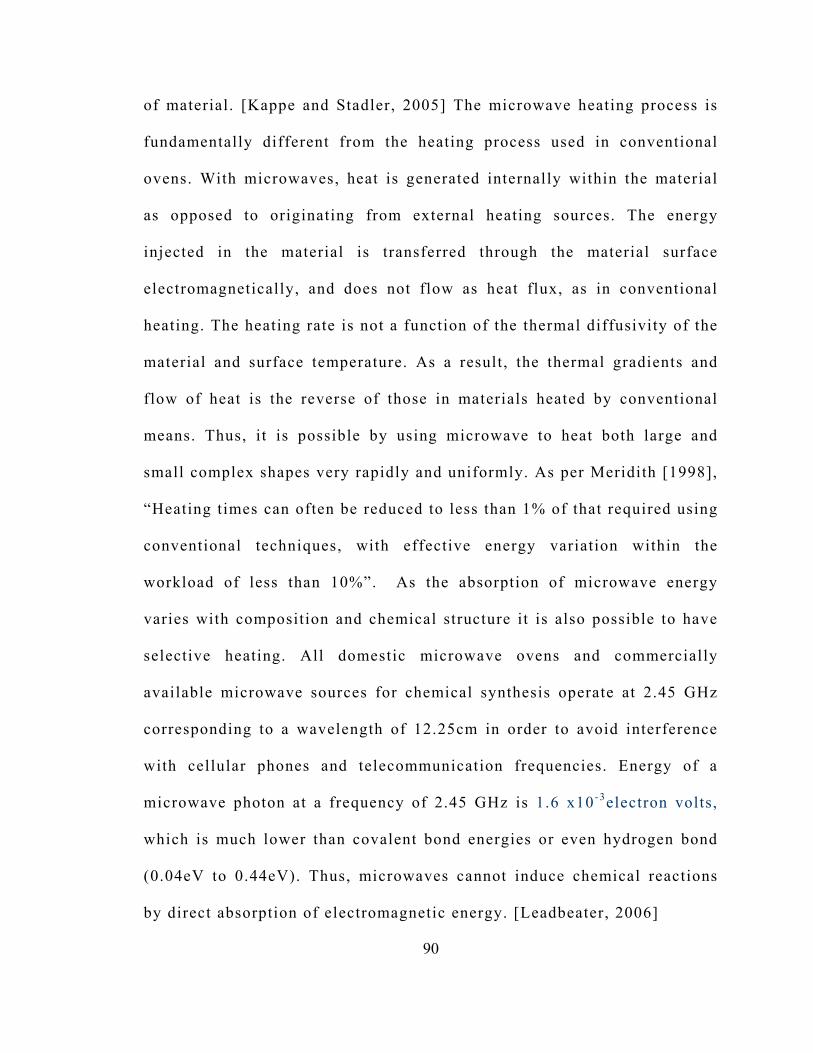
90
of material. [Kappe and Stadler, 2005] The microwave heating process is
fundamentally different from the heating process used in conventional
ovens. With microwaves, heat is generated internally within the material
as opposed to originating from external heating sources. The energy
injected in the material is transferred through the material surface
electromagnetically, and does not flow as heat flux, as in conventional
heating. The heating rate is not a function of the thermal diffusivity of the
material and surface temperature. As a result, the thermal gradients and
flow of heat is the reverse of those in materials heated by conventional
means. Thus, it is possible by using microwave to heat both large and
small complex shapes very rapidly and uniformly. As per Meridith [1998],
“Heating times can often be reduced to less than 1% of that required using
conventional techniques, with effective energy variation within the
workload of less than 10%”. As the absorption of microwave energy
varies with composition and chemical structure it is also possible to have
selective heating. All domestic microwave ovens and commercially
available microwave sources for chemical synthesis operate at 2.45 GHz
corresponding to a wavelength of 12.25cm in order to avoid interference
with cellular phones and telecommunication frequencies. Energy of a
microwave photon at a frequency of 2.45 GHz is 1.6 x10⁻³electron volts,
which is much lower than covalent bond energies or even hydrogen bond
(0.04eV to 0.44eV). Thus, microwaves cannot induce chemical reactions
by direct absorption of electromagnetic energy. [Leadbeater, 2006]

91
Microwave dielectric heating is dependant on the ability of a material to
absorb mainly the electric component of microwave energy and generate
heat. The heating is caused by two main mechanisms that are dipole
polarization and ionic conduction. In a polar molecule a partial negative
and partial positive charge is developed due to deformation of the
electronic cloud during bond formation. The permanent electric dipole
moment (μ) in such a molecule is defined as the moment due to the force
from the centre of partial negative charge (-δq) to the centre of partial
positive charge (+δq) distance r away. The units are usually given in
Debye.
μ = δqr (4.10)
In presence of an oscillating electric field, the dipoles attempt to
continuously reorient in the direction of the electric field vector. (Fig 4.4)
Depending on the frequency of the field, the dipole may move
synchronously in time to the field, lag behind it or remain unaffected.
When the dipole vector lags behind the field vector, interactions between
the dipole and the field vectors lead to an energy loss by heating, the
extent of which is dependent on the phase difference between these
vectors. Heating effects reaches a maximum value twice during each cycle
[English and MacElroy, 2003]. “Debye (1929) when investigating
dielectric relaxation obtained the relation between relaxation time τD, now
known as Debye relaxation time, and the coefficient ς of molecular

92
Figure 0.4 Dipole polarization effect on water molecule. a. Water dipole moment is aligned to the field; b. Dipole moment rotates in order to follow the field; c. Dipole moment rotates in opposite direction trying to align with the field
friction.” “The Debye theory of relaxation is based on the consideration
of rotational Brownian motion of polar molecules.” The Debye relaxation
time is expressed as [Gaiduk, 1999]
τD = ς 2kBΤ (4.11)
where kB is Boltzmann constant and T is the absolute temperature of the
media. The ease of relaxation depends on the viscosity of the liquid
subjected to the field and the mobility of the electron clouds in its
molecules. In molecules like alcohols these, in turn, depend on the
strength and density of the hydrogen bonded network. In free liquid water
this movement occurs at GHz frequencies (microwaves) and in ice at kHz
frequencies (long radiowaves). The re-orientation process may be modeled
t = 0.3 ns
δ+
δ-
δ+
δ-
δ+
δ-
t = 0 t = 0.1 ns
ε ε ε Electric Field
0
-
+
-
+
-
+
00
a b c

93
using a 'wait-and-switch' process where the water molecule has to wait for
a period of time until favorable orientation of neighboring molecules
occurs and then the hydrogen bonds switch to the new molecule [Kaatze,
2002]. Since the frequency of typical microwave is 2.45 GHz, the time
period of microwave radiation is in order of nanoseconds (10- 9sec). The
molecular relaxation rate in liquid state during cooling by conduction is
in the order of microseconds (10- 6sec) [Leadbeater, 2006]. In a microwave
coupled thermodynamic control volume of a liquid, where energy input is
by the mode of microwave radiation and energy output is by mode of
molecular vibrations (Conduction) and mass transport (Natural
convection), the accumulation of energy is extremely fast. Thus in a
coupled system, an almost constant energy accumulation is achieved at a
rate far greater than the rate at which energy can be dissipated by
conventional modes of cooling. As a result an absorbing liquid medium
can have almost instantaneous local superheating and temperatures can
reach much higher above its boiling point. It should be noted that gas
molecules cannot be heated by microwave radiation since distance
between rotating dipoles are too high to create molecular friction.
Ionic conduction (Fig 4.5) on the other hand involves oscillation of
dissolved charged particles in a liquid and creates heating effect due to
molecular collision. The ionic conductivity effect has a much stronger
heating effect than the dipole rotation mechanism. The heating

94
Figure 0.5 Ionic conduction effects on Chlorine ion. a. Negatively charged Chlorine ion is attracted to the positive portion of microwave; b. is repelled by the negative section of microwave; c. causing oscillation of the ion through the liquid media
characteristic of a material is dependant on its dielectric properties
expressed by its loss tangent (tanδ) [Meridith, 1998]. An introductory
mathematical treatment of dielectric heating effect in liquid with
hydrogen bonding is presented as follows. [Smyth, 1995; Metaxas &
Meredith, 1983; Chaplin, 2007]
If two charges q1 and q2 are separated by distance r, the potential energy
V (joule) in vacuum is expressed as
1 2
04q qV
rπε=
(4.12)
where ε0 is the ability of a vacuum to store electrostatic energy, called the
t = 0 t = 0.1 ns
ε ε ε Electric Field
0
-
+
-
+
-
+
00
- -
- Chlorine ion
a bc

95
permittivity in vacuum (= 8.854 x 10⁻¹² C2 J-1 m- 1 )
The potential energy due to charges separated in a material medium with
medium permittivity ε is expressed as
1 2
4q qV
rπε=
(4.13)
The relative permittivity (ε r) of a material medium is expressed as
0r
εεε
= (4.14)
In the case of dilute gases the relative permittivity approaches unity. In
hydrogen bonded molecules like liquid water and alcohols the dielectric
constant is high and there is a linear correlation between the dielectric
constant and the density of hydrogen bonds [Yoshii, 2001].
The polarization (P, culombs) of a material is its electric dipole moment
density.
P = (ε r - 1)ε0E (4.15)
Where E is the applied field potential (E, volts) of electromagnetic
radiation and is expressed as
E = Ema x.cos(ωt) (4.16)

96
where Ema x is the amplitude of the potential, ω is the angular frequency in
radians/second and t is the time (seconds).
The relative permittivity (ε r) is related to the molar polarization of the
medium (Pm) using the Debye equation
12
mr
r
PM
ρεε
−=
+ (4.17)
where ρ is the mass density (kg m- 3), M is the molar mass (kg). The molar
polarization of the medium (Pm) is defined as
2
0
( )3 3
Am
NP pkTμ
ε= +
(4.18)
where p is the polarizability of the molecules, which is the proportionality
constant between the induced dipole moment μ* and the field strength E
(μ* = pE), NA is the Avogadro number, k is the Boltzmann constant
(=R/NA) and T is the absolute temperature. The second term in equation
(4.18) is due to the contribution from the permanent dipole moment and is
negligible when the medium is non-polar or when the frequency of the
applied field is sufficiently high that the molecules do not have time to
change orientation.
If the polarization lags behind the field vector by the phase (δ , radians)
then the polarization (P, coulombs) can be expressed as

97
P = Pmax.cos(ωt - δ) (4.19)
where Pma x is the maximum value of the polarization
The power (P*, watts) lost as heat by the dielectric material media is
expressed as
P* = 0.5 Pmax Emax ω sin(δ) (4.20)
Power lost as heat is zero if there is no lag (that is, if δ = 0)
The relative permittivity can be expressed in terms of complex dielectric
permittivity (εr*) given by
ε r* = ε r ′ - i ε r″ (4.21)
where ε r″ is the dielectric loss factor indicating the efficiency with which
electromagnetic radiation is converted into heat and ε r ′ is the dielectric
constant indicating the polarizability of the molecules in the electric
field.
Also tan(δ) = ε r″/ ε r ′ (4.22)
The terms ε r*, ε r″ and εr ′ are all functions of the frequency of the electro
magnetic radiation. The dielectric constant as a function of the
wavelength, is expressed as

98
2'1 ( / )
sr
s
ε εε ελ λ
∞∞
−= +
+ (4.23)
where εs is the dielectric constant at low frequencies (static region), ε∞ is
the dielectric constant at high frequencies(optical region) and λS is the
critical wavelength for maximum dielectric loss. The dielectric constant
can also be expressed in terms of the dipole relaxation and is given by
∞∞ +
+−
= ετω
εεε 221
' sr
(4.24)
where τ is the dipole relaxation time expressed as
kTr34πητ =
(4.25)
where r is the molecular radius, k is the Boltzman constant and η is the
viscosity of the liquid.
As the temperature increases, both the strength and density of the
hydrogen bond network decrease. This effects dielectric heating by
(a) lowering the static dielectric constant ε s ,
(b) lessening the difficulty for the movement of dipole and thereby
allowing the liquid molecule to oscillate at higher frequencies, and
(c) reducing the drag to the rotation of the water molecules, thereby

99
reducing the molecular friction coefficient and hence the dielectric loss.
Most of the dielectric loss is within the microwave range of
electromagnetic radiation (~0.3 to ~300 GHz, with wavenumber 0.033 cm-
1 to 10 cm- 1, and wavelength 0.3 m to 1.0 mm respectively). The
frequency for maximum dielectric loss lies higher than the 2.45 GHz
(wavenumber 0.0817 cm- 1, wavelength 12.24 cm) produced by most
microwave oven [Chaplin, 2007].
The electromagnetic penetration is infinite in a perfectly transparent
substance and zero in reflective material (for example, metals). The
attenuation (α) is given by:
2'{ (1 tan ) 1}22
rε δπαλ
+ −=
(4.26)
Considering plane waves, the penetration distance Dp for incident
microwave radiation intensity to decrease to 1/e (63% absorbed) in a
given media is expressed as
12 2 tan 'p
r
D λα π δ ε
= = (4.27)
At 2.45 GHz:

100
'1.947
"r
pr
D cmε
ε=
(4.28)
From the equations 4.26 and equation 4.20 it is clear that a reaction
medium with a high tanδ is required for efficient absorption and rapid
heating. At 2.45GHz, 2-butanol has a tanδ = 0.447 and heats more rapidly
than water with a tanδ of 0.123. Also at 2.45GHz the loss tangent (tanδ )
for polystyrene is 0.0003 and attenuation (α) is ≈ 0 (from equation 4.26).
Thus a negligible microwave heating effect of polystyrene matrix is
expected from microwave radiation. Table 4.5 lists loss tangent values for
various alcohols and water. [Kappe and Stadler, 2005]
The main advantage of using microwave as a heating source for expansion
of PS using alcohols as expansion agents lies in the high coupling
efficiency that can be achieved when heating alcohols doped with ionic
salts [Metaxas & Meredith, 1983]. Dissolved salt depresses the dielectric
Table 4.5 Relevant properties of potential expansion agents compared to PS
Solvent Solubility Parameter δt(MPa1 /2)
Boiling Point
°C
Vapor pressure at 100°C in mm of Hg
Microwave Coupling (tanδ)
Ethanol 26.2 78.4 1683 0.941 2-propanol 23.5 82 1500 0.799 2-butanol 22.2 99 806 0.447
Water 48.0 100 764 0.123 PS 18.6 N/A N/A 0.0003

101
constant dependent on its concentration (C) and the average hydration
number of the individual ions (HN). This is expressed as
2 2
2'1
s Nr
H Cε εε εω τ
∞∞
− −= +
+ (4.29)
By salt addition the dielectric loss factor is increased by a factor that
depends on the ionic conductivity (Λ , S cm2 mol- 1; S (Siemens) Λ (mho)),
concentration and frequency. It increases with rise in temperature and
decreasing frequency.
2 20
( 2 )( )"1 1000
s Nr
H C Cε ε ωτεω τ ωε
∞− − Λ= +
+ (4.30)
Thus with addition of very small amounts of salt, increase in dielectric
loss factor and decrease in dielectric constant causes a major increase in
the value of the loss tangent and in turn an increasing in dielectric heating
efficiency. Zhou and Song [2005] used Calcium Chloride (CaCl2) and
Sodium Chloride (NaCl) to improve microwave coupling in their
experiment to expand starch pellets into foam. It was observed that it took
approximately 30 sec for the pellets with the salts to foam compared with
45–60 sec for those without the salt additives. Another advantage is the
high microwave frequency that leads to fast superheating of coupled
liquid much above its boiling point [Leadbeater, 2006]. This is especially
effective in the case of PS-alcohol system where initially the alcohol
phases are encapsulated within the polymer matrix and thus can be

102
superheated without an immediate phase change. The polymer matrix is
expected to act like an impermeable high-pressure vessel that confines the
alcohol phases until heat transfer from the superheated alcohol raises the
matrix temperature above glass transition. The heat transfer by conduction
within a polymer of low thermal diffusivity, as well as mass transport
through a glassy polymer below Tg, is a much slower process than
superheating small volume fluid phases (in the order of micro liters) by
microwave coupling.
It should also be noted that the concentration of 2-butanol in the PS matrix
and uniformity of dispersion shall determine the overall heating efficiency
and thus optimization of 2-butanol distribution is critical in achieving
maximum process efficiency. The selection of 2-butanol as a model
expansion agent was based on its boiling point of 99°C, which is within
glass transition range (98°C ~105°C) of the PS matrix. The intent was to
achieve selective microwave superheating of the 2-butanol phase above its
boiling point and heating of the PS matrix to its glass transition temperature
indirectly by the mode of conduction from the 2-butanol phase. Although 2-
butanol has been used as a model expansion agent, an alcohol like ethanol
can be used as an expansion agent, exploiting its high loss tangent
(microwave coupling) even though its boiling point (78.2°C) is lower than
the glass transition of PS. This is due to the fact that ethanol temperatures
much higher than Tg of PS can be achieved by fast superheating.

103
A third advantage of using microwave is the complete transparency of PS
matrix towards microwaves compared to the high coupling of the
expansion agent. Penetration depth for microwave at 2.45GHz in PS is
calculated from equation 4.28 as Dp = 103.64m (considering dielectric
constant =2.55 [CRC Handbook, 2006]). This facilitates microwave
heating of large volumes of PS with a small volume fraction of 2-butanol.
When the temperature of the PS matrix is below Tg, the matrix acts like
an impermeable vessel containing phases of 2-butanol. Once the matrix
temperature exceeds Tg, the PS matrix expands since the vapor pressure
of the superheated 2-butanol exceeds the viscoelastic stresses offered by
the rubbery polymer. Expanded cells with permeable cell walls are formed
due to biaxial stretching of the viscoelstic polymer and expansion agent 2-
butanol escapes from the polymer matrix through the permeable cellular
structure. Since microwave heating is directly related to the mass of 2-
butanol in the PS matrix, the heat input to the system, should decrease at
the same rate as the 2-butanol escape rate and become negligible as this
mass approaches zero. Fast cooling of the expanded polymer surfaces
below glass transition temperature is essential to prevent collapse of the
newly formed cell walls [Benning, 1969]. It is important to note that for
thermal insulators like PS, cooling occurs by the heat transfer mode of
radiation and convection both of which are strong functions of surface
area. Thus convection and radiation cooling of the PS matrix is facilitated
near the end of the microwave heating process especially with the

104
formation of large new polymer cellular surface area due to foaming. This
means that optimizing the process of expansion could potentially
eliminate cell collapse due to slow cooling.
Finally, microwaves can be guided, focused and confined easily assuring a
safe and efficient work environment. In industry microwave heating is
widely used both as a batch and a continuous process. The electrical
impedance of the microwave source can easily be tuned to match the
electrical impedance of the coupling liquid for maximizing efficiency
[Leadbeater, 2006]. Electrical impedance (Z), describes a measure of
opposition to a sinusoidal alternating current (AC) and in Cartesian form
is expressed as
Z =R+ iX (4.31)
where the real part of impedance is the resistance (R) and the imaginary
part is the reactance (X). Dimensionally, impedance is the same as
resistance; the SI unit is the ohm. Merideth in his book emphasized the
advantage of microwave heating. According to him “The overall
efficiency of microwave heating systems is usually very high because of
the exceptional efficiency of high-power magnetrons (85% at 900MHz,
80% at 2450MHz)”. “Very fast feedback control loops can be used to
control process parameters accurately, leading to improved product
quality”. Energy savings are expected in microwave heating, since a

105
microwave oven has instantaneous control of power, thus ensuring rapid
startup and rapid establishment of equilibrium conditions after a change.
With development in microwave technology it is expected that in years to
follow the microwave heating applications shall become more efficient
and easier to operate [Metaxas & Meredith, 1983]. It should be noted that
although microwave heating is fundamentally different than conventional
means, the cooling of a material that had been subjected to microwave
heating is due to heat loss following conventional heat transfer modes of
radiation, conduction and convection.
4.3 Experimental
4.3.1 Free radical bulk polymerization Materials
Styrene monomer of high purity (≥ 99%), containing 10-15 ppm 4-tert-
butylcatechol as inhibitor, supplied by Sigma-Aldrich was filtered through
a column of Alumina powder in order to remove inhibitors. 2-butanol with
high purity (≥ 99%) was supplied by Fischer scientific.
Azobisisobutylonitrile (AIBN) (98% purity) supplied by Sigma-Aldrich
was used as the free radical initiator.
Polymerization process
Calculated amount of AIBN initiator (240mg in 20ml styrene) was

106
dissolved in styrene by ultrasonication for 15 minutes. Monomer with
initiator was then carefully dispensed in 2 ml capacity airtight vials using
micropipette. Batch of 5 solution samples were prepared with varying
concentrations of 2-butanol in the monomer/ initiator system using
ultrasonication for 15 minutes.
Generally, laboratory scale bulk polymerization is performed in a closed
flask with condensers attached and continuous stirring and heating on a
hot plate. The mechanical stirring is required in order to maintain a
thermal equilibrium throughout the monomer bulk and to provide a
homogeneous distribution of growing chains. However, the purpose of this
polymerization was to obtain cast polymer pellets in the cylindrical shape
of the 2ml reaction vial. In order to achieve thermal equilibrium in the
reaction vials without mechanical stirring, the vials were heated by
radiation in a precision furnace with a PID feedback control system. The
Furnace (Fig 4.6) was manufactured by Vector Furnaces Ltd. The samples
were heated at 90ºC for 24 hours and annealed in the furnace for 2 hours
at 50ºC to achieve polymerization and induced phase separation. After
polymerization the polystyrene was obtained in intact pellet form by
breaking the sample vial by a sharp impact.
Bulk polymerization of styrene and 2-butanol is carried out to obtain
pellets of substantially larger size than commercially used beads
(Fig.4.7). It should be noted that the commercial process involves
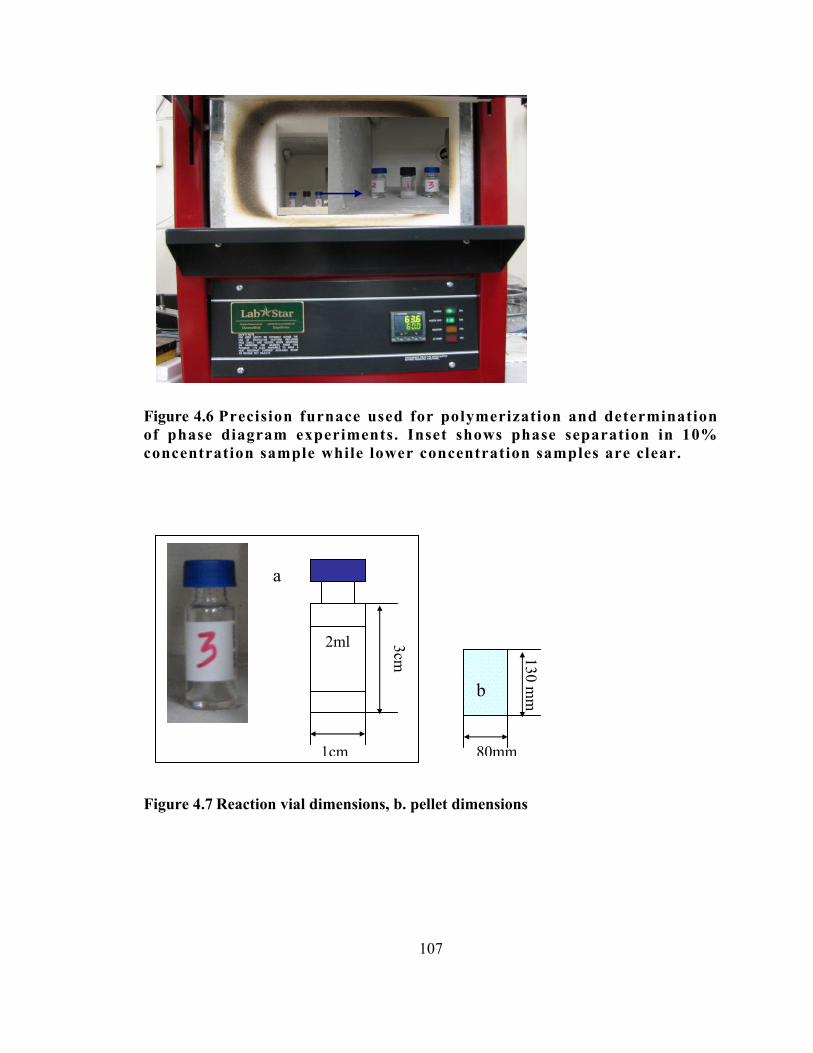
107
Figure 4.6 Precision furnace used for polymerization and determination of phase diagram experiments. Inset shows phase separation in 10% concentration sample while lower concentration samples are clear.
Figure 4.7 Reaction vial dimensions, b. pellet dimensions
2ml
1cm 80mm
3cm 130 mm
a
b

108
convection heating by steam. Convection heat transfer is a surface
dependant process and thus a high surface to volume ratio is required. The
novel method studied in this research uses electromagnetic radiation,
which is a volumetric process. Thus, larger individual volumes (pellets)
are acceptable. It should also be noted that the samples were annealed and
Scanning electron microscopy (SEM) and Thermo Gravimetric Analysis
(TGA) was used to verify uniformity of phase distribution throughout the
matrix.
In order to study the effect of microwave heating by ionic conduction,
special samples were prepared using organic salt l i thium per-chlorate. 9%
by volume of 2-butanol was selected as an appropriate concentration of
expansion agent for this study. Four samples were prepared, two
containing 0.1% by weight of lithium per chlorate (w.r.t . 2-butanol)
dissolved in 2-butanol while the other two were regular 2-butanol phase in
polystyrene matrix. The objective was to subject all these samples to the
same microwave conditions and study the temperature feedback response
of the ionic conduction in comparison to dipole rotation heating effect in
microwave.
Characterization techniques:
Gel permeation chromatography (GPC)
Gel permeation chromatography was used to determine the number

109
average molar mass (Mn), the weight average molar mass (Mw), and the
molar mass distribution (Mw/Mn) of the PS. The samples were measured
on a Waters Modular GPC. Temperature of column and detector were kept
at 40oC. Solvent was THF at 1ml/minute with an injection volume of 50ml
and a sample concentration of 2 mg/ml. The columns were calibrated with
Toyo Soda polystyrene standards.
Thermogravimetric analysis (TGA)
In order to verify the 2-butanol content of the pellets, the weight loss of
PS samples containing different concentration of 2-butanol was measured
using TGA under Nitrogen flow of 100ml/min. The temperature sequence
started at 30°C at a heating rate of 5K/min to 180°C and was followed by
an isotherm at 180°C for 20 min. The instrument used was a TA
instrument with model name TGA Q50 V6.7 Build 203.
Differential Scanning Calorimetry (DSC)
The glass transition temperature (Tg) of PS samples and approximate
temperature range of expansion was determined using a Mettler DSC 821.
The heating rate was 5oC/min and for each sample two heating runs from
30oC to 180oC were recorded with 100 ml/min N2 as the purge gas. An
isotherm at 30oC was run for 15 minutes to obtain thermal equilibrium
within the sample. Indium was used for temperature and heat of fusion
calibration.

110
For verification purpose a modulated test was also run. The operating
parameters were
Isotherm at 25 oC for 10min
Temperature ramp from 25 oC to 75 oC at5 oC/min
Isotherm at 75 oC for 5 min
Temperature drop from 75 oC to 25 oC at -5 oC/min
Isotherm at 25 oC for 5 min
Temperature ramp from 25 oC to 75 oC at 5 oC/min
Each test was run two times to check for repeatability.
Scanning electron microscopy (SEM)
SEM was performed on all samples to visualize the 2-butanol phase
separation droplet size and dispersion. The high vacuum inside the SEM
chamber creates evaporation of the 2-butanol liquid phases and exposes
the separated phases as holes on the surface. Fractured surfaces of PS
pellets were imaged after coating with gold. A LEO 1525 Field Emission
scanning electron microscope was used. Two image processing programs
were used for analysis for the SEM images. ImageJ image processing
program was used to establish binary contrast between the 2-butanol
phases from the matrix by threshold function. (Fig 4.8) ImagePro Plus
4.5.0.19 was used to determine the mean diameter, standard deviation, and
size distribution of the holes.

111
Figure 4.8 Sample image showing threshold technique to obtain phase distribution in 10% 2-butanol concentration sample a. SEM image b. processed binary image.
4.3.2 Determination of phase diagram for PS, 2-butanol system
Styrene samples with varying concentrations of 2-butanol and calculated
amount of free radical initiator were prepared in a batch of airtight vials
of 2ml capacity. The vials were heated in the programmable precision
furnace at 90ºC for 24 hours. After completion of polymerization the
furnace temperature was allowed to drop by 1 degree and maintain steady
state for 1 hour. The vials at 89ºC were visually checked for signs of
turbidity (cloud point). At cloud point, a sharp alteration of light transmission takes place
due to scattering of light at separated phases and the entire sample turns
opaque/translucent. This process was repeated at intervals of 1ºC until 27ºC and
subsequent cloud points were plotted as concentration versus temperature to obtain a
phase diagram at a specific molecular weight. The molecular weight and distribution of
the samples were determined by GPC. See Table 4.6.
a b

112
Table 4.6 Sample ID with concentration of expansion agent for determination of phase diagram experiment.
Sample # 1 2 3 4 5 6 7 8 9 10 11
4 6 8
10 12 14 16 18 20 22 24 2-butanol % volume
4.3.3 Expansion and molding of novel expandable polystyrene
Laboratory scale microwave oven was used to expand polystyrene pellets of
different 2-butanol concentration. The oven used was model CEM Discover.
The microwave unit operates at 2.45 GHz and produces continuous waves at
maximum power of 300W. The oven consists of a cylindrical chamber
designed to fit one factory standard test tube as reaction chamber. The test
tubes are supplied with a special cap that acts as a safety pressure seal. In
case of evolution of gases from the reactor, a purge gas system can be used
by inserting inlet and outlet needles through the safety cap (Fig 4.9). The
purged gas argon is passed through a room temperature trap with silicone
oil. The temperature inside the chamber is measured and controlled by an
infrared temperature measuring feedback system (Fig. 4.10). A PID system
controls the microwave power supplied to the reactor by reading the
temperature feedback. Factory supplied application software is used to
control and measure the transient temperature and power profile. After trial
and error experiments the experimental conditions for expansion of
polystyrene pellets were determined as the following:

113
Figure 4.9 Standard microwave reaction vessel with sample inside.
b. Microwave experimental setup
Figure 4.10 Typical feedback control results for microwave expansion process
Purge gas in and out
Application software
Microwave chamber
Reaction vessel
Sample pellet
Safety lid

114
• Temperature Ramp Time: 10 seconds
• Temperature Hold Time: 60 seconds
• Maximum Power: 300W
• Purge Gas: Argon
4.4 Results and Discussion
4.4.1 Free radical polymerization
Polymerized samples (Fig.4.11) were obtained with varying
concentrations of 2-butanol in polystyrene matrix as cylindrical pellets.
At room temperature a critical volumetric concentration of 8% 2-butanol
was identified as the cloud point for the samples obtained.
GPC results for three samples with varying 2-butanol concentration along
with commercial expandable polystyrene bead (T170B) supplied by
Styrochem are tabulated below in Table 4.7.
It should be noted that although all samples were prepared from the same
initiator concentration, the volumes of the samples were a little different
in order to obtain accurate volumetric concentrations of 2-butanol. Also,
an oxygen free environment to reduce free radical scavenging was not
provided for polymerization. Although, a very close molecular weight and
distribution was obtained as compared to commercial samples, the

115
Figure 4.11 Image shows phase separation in 8% sample at room temperature. 7% and 6% samples are clear.
Table 4.7 GPC results for polystyrene samples
Sample # Alcohol % Mw Mn PDI T170B 7.5% 260,300 120,200 2.16
A 8% 204,700 92,180 2.221 B 7% 198,500 103,600 1.972 C 6% 263,700 122,200 2.158
Mean (Excluding
T170B)
N/A 222,300 105,993 2.117
8% volumetric concentration of 2-butanol
7% volumetric concentration of 2-butanol
6% volumetric concentration of 2-butanol

116
deviation among the individual samples can be attributed to the above-
mentioned causes. It should also be noted that the negligible difference in
values of molecular weight and PDI of the samples A and B allows the
conclusion that maximum solubility of 2-butanol at room temperature in
PS of Mw = 200,000 and PDI = 2 is in between 7% and 8% by volume.
TGA results were used to check the weight percentage of 2-butanol
samples. The results are illustrated below in Table 4.8 and Figure 4.12
showing three sample TGA graphs.
DSC results for 0%, 10%, 12%, 16% and 18% concentration of 2-
butanol+PS are presented in the figure 4.13 below.
For the pure PS sample the glass transition is obtained at 96.16ºC, which
falls in the acceptable range of glass transition for polystyrene. However
for all other samples containing 2-butanol the Tg coincides with the
boiling point of 2-butanol (99ºC) and cannot be separately distinguished
since a substantial DSC peak is encountered due to evaporation of 2-
butanol phase. The DSC data correlates well with the TGA data and both
show the temperature range for liberation of the 2-butanol to be between
90ºC to 120ºC. The TGA data also shows mass loss due to evaporation
between the temperatures of 55ºC to 90ºC increasing with increase in
concentration of 2-butanol. This also correlates with the DSC data,

117
TGA data
Figure 4.12 Thermo gravimetric analysis results showing weight loss of 2-butanol a. Sample containing 12% by vol. b. 16% by vol. and c. 18% by vol. of 2-butanol
a.
b.
c.
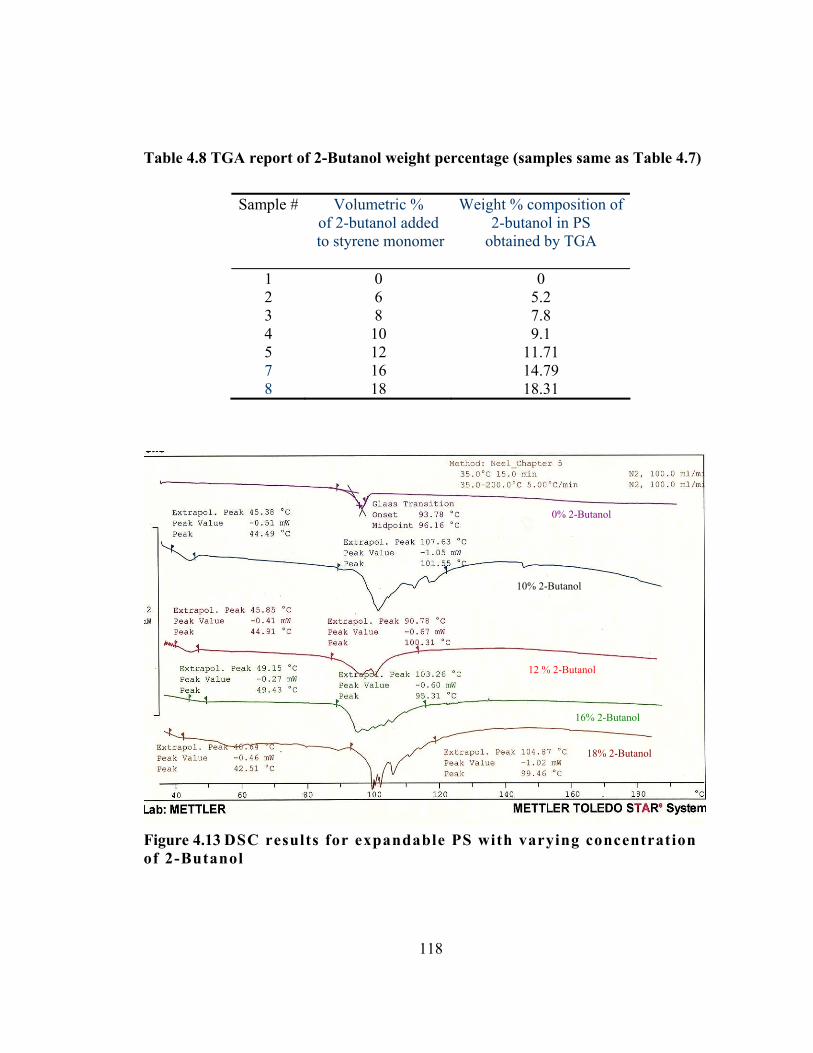
118
Table 4.8 TGA report of 2-Butanol weight percentage (samples same as Table 4.7)
Sample # Volumetric %
of 2-butanol added to styrene monomer
Weight % composition of 2-butanol in PS
obtained by TGA
1 0 0 2 6 5.2 3 8 7.8 4 10 9.1 5 12 11.71 7 16 14.79 8 18 18.31
Figure 4.13 DSC results for expandable PS with varying concentration of 2-Butanol
0% 2-Butanol
10% 2-Butanol
12 % 2-Butanol
16% 2-Butanol
18% 2-Butanol

119
particularly with the 18% sample showing signs of gas evolution through
constant fluctuation of the baseline between 55ºC to 90ºC. For each
polymer sample containing 2-butanol phase, a change in specific heat
capacity was noted with peak in the range of 44ºC to 49ºC. The
endothermic and exothermic changes are collectively attributed to latent
heat of evaporation of 2-butanol from the surface and diffusion through
porous media and mass loss, since the experiments were run using open
type pans. The irreversible nature of this curve was verified by
modulating the temperature in the ranges of 25ºC to 75ºC and a typical
result is illustrated in Fig. 4.14. This DSC experiment shows that the
initial peak observed at approximately 48ºC cannot be a relaxation peak
since it is irreversible. Thus it is attributed to evaporative mass loss,
which also agrees with the TGA results.
For Scanning Electron Microscopy Results, see fig. 4.15 and 4.16. For
Image Analysis Results, see Table 4.9.
The SEM image analysis results (Table 4.10) of samples prepared for
determination of phase diagram (Table 4.7) provide a correlation between
the phase concentrations and morphology and distribution of phase
separation. For sample containing 8% by volume of 2-butanol, PIPS
produced morphology of distributed spherical alcohol phase (droplets)
within the polymer matrix with an average diameter of 2.3�m.

120
Temp vs time
0
10
20
30
40
50
60
70
80
0 10 20 30 40 50 60
time (sec)
Tem
p. (C
elsi
us)
Temp vs time
Figure 4.14 .a Modulated DSC results showing irreversible nature of peak at 48 ºC (b) Time- temperature programming for modulated DSC.
b
a
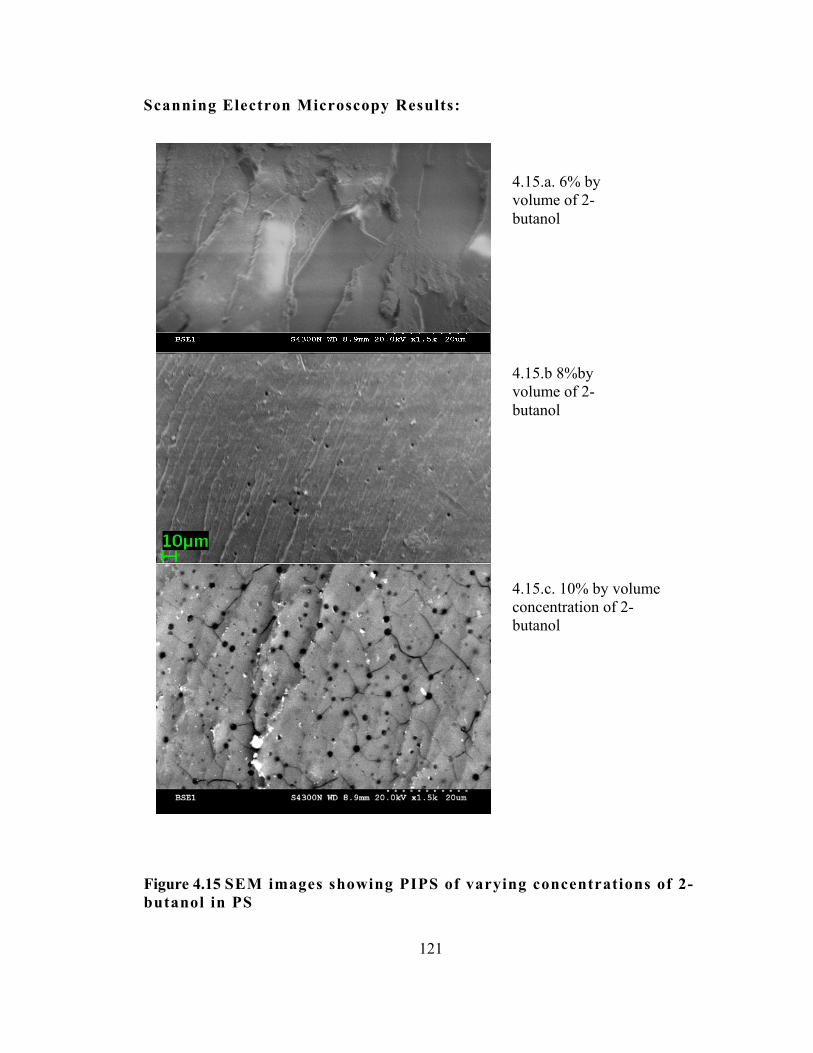
121
Scanning Electron Microscopy Results:
Figure 4.15 SEM images showing PIPS of varying concentrations of 2-butanol in PS
4.15.b 8%by volume of 2-butanol
4.15.a. 6% by volume of 2-butanol
4.15.c. 10% by volume concentration of 2-butanol

122
Figure 4.16 SEM images showing PIPS of varying concentrations of 2-Butanol in PS
10μm
4.16a.12% by volume concentration
4.16c.16% by volume concentration
4.16b 14% by volume

123
Image analysis results:
Table 4.9 Morphological characterizations of 2-Butanol phases in PS matrix at room temperature
# 2-Butanol %
Mean Dia. μm
SD μm
Comments
1 6 0 0 2-butanol does not show any phase separation and remain in solution in the PS matrix.
2 8 2.3 0.2 Phase separated spherical domains are observed at 8% by
volume concentration of 2-butanol
3 10 1.6 0.2 Phase separated domain dimensions and distribution increase are observed at 10% by volume concentration of 2-butanol
4* 12 N/A N/A N/A 5 14 1.3 0.4 bimodal distribution of phase dimensions is observed
6 16 3.3 0.3 The phase dimensions and distribution increase further and
seem to saturate the matrix. The diameter becomes larger than the separation distance between 2 spherical 2-butanol phases.
*Could not be determined accurately by image analysis.
Table 4.10 Temperature dependence of binodal and spinodal compositions for PS-2-butanol system
Temperature 27°C 40°C 50°C 65°C 75°C 85°C 95°C 105°C
Binodal composition
0.94 0.93 0.92 0.89 0.87 0.81 0.75 0.71
Spinodal composition
0.785 0.737 0.697 0.641 0.606 0.573 0.526 0.486

124
Uniformity in distribution of separated 2-butanol phases were found to
increase with increasing volumetric concentration and a bimodal
distribution was observed at 14% of alcohol concentration. As discussed
earlier in section 4.2.1, this bimodal distribution may result from
formation of smaller phase separated domains at an early stage of PIPS
and cannot be considered as an indication of NISD. It should also be
noted that in all the samples the standard deviation in phase diameter is
nontrivial. Generally a large standard deviation in the diameter of
separated phases indicates NG mechanism since it involves random
nucleation and is a relatively slower process than SD [Moschiar, 1991].
However, as discussed in section 4.2.1 from the SEM images alone a
conclusion about the mechanism of PIPS cannot be reached.
4.4.2 Determination of Phase Diagram
The cloud points are plotted as illustrated in Fig.4.17 to obtain the phase
diagram for 2-butanol in PS matrix. Since the experiment was performed
at a temperature resolution of 1ºC, an error bar of ±1ºC has been used.
From TGA data the concentrations were verified to be fairly accurate and
±0.5 % concentration error bar was used in the abscissa. Literature values
obtained for solubility of 1-butanol in Polystyrene is included in Fig.4.17
for comparison [Bernardo, 2007]. The PS used in the literature had Mn
=140,000 with PD = 1.64 while PS used in experiment had mean Mn =
105,993 with mean PD = 2.117. The lower solubility in the literature case

125
y = 52.556Ln(x) - 74.461R2 = 0.9581
y = 56.97Ln(x) - 66.146R2 = 0.9963
0
20
40
60
80
100
120
5 10 15 20 25
volume concentration %
Tem
pera
ture
(deg
ree
C)
1-Butanol (Literature)
2-Butanol (Experiment)
Figure 4.17 Plot of phase diagram (cloud point) for 2-butanol in PS matrix at constant molecular weight Mn = 105,993 (avg.) and PD =2.117
y = -0.0127x + 5.9033R2 = 0.9996
1
1.2
1.4
1.6
1.8
2
2.2
300 310 320 330 340 350 360 370 380
Temperature (K)
Iinte
ract
ion
para
met
er
Interaction parameter Linear (Interaction parameter )
Figure 4.18 Estimation of interaction parameter for PS-2-butanol system
2-phase region
Single phase region
126
of 1-butanol may be attributed to its longer chain length and higher
molecular weight of the matrix.
The Flory-Huggins free energy of mixing Equation 4.2 is used to generate
the composition dependence of free energy of mixing in PS-2-butanol
system (Fig.4.19). Values of interaction parameter for 2-butanol were
taken from Table 4.4 and extrapolated to obtain values between room
temperature and 105°C (Fig.4.18) Equilibrium positions were found by the
common tangent rule (position of a tangent that also passes though the
point 0,0 ). The two equilibrium positions at 300K were found to be at
compositions ϕ ́ = 0 and ϕ˝= 0.94. This result is in agreement with
experimental observations where up to 7% by volume of 2-butanol was
found to be soluble in PS. Inflection points ( ϕsp) at different
temperatures were determined by setting the second derivative of the FH
equation to zero (Table 4.10). With increase in temperature the
equilibrium position ϕ˝ shifted to lower values while ϕ ́ stayed constant at
the origin (0). I t is evident from the phase diagram that at compositions in
the range of 8% by volume of 2-butanol (ϕ1 = 0.92) the metastable region
is significant and phase separation of 2-butanol by NG mechanism can be
expected at near room temperature. To further support this point the
spinodal and binodal curves were plotted and compared with the cloud
point results obtained by experiments.

127
-60
-40
-20
0
20
40
600 0.2 0.4 0.6 0.8 1
Polystyrene composition (ϕ)
ΔF/k
(K)
27°C40°C50°C65°C75°C85°C95°C105°C
T
Figure 4.19 Composition dependence of free energy of mixing for PS-2-butanol system

128
The binodal points were fitted with a logerathmic trendline while the spinodal
points were fitted with a linear trendline. The cloud point data lied within the
spinodal and binodal curves and was fitted well with a logerathmic trendline.
From analyzing Fig. 4.20 it can be concluded that the probability of phase
separation by NG mechanism is much higher than by SD in PS-2-butanol
system. However, the curves were generated considering FH equations that
presents a simplistic model, neglecting surface conformational entropy. The
other major assumptions in the FH equation are that there are no volume
changes upon mixing, and that the interaction parameter is assumed to be
20
30
40
50
60
70
80
90
100
110
120
0 0.1 0.2 0.3 0.4 0.5
2-butanol volume %
Tem
pera
ture
(°C
)
BinodalSpinodal2-butanol cloud pointLinear (Spinodal)Log. (Binodal)Log. (2-butanol cloud point)
Figure4.20 Comparison of the cloud point composition with calculated binodal and spinodal compositions as a function of temperature

129
independent of concentration. The theory also neglects free volume effects
and thus effects of temperature over free volume.
4.4.3 Expansion results from microwave experiments
Polystyrene pellets with varying concentration of 2-butanol were
synthesized by bulk polymerization and PIPS technique. 7.8% by weight
of 2-butanol (Sample 3 in Table 4.8) was found to be a critical
concentration where phase separation occurred. Characterized microwave
radiation was then successfully used to expand solid polymer pellets into
expanded polystyrene inside glass test tube molds (Fig. 4.21).
From microwave expansion experiments of PS pellets containing 2-
butanol, uniform foam formation was only observed for those samples
w i th p h ase s e p a ra t i o n . The 4% samp le d id no t expand unde r t he
Figure 4.21 a. PS pellet in glass tube mold; b. Pellet expanded into foam taking up shape of mold.
a b

130
experimental conditions, although void spaces were formed inside the
sample due to phase change of 2-butanol. (Fig. 4.23.a, b) The 6% sample
expanded but had high density and non-uniformity in its foam structure.
(Fig. 4.23.c, d) An overall volumetric increase of approximately 200%
was observed in the sample containing 8% by volume of 2-butanol. The
open cellular structures in 8% sample were found to be macroscopic in
dimensions without characteristic uniformity (Fig 4.23.e, f) . This was
probably due to non uniform diffusion rates and temperature gradient
within the sample. The surface to volume ratio of the expandable pellets
was identified as the control parameter for generating cellular foam with
uniform density and further experiments were carried out for size
optimization of the expandable PS resin (Sec. 4.5).
Using ionic conduction with 0.1% weight fraction of lithium per chlorate
(w.r.t 2-butanol), a significant increase in microwave coupling efficiency
was observed. In order to reach the target temperature of 93ºC a much
lower average power of 80W was required compared to average power of
175W in case of heating by dipole rotation. The target temperature of
93ºC was reached and steady state was obtained after 40 seconds of hold
time compared to 60 seconds required for the case of heating by dipole
rotation alone (Fig 4.24 a, b). The area under the power-time curve was
calculated to be approximately 9,000 Joules in case of heating by dipole

131
Figure 4.22 Image showing expansion of PS with varying concentrations of 2-butanol in cylindrical shape. a. expandable pellets, b. pellets expanded into foam
a
8% volumetric concentration of 2-Butanol
7% volumetric concentration of 2-butanol
6% volumetric concentration of 2-butanol
8% volumetric concentration of 2-butanol
7% volumetric concentration of 2-butanol
6% volumetric concentration of 2-butanol
b

132
Figure 4.23 Images of foam samples with varying 2-butanol concentration (a) 4% 2-butanol before microwave, (b) 4% sample after microwave showing internal void formation (c) 6% 2-butanol Top view after microwave (d) 6% 2-butanol side view showing non uniform expansion (e) 8% 2-butanol top surface of foam, (f) 8% 2- butanol cut surface of foam
e
a
c
b
d
f
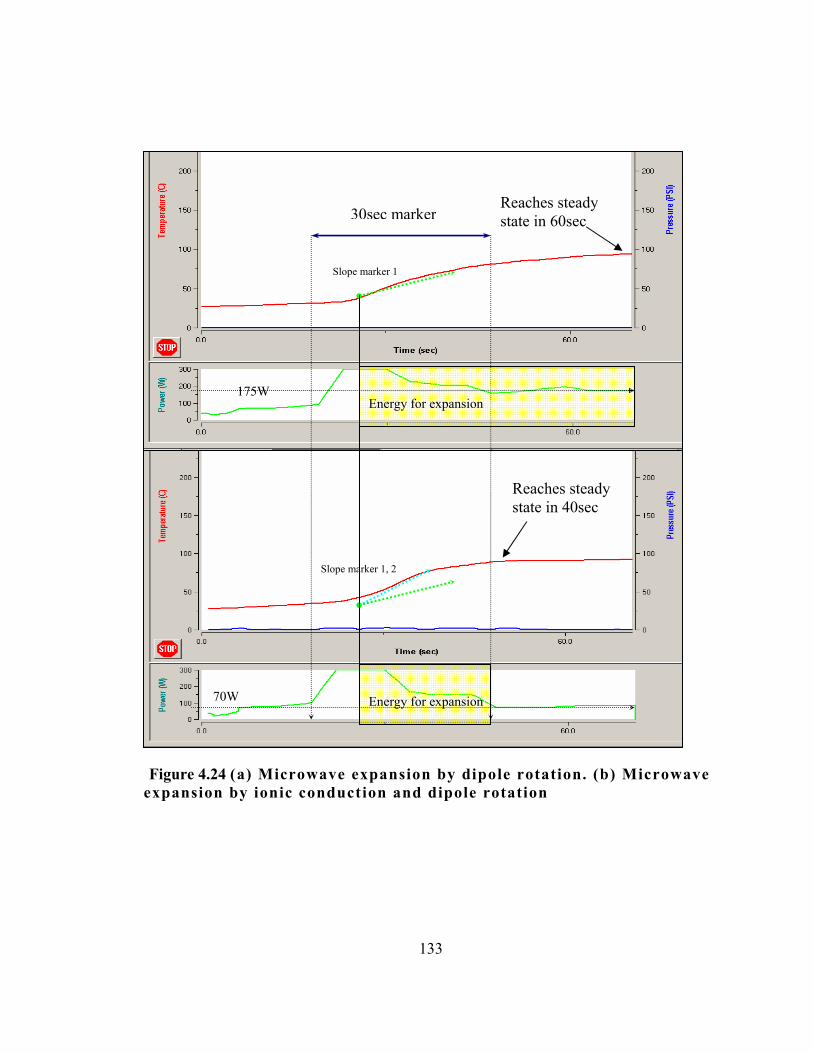
133
Figure 4.24 (a) Microwave expansion by dipole rotation. (b) Microwave expansion by ionic conduction and dipole rotation
30sec marker
Slope marker 1
175W
70W
Slope marker 1, 2
Reaches steady state in 40sec
Reaches steady state in 60sec
Energy for expansion
Energy for expansion
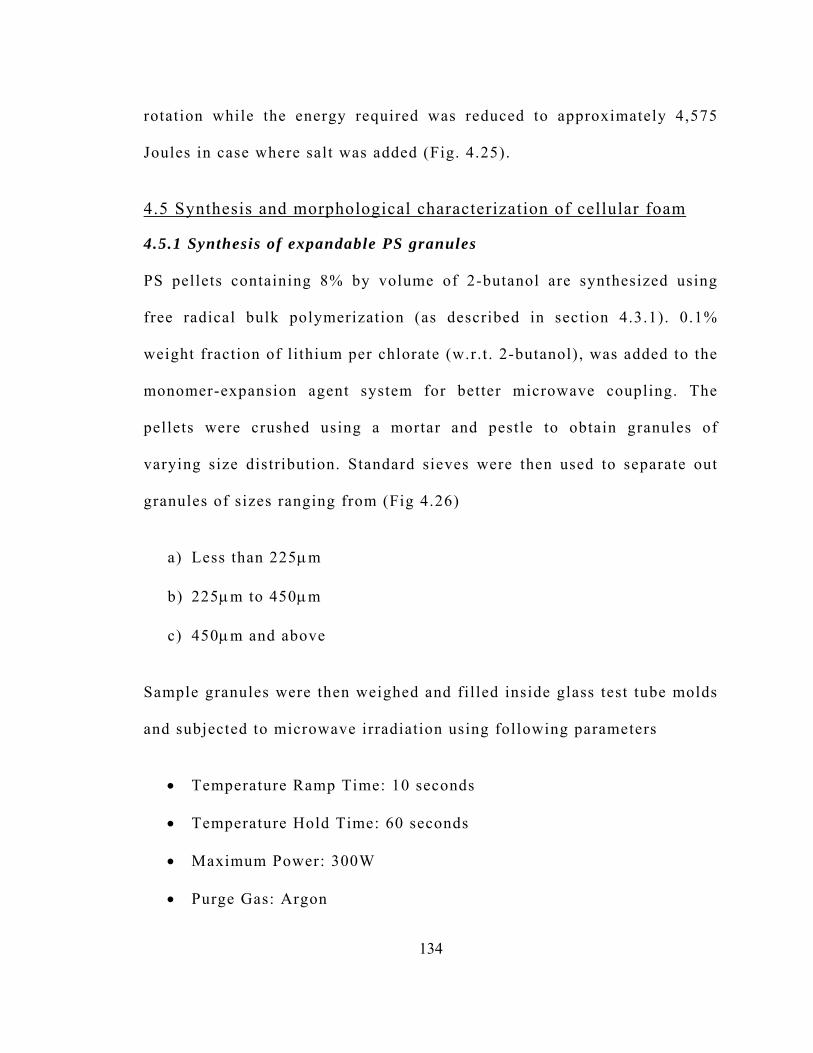
134
rotation while the energy required was reduced to approximately 4,575
Joules in case where salt was added (Fig. 4.25).
4.5 Synthesis and morphological characterization of cellular foam
4.5.1 Synthesis of expandable PS granules
PS pellets containing 8% by volume of 2-butanol are synthesized using
free radical bulk polymerization (as described in section 4.3.1). 0.1%
weight fraction of lithium per chlorate (w.r.t . 2-butanol), was added to the
monomer-expansion agent system for better microwave coupling. The
pellets were crushed using a mortar and pestle to obtain granules of
varying size distribution. Standard sieves were then used to separate out
granules of sizes ranging from (Fig 4.26)
a) Less than 225μm
b) 225μm to 450μm
c) 450μm and above
Sample granules were then weighed and filled inside glass test tube molds
and subjected to microwave irradiation using following parameters
• Temperature Ramp Time: 10 seconds
• Temperature Hold Time: 60 seconds
• Maximum Power: 300W
• Purge Gas: Argon

135
Figure 4.25 Comparison of energy required for expansion in case of microwave heating without (a) and with (b) ionic salts
Figure 4.26 Granules of expandable PS separated using standard sieves
Energy for expansion
Energy for expansion
a
b

136
Among the samples only granules with 225μm to 450μm size range
expanded to produce foam with characteristic morphology. Granule sizes
above 450μm expanded to form highly non uniform cells similar to
pellets. Granules lower in size than 225μm did not show any visible
expansion.
After expansion the foam samples were collected and density was
estimated from their volume and weight. The sample with granules in the
range of 225μm to 450μm showed approximately 200% increase in volume
and the density after expansion was calculated to be approximately
0.005gm/cc. The samples were then fractured and the fractured surfaces
were characterized for morphology using SEM.
4.5.2 Morphological characterization of cellular foam using SEM
A LEO 1525 Field Emission scanning electron microscope was used for
imaging. An open cellular structure with a characteristic morphology was
observed for PS foam synthesized from granules (unlike from pellets).
The cells were in the range of 100μm in dimension showing solid plate
like rosette structures for walls (see Fig. 4.27) instead of thin porous cell
walls found in commercially available foam (see Fig.2.5). Unlike
commercial EPS foam neither a honeycomb intercellular structure nor
distinct cellular boundaries were found in the microwave processed foam
samples. Possible reasons for such non uniformity may be

137
Figure 4.27 SEM images of expanded foam showing cellular morphology at various magnifications
30μm Mag =167X

138
1. No plasticizers were used in the case of microwavable foam which can
affect the flow behavior of the polymer during expansion
2. The phase separated domain sizes for 2-butanol were in the range of
2.5 μm and this resulted in cell structures in the range of 100μm instead
of 30 μm characterized in commercial EPS foam(see Fig.2.5). In
commercial foam the expansion agent is more uniformly dispersed in a
solution and there is no observable phase separation of pentane in PS
matrix.
3. Individual granules were not treated with surface treatment agents as
used in commercial process to keep the beads from sticking together. Thus
in the microwave processed foam samples no distinct cellular boundaries
were noticed due to coalescence of the granular boundaries during
expansion of the polymer.
4.6 Conclusions and future recommendations
• Conclusions from the chapter can be summarized as follows:
• A novel concept of using microwaves to achieve expansion of
polymeric foam was established using PS as a model polymer and 2-
butanol as a model expansion agent.
• Synthesis of polystyrene with varying concentrations of 2-butanol
was achieved in form of pellets.

139
• The polymer was characterized for molecular weight and
distribution. The expansion agent was characterized for phase
separation. Glass transition and temperature ranges of diffusion for
2-butanol was studied using characterization techniques like DSC
and TGA. Solubility phase diagram was determined based on cloud
point observations.
• Laboratory scale microwave technique was developed and
successful expansion of synthesized pellets was achieved. Uniform
foaming was observed in samples with phase separation while
irregular or no foaming was observed below a critical concentration
of 2-butanol in the PS matrix. Increase in microwave coupling
efficiency was observed using ionic salt dissolved in 2-butanol.
• It was shown that glass could be successfully used as a molding
material in order to achieve foam pattern in shape of the glass mold.
The study of novel expansion method for PS as discussed in this chapter
is a proof of concept and has immense potential for further research and
development. Future recommendations and scope of research are discussed
as follows:
• The developed expansion process for PS can be used as a simple
model for laboratory synthesis of different polymer cellular foam.
• As pointed out in section 4.2.2 many other alcohols are potential
candidates for expansion agents for EPS besides 2-butanol, using

140
the novel process. Further research should be directed towards
comparative study of dispersion for recommended alcohols (see
Table 4.5), characterization of microwave coupling and expansion.
• Alcohols have a selective band for absorption for infrared (IR)
radiation. Currently industrial IR sources are more efficient than
microwave sources and the IR heating technology is well developed.
Selective heating of alcohol phases and expansion using IR should
also be studied.
• Mechanical engineering design, modeling and manufacturing of
single component radiation based bead expander machine can be a
stand-alone research project. Efficient recovery and recycling of the
expansion agent should also be studied.
• Besides glass appropriate microwave transparent thermoset plastic
molds can be synthesized in order to eliminate currently used
expensive stainless steel molds and tooling. The whole process of
pre-expansion may be eliminated if expandable beads can be
maneuvered freely inside the microwave transparent mold, while
being expanded. This may be achieved by providing gyroscopic
motion to the mold during the expansion operation.
• Characterization of the raw polymer and the expanded foam
obtained from the novel process is essential for mechanical, thermal
properties and chemical compatibility for food grade and
commercial applications.

141
• It has been reported in case of thermally induced phase separation
of polymer blends, that the thermodynamics of phase separation is
controlled by concentration fluctuations in the early stage and by
diffusion and interfacial tension at a later stage [Luo, 2006]. The
sample pellets of expandable polystyrene containing 2-butanol were
synthesized by bulk polymerization in a precision furnace and
annealed at 50°C for 2 hours. The thermal effects of the phase
separation should be investigated by designing appropriate heat
treatment experiments.
• In order to achieve uniform closed cellular structure in the foam, it
is essential to obtain expandable beads [Snijders, 2003] Study of
regular suspension polymerization of styrene with dissolved 2-
butanol is recommended. Novel method for synthesis of the
expandable polymer beads using UV photo suspension
polymerization can also be valuable research. The research should
be focused on obtaining different size expandable PS beads with
varying concentrations of 2-butanol and characterizing for
molecular weight and phase separation.
• Finally, modeling the expansion process using microwave heating
may serve to understand and design complicated shapes and help in
process optimization.
142
REFERENCES Abbett, K.F., et al. , (2003) “Polymerization of 3-undecylbithiophene and preparation of poly(3-undecylbithiophene)/polystyrene composites in supercritical carbon dioxide”, Macromolecules 36 pp. 3015–3019. Benning, C.J., (1969) “Plastic Foams: The Physics And Chemistry Of Product Performance and Process Technology, Volume I: Chemistry And Physics Of Foam Formation”, John Wiley and Sons, New York Benson, R.S., (2004) ”Thermal and Morphological Characterization of EPS Foam and Relationship With Processing Parameters” Transactions of the American Foundry Society and the One Hundred Eighth Annual Metal casting Congress; Rosemont, IL; USA; pp. 1097-1112 Bernardo, G., (2007) “Equilibrium solubility of alcohols in polystyrene attained by controlled diffusion”, European Polymer Journal 43 938–948 Boustead, I. , (1999) “Eco-profiles of the European plastics industry. Brussels:, various reports on different types of plastics, 1993–1998”, for the APME (Association of Plastics Manufacturers in Europe). Crevecoeur J.J. et al. , (1999) “Water expandable polystyrene (WEPS) Part 1.Strategy and procedures “, Polymer Volume 40, Issue 13, Pages 3685-3689 Chan P.K. and Alejandro D. Rey., (1996) “Polymerization-Induced Phase Separation. 1. Droplet Size Selection Mechanism”, Macromolecules 29, 8934-8941 Chaplin,M.F., “Water Dielectric and Microwave Radiation” http://www.lsbu.ac.uk/water/microwave.html accessed on 5 Nov. 2007 CRC Handbook of Chemistry and Physics, (2006-2007) 87th edition English N. J. and MacElroy, J. M. D., (2003) “Hydrogen bonding and molecular mobility in liquid water in external electromagnetic fields”, J. Chem. Phys. 119 11806-11813. EPA (1990) “Control of VOC Emissions from Polystyrene Foam Manufacturing”, U.S. Environmental Protection Agency, Office of Air Quality Planning and Standards, EPA-450/3-90-020. Research Triangle Park, North Carolina. EPA (1983a) “Written communication from K. Fitzpatrick, ARCO Chemical Company, Monaca, PA, to D.R.Goodwin, U. S. Environmental
143
Protection Agency, Research Triangle Park, NC”. EPA (1983b) “Written communication from A. D. Gillen, BASF Wyandotte Corporation, Parsippany, NJ, to J. R. Farmer, U. S. Environmental Protection Agency, Research Triangle Park, NC”. Flory, P.J., (1953) “Principles of polymer Chemistry”, Cornell University Press, Ithaca, N.Y. Gharagheizi, et al. (2006) “A new improved method for estimating Hansen solubility parameters of polymers”, Journal of macromolecular science. Physics [0022-2348]; vol:45 iss:2 pg:285 -290 Greenhouse Gas Technology Center Southern Research Institute (2002) “Environmental Technology Verification Report” website: http://www.epa.gov/etv/pdfs/vrvs/03_vr_geco3001.pdf Gaiduk, V.I. , (1999) “Dielectric relaxation and dynamics of polar molecules” World scientific series in contemporary Chemical physics-Vol.8.
Hansen, C.M., (1967) “The Three-Dimensional Solubility Parameter and Solvent Diffusion Coefficient”, Ph.D. Thesis Danish Technical Press, Copenhagen, Denmark, Copenhagen
Hildebrand, J.H., (1916) “Solubility”, Journal of American Chemical Society, 38 (1916) 1452 Jensen, C., (1984) “Solubility Parameters: Theory and Application”, AIC Book and Paper Group Annual, Volume 3, pg. 13-58 Krevelin, V., (2003) “Properties of Polymers”, 3rd Edition, Elsevier Scientific Publishing Company Kappe, C.O. and Stadler, A., (2005) “Microwaves in organic and medicinal chemistry”, Wiley-VCH Volume 25 Kaatze, U. et al. , (2002) “Hydrogen network fluctuations and dielectric spectrometry of liquids”, J. Non-Crystalline Solids 305 19-28. Kyu,T. and Lee, J.H., (1995) “Nucleation Initiated Spinodal Decomposition in a Polymerizing System” Physical review letters 13 vol. 76,number 20 Leadbeater, N. and McGowan, C., (2006) “Clean, Fast Organic Chemistry:

144
Microwave assisted laboratory experiments”, CEM publishing Luo, K., (2006) “The morphology and dynamics of polymerization-induced phase separation” European Polymer Journal Vol. 42, Issue 7, Pages 1499-1505 Meyer,B.H. and Kinslow, J.C., (1991) “Purification, impregnation and foaming of polymer particles with carbon dioxide”, [United States Patent 5049328] Metaxas A.C. and R.J. Meredith, (1983) “Industrial microwave heating” (p. 60), Peter Peregrinus, London Meredith R., (1998) “Engineers’ Handbook of Industrial Microwave Heating”. IEE Power Series 25 (pg. 3,5,15) Moschiar, S.M. et al. , (1991) ” Rubber-modified epoxies. iii . Analysis of experimental trends through a phase separation model” Journal of applied polymer science, Vol. 42, Issue 3 , Pages 717 – 735 MSDS SIRI index. http://hazard.com/msds/ Oh,J. and Rey, A.D., (2000) “Theory and simulation of polymerization-induced phase separation in polymeric media” Macromolecular Theory and Simulations, Vol. 9, Issue 8 , Pages 641 – 660 Smyth, C.P., (1995) “Dielectric Behavior and Structure” McGraw-Hill Book company, Inc. International Chemical Series Snijders, E.J., (2003) “Water Expandable Polystyrene (WEPS) Computational and Experimental Analysis of Bubble Growth” Ph.D. Thesis. University of Eindhoven Sun et al. , (2005) “Final report on advanced lost foam casting technology Phase v “, DOE contract No. de-fc07-99id13840, Report No. 527985-2004 Yoshii , N. et al . , (2001) “A molecular dynamics study of dielectric constant of water from ambient to sub-and supercritical conditions using a fluctuating-charge potential model”, Chem. Phys. Lett. 345 195-200 Zhou, J. , (2004) “Microwave assisted moulding of starch-based foams”, PhD thesis, Brunel University,UK. Zhou J., Jim Song et al. , (2006) “Structure and properties of starch-based foams prepared by microwave heating from extruded pellets”. Carbohydrate Polymers 63, 466–475

145
Vita
Indraneel Sen was born in Calcutta, West Bengal, India on December 4th,
1975. He attended South Point High School and graduated in 1994.
Following high school Indraneel attended Jadavpur University, Calcutta,
India and graduated in 1999 with a bachelor of engineering degree in
Mechanical Engineering. Upon completion of college he began his
engineering career working first as an intern and then as a marketing
executive in India’s leading electrical engineering company Crompton
Greves Ltd. Indraneel resigned from office in February 2000 and started
his business in assembly of room air conditioning units with his father.
Realizing his dream to pursue research in technological field Indraneel
applied for higher studies in the United States of America. In 2002
Indraneel accepted a Graduate Research Assistantship position at
University of Tennessee at Knoxville and began his higher studies in
Polymer Engineering under the advisory of Dr. Roberto Benson from
Polymer Engineering department and later under co advisory of Dr.
Dayakar Penumadu of Civil and Environmental Engineering department.
Indraneel’s research was mainly focused on the study of degradation and
characterization of polystyrene foam used in lost Foam Casting. Indraneel
graduated as a Doctor of Philosophy in December 2007.