gastric acid secretion from parietal cells is mediated by...
TRANSCRIPT

Article
Gastric Acid Secretion from Parietal Cells Is
Mediated by a Ca2+ Efflux Channel in theTubulovesicleGraphical Abstract
Highlights
d ML1 antagonists inhibit gastric acid secretion in parietal cells
d Transgenic expression of ML1 in parietal cells causes
constitutive acid secretion
d ML1 is a Ca2+ release channel in the tubulovesicle
d Histamine-PKA signaling activates ML1-dependent
exocytosis of tubulovesicles
Sahoo et al., 2017, Developmental Cell 41, 262–273May 8, 2017 ª 2017 Elsevier Inc.http://dx.doi.org/10.1016/j.devcel.2017.04.003
Authors
Nirakar Sahoo, Mingxue Gu,
Xiaoli Zhang, ..., Linda C. Samuelson,
Juanita L. Merchant, Haoxing Xu
In Brief
Acid secretion from the parietal cells of
the stomach is essential for food
digestion. Sahoo et al. identified TRPML1
as a histamine-activated Ca2+ channel in
the tubulovesicles required for gastric
acid secretion. Synthetic agonists and
inhibitors of TRPML1 may be developed
to control acid secretion and treat acid-
related gastric diseases.

Developmental Cell
Article
Gastric Acid Secretion from Parietal CellsIs Mediated by a Ca2+ Efflux Channelin the TubulovesicleNirakar Sahoo,1 Mingxue Gu,1 Xiaoli Zhang,1 Neel Raval,1 Junsheng Yang,1,2 Michael Bekier,1 Raul Calvo,3
Samarjit Patnaik,3 WuyangWang,1 Greyson King,1 Mohammad Samie,1 Qiong Gao,1 Sasmita Sahoo,1 Sinju Sundaresan,4
Theresa M. Keeley,5 Yanzhuang Wang,1 Juan Marugan,3 Marc Ferrer,3 Linda C. Samuelson,4,5 Juanita L. Merchant,4
and Haoxing Xu1,6,*1Department of Molecular, Cellular, and Developmental Biology, University of Michigan, 3089 Natural Science Building (Kraus), 830 North
University, Ann Arbor, MI 48109, USA2Collaborative Innovation Center of Yangtze River Delta Region Green Pharmaceuticals, College of Pharmaceutical Sciences, Zhejiang
University of Technology, Hangzhou 310014, China3National Center for Advancing Translational Sciences, National Institute of Health, 9800 Medical Center Drive, Rockville, MD 20850, USA4Division of Gastroenterology, Department of Internal Medicine, University of Michigan, Ann Arbor, MI 48109, USA5Department of Molecular & Integrative Physiology, University of Michigan, Ann Arbor, MI 48109, USA6Lead Contact*Correspondence: [email protected]
http://dx.doi.org/10.1016/j.devcel.2017.04.003
SUMMARY
Gastric acid secretion by parietal cells requires traf-ficking and exocytosis of H/K-ATPase-rich tubulove-sicles (TVs) toward apical membranes in responseto histamine stimulation via cyclic AMP elevation.Here, we found that TRPML1 (ML1), a protein that ismutated in type IV mucolipidosis (ML-IV), is a tubulo-vesicular channel essential for TV exocytosis and acidsecretion. Whereas ML-IV patients are reportedlyachlorhydric, transgenic overexpression of ML1 inmouse parietal cells induced constitutive acid secre-tion. Gastric acid secretion was blocked and stimu-lated by ML1 inhibitors and agonists, respectively.Organelle-targeted Ca2+ imaging and direct patch-clamping of apical vacuolar membranes revealedthat ML1 mediates a PKA-activated conductance onTVmembranes that is required for histamine-inducedCa2+ release fromTVstores. Hence,wedemonstratedthat ML1, acting as a Ca2+ channel in TVs, links trans-mitter-initiated cyclic nucleotide signaling with Ca2+-dependent TV exocytosis in parietal cells, providinga regulatory mechanism that could be targeted tomanage acid-related gastric diseases.
INTRODUCTION
Acid secretion in the stomach ismediated by parietal cells that are
filled with vesicular and tubular organelles known as tubulove-
sicles (TVs), which carry the H+/K+-ATPase responsible for H+
pumping (Hersey and Sachs, 1995; Yao and Forte, 2003). Upon
stimulation with gastric transmitters (secretagogs), parietal cells
undergo striking morphological changes, including SNARE-
dependent membrane remodeling and actin-dependent cyto-
262 Developmental Cell 41, 262–273, May 8, 2017 ª 2017 Elsevier In
skeleton reorganization (Forte and Zhu, 2010). Subsequently,
TVs are translocated to fuse with apically directed canaliculi, re-
sulting in a large, deeply invaginated secretory surface that is con-
nected to the stomach lumen (Forte et al., 1977). The primary sec-
retagog is histamine, produced by enteroendocrine cells, which
activates the GS-coupled type 2 histamine (H2) receptor to initiate
a cyclic AMP (cAMP)-dependent signaling cascade (Chew et al.,
1980; Malinowska et al., 1988). Although some types of regulated
exocytosis, including synaptic neurotransmitter release, are Ca2+
dependent (Thorn et al., 2016), it remains uncertain whether Ca2+
is involved in histamine-triggered TV exocytosis (Chew and
Brown, 1986; Negulescu et al., 1989; Yao and Forte, 2003).
Acetylcholine, which also acts as a gastric secretagog, has
been shown to induce large releases of Ca2+ from ERCa2+ stores
(Forte and Zhu, 2010; Negulescu et al., 1989). Meanwhile, hista-
mine has been reported to induce very small Ca2+ increases in
the gastric parietal cells of some species, and no detectable
Ca2+ responses in other species (Chew and Brown, 1986; Cour-
tois-Coutry et al., 1997; Negulescu et al., 1989; Yao and Forte,
2003). In other processes for which Ca2+-dependence has been
debated, organelle-targeted Ca2+ imaging methods with very
high detection sensitivity have implicated that non-ERCa2+ stores
are essential for the cellular response (Xu et al., 2015).
Transient receptor potential mucolipin-1 (ML1, also known as
TRPML1 or MCOLN1) is the principle Ca2+ release channel in the
lysosome; it regulates membrane fusion/fission and the trans-
port of lysosomes in response to cellular cues (Xu and Ren,
2015). Notably, mutations in the gene that encodes ML1 in hu-
mans cause type IV mucolipidosis (ML-IV), a neurodegenerative
disease with an additional gastric phenotype of constitutive
achlorhydria, which is recapitulated in ML1 knockout (KO) mice
(Chandra et al., 2011; Schiffmann et al., 1998; Venugopal et al.,
2007). The aim of the present study was to investigate whether
ML1 has a direct role in gastric acid secretion. To address this
question, we examined how gastric acid secretion is altered in
genetically engineered mouse models and affected by direct,
pharmacological manipulations of ML1 channel activity.
c.
RESULTS
Synthetic Inhibitors ofML1 BlockGastric Acid SecretionTo test the physiological role of ML1 in proton secretion, we
isolated stomachs, glands, and parietal cells from wild-type
(WT) and ML1 KO mice (Venugopal et al., 2007). The gastric
corpus glands were pathologically enlarged in ML1 KO mice
(Figures 1A and S1A–S1E), suggestive of a hypertrophic
phenotype. Compared with glands from WT controls, ML1
KO mouse glands had increased corpus height (Figures S1D
and S1E), abnormal parietal cell morphology, number, and
proliferation (Figures S1F–S1I), increased mucosal thickness
(Figure S1F), reduced expression of ab heteromeric H+/K+-
ATPase (Figures S1J and S1L), and increased expression of
lysosome-associated membrane protein 1 (Lamp1, Figures
S1J and S1K). Patch-clamping of vacuolin-1-enlarged vacu-
oles (Dong et al., 2010) in parietal cells within cultured corpus
glands revealed whole-endolysosome ML1-mediated currents
(IML1) in WT, but not ML1 KO, parietal cells (Figures 1B
and 1C).
As a quantitative measure of H+/K+-ATPase-dependent pro-
ton secretion, we determined the rate of Na+-independent cyto-
plasmic pH (pHc) recovery (NIPR) bymeasuring the fluorescence
intensity of the pH-sensitive dye BCECF (Pasham et al., 2013)
(Figure S1O). NIPR was virtually absent under resting conditions
(Figures 1D and 1H) in both WT (0.006 ± 0.003 DpH/min, n = 29
cells) andML1 KO parietal cells. Histamine stimulation increased
NIPR by �1,400% to 0.084 ± 0.009 DpH/min (n = 24) in
WT cells, but did not affect NIPR in ML1 KO parietal cells
(0.008 ± 0.005 DpH/min, n = 28, Figures 1E, 1G, and 1H).
Conversely, there was no detectable histamine-induced NIPR
in the presence of omeprazole, a specific H+/K+-ATPase inhibitor
commonly used to treat gastric diseases (Shin et al., 2009) (Fig-
ure S1P). Strikingly, brief exposure of WT parietal cells to ML-SI3
or ML-SI4 (10–20 mM), two structurally independent ML1 inhibi-
tors (Zhang et al., 2016), also abolished histamine-induced NIPR
(Figures 1F and 1H).
We next investigated the role of ML1 in acid secretion
in vivo. Intraperitoneal injection of histamine resulted in a rapid
increase in whole-stomach acid contents in WT, but not ML1
KO mice (Figures 1I and 1J). This histamine induction of
stomach acid secretion was attenuated markedly in the pres-
ence of intragastric ML-SI3 or ML-SI4 (Figures 1K and S1Q).
Furthermore, in an ex vivo acid secretion assay, in which
luminal acidification traps protonated 14C-labeled aminopy-
rines in enzymatically isolated glands (Mettler et al., 2007),
pre-incubation with ML-SI3 or ML-SI4 blocked histamine-
induced [14C]aminopyrine uptake (Figure 1L). These results,
from three independent acid secretion assays, suggest that
ML1 functions as a direct physiological regulator of gastric
acid secretion and provide counterevidence to the prior sug-
gestion that secondary or developmental defects underlie
the achlorhydria phenotype of ML1 KO mice and ML-IV pa-
tients (Chandra et al., 2011).
ML1 Agonists Induce Gastric Acid SecretionIndependent of HistamineIncubation of WT parietal cells with the ML1 agonist ML-SA1 or
the more potent structurally independent agonist ML-SA5 (Shen
et al., 2012; Zhang et al., 2016) resulted in an NIPR that was
�1,000% of that observed in untreated WT cells (Figures 2A–
2C). Conversely, ML-SA treatment did not affect NIPR in ML1
KOparietal cells. ML-SA-triggered NIPR inWT cells was blocked
completely by omeprazole (Figure S1R). In addition, acid secre-
tion was also increased markedly by ML-SA5 in both stomachs
and isolated glands obtained from WT, but not ML1 KO, mice
(Figures 2D–2G). Taken together, these results suggest that
ML1 activation is sufficient to induce acid secretion both
in vitro and in vivo.
Transgenic ML1 Overexpression in Parietal CellsCauses Constitutive Secretion of Gastric AcidTo investigate the in vivo role of ML1 in acid secretion, we gener-
ated a targeted transgenic mouse model, in which a floxed (fL)
allele carrying the GCaMP3-ML1 transgene (Shen et al., 2012)
was integrated into the ROSA26 locus behind a loxSTOPlox
cassette (Figure S2A). Crossing ROSA-loxSTOPlox-GCaMP3-
ML1 (abbreviated ML1 ROSA-lSl) mice with a parietal cell-spe-
cific Cre line (ATP4B Cre; see Syder et al., 2004) generated pari-
etal cell-specific ML1 overexpression (ML1 ROSA-lSl:ATP4B
Cre orML1PC) mice (Figures 2H and S2B).We observedmultifold
increases in both basal andML-SA-activatedML1 currents, rela-
tive to WT levels, in ML1PC parietal cells (Figures 2K and 2L),
consistent with increased transcription and protein expression
of ML1 in the corpus glands and parietal cells of ML1PC mice
(Figures 2I, 2J, S2C, and S2D).
Notably, a high NIPR rate was observed in ML1PC parietal
cells even under resting conditions without histamine
(0.076 ± 0.010DpH/min, n = 22; Figures 2M and 2O). This consti-
tutive NIPR, which was as large as histamine-stimulated NIPR in
WT cells, was blocked completely by ML-SIs (Figures 2N and
2O) or omeprazole, but not by histamine receptor antagonists
(Figure S2E). Plasma gastrin levels, a negative indicator of stom-
ach acidity related to acid-hormone feedback inhibition (Trudeau
and McGuigan, 1971), was elevated in ML1 KOmice (Figure 2P).
Conversely, plasma gastrin levels were lower in ML1PC mice and
in WT mice that were administered with ML-SA5 via oral gavage
than in controls (Figure 2P). Taken together, these results sug-
gest that the hyper-chlorohydric phenotype of ML1PC mice is
caused by histamine-independent acid secretion induced by
ML1 upregulation.
Localization of ML1 Proteins in the TVsWe next investigated the subcellular localization of ML1 with
dual-STED super-resolution imaging. Double immunohisto-
chemistry analyses revealed that GCaMP3-ML1 (detected by
anti-GFP antibodies) was co-localized partially with Lamp1 (Fig-
ure S3A). However, ML1 immunoreactivity was observed mostly
in Lamp1-negative compartments in the parietal cells (Fig-
ure S3A). Indeed, both endogenous ML1 (detected by anti-
ML1 antibodies) and GCaMP3-ML1 were co-localized mostly
(60%–80%) with a or b subunit of H+/K+-ATPase (Figures 3A–
3C), which are TV markers (Courtois-Coutry et al., 1997). In
contrast, Lamp1 and H+/K+-ATPase were rarely co-localized
with each other (Figure S3B). Moreover, the subcellular localiza-
tion of GCaMP3-ML1 was confirmed by immunogold electron
microscopy wherein gold particles were localized in the limited
membranes of TV-like vesicles in ML1PC cells (Figure 3D). These
Developmental Cell 41, 262–273, May 8, 2017 263

F
A B
D
C
E
G H I
J
ML1
Tubulin
Corpus Gland
ML1 KOW
T
K L
ML1 KOWTWhole-endolysosome
WT ML1 KOML1 KO
WT Parietal Cell WT
Corpus Gland
WT Stomach
WT
ML1 KOWT ML1 KO
Figure 1. ML1 Involvement in Histamine-Stimulated Acid Secretion
(A) Corpus gland immunoblots.
(B and C)Whole-endolysosomal IML1 was activated by TRPML agonists (ML-SA1/3/5; 1–20 mM) and inhibited byML1 antagonists ML-SI3/4 (10–20 mM) inWT (B),
but not ML1 KO parietal cells (C).
(D–G) Histamine (100 mM+20 mM IBMX) andML-SI4 (10 mM) effects on proton secretion, indexed byNIPR observedwhile cytoplasmic pH (pHc) was under H+/K+-
ATPase control (see also Figure S1O) relative to responses in 0 Na+ (red dotted lines).
(H) NIPR rates (n = 10–30 cells) under resting and histamine-stimulated conditions.
(I and J) Whole-stomach acid contents following histamine administration (1 mg/kg, intraperitoneally).
(K) Histamine-induced acid increases in the presence of ML-SI3 (20 mM) or ML-SI4 (10 mM). n = 3–4 mice/group.
(L) Effect of ML-SIs on histamine-stimulated [14C]aminopyrine accumulation in gastric glands (n = 4 mice per experiment; normalized to basal output). ML-SI3
(20 mM) and ML-SI4 (10 mM) were applied 30 min before histamine (100 mM + 20 mM IBMX).
(H), (K), and (L) show mean ± SEM from R3 experiments. *p < 0.05, **p < 0.01, ***, p < 0.001, one-way ANOVA, Bonferroni’s post hoc analysis.
results suggest that within parietal cells, ML1 is present in H+/K+-
ATPase-resident TVs as well as in Lamp1-resident late endo-
somes and lysosomes.
264 Developmental Cell 41, 262–273, May 8, 2017
In TV-derivedmembrane fractions isolated by cellular fraction-
ation (Suda et al., 2011), which are enriched with H+/K+-ATPase
but devoid of Lamp1, both endogenous ML1 and GCaMP3-ML1

A CB D
E G H
I J K
M ON
L
H/K ATPase
ML1PC
ML1 Rosa lS
l
ATP4B Cre
ML1
α−ML1 WB:
GCaMP3 -ML1
Tubulin
ML1PC
ML1 Rosa lS
l
ATP4B Cre
F
ML1
PCM
L1 R
osa
lSl
WT Parietal Cell ML1 KO
P
WT Stomach
HK-ATPaseML1 MergedML1PC
ML1 KOWT Corpus Gland ML1 KO
ML1PC Parietal Cell
ML1PC Parietal Cell WT
Figure 2. ML1 Activation Induces Gastric Acid Secretion
(A and B) ML-SA5 (10 mM, applied 1 hr prior) potentiation of NIPR inWT (A), but not ML1 KO (B) parietal cells. A linear fit (red dotted line) was used to determine the
rate of pH recovery during re-alkalization.
(C) NIPR of ML-SA5-treated WT and ML1 KO parietal cells.
(D and E) Representative traces of ML-SA5 effects on whole-stomach acid contents in vivo.
(F) Average acid secretory rates (n = 3–4 mice/group).
(G) ML-SA5 effects on [14C]aminopyrine incorporation into isolated glands.
(H) Genotype verification of ML1 Rosa-loxSTOPlox (lSl), ATP4BCre, and ML1 Rosa-lSl:ATP4B-Cre (ML1PC) mice. Three DNA bands, each amplified by specific
PCR primers, represent WPRE (upper), ROSA (middle), and ATP4BCre (lower) (see Figure S2A).
(I) Immunohistochemical detection of GCaMP3-ML1 and H+/K+-ATPase a subunit in corpus tissues. Scale bar, 100 mm.
(J) Immunoblot demonstration of GCaMP3-ML1 expression in ML1PC corpus glands.
(K) Whole-endolysosome IML1 in ML1PC parietal cells.
(L) IML1 current densities in parietal cells.
(M and N) ML-SI4 (10 mM) annulment of constitutive NIPR in ML1PC parietal cells.
(O) ML-SI4 effects on ML1PC-cell NIPR.
(P) Plasma gastrin levels of overnight-fasted WT (control, histamine, and ML-SA5), ML1 KO, ML1PC, and ML1 KO:ML1PC mice. Quantitative data are means ±
SEM from R3 experiments.
**p < 0.01, ***p < 0.001, one-way ANOVA, Bonferroni’s post hoc analysis (G and P) or Student’s t test (C, F, and O).
were abundantly detected (Figures 3E and S3C). When the TV-
derived membranes were further immunoisolated by using
anti-H+/K+-ATPase-a (Calhoun and Goldenring, 1997; Lapierre
et al., 2007), the resultant high-purity TVs also contained abun-
dant ML1 proteins (Figure 3F). Consistently, co-immunoprecipi-
tation analyses revealed that both endogenous and recombinant
ML1 proteins were in the same protein complex with a or b sub-
units of H+/K+-ATPase (Figures S3D and S3E). Collectively,
Developmental Cell 41, 262–273, May 8, 2017 265

these results suggest that ML1 is targeted predominantly to the
TVs of parietal cells.
Activation of ML1 Induces Ca2+ Release from TVsLike lysosomes, TVs are also intracellular Ca2+ stores (Tsunoda
et al., 1988). In GCaMP3-ML1-expressing parietal cells isolated
from ML1PC mice, application of ML-SA1 or ML-SA5 (1–10 mM)
in a ‘‘zero’’ Ca2+ external solution (free [Ca2+ < 10 nM]) evoked
robustCa2+ releaseevidencedbyGCaMP3fluorescencechanges
(FigureS3F) in time-lapseconfocalmicroscopy (DF/F0; Figures3G
and 3I). ML-SA5-induced Ca2+ release was also observed in
GCaMP3-ML1-transfected HEK293 cells (Figures 3H and 3I).
However, when cells were pretreated with GPN (glycylphenyla-
lanine 2-naphthylamide), a membrane-permeable dipeptide that
depletes lysosome Ca2+ stores (Berg et al., 1994), ML-SA5-
induced Ca2+ responses were abolished in HEK293 cells but
preserved in parietal cells (Figures 3G–3I). Hence, unlike other
cell types wherein ML1 is localized exclusively to lysosomes, in
parietal cells ML1 is expressed in GPN-inaccessible TVs. Taken
together, these results establish TVs as intracellular Ca2+ stores
in which ML1 is functionally present.
ML1 Channel Activity Is Necessary and Sufficient for TVExocytosisTo investigate the role of ML1 in TV trafficking and exocytosis,
we conducted immunofluorescence analysis on live glands, in
which cells with fragmented versus continuous phalloidin (actin)
staining are considered to be in the ‘‘resting’’ and ‘‘stimulated’’
state, respectively (Zavros et al., 2008). In WT glands, the major-
ity of parietal cells were in a ‘‘resting’’ state (Figures S3G and
S3H). Upon histamine stimulation, most parietal cells switched
to a ‘‘stimulated’’ configuration (Figures S3G and S3H). On the
other hand, in ML1PC glands, the majority of parietal cells ap-
peared to be ‘‘stimulated’’ even in the absence of histamine stim-
ulation (see Figures S3G and S3H).
To further investigate the role of ML1 in TV exocytosis, we em-
ployed transmission electron microscopy (TEM). Consistent with
previous studies (Forte et al., 1977), numerous free TVs were
observed throughout the cytosol of parietal cells in stomach sec-
tions from WT mice (Figures 3J, S3I, and S3K). Following intra-
peritoneal histamine treatment, extensive canalicular invagina-
tions were observed with minimal free TVs in WT specimens
(Figures 3J, S3I, and S3K). Strikingly, similar canalicular struc-
tures were observed in resting ML1PC parietal cells, again with
few free cytosolic TVs (Figures 3J, S3J, and S3K). Following
administration of ML-SIs to ML1PC mice, relatively little canalic-
ular extension was observed, whereas abundant free TVs were
seen throughout the cytosol of parietal cells (Figures 3J, S3J,
and S3K). These results suggest that the ML1PC phenotype is
associated with elevated TV exocytosis, and that ML1 blockage
in ML1PC tissues leads to TV reformation/biogenesis (Forte and
Zhu, 2010).
In cultured parietal cells, upon secretagog stimulation apical
canalicular membranes are engulfed into the cell to formmultiple
actin-wrapped vacuoles known as vacuolar apical compart-
ments (VACs), which remain separate from the basolateral mem-
brane and free TVs in the cytosol (Nakada et al., 2012). Hence,
total VAC membrane area provides a quantitative measurement
of TV exocytosis (Nakada et al., 2012). In resting WT cells, small
266 Developmental Cell 41, 262–273, May 8, 2017
(diameter <2 mm) VACs were observed occasionally with a total
surface area <20 mm2 (Figures 4A and 4B). VACs formed within
10–20 min after bath application of histamine (Figures 4A and
4B; Movies S1 and S2) and then fused together to generate
one or a few large VACs (up to 8 mm in diameter; total VAC sur-
face area >50 mm2; Figures 4A, 4B, S4A, and S4B). Histamine-
stimulated VAC formation was abolished by ML-SIs (Figures
4A and 4B). In contrast, VAC formation induced by the acetyl-
choline receptor agonist carbachol was insensitive to ML-SIs
(Figures S4C and S4D). No histamine-induced VAC formation
was observed in ML1 KO parietal cells (Figures S4E and S4F).
Hence, ML1 was found to be necessary for histamine-depen-
dent TV exocytosis. On the other hand, ML-SA5 treatment was
sufficient to induce VAC formation in WT cells (Figures 4A and
4B;Movie S3). Furthermore, large VACswere observed in resting
ML1PC parietal cells, but their presence was decreased sharply
by ML-SI4 (Figures 4C, 4D, and S4G), but not by histamine or
muscarinic receptor blockers (Figure S4H). Taken together,
these results suggest that ML1 plays an essential role in TV
exocytosis.
ML1-Mediated Ca2+ Release Increases HomotypicFusion of TVs In VitroTubulovesicles may fuse with each other upon secretagog stim-
ulation (Duman et al., 2002; Forte and Zhu, 2010). We investi-
gated the roles of ML1 and Ca2+ in this process using isolated
TVs with flow cytometry to determine TV size. Large-sized TVs
(>1 mm), which presumably resulted from homotypic fusion of
small ones, were increased by more than 20-fold upon addition
of external Ca2+ to isolated TVs (Figures 4E and S4I–S4N).
Notably, application ofML-SA5 also increased the size and gran-
ularity of TVs, and this effect was inhibited byML-SI4 (Figures 4E
and S4I–S4N). Hence, ML1 activation may readily increase
membrane fusion between TVs.
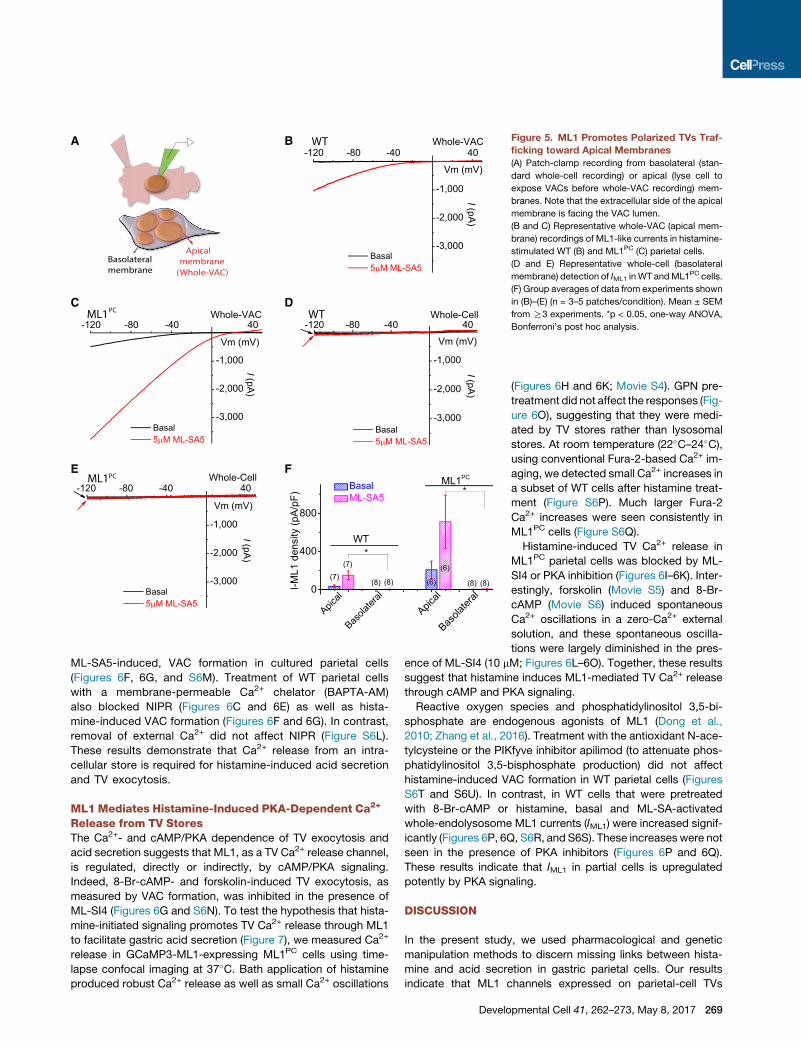
ML1Promotes Polarized Trafficking of TVs to Apical, butNot Basolateral, MembranesConsistent with the hypothesis that histamine induces trafficking
and fusion of TVs toward apical canalicular membranes (Forte
andZhu, 2010), our immunofluorescence analysis of cultured pa-
rietal cells revealed that the a subunit of H+/K+-ATPase accumu-
lated in VACmembranes, but was absent from basolateral mem-
branes (Figures 4A, 4C, and S4G). In ML1PC cells, ML1 proteins
also accumulated in VAC membranes, in addition to the pre-
sumed lysosomal and tubulovesicular localizations (Figures 4C
and S4G). To further probe TV trafficking, we developed a
patch-clamp method to record directly from VAC membranes
isolated from ML1PC cells or histamine-stimulated WT cells
(whole-VAC recording; Figure 5A). Native VAC membranes are
composed of both apical membranes and TV membranes (Na-
kadaet al., 2012) (Figure 5A).Conversely, theplasmamembranes
of cultured parietal cells consist exclusively of basolateral mem-
branes, which can be subjected to whole-cell recording (Fig-
ure 5A). In thewhole-VACpatch configuration, inwardly rectifying
ML1-like currents were observed in histamine-treated WT cells
(basal IML1 = 33 ± 11 pA/pF, n = 7) and ML1PC cells (Figures 5B,
5C, and 5F), and these currents were potentiated by ML-SA5
(149 ± 45 pA/pF, n = 7; Figures 5B, 5C, and 5F). Substantial
IML1 was detected even in VAC-cytosolic-side-out patches

A C
E G
H I
J
Parietal Cell (Dual-STED)
ML1 KI 1LMhcamotSTW PC Stomach
Resting ML-SI4Histamine
ML1PC Parietal Cells
HEK293 Cells
Resting
WT ML1PC
P1(LY) (TV)
HK-
ML1
Lamp1
WB:P2 P3
(PM)
WT
HK-ATPaseGCaMP3-ML1 Merged
ML1PC
ML1 HK-ATPase Merged
ML1+Peptide block HK-ATPase Merged
D
F
B
P3 B U B U
ML1
VAMP2
HK- IgG
WB
HK-
IP:
A
TV
A
A
A
TV
Figure 3. TV-Localized ML1 Mediates Ca2+ Release from TVs
(A) Dual-STED images of WT corpus tissues immunolabeled with anti-HK-a and anti-ML1. A pre-incubation of anti-ML1 with ML1 epitope peptide confirmed the
specificity of the ML1 antibody. Scale bar, 5 mm.
(B) Dual-STED images of ML1PC corpus tissues immunolabeled with anti-HK-a and anti-GFP (recognizing GCaMP3-ML1). Note that constitutive TV exocytosis in
ML1PC cells was blocked by ML-SI4 for this particular experiment. Scale bar, 5 mm.
(C) Quantitative co-localization analysis of ML1 and H/K-ATPase based on randomly selected images, as shown in (A) and (B).
(D) Immunogold electron microscopy images of WT and ML-SI4-treated (to prevent constitutive TV exocytosis) ML1PC parietal cells. Scale bar, 0.1 mm.
(E) Gradient centrifugation purification of TVs from WT parietal cells. P1 (3,200 3 g), P2 (20,000 3 g), and P3 (100,000 3 g) pellets represent plasma membrane
(PM)-rich, lysosome/mitochondria (LY), and H+/K+-ATPase–rich fractions (TV), respectively.
(F) The expression of ML1, H+/K+-ATPase, and VAMP2 in TVs that were immunoisolated by anti-HK-a from P3 TV-derived membranes in (E). Immunoglobulin G
(IgG) was used as a negative control. Western blot (WB) analyses were performed in both bound (B) immunoisolated vesicles and unbound (U) supernatants using
P3 (see E) as a comparison. Shown were representative blots of three separate experiments. IP, immunoprecipitation.
(legend continued on next page)
Developmental Cell 41, 262–273, May 8, 2017 267

A B
C
DM
SOM
L-SI
4
ML1PC Parietal Cell ML1 Phalloidin Merged
WT Parietal Cell
DM
SOH
ista
min
eH
ista
min
e +
ML-
SI4
ML-
SA5
Phalloidin MergedHK-ATPase
D
E
Figure 4. ML1 Is Necessary and Sufficient to
Trigger TV Exocytosis
(A) Anti-HK-a immunocytochemistry with phalloi-
din-labeled F-actin. Cells were treated withML-SA5
(10 mM) or histamine (50mM + 10 mM IBMX) in the
presence or absence of ML-SI3 (20 mM) or ML-SI4
(10 mM) for 30 min at 37�C. Scale bar, 10 mm. Blue
and white arrows indicate basolateral and apical
membranes, respectively.
(B) VAC total surface area, an index of TV exo-
cytosis associated with gastric acid secretion,
under various treatment conditions (average of 3–6
z-plane sections/cell). Mean ± SEM from R3
experiments. ***p < 0.001, one-way ANOVA, Bon-
ferroni’s post hoc analysis.
(C) ML-SI4 (10 mM) effects on constitutive VAC
formation in ML1PC parietal cells. Scale bar, 10 mm.
Blue and white arrows indicate basolateral and
apical membranes, respectively.
(D) ML-SI effects on VAC total surface area.
Mean ± SEM from R3 experiments. ***p < 0.001,
one-way ANOVA, Bonferroni’s post hoc analysis.
(E) Summary of the percentages of large TVs as
determined from the G2 gate (>1 mm) of FSC/SSC
dot plots. Mean ± SEM from four experiments.
*p < 0.05, **p < 0.01, Student’s t test.
(Figure S5). Whole-cell IML1 was not detected in histamine-stim-
ulated WT cells (1 ± 0.5 pA/pF, n = 8) or ML1PC cells (Figures
5D–5F and S5). These results implicate ML1 in polarized traf-
ficking and exocytosis of TVs toward apical membranes.
Parietal Cell-Specific Expression of ML1 RestoresGastric Acid Secretion in ML1 KO MiceTo further investigate the role ofML1 in gastric acid secretion, we
crossedML1 KO (also carrying loxP alleles) with ML1PC mice, re-
sulting in Cre-dependent expression of ML1 restricted to parietal
cells (Figures S6A–S6I). In these ML1 KO: ML1PC mice, whole-
endolysosome ML1 currents, TV Ca2+ release, histamine-
induced acid secretion, and normal plasma gastrin levels (Fig-
ure 2P) were largely restored (NIPR = 0.075 ± 0.019 DpH/min,
(G and H) Effects of GPN pretreatment on ML-SA5-induced Ca2+ release (GCaMP3 fluorescence, F480, in
GCaMP3-ML1-transfected HEK293 cells (H). Cells were pretreated withML-SI4 for 30min to prevent TV exo
at which ML-SA5 was applied.
(I) Quantitation of ML-SA5-induced GCaMP3 Ca2+ responses under control and GPN-pretreated conditions
experiment). ***p < 0.001, Student’s t test.
(J) TEM images of free TVs and apical canaliculi (A) in parietal cells. Scale bar, 0.5 mm.
268 Developmental Cell 41, 262–273, May 8, 2017
n = 13; Figures S6B–S6H). Notably, ML1
KO:ML1PC mice had a relatively normal
stomach size (Figure S6I), suggesting
that ML1 deficiency in parietal cells under-
lies the abnormal stomach anatomy seen
in ML1 KO mice.
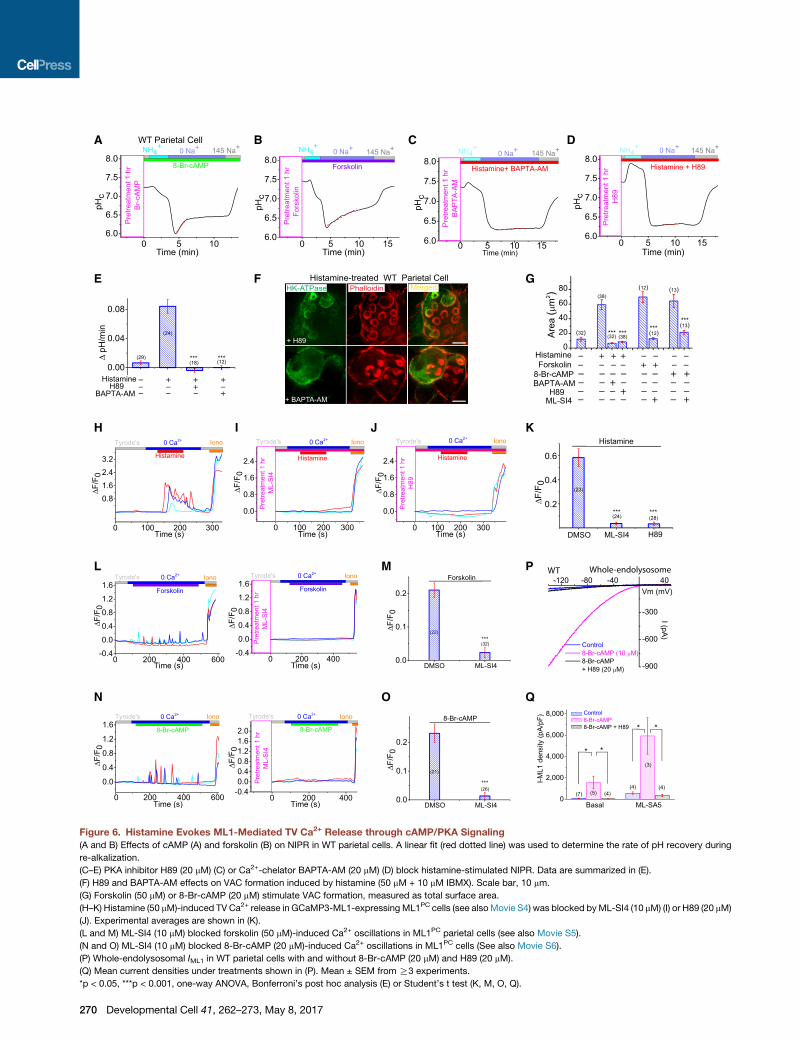
Histamine-Induced TV Exocytosisand Acid Secretion Require cAMP/Protein Kinase A and Ca2+ SignalingHistamine-dependent activation of pari-
etal H2 receptors activates cAMP-
dependent protein kinase A (PKA) to phosphorylate multiple
target proteins required for TV exocytosis (Forte and Zhu,
2010). Consistent with previous studies (Forte and Zhu,
2010), robust NIPR was induced in WT parietal cells treated
with the cAMP-elevating agent forskolin or the membrane-
permeable cAMP analog 8-Br-cAMP (8-bromoadenosine
30,50-cyclic monophosphate) (Figures 6A and 6B). Conversely,
histamine-stimulated NIPR in WT parietal cells was blunted
by the PKA inhibitor H89 (20 mM; Figures 6D and 6E). Hence,
cAMP/PKA signaling was found to be necessary for hista-
mine-induced acid secretion and TV exocytosis in WT cells.
On the other hand, ML-SA or ML1PC-induced NIPR was
not affected by PKA inhibition (Figures S6J and S6K).
Likewise, PKA inhibitors blocked histamine-induced, but not
zero Ca2+ solution) from ML1PC parietal cells (G) or
cytosis. Downward arrow (H) indicates the time point
(mean ± SEM, n = 30–50 cells from %4 coverslips/
Apical membrane
(Whole-VAC)Basolateralmembrane
A B
C
F
D
E
ML1PC
WT
WT
ML1PC
Figure 5. ML1 Promotes Polarized TVs Traf-
ficking toward Apical Membranes
(A) Patch-clamp recording from basolateral (stan-
dard whole-cell recording) or apical (lyse cell to
expose VACs before whole-VAC recording) mem-
branes. Note that the extracellular side of the apical
membrane is facing the VAC lumen.
(B and C) Representative whole-VAC (apical mem-
brane) recordings of ML1-like currents in histamine-
stimulated WT (B) and ML1PC (C) parietal cells.
(D and E) Representative whole-cell (basolateral
membrane) detection of IML1 in WT andML1PC cells.
(F) Group averages of data from experiments shown
in (B)–(E) (n = 3–5 patches/condition). Mean ± SEM
from R3 experiments. *p < 0.05, one-way ANOVA,
Bonferroni’s post hoc analysis.
ML-SA5-induced, VAC formation in cultured parietal cells
(Figures 6F, 6G, and S6M). Treatment of WT parietal cells
with a membrane-permeable Ca2+ chelator (BAPTA-AM)
also blocked NIPR (Figures 6C and 6E) as well as hista-
mine-induced VAC formation (Figures 6F and 6G). In contrast,
removal of external Ca2+ did not affect NIPR (Figure S6L).
These results demonstrate that Ca2+ release from an intra-
cellular store is required for histamine-induced acid secretion
and TV exocytosis.
ML1 Mediates Histamine-Induced PKA-Dependent Ca2+
Release from TV StoresThe Ca2+- and cAMP/PKA dependence of TV exocytosis and
acid secretion suggests that ML1, as a TV Ca2+ release channel,
is regulated, directly or indirectly, by cAMP/PKA signaling.
Indeed, 8-Br-cAMP- and forskolin-induced TV exocytosis, as
measured by VAC formation, was inhibited in the presence of
ML-SI4 (Figures 6G and S6N). To test the hypothesis that hista-
mine-initiated signaling promotes TV Ca2+ release through ML1
to facilitate gastric acid secretion (Figure 7), we measured Ca2+
release in GCaMP3-ML1-expressing ML1PC cells using time-
lapse confocal imaging at 37�C. Bath application of histamine
produced robust Ca2+ release as well as small Ca2+ oscillations
Develo
(Figures 6H and 6K; Movie S4). GPN pre-
treatment did not affect the responses (Fig-
ure 6O), suggesting that they were medi-
ated by TV stores rather than lysosomal
stores. At room temperature (22�C–24�C),using conventional Fura-2-based Ca2+ im-
aging, we detected small Ca2+ increases in
a subset of WT cells after histamine treat-
ment (Figure S6P). Much larger Fura-2
Ca2+ increases were seen consistently in
ML1PC cells (Figure S6Q).
Histamine-induced TV Ca2+ release in
ML1PC parietal cells was blocked by ML-
SI4 or PKA inhibition (Figures 6I–6K). Inter-
estingly, forskolin (Movie S5) and 8-Br-
cAMP (Movie S6) induced spontaneous
Ca2+ oscillations in a zero-Ca2+ external
solution, and these spontaneous oscilla-
tions were largely diminished in the pres-
ence of ML-SI4 (10 mM; Figures 6L–6O). Together, these results
suggest that histamine induces ML1-mediated TV Ca2+ release
through cAMP and PKA signaling.
Reactive oxygen species and phosphatidylinositol 3,5-bi-
sphosphate are endogenous agonists of ML1 (Dong et al.,
2010; Zhang et al., 2016). Treatment with the antioxidant N-ace-
tylcysteine or the PIKfyve inhibitor apilimod (to attenuate phos-
phatidylinositol 3,5-bisphosphate production) did not affect
histamine-induced VAC formation in WT parietal cells (Figures
S6T and S6U). In contrast, in WT cells that were pretreated
with 8-Br-cAMP or histamine, basal and ML-SA-activated
whole-endolysosome ML1 currents (IML1) were increased signif-
icantly (Figures 6P, 6Q, S6R, and S6S). These increases were not
seen in the presence of PKA inhibitors (Figures 6P and 6Q).
These results indicate that IML1 in partial cells is upregulated
potently by PKA signaling.
DISCUSSION
In the present study, we used pharmacological and genetic
manipulation methods to discern missing links between hista-
mine and acid secretion in gastric parietal cells. Our results
indicate that ML1 channels expressed on parietal-cell TVs
pmental Cell 41, 262–273, May 8, 2017 269
A
E
H
B
F
L M
C D
G
O
J KI
WT Parietal Cell
+ H89
+ BAPTA-AM
PhalloidinHK-ATPase MergedHistamine-treated WT Parietal Cell
N
P
Q
Whole-endolysosomeWT
Figure 6. Histamine Evokes ML1-Mediated TV Ca2+ Release through cAMP/PKA Signaling
(A and B) Effects of cAMP (A) and forskolin (B) on NIPR in WT parietal cells. A linear fit (red dotted line) was used to determine the rate of pH recovery during
re-alkalization.
(C–E) PKA inhibitor H89 (20 mM) (C) or Ca2+-chelator BAPTA-AM (20 mM) (D) block histamine-stimulated NIPR. Data are summarized in (E).
(F) H89 and BAPTA-AM effects on VAC formation induced by histamine (50 mM + 10 mM IBMX). Scale bar, 10 mm.
(G) Forskolin (50 mM) or 8-Br-cAMP (20 mM) stimulate VAC formation, measured as total surface area.
(H–K) Histamine (50 mM)-induced TV Ca2+ release in GCaMP3-ML1-expressing ML1PC cells (see alsoMovie S4) was blocked byML-SI4 (10 mM) (I) or H89 (20 mM)
(J). Experimental averages are shown in (K).
(L and M) ML-SI4 (10 mM) blocked forskolin (50 mM)-induced Ca2+ oscillations in ML1PC parietal cells (see also Movie S5).
(N and O) ML-SI4 (10 mM) blocked 8-Br-cAMP (20 mM)-induced Ca2+ oscillations in ML1PC cells (See also Movie S6).
(P) Whole-endolysosomal IML1 in WT parietal cells with and without 8-Br-cAMP (20 mM) and H89 (20 mM).
(Q) Mean current densities under treatments shown in (P). Mean ± SEM from R3 experiments.
*p < 0.05, ***p < 0.001, one-way ANOVA, Bonferroni’s post hoc analysis (E) or Student’s t test (K, M, O, Q).
270 Developmental Cell 41, 262–273, May 8, 2017

Figure 7. Signaling Pathways that Mediate
Histamine-Stimulated ML1-Dependent TV
Exocytosis and Acid Secretion
Activation of type 2 histamine receptor (H2Rs) in
parietal cells by histamine induces cAMP-depen-
dent PKA activation. Localized on TVs, ML1 may
mediate a PKA-sensitive Ca2+ release pathway to
trigger Ca2+-dependent fusion of TVs with each
other and with apical membranes. Histamine-
induced exocytosis of H+/K+-ATPase-enriched
TVs toward lumen-facing apical membranes in a
cAMP/PKA-dependent manner.
provide a PKA-sensitive Ca2+ release conduit that triggers
Ca2+-dependent fusion of TVs with each other and with apically
directed canalicular membranes, resulting in apical localization
of the H+/K+-ATPase that pumps H+ into the gastric lumen (Fig-
ure 7). The putative Ca2+ dependence of TV fusion had been
controversial because conventional Ca2+ imaging studies had
not shown consistent increases in response to histamine treat-
ment, as was demonstrated finally in the current study. Using
organelle-targeted Ca2+ probes and super-resolution imaging,
we showed unequivocally here that TV trafficking and exocy-
tosis are dependent on Ca2+ release from TVs mediated by
ML1 proteins, which are in turn regulated by histamine-stimu-
lated PKA signaling. Our demonstration of ML1 expression in
TVs has provided an answer to a long-standing puzzle as to
why the achlorhydric phenotype is only seen in ML-IV and
not in any other lysosomal storage disease (Chandra et al.,
2011; Xu and Ren, 2015).
It is likely that additional regulators of this ML1 pathway
remain to be discovered. Indeed, a number of TV-localized
channels and transporters, including K+ channels, have been
reported to regulate acid secretion (Forte and Zhu, 2010; Lam-
brecht et al., 2005). Some of them may affect TV membrane
potential and, thus, ML1-mediated Ca2+ release, which is
strongly voltage-dependent (Xu and Ren, 2015). The Ca2+
effector associated with TV fusion is not yet known. However,
Ca2+-sensing proteins, such as apoptosis-linked gene 2 and
Syt-VII proteins, have been shown to link ML1-mediated lyso-
somal Ca2+ release with retrograde transport and membrane
fusion of lysosomes (Li et al., 2016), making them candidates
for this role in TVs. The pathway elucidated in the current
study provides rapid, bidirectional regulation of gastric acid
secretion. Given the well-established roles of gastric acids in
stomach homeostasis and gastric biology (Forte and Zhu,
2010; Hersey and Sachs, 1995), our identification of ML1 as
the first known TV Ca2+ channel may lead to the development
of new therapeutic approaches to treat acid-related gastric
diseases.
STAR+METHODS
Detailed methods are provided in the online version of this paper
and include the following:
d KEY RESOURCES TABLE
d CONTACT FOR REAGENT AND RESOURCE SHARING
d EXPERIMENTAL MODEL AND SUBJECT DETAILS
B Mice
B Gastric Gland Isolation
B Primary Parietal Cell Isolation and Culture
d METHOD DETAILS
B NIPR Measurement
B [14C] Aminopyrine Uptake Assay
B Whole Stomach Acid Measurement
B Gastrin Measurement
B Transmission Electron Microscopy
B Immuno-electron Microscopy
B Biochemistry
B Immunohistochemistry
B Cellular Fractionation
B Immunoisolation of TVs
B Confocal Imaging
B STED Microscopy
B Fura-2 Ca2+ Imaging
B Whole-endolysosome Electrophysiology
B Whole-VAC Electrophysiology
B VAC Surface Area Measurement
B Flow-cytometry-based TV Fusion Assay
d QUANTIFICATION AND STATISTICAL ANALYSIS
Developmental Cell 41, 262–273, May 8, 2017 271

SUPPLEMENTAL INFORMATION
Supplemental Information includes six figures and six movies and can be
found with this article online at http://dx.doi.org/10.1016/j.devcel.2017.
04.003.
AUTHOR CONTRIBUTIONS
N.S. and H.X. designed the study; N.S., M.G., X.Z., J.Y., M.B., T.M.K., and
S. Sundaresan performed the laboratory experiments; R.C., Q.G., W.W.,
S.P., H.X., M.F., G.K., S. Sahoo, M.S., Y.W., L.C.S., J.M., and J.L.M. contrib-
uted the reagents; N.S., M.G., X.Z., N.R., L.C.S., J.L.M., and H.X. analyzed and
interpreted the data; N.S. and H.X. wrote the paper with inputs and final
approval from all authors.
ACKNOWLEDGMENTS
This work was supported by NIH project grants (R01-NS062792 and R01-
AR060837 to H.X.; P01-DK06041 to J.M. and L.C.S.) and Molecular Biology
Core support from the Michigan Gastrointestinal Research Center (P30-
DK34933). We are grateful to Dr. Loren Looger (Janelia Farm HHMI) for the
GCaMP3 construct, Dr. Susan Slaugenhaupt (Massachusetts General Hospi-
tal) for the ML1 KO mice, Dr. Andrea Todesco for providing the ATP4B-Cre
mice, Dr. Isabel Martinez for the help on in vivo experiments, Arthur Tessier
for the help on 14C-aminopyrine experiment, Ms. Felichi Arines for assistance,
and Dr. Richard Hume for comments on the manuscript. We appreciate the
encouragement and helpful comments from other members of the H.X.
laboratory.
Received: December 5, 2016
Revised: March 10, 2017
Accepted: April 3, 2017
Published: May 8, 2017
REFERENCES
Berg, T.O., Stromhaug, E., Lovdal, T., Seglen, O., and Berg, T. (1994). Use of
glycyl-L-phenylalanine 2-naphthylamide, a lysosome-disrupting cathepsin C
substrate, to distinguish between lysosomes and prelysosomal endocytic
vacuoles. Biochem. J. 300 (Pt 1), 229–236.
Calhoun, B.C., and Goldenring, J.R. (1997). Two Rab proteins, vesicle-associ-
ated membrane protein 2 (VAMP-2) and secretory carrier membrane proteins
(SCAMPs), are present on immunoisolated parietal cell tubulovesicles.
Biochem. J. 325 (Pt 2), 559–564.
Cerny, J., Feng, Y., Yu, A., Miyake, K., Borgonovo, B., Klumperman, J.,
Meldolesi, J., McNeil, P.L., and Kirchhausen, T. (2004). The small chemical va-
cuolin-1 inhibits Ca(2+)-dependent lysosomal exocytosis but not cell reseal-
ing. EMBO Rep. 5, 883–888.
Chandra, M., Zhou, H., Li, Q., Muallem, S., Hofmann, S.L., and Soyombo, A.A.
(2011). A role for the Ca2+ channel TRPML1 in gastric acid secretion, based on
analysis of knockout mice. Gastroenterology 140, 857–867.
Chew, C.S., and Brown, M.R. (1986). Release of intracellular Ca2+ and eleva-
tion of inositol trisphosphate by secretagogues in parietal and chief cells iso-
lated from rabbit gastric mucosa. Biochim. Biophys. Acta 888, 116–125.
Chew, C.S., Hersey, S.J., Sachs, G., and Berglindh, T. (1980). Histamine
responsiveness of isolated gastric glands. Am. J. Physiol. 238, G312–G320.
Courtois-Coutry, N., Roush, D., Rajendran, V., McCarthy, J.B., Geibel, J.,
Kashgarian, M., and Caplan, M.J. (1997). A tyrosine-based signal targets
H/K-ATPase to a regulated compartment and is required for the cessation of
gastric acid secretion. Cell 90, 501–510.
Dong, X.P., Shen, D., Wang, X., Dawson, T., Li, X., Zhang, Q., Cheng, X.,
Zhang, Y., Weisman, L.S., Delling, M., et al. (2010). PI(3,5)P(2) controls mem-
brane trafficking by direct activation of mucolipin Ca(2+) release channels in
the endolysosome. Nat. Commun. 1, 38.
272 Developmental Cell 41, 262–273, May 8, 2017
Duman, J.G., Singh, G., Lee, G.Y., Machen, T.E., and Forte, J.G. (2002). Ca(2+)
and Mg(2+)/ATP independently trigger homotypic membrane fusion in gastric
secretory membranes. Traffic 3, 203–217.
Forte, J.G., and Zhu, L. (2010). Apical recycling of the gastric parietal cell H,K-
ATPase. Annu. Rev. Physiol. 72, 273–296.
Forte, T.M., Machen, T.E., and Forte, J.G. (1977). Ultrastructural changes in
oxyntic cells associated with secretory function: a membrane-recycling hy-
pothesis. Gastroenterology 73, 941–955.
He, W., Liu, W., Chew, C.S., Baker, S.S., Baker, R.D., Forte, J.G., and Zhu, L.
(2011). Acid secretion-associated translocation of KCNJ15 in gastric parietal
cells. Am. J. Physiol. Gastrointest. Liver Physiol. 301, G591–G600.
Hersey, S.J., and Sachs, G. (1995). Gastric acid secretion. Physiol. Rev. 75,
155–189.
Jabs, R., Pivneva, T., Huttmann, K., Wyczynski, A., Nolte, C., Kettenmann, H.,
and Steinhauser, C. (2005). Synaptic transmission onto hippocampal glial cells
with hGFAP promoter activity. J. Cell Sci. 118, 3791–3803.
Lambrecht, N.W., Yakubov, I., Scott, D., and Sachs, G. (2005). Identification of
the K efflux channel coupled to the gastric H-K-ATPase during acid secretion.
Physiol. Genomics 21, 81–91.
Lapierre, L.A., Avant, K.M., Caldwell, C.M., Ham, A.J., Hill, S., Williams, J.A.,
Smolka, A.J., and Goldenring, J.R. (2007). Characterization of immunoisolated
human gastric parietal cells tubulovesicles: identification of regulators of apical
recycling. Am. J. Physiol. Gastrointest. Liver Physiol. 292, G1249–G1262.
Li, X., Rydzewski, N., Hider, A., Zhang, X., Yang, J., Wang,W., Gao, Q., Cheng,
X., and Xu, H. (2016). A molecular mechanism to regulate lysosome motility for
lysosome positioning and tubulation. Nat. Cell Biol. 18, 404–417.
Malinowska, D.H., Sachs, G., and Cuppoletti, J. (1988). Gastric H+ secretion:
histamine (cAMP-mediated) activation of protein phosphorylation. Biochim.
Biophys. Acta 972, 95–109.
Mettler, S.E., Ghayouri, S., Christensen, G.P., and Forte, J.G. (2007).
Modulatory role of phosphoinositide 3-kinase in gastric acid secretion. Am.
J. Physiol. Gastrointest. Liver Physiol. 293, G532–G543.
Nakada, S.L., Crothers, J.M., Jr., Machen, T.E., and Forte, J.G. (2012). Apical
vacuole formation by gastric parietal cells in primary culture: effect of low
extracellular Ca2+. Am. J. Physiol. Cell Physiol. 303, C1301–C1311.
Negulescu, P.A., Reenstra, W.W., and Machen, T.E. (1989). Intracellular Ca re-
quirements for stimulus-secretion coupling in parietal cell. Am. J. Physiol. 256,
C241–C251.
Pasham, V., Rotte, A., Mia, S., Alesutan, I., Chatterjee, S., Hosseinzadeh, Z.,
Bhandaru, M., Noegel, A.A., and Lang, F. (2013). Annexin 7 in the regulation
of gastric acid secretion. Cell Physiol. Biochem. 32, 1643–1654.
Schiffmann, R., Dwyer, N.K., Lubensky, I.A., Tsokos, M., Sutliff, V.E., Latimer,
J.S., Frei, K.P., Brady, R.O., Barton, N.W., Blanchette-Mackie, E.J., et al.
(1998). Constitutive achlorhydria in mucolipidosis type IV. Proc. Natl. Acad.
Sci. USA 95, 1207–1212.
Shen, D., Wang, X., Li, X., Zhang, X., Yao, Z., Dibble, S., Dong, X.P., Yu, T.,
Lieberman, A.P., Showalter, H.D., et al. (2012). Lipid storage disorders block
lysosomal trafficking by inhibiting a TRP channel and lysosomal calcium
release. Nat. Commun. 3, 731.
Shin, J.M., Munson, K., Vagin, O., and Sachs, G. (2009). The gastric HK-
ATPase: structure, function, and inhibition. Pflugers Arch. 457, 609–622.
Suda, J., Zhu, L., Okamoto, C.T., and Karvar, S. (2011). Rab27b localizes to the
tubulovesiclemembranes of gastric parietal cells and regulates acid secretion.
Gastroenterology 140, 868–878.
Syder, A.J., Karam, S.M., Mills, J.C., Ippolito, J.E., Ansari, H.R., Farook, V., and
Gordon, J.I. (2004). A transgenic mouse model of metastatic carcinoma
involving transdifferentiation of a gastric epithelial lineage progenitor to a
neuroendocrine phenotype. Proc. Natl. Acad. Sci. USA 101, 4471–4476.
Thorn, P., Zorec, R., Rettig, J., and Keating, D.J. (2016). Exocytosis in non-
neuronal cells. J. Neurochem. 137, 849–859.
Tian, L., Hires, S.A., Mao, T., Huber, D., Chiappe, M.E., Chalasani, S.H.,
Petreanu, L., Akerboom, J., McKinney, S.A., Schreiter, E.R., et al. (2009).
Imaging neural activity in worms, flies andmicewith improvedGCaMP calcium
indicators. Nat. Methods 6, 875–881.
Trudeau, W.L., and McGuigan, J.E. (1971). Relations between serum gastrin
levels and rates of gastric hydrochloric acid secretion. N. Engl. J. Med. 284,
408–412.
Tsunoda, Y., Takeda, H., Otaki, T., Asaka, M., Nakagaki, I., and Sasaki, S.
(1988). Intracellular Ca2+ shift and signal transduction from the tubulovesicular
portion of gastric parietal cells during gastrin stimulation or Ca2+ ionophore
treatment: comparison between luminescent and fluorescent probes, and
electron probe X-ray microanalyzer. Biochem. Cell Biol. 66, 279–287.
Venugopal, B., Browning, M.F., Curcio-Morelli, C., Varro, A., Michaud, N.,
Nanthakumar, N., Walkley, S.U., Pickel, J., and Slaugenhaupt, S.A. (2007).
Neurologic, gastric, and ophthalmologic pathologies in a murine model of mu-
colipidosis type IV. Am. J. Hum. Genet. 81, 1070–1083.
Wang, X., Zhang, X., Dong, X.P., Samie, M., Li, X., Cheng, X., Goschka, A.,
Shen, D., Zhou, Y., Harlow, J., et al. (2012). TPC proteins are phosphoinositide-
activated sodium-selective ion channels in endosomes and lysosomes. Cell
151, 372–383.
Wang, W., Gao, Q., Yang, M., Zhang, X., Yu, L., Lawas, M., Li, X., Bryant-
Genevier, M., Southall, N.T., Marugan, J., et al. (2015). Up-regulation of
lysosomal TRPML1 channels is essential for lysosomal adaptation to nutrient
starvation. Proc. Natl. Acad. Sci. USA 112, E1373–E1381.
Xu, H., and Ren, D. (2015). Lysosomal physiology. Annu. Rev. Physiol.
77, 57–80.
Xu, H., Martinoia, E., and Szabo, I. (2015). Organellar channels and trans-
porters. Cell Calcium 58, 1–10.
Yao, X., and Forte, J.G. (2003). Cell biology of acid secretion by the parietal
cell. Annu. Rev. Physiol. 65, 103–131.
Zavros, Y., Orr, M.A., Xiao, C., and Malinowska, D.H. (2008). Sonic hedgehog
is associated with H+-K+-ATPase-containing membranes in gastric parietal
cells and secreted with histamine stimulation. Am. J. Physiol. Gastrointest.
Liver Physiol. 295, G99–G111.
Zhang, X., Cheng, X., Yu, L., Yang, J., Calvo, R., Patnaik, S., Hu, X., Gao, Q.,
Yang, M., Lawas, M., et al. (2016). MCOLN1 is a ROS sensor in lysosomes that
regulates autophagy. Nat. Commun. 7, 12109.
Zhao, Z., Hou, N., Sun, Y., Teng, Y., and Yang, X. (2010). Atp4b promoter di-
rects the expression of Cre recombinase in gastric parietal cells of transgenic
mice. J. Genet. Genomics 37, 647–652.
Developmental Cell 41, 262–273, May 8, 2017 273
STAR+METHODS
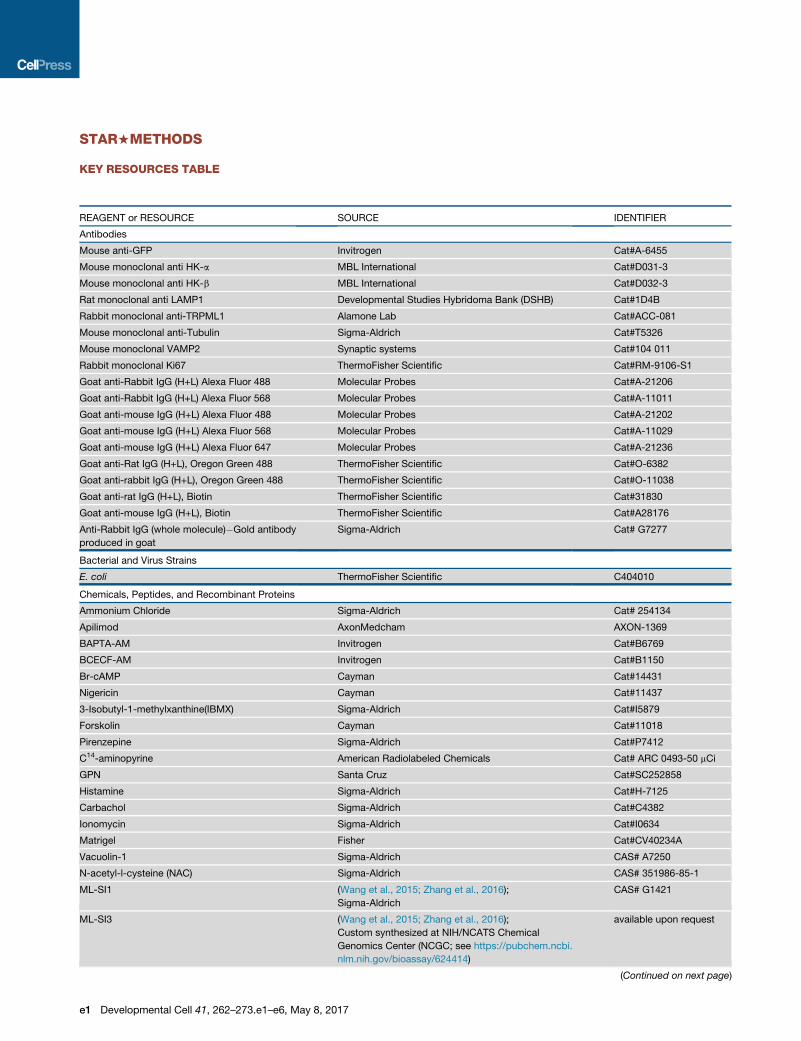
KEY RESOURCES TABLE
REAGENT or RESOURCE SOURCE IDENTIFIER
Antibodies
Mouse anti-GFP Invitrogen Cat#A-6455
Mouse monoclonal anti HK-a MBL International Cat#D031-3
Mouse monoclonal anti HK-b MBL International Cat#D032-3
Rat monoclonal anti LAMP1 Developmental Studies Hybridoma Bank (DSHB) Cat#1D4B
Rabbit monoclonal anti-TRPML1 Alamone Lab Cat#ACC-081
Mouse monoclonal anti-Tubulin Sigma-Aldrich Cat#T5326
Mouse monoclonal VAMP2 Synaptic systems Cat#104 011
Rabbit monoclonal Ki67 ThermoFisher Scientific Cat#RM-9106-S1
Goat anti-Rabbit IgG (H+L) Alexa Fluor 488 Molecular Probes Cat#A-21206
Goat anti-Rabbit IgG (H+L) Alexa Fluor 568 Molecular Probes Cat#A-11011
Goat anti-mouse IgG (H+L) Alexa Fluor 488 Molecular Probes Cat#A-21202
Goat anti-mouse IgG (H+L) Alexa Fluor 568 Molecular Probes Cat#A-11029
Goat anti-mouse IgG (H+L) Alexa Fluor 647 Molecular Probes Cat#A-21236
Goat anti-Rat IgG (H+L), Oregon Green 488 ThermoFisher Scientific Cat#O-6382
Goat anti-rabbit IgG (H+L), Oregon Green 488 ThermoFisher Scientific Cat#O-11038
Goat anti-rat IgG (H+L), Biotin ThermoFisher Scientific Cat#31830
Goat anti-mouse IgG (H+L), Biotin ThermoFisher Scientific Cat#A28176
Anti-Rabbit IgG (whole molecule)�Gold antibody
produced in goat
Sigma-Aldrich Cat# G7277
Bacterial and Virus Strains
E. coli ThermoFisher Scientific C404010
Chemicals, Peptides, and Recombinant Proteins
Ammonium Chloride Sigma-Aldrich Cat# 254134
Apilimod AxonMedcham AXON-1369
BAPTA-AM Invitrogen Cat#B6769
BCECF-AM Invitrogen Cat#B1150
Br-cAMP Cayman Cat#14431
Nigericin Cayman Cat#11437
3-Isobutyl-1-methylxanthine(IBMX) Sigma-Aldrich Cat#I5879
Forskolin Cayman Cat#11018
Pirenzepine Sigma-Aldrich Cat#P7412
C14-aminopyrine American Radiolabeled Chemicals Cat# ARC 0493-50 mCi
GPN Santa Cruz Cat#SC252858
Histamine Sigma-Aldrich Cat#H-7125
Carbachol Sigma-Aldrich Cat#C4382
Ionomycin Sigma-Aldrich Cat#I0634
Matrigel Fisher Cat#CV40234A
Vacuolin-1 Sigma-Aldrich CAS# A7250
N-acetyl-l-cysteine (NAC) Sigma-Aldrich CAS# 351986-85-1
ML-SI1 (Wang et al., 2015; Zhang et al., 2016);
Sigma-Aldrich
CAS# G1421
ML-SI3 (Wang et al., 2015; Zhang et al., 2016);
Custom synthesized at NIH/NCATS Chemical
Genomics Center (NCGC; see https://pubchem.ncbi.
nlm.nih.gov/bioassay/624414)
available upon request
(Continued on next page)
e1 Developmental Cell 41, 262–273.e1–e6, May 8, 2017

Continued
REAGENT or RESOURCE SOURCE IDENTIFIER
ML-SI4 (Wang et al., 2015; Zhang et al., 2016);
Custom synthesized at NIH/NCATS Chemical
Genomics Center (NCGC; see https://pubchem.ncbi.
nlm.nih.gov/bioassay/624414)
available upon request
ML-SA1 Sigma-Aldrich Cat# SML 0627
ML-SA5 (Wang et al., 2015; Zhang et al., 2016);
Custom synthesized at NIH/NCATS Chemical
Genomics Center (NCGC; see https://pubchem.ncbi.
nlm.nih.gov/bioassay/624414)
available upon request
DAPI Sigma-Aldrich Cat#D9542
FURA-2 AM Invitrogen Cat# F-1221
Phalloidin-TRITC ECM biosciences Cat#PF7551
Omeperazole Cayman Cat#14880
EGTA Sigma-Aldrich Cat#E4378
Bovine Serum Albumin Sigma-Aldrich Cat#A3059
Recombinant Human EGF, CF R&D Systems Cat# 236-EG-200
Insulin-Transferrin-Selenium (ITS -G) (100X) ThermoFisher Scientific Cat# 41400045
Fluoromount-G Southern Biotech Cat# 0100-01
H89 Cayman Cat# 130964-39-5
Critical Commercial Assays
Gastrin measurement kit: Human Gastrin EIA raybiotech EIA-GAS-1
Experimental Models: Cell Lines
HEK293T ATCC; also see (Zhang et al., 2016) CRL-3216
Experimental Models: Organisms/Strains
Mouse: ATP4B Cre (Syder et al., 2004) N/A
Mouse: ML1 KO (Venugopal et al., 2007) N/A
Mouse: ML1PC This study N/A
Mouse: ML1 KO:ML1PC This study N/A
Oligonucleotides
Mouse: ML1PC ROSA-F:
AGTCGCTCTGAGTTGTTATCAG
This study N/A
Mouse: ML1PC ROSA-R:
TGAGCATGTCTTTAATCTACCTCGATG
This study N/A
Mouse: ML1PC WPRE-F:
GCATCGATACCGTCGACCTC
This study N/A
Mouse: ML1PC WPRE-R:
GCTGTCCATCTGCACGAGAC
This study N/A
Mouse: ML1PC ATP4B-cre-F:
CATGCTTCATCGTCGGTCC
(Zhao et al., 2010) N/A
Mouse: ML1PC ATP4B-cre-R:
GATCATCAGCTACACCAGAG
(Zhao et al., 2010) N/A
Mouse: ML1 KO ML1-F:
TGAGGAGAGCCAAGCTCATT
(Venugopal et al., 2007) N/A
Mouse: ML1 KO ML1-R:
TCATCTTCCTGCCTCCATCT
(Venugopal et al., 2007) N/A
Mouse: ML1 KO ML1 NEO-R:
TGGCTGGACGTAAACTCCTC
(Venugopal et al., 2007) N/A
Recombinant DNA
GCaMP3-ML1 (Shen et al., 2012) N/A
Software and Algorithms
Origin Pro OriginLab N/A
Adobe illustrator Adobe N/A
(Continued on next page)
Developmental Cell 41, 262–273.e1–e6, May 8, 2017 e2

Continued
REAGENT or RESOURCE SOURCE IDENTIFIER
pClamp 10.5 Molecular Device N/A
Microsoft excel Microsoft N/A
ImageJ NIH N/A
Leica Application Suite X ( LAS X) Leica Microsystems N/A
MetaMorph Advanced Imaging acquisition
software v.7.7.8.0
Molecular Devices N/A
Maxchelator http://maxchelator.stanford.edu/ N/A
CONTACT FOR REAGENT AND RESOURCE SHARING
Further information and requests for resources and reagents should be directed to and will be fulfilled by the Lead Contact, Haoxing
Xu ([email protected]).
EXPERIMENTAL MODEL AND SUBJECT DETAILS
MiceML1KOmice were developed in a B6:129mixed genetic background and their phenotype has been characterized as described else-
where (Venugopal et al., 2007). The GCaMP3-ML1 ROSA-lSlmice were generated in a C57BL/6J genetic background, as described
in Figures S2A and S2B and crossed with an ATP4B Cre line (Syder et al., 2004) to generate the ML1 ROSA-lSl:ATP4B Cre (ML1PC)
mice, in which the GCaMP3-ML1 transgene is selectively expressed in parietal cells. Prior to most experiments, mice were fasted
overnight with free access to water. Both sexes of littermate or age-matched mice were used under an approved animal protocol
(#6577) following the Institutional Animal Care Guidelines at the University of Michigan.
Gastric Gland IsolationGastric glandswere isolated as described previously (Pasham et al., 2013). Briefly, micewere fasted overnight with free access to tap
water. After the animals were euthanized, their stomachswere isolated and sliced longitudinally to separate the forestomach, antrum,
and corpus regions. The corpus tissues were sliced into small sections and digested in collagenase at 37 �C for 1 h. The digested
samples were then filtered through 40 mm filters and pelleted by light centrifugation at the speed of 503g for 8 min. Isolated gastric
glands were plated on Matigel (BD Biosciences)-coated cover slips and incubated at 37 �C in a culture medium (Medium A, pH 7.4)
containing: DMEM, 20 mM HEPES, 1 mM glutamine supplement, 10 mM glucose, 0.2% BSA, 50 ng/ml EGF, 5% selenite-insulin-
transferrin liquid medium, 50 U/ml penicillin/streptomycin, 200 mg/ml gentamycin, and 50 mg/ml novobiacin.
Primary Parietal Cell Isolation and CultureAfter mucosal digestion of isolated glands, supernatants were pelleted by centrifugation at 2003g, washed three times with HEPES-
MEM, and re-suspended in Medium A. Approximately 70% of the total gastric cells suspended in Medium A were parietal cells. The
cells were plated onto Matrigel-coated 18-mm round coverslips or 35-mm dishes and incubated at 37 �C.
METHOD DETAILS
NIPR MeasurementIn isolated glands and cultured parietal cells, NIPR (see Figure S1O) was measured with a pH-sensitive BCECF dye (Pasham et al.,
2013). Briefly, glands and cells were loaded with 10 mM BCECF-AM (Thermo-Fisher, USA) for 15 min at 37 �C. Acid loading was
achieved by a brief application of NH4Cl (20 mM). NIPR was triggered upon Na+ removal (0 Na+). A linear fit, within 5 min of reaching
peak acidity, was used to determine the rate of pH recovery (DpH/min) during re-alkalization. BCECF fluorescence was recorded
by an EasyRatio Pro system (PTI) at 440-nm and 490-nm wavelengths. The fluorescence ratio (F490/F440) was used to calculate
cytoplasmic pH values based on a standard calibration curve constructed for a range of pH 5 to 8.5 with K+-H+ ionophore nigericin
(Pasham et al., 2013). The standard 145 Na+ solution contained (in mM): 125 NaCl, 3 KCl, 1 CaCl2, 1.2 MgSO4, 5 glucose, and 32.2
HEPES (pH 7.4). The 0Na+ solution contained (inmM): 125NMDG-Cl, 3 KCl, 1 CaCl2, 1.2MgSO4, 5 glucose, 32.2HEPES (pH 7.4). For
the NH4Cl application, 10mMNMDG-Cl was replacedwith 20mMNH4Cl. The high K+ solution used for calibration contained (inmM):
105 KCl, 1 CaCl2, 1.2 MgSO4, 32.2 HEPES, 10 mannitol, and 10 mg/ml nigericin (pH 7.0).
[14C] Aminopyrine Uptake AssayAminopyrine accumulates in the acidic lumen of isolated glands (Mettler et al., 2007). Briefly, 1-ml gland samples in HEPES-
MEM medium (saturated with 100% oxygen) were mixed with various pharmacological regents and 10 ml [14C]-aminopyrine
e3 Developmental Cell 41, 262–273.e1–e6, May 8, 2017

(115mCi/mmol; 53 103 cpm) in test tubes. The samples were incubated in a shaking water bath at 37 �C for 30min. Pelleted samples
were dried out overnight and then dissolved in 125 ml NaOH (1 M) at 80 �C for 20 min. Afterwards, 125 ml HCl (1 M) was added to
neutralize the sample. Aliquots (200 ml) of suspended pellets were mixed with scintillation fluid (500 ml) for analysis in a Beckman
LS3801 counter. The remaining sample (50 ml) was used to determine the protein content for normalization.
Whole Stomach Acid MeasurementOvernight-fasted mice were anesthetized with a mixture of xylazine and ketamine. A non-survival surgery was then performed.
Briefly, 1-2 cm midline laparotomy incision was made on the abdomen. A small incision was made in the duodenum through which
PE-50 tubing was inserted and secured with a ligature around the pylorus. At the beginning of each experiment, each stomach was
rinsed several timeswith normal saline solution and then filled with 400 ml of the same saline solution via the tubing. Saline (400 ml) was
injected through the fistula and collected every 10 min. Histamine (1 mg/kg, Sigma) was administered via intraperitoneal injection.
ML-SAs and ML-SIs were administered into the stomach via the PE tubing. Acid output (in mmol H+) was determined by titration.
Gastrin MeasurementAnimals were fasted overnight with free access to tap water. About 150 ml of blood specimens were collected into EDTA-coated
tubes. ML-SA5 (100 mM) was administered by oral gavage and histamine (1 mg/kg) was administered intraperitoneally. Total plasma
gastrin concentrations were determined with a gastrin enzyme-linked immunoassay kit (Raybiotech, USA) according to manufac-
turer’s instruction.
Transmission Electron MicroscopyMouse tissue sections were immersed in amixture of 2.5%glutaraldehyde and 4% formaldehyde in phosphate-buffered saline (PBS,
pH 7.2) for 4 h at 4 �C. The samples were postfixed in 1%osmium tetroxide for 1 h, followed by 0.1M cacodylate buffer for 1 h at room
temperature. The fixed samples were stained with 2% uranyl acetate in maleate buffer for 1 h in the dark. The samples were dehy-
drated with ethanol and embedded with Epon (Electron Microscopy Sciences). After the polymerization of Epon, ultrathin sections
(60–80 nm) were prepared with an LKB MK III Ultratome. Samples were stained with 2% uranyl, contrasted with lead citrate, and
examined with a Philips CM10 transmission electron microscope. An anti-GFP antibody from Invitrogen (Cat No: A-6455) was
used for immuoelectron microscopic analysis ((Jabs et al., 2005)).
Immuno-electron MicroscopyUltrathin sections (60–80 nm) were etched in 10%H2O2 and 5%sodiummetaperiodate for 10min. After several washes and blocking
with 1%BSA in PBS, the sections were incubated overnight with rabbit anti-GFP antibody (Invitrogen (Cat No: A-6455))) at 4 �C. Afterseveral washes, the sections were then incubated with anti-rabbit IgG secondary antibody conjugated with 10-nm colloidal gold par-
ticles (Sigma, USA) for 2–3 h at room temperature. The sections were washed and contrasted with uranyl acetate and then examined
with a Philips CM10 and Joel 1400 plus transmission electron microscope.
BiochemistryStandard western blotting analyses were performed (Zhang et al., 2016). The lysis buffer contained 1%NP-40, 0.25%Na-deoxycho-
late, 1 mM NaF, 150 mM NaCl, 1 mM Na3VO4, 0.5 mM CaCl2, and 50 mM Tris-HCl (pH 7.4). For the immunoprecipitation experi-
ments, after a 10-s sonication, whole-cell lysates were centrifuged at 14,000 3g for 10 min. Supernatants were incubated with pri-
mary antibodies at 4 �C for 1 h, followed by overnight incubation with Protein A/G plus-agarose. Western blot analyses were
performed with rabbit anti-GFP (1:200, Life technologies, USA), anti-HK-a, and anti-HK-b (1: 1,000) antibodies.
ImmunohistochemistryMouse stomachs were sliced longitudinally from the antrum to the forestomach. Tissues were fixed in 4% paraformaldehyde in PBS,
from which paraffin-embedded 5-mm-thick sections were prepared. The tissue sections were permeabilized with 0.1% Triton X-100
plus 1% BSA for 10 min, followed by blocking with 1% BSA for 1 h. The sections were incubated with various antibodies, including
mouse anti-HK-a or b (1: 1,000; MBL international) and mouse anti-Lamp-1 (1:200; DSHB). The sections were then incubated with
anti-mouse IgG secondary antibodies conjugated with Alexa Flour 488, 546, or 647 (Life Technology) for 2 h. F-actin rich apical
vacuole immunolabeling was performed with phalloidin-TRITC (1:1000; ECM Bioscience); ML1PC parietal cells were labeled with
anti-GFP antibodies (1:200; Life technologies, USA). The sections were mounted with Fluoromount-G (Southern Biotechnology
Associates, Inc.). Whole- gland immunostaining was performed using freshly isolated glands from overnight starved WT and
ML1PC mice (Zavros et al., 2008). Drug-treated glands were allowed to settle down by gravity, and then fixed using 4% PFA in
PBS. The glands were permeabilized with 0.3% Triton X-100 plus 1% BSA for 10 min prior to immunostaining procedures. All repre-
sentative images represent experiments repeated at least 3 times each. Quantificationwere performed on randomly selected images.
Cellular FractionationSubcellular membrane fractions were obtained from corpus glands as described previously (He et al., 2011; Wang et al., 2012).
Briefly, tissues were homogenized in PBS supplemented with 10 mM sucrose and 1 mM EDTA (pH 7.2) in a Potter-Elvehjem homog-
enizer. The homogenates were then subjected to sequential centrifugation steps to produce pellets 1–3 (P1–3): P1 (3,200 3g for
Developmental Cell 41, 262–273.e1–e6, May 8, 2017 e4

10min, the plasmamembrane fraction), P2 (20,0003g for 10 min, the lysosome fraction), and P3 (100,0003g for 1 h, the light micro-
somal membrane fraction consisting mostly TV-derived membranes).
Immunoisolation of TVsThe P3 pellets were re-suspended in a sucrose buffer that contained 300mMsucrose (10mMHEPES, pH 7.4), and fractionated using
20%, 27% and 33% of sucrose gradients (Calhoun and Goldenring, 1997; Lapierre et al., 2007). Enriched TVs, solubilized in 500 ml of
PBS containing protease and phosphatase inhibitors, were then pulled down by protein G beads coated with an anti-H+-K+-
ATPase�a antibody and IgG at 4 �C for 1 h.
Confocal ImagingTime-lapse imaging was conducted on an Olympus spinning-disk confocal microscope equipped with a temperature controller. To
detect Ca2+ release from lysosomes and TVs, we used GCaMP3-ML1-expressing ML1PC parietal cells. GCaMP3, a single-wave-
length genetically-encoded Ca2+ indicator was engineered using GFP and calmodulin (Tian et al., 2009) , was fused directly to the
cytoplasmic N-terminus of ML1 (Figure S3F; detailed characterization see ref. (Shen et al., 2012)). Upon Ca2+ release from TV stores,
GCaMP3-ML1 fluorescence increased, which was monitored at an excitation wavelength of 480 nm (F480) by an EasyRatio Pro im-
aging system (PTI). Cells were bathed in Tyrode’s solution containing 145 mM NaCl, 5 mM KCl, 2 mM CaCl2, 1 mM MgCl2, 10 mM
Glucose, and 20 mM HEPES (pH 7.4). TV Ca2+ release was monitored in a zero Ca2+ solution containing 145 mM NaCl, 5 mM KCl,
3 mM MgCl2, 10 mM glucose, 1 mM EGTA, and 20 mM HEPES (pH 7.4). Free Ca2+ concentration was estimated by Maxchelator
software (http://max-chelator.stanford.edu/). Images were analyzed with MetaMorph Advanced Imaging acquisition software
v.7.7.8.0 (Molecular Devices) and Image J (NIH).
STED MicroscopySTED microscopy was performed using the STED module of a Leica TCS SP8 STED 100X microscope (Leica Microsystems) on
paraffin-embedded tissue sections. Hybrid detectors were used to detect signals at a certain time gate after a laser excitation pulse
with a pixel size of �20 nm. The images were further de-convolved with the Huygens Professional Software (Scientific Volume
Imaging).
Fura-2 Ca2+ ImagingCultured parietal cells were loaded with Fura-2-AM (3 mM) in the culture medium at 37 �C for 60 min. Fluorescence was recorded by
an EasyRatio Pro system (PTI) at two different wavelengths (340 nm and 380 nm) and the Fura-2 ratio (F340 /F380) was used to deter-
mine changes in intracellular [Ca2+].
Whole-endolysosome ElectrophysiologyIsolated enlarged endolysosomes were subjected to whole-endolysosomal electrophysiology by a modified patch-clamp method
(Dong et al., 2010; Wang et al., 2012). Briefly, cells were treated with 1 mM vacuolin-1 overnight to increase selectively the size of
late endosomes and lysosomes (Cerny et al., 2004). Enlarged vacuoles were released into the dish by mechanical disruption of
the cell membrane with a finetip glass electrode. Unless otherwise indicated, vacuoles were bathed continuously in an internal (cyto-
plasmic) solution containing 140 mM K+-gluconate, 4 mM NaCl, 1 mM EGTA, 2 mM Na2-ATP, 2 mMMgCl2, 0.39 mM CaCl2, 0.1 mM
GTP, and 10 mM HEPES (pH adjusted to 7.2 with KOH; free [Ca 2+]i � 100 nM calculated by MaxChelator software). The pipette
(luminal) solution contained 145 mM NaCl, 5 mM KCl, 2 mM CaCl2, 1 mM MgCl2, 10 mM HEPES, 10 mM MES, and 10 mM glucose
(pH adjusted to 4.6 with NaOH). The whole-endolysosome configuration was achieved as described previously (Wang et al., 2012).
After formation of a gigaseal between the patch pipette and an enlarged endolysosome, voltage steps of several hundred millivolts
with amillisecond duration were applied to break into the vacuolar membrane (Wang et al., 2012). All bath solutionswere applied via a
fast perfusion system that produced a complete solution exchange within a few seconds. Data were collected via an Axopatch 2A
patch clamp amplifier, Digidata 1440, and processed in pClamp 10.0 software (Axon Instruments). Whole-endolysosome currents
were digitized at 10 kHz and filtered at 2 kHz. All experiments were conducted at room temperature (21–23 �C) and all recordings
were analyzed in pCLAMP10 (Axon Instruments) and Origin 8.0 (OriginLab).
Whole-VAC ElectrophysiologyWhole-VAC patch-clamp was performed on apical vacuoles isolated from parietal cells, as illustrated in Figure 5A. Briefly, cultured
parietal cells were treatedwith 50–100 mMhistamine + 20 mM IBMX for 30–40min to induce VAC formation inWTparietal cells. ML1PC
parietal cells contained large VACs. Large VACs were released into the dish by mechanical disruption of the cell membrane with a
fine-tip glass electrode. Subsequently, whole-VAC and cytoplasmic-side-out recordings were performed in a manner similar to that
of endolysosomal recordings (Wang et al., 2012).
VAC Surface Area MeasurementThe apical membrane vacuole surface area during resting and stimulated states was measured for all VACs that were visible in mul-
tiple (3-6) Z-cross sections. Data were analyzed in ImageJ (NIH). Quantifications of were done by researchers blind to the experi-
mental groups.
e5 Developmental Cell 41, 262–273.e1–e6, May 8, 2017

Flow-cytometry-based TV Fusion AssayThis was performed using enriched light microsomal TV fractions (P3) as prepared from ML1PC mice parietal cells as described
above. P3 fractions were re-suspended in the fusion buffer (140 mM KCl, 20 mM HEPES, 1 mM MgCl2, pH 7.4) with the addition
of 50 mMEGTA (free [Ca2+] is estimated to be 20-50 nM). The sizes of TVs were determined in a Flow Cytometer (Synergy, iCyt). Using
a side-scatter (SSC) threshold of 300 arbitrary units the lower sensitivity of the instrument was established and the SSC and forward
scatter (FSC) voltages were set. A (G2) gate was set to include TVs of 1-2 mm in diameter, and a threshold gate (G1) was set based on
a densely-populated region. The data were presented as the percentages of the changes in the FSC-SSC area.
QUANTIFICATION AND STATISTICAL ANALYSIS
A minimum of 3 independent repeats were performed for each experiment. No statistical methods were used to predetermine
sample size. Data are presented as means ± standard errors of the mean (SEMs). Statistical comparisons were performed
with one-way analyses of variance (ANOVAs) with Bonferroni’s post-hoc analysis or Student’s t-tests (*P < 0.05, **P < 0.01,
***P < 0.001). P values < 0.05 were considered statistically significant.
Developmental Cell 41, 262–273.e1–e6, May 8, 2017 e6