gasb statement 34-basic financial statements...
TRANSCRIPT

GASB Statement 34-Basic Financial Statements —and Management’s Discussion and Analysis—
for State and Local Governments...an implementation guide for Tennessee counties
2007
GASB Statement 34-Basic Financial Statements—and Management’s
Discussion and Analysis—for State and Local Governments
An Implementation Guide for Tennessee Counties
March 2007
Prepared by Doug Bodary, Finance and Budget Consultant
The University of Tennessee County Technical Assistance Service
226 Capitol Boulevard, Suite 400 Nashville, Tennessee 37219
(615) 532-3555
www.ctas.tennessee.edu
Promoting better county government through direct assistance to county officials and their associations.

2

GASB Statement 34-Basic Financial Statements—and Management’s Discussion and Analysis—for State and Local Governments
An Implementation Guide for Tennessee Counties
Introduction
5
Overview of GASB and GASB Statement 34
5
Capital Assets
6
Infrastructure
14
Leave and Compensation Time Liability Reporting
16
Outstanding Long-term Debt Reporting
17
Internal Service Fund Reporting
18
Management Discussion and Analysis
18
Staying in Compliance with GASB Statement 34
19
References
20
Appendix A – Example of Government-wide Financial Statements
21
Appendix B – Example of Fund Financial Statement
25
Appendix C – Local Government Modernization Act of 2005
26
Appendix D – Sample Required Capital Asset Reports
29
Appendix E – Sample Capital Asset Policy
31
Appendix F – Sample Capital Asset Manager Job Description
38
Appendix G – Sample Leave Accrual Spreadsheet
39
Appendix H – Sample Internal Service Fund Proration Spreadsheet
46
Appendix I – Sample Gain/Loss on Disposal of Assets Spreadsheet
47
3

4

GASB Statement 34—An Implementation Guide for Tennessee Counties Introduction This publication is intended to assist Tennessee county governments with implementation and compliance with GASB Statement 34 by addressing the responsibilities of the county as set forth by the State Comptroller of the Treasury, Division of County Audit Form Implementation Work Plan to Comply with GASB Statement 34. This publication is intended to be used to assist counties with meeting the reporting responsibilities set forth in Statement 34—not as a substitute for reading Statement 34 or an attempt to discuss the statement in its entirety. Overview of GASB and GASB Statement 34 The Governmental Accounting Standards Board (GASB) is an independent, not-for-profit organization that was organized in 1984 as an operating entity of the Financial Accounting Foundation (FAF). The GASB’s role is to establish standards of financial accounting and reporting for state and local governmental entities. While the GASB technically has no legislative authority, its standards are widely recognized as the guide for preparing external financial reports for state and local governments. In June 1999, the GASB adopted GASB Statement 34, which contains sweeping changes for financial reporting. Known as Statement No. 34: Basic Financial Statements—and Management’s Discussion and Analysis—for State and Local Governments, these changes represent a fundamental revision of the current financial reporting model, which has been in place since 1979. While there are a number of significant changes in financial reporting under GASB Statement 34, probably the most major one is the presentation of government-wide financial statements. Government-wide statements are consolidated financial statements for all of a county’s operations on a full accrual basis of accounting—accounting that is similar to what is used by many businesses and not-for-profits. The intent of these statements is to provide the “big picture” of a county’s financial position and operations as a whole. They will not be presented on a fund basis. Instead, fiscal operations will be organized into two major activities: governmental and business-type.
5

The statements will have a “net asset” focus and exclude fiduciary funds and inter-fund transactions (such as internal service funds). Expenses will be shown both gross and net of related revenues (such as fees and grants). See Appendix A for an example of government-wide financial statements. Financial statements also will be presented on a fund basis, in a similar way as they were before GASB Statement 34. Emphasis will be given to “major” (i.e. larger) funds. Governmental funds do not use the same basis of accounting as the government-wide statements (i.e. modified accrual or current financial basis). See Appendix B for an example of fund financial statements. Because there will be differences in the basis of accounting and scope of transactions, there also will be significant differences between the fund and government-wide financial statements. For this reason, a detailed reconciliation between these two types of statements will be required as part of the basic financial statements. In Tennessee, the county’s independent, external auditor typically prepares this reconciliation as well as the draft financial statements. This service is purely technical in nature as the financial statements are derived from financial data prepared and provided by county accounting personnel. The appropriate county officials also must take responsibility for the accuracy of the prepared financial statements. The independent auditor, as in the past, will typically prepare the financial statements from a county’s current accounting records. However, county management will be required to prepare and maintain additional financial information. Without this additional information, it will be impossible to prepare financial statements that comply with GASB Statement 34. While GASB encouraged early implementation, it required even the smallest Tennessee county to comply with Statement 34 (except for retroactive capitalization of infrastructure assets) by the end of the fiscal year that ended June 30, 2004. After this date, any Tennessee county that was not compliant with GASB Statement 34 received an adverse audit opinion on their financial statement audit for failure to comply with Generally Accepted Accounting Principles (GAAP). In May 2005, the Tennessee General Assembly passed into law the Local Government Modernization Act of 2005. This act allows financial penalties to be imposed on county governments that are not in compliance with GASB Statement 34 by June 30, 2008. A copy of this act is located in Appendix C. Capital Assets While Statement 34 does not give a complete definition of a capital asset, capital assets can be defined as major assets that benefit more than a single fiscal period. Capital assets include items such as land, land improvements, buildings, building improvements, construction-in-progress, vehicles, and equipment. A county is responsible for capitalizing all county-owned assets above the capitalization threshold determined by the county’s written capital asset policy.
6

Creating and maintaining an accurate capital asset management system will be one of the more time-consuming responsibilities for achieving GASB 34 compliance. With this in mind, county management must be responsible for providing adequate time, personnel, and resources dedicated to achieving this compliance. Counties will be required to prepare capital asset reports at least annually. These reports present capital assets and infrastructure by function (the description account as defined in the state uniform chart of accounts) and asset type (i.e. land, construction-in-progress, buildings and improvements infrastructure, and other assets). These reports should present all of the county’s assets and infrastructure over a certain capitalization threshold, as well as the corresponding annual depreciation expense and accumulated depreciation for these assets. These reports are to be accurately prepared at the end of each fiscal year in a timely manner. Data from these reports will be included into the county’s annual audited financial statements. An example of two required capital asset reports (by classification and by function and activity) is provided in Appendix D. It is important to become familiar with these two sample reports because the county’s government-wide financial statements cannot be prepared until these reports can be generated accurately. The first and possibly the most important step to creating and maintaining an accurate and complete asset management system is for a county to adopt a written capital asset policy. The policy should be descriptive enough that an auditor (or other individual who did not create the asset management system) would be able to read the policy and verify that the county had capitalized and maintained its capital assets in accordance with its adopted policy. While it is a good idea to acquire a copy of a capital asset policy from another county (one that has already complied with GASB 34) to have a “rough draft” for your own policy, a county should not merely copy another county’s capital asset policy—asset management will differ from county to county. A sample capital asset policy is located in Appendix E. This sample policy is a compilation of best practices from numerous Tennessee counties that have complied with GASB Statement 34 and can be used as a “rough draft” for your county’s policy. Once a county adopts a capital asset policy for use, it is imperative that the county’s asset management system is implemented and maintained in accordance with its adopted policy. A written capital asset policy, at a minimum, should address the following:
a. Capitalization thresholds b. Depreciation methods and rates c. Procedures to identify existing capital assets and infrastructure d. Methods to determine historical costs or estimated historical costs e. Procedures to tag and track movable assets f. Procedures to maintain capital assets records on a current basis g. Procedures for recording new/donated/transferred/disposed of assets h. Identification of available software to account for capital assets
7

a. Capitalization thresholds
The management of the county must determine the capitalization thresholds for county-owned assets. There are no authoritative pronouncements as to the exact threshold amount or the manner in which a capitalization policy should be established and applied. However, management’s capitalization policies should be adopted with the mindset that an appropriate balance should be achieved: ensuring that all material capital assets, collectively, are capitalized while simultaneously being mindful to minimize the cost of recordkeeping for capital assets. Counties should strive to use the lowest reasonable capitalization threshold. Keep in mind that all debt issued will be reported without any type of threshold. If a county sets its capitalization threshold too high, it runs the risk of materially misstating its financial statements. Counties should seriously consider capitalizing all county-owned land, regardless of the amount. Since land does not depreciate, the capitalized land will generally be a permanent increase to the county’s total assets. Also, through GASB 34 implementation, numerous counties have been able to identify land that management was previously unaware it owned. These “newly found” assets were either used by management or were sold as surplus, providing funds for various county needs. Whatever capitalization threshold is decided upon, county management should remember that while it is their responsibility to determine threshold amounts, it is a responsibility of the independent auditor to determine if the county’s financial statements materially reflect the accurate financial position of the county.
b. Depreciation methods and rates Depreciation is the process of allocating the cost of tangible property over a period of time, rather then deducting the cost as an expense in the year of acquisition. Typically, at the end of an asset’s useful life, the sum of the amount charged for depreciation will equal original cost less salvage value (if any). GASB Statement 34 allows a county to use any established rational and systematic method of depreciation. This includes such methods as straight-line, sum-of-the-years digits, double-declining balance, and declining balance. The use of straight-line depreciation—the most widely used and simplest method for calculating depreciation—is highly recommended. Under the straight-line depreciation method, the basis of an asset is written off evenly over the useful life of the asset. The same amount of depreciation is taken each year of the asset’s useful life. In order to identify the annual depreciation expense for an asset using straight-line deprecation, the total cost of an asset (less the salvage value) is divided by the asset’s useful life.
8

Example of straight-line depreciation: Original cost $10,000 Salvage value 500 Adjusted basis $ 9,500 Estimated life 5 Depreciation per year $1,900 Salvage Value: The salvage value of an asset is an estimate made by management of what the value of an asset will be at the end of its useful life. The GASB allows county management to determine salvage value from general guidelines from professional organizations such as the Government Finance Officers Association, information from other governments, professionals such as engineers, and by internal experience of what an asset is worth at the end of its useful life. Using the assumption that many counties in Tennessee tend to use capital assets until they are literally worthless, a county, if this assumption applies, could assign a salvage value of zero (0) to its capital assets to help streamline recordkeeping. The CTAS sample capital asset policy uses this assumption. Averaging Conventions: In order for management to avoid the complications of depreciating individual assets from the specific date that the asset was placed in service, GAAP supports the adoption of guidelines that assume assets are placed in service or disposed of at designated times of the year. These guidelines are known as averaging conventions. There are several types of averaging conventions (mid-quarter, half-year, modified half-year, etc.); however, it is highly recommended that counties adopt the full-month averaging convention. By using the full-month averaging convention, property placed into service at any time during a given month is treated as if it were placed in service at the first day of that month, regardless of the actual day of the month acquired. Likewise, when the asset is disposed of, the actual date of disposal is disregarded and the disposal date is the end of the month prior to the month of disposal (i.e. no depreciation is taken for the month of disposal). Useful lives of assets: An asset’s useful life can be defined as the estimated number of months or years that an asset will be able to be used for the purpose for which it was acquired. GASB does not recommend any specific useful life schedule, but recommends several sources for a county to estimate the useful lives of their assets. These sources include: general guidelines from professional organizations, information for comparable assets from other county governments, and internal experience. Counties should not merely copy the useful life schedule of another county, as conditions and asset usage may differ significantly from county to county. Example: Gray County assigns a useful life of six years to all sheriff pursuit cars. Blue County, which is located next to Gray County, is in the process of attempting to comply with GASB 34 and copies Gray County’s useful life schedule without any modification.
9

Blue County’s management does not take into consideration that their county has rougher terrain and is three times larger than Gray County, meaning Blue County’s deputies will drive their vehicles more and in rougher conditions than Gray County’s deputies. After three years, as is typical in Blue County, the police cruisers are worn out and are taken out of service, even though on paper the vehicles should have three years of useful life left. Because of the inaccurate useful life estimate, Blue County could recognize a significant loss on the disposal of the vehicles.
c. Procedures to identify existing capital assets and infrastructure There are numerous ways for management to identify county-owned assets and infrastructure: county department inventories, county commission minutes, the current county road list, building and content insurance records, TDOT bridge inspection reports, and data from the county’s register of deeds and tax assessor. Infrastructure is defined as long-lived capital assets that normally can be preserved for a significantly greater number of years than most capital assets. Infrastructure assets are normally stationary in nature: bridges, roads, dams, etc. Generally, county-owned buildings are considered capital assets, not infrastructure assets. For more information on infrastructure, refer to page 14. Example: Blue County is a small county with only a few schools and county-owned buildings. Per Blue’s capital asset policy, building improvements have a useful life of 20 years. The county’s capital asset manager spends a couple days scanning the county commission and school board minutes for the past 20 years, noting any building improvements (new roofs, additions, HVAC replacements, etc.) that exceed the capitalization thresholds. After verifying through an inventory that these improvements still exist (HVAC units, etc.), these items are then capitalized as building improvements and the minutes, if original invoices and warrants cannot be found, are copied and maintained as supporting documentation for each improvement’s cost. By utilizing these procedures, management helps ensure that major capital assets are identified and recorded properly.
d. Methods to determine historical costs or estimated historical costs Capital assets and infrastructure are to be reported at historical (acquired) cost. A county may use any established tool to accomplish GASB Statement 34 historical cost requirements; however, the mechanism for calculating historical costs for previously acquired assets should be (1) accurate, (2) able to be replicated, and (3) documented. An asset’s total historical cost includes all costs of construction and/or installation and setup of the assets (i.e. shipping, engineering and architect fees, and capitalized interest during construction of a building). An asset’s historical cost can be identified through deeds, bills of sale, county commission minutes, and/or invoices. If the actual historical cost of an asset cannot be identified, an estimated historical cost can be used. A county can estimate the historical cost of assets or infrastructure by identifying an accurate estimate of an asset’s current replacement cost and then using a deflation calculator to arrive at an estimated historical cost. While there are a number of inflation/deflation calculators available, an excellent
10

calculator that utilizes the consumer price index (CPI) is available on the Federal Reserve Bank of Minneapolis Web site at: www.minneapolisfed.org/research/data/ us/calc/. Example: A county identifies a 10-acre tract of land that it owns through the register of deeds office. Even though the county has the deed to the land, there is no price amount on the deed. Based on historical research, management ascertains that the land was donated to the county board of education in 1948. The county property assessor values the land (based on what a similar piece of land in the county would cost today) at $80,000. Using a deflation calculator, management calculates that the replacement cost of the land in 1948 would be $9,568. The county would record the asset with an estimated historical cost of $9,568 and print off the calculation, a copy of the deed, and documentation from the property assessor stating his/her estimate for backup documentation for the asset’s cost.
e. Procedures to tag and track movable assets A county must establish written procedures to tag and track all movable capital assets over the established capitalization threshold. The inventory tag should be numbered so that the asset can be traced back to the county asset records. Example: A county has recorded a front-end loader into its computerized capital asset database and assigned the vehicle the asset ID number 110. The county asset manager is doing an annual physical inventory of movable assets and is able to locate and identify the exact front-end loader at the county road department garage by the asset number tag affixed to the vehicle and by the information on the computerized capital asset database. County management should insure that, at a minimum, a county-wide inventory of capitalized assets is performed annually and all purchased, donated, surplused, and/or transferred movable assets are accounted for and properly recorded in capital asset records. There are numerous bar-code inventory tag systems on the market today, some with UPC format to permit scanning by an electronic optical scanner. While these systems have proven helpful in several Tennessee counties with asset tracking, they are not required.
f. Procedures to maintain capital assets records on a current basis Complying with GASB Statement 34 is not a “one time affair.” Because counties are continuously acquiring and disposing of assets, a county must keep capital asset records updated after the initial capitalization of all county assets and infrastructure. It is highly recommended that a capital asset manager position be created for tracking assets for the county. In a mid-to-large size county, this position would be a full-time job. In smaller counties, this task could be accomplished on a part-time basis. While the assistance of all county officials and department heads is necessary to ensure that county assets are inventoried and tracked, numerous Tennessee counties have arrived at the conclusion that the best way to ensure that a
11

county’s GASB 34 compliance (in relation to capital asset management) is maintained is to have one individual who is responsible for maintaining the capital asset database and ensuring that the asset management system is complying with the county’s adopted polices. Regardless of how this procedure is addressed, counties should have a system in place to: (1) identify and capitalize all new assets over the threshold limits, (2) identify and remove from capital asset records all assets declared surplus, destroyed, stolen, and missing, (3) record any gain or loss on the disposal of individual assets, (4) perform a county-wide inventory of capitalized assets at least once a year, and (5) have all capital asset reports that are required by the county’s auditors prepared and available on a timely basis. A sample job description for a capital asset manager is located in Appendix F.
g. Procedures for recording new/donated/transferred/disposed of assets Counties must have an effective system in place to ensure accurate recording of new and donated assets. Numerous counties have accomplished this by having all accounts payable clerks make a copy of all invoices that are over the capitalization threshold. This documentation can assist in the recognition of new capital assets. Most large donations tend to be to the county school system from booster clubs, parent-teacher organizations, and other similar groups, so all school principals should be made aware of GASB 34 capitalization requirements for donated assets. It also is recommended that the capital asset manager (or his/her equivalent) be notified whenever the county receives a sizable donation so that the current value, and supporting documentation of the asset’s value, at the time of donation to the county can be recorded, as this is the amount that will be capitalized. Example: TRW Industries is donating new playground equipment to Jere Whitson Elementary School. Upon receipt of the playground equipment, the principal contacts the county’s capital asset manager, who speaks with TRW to determine a fair value for the asset. TRW provides a copy of the invoice for the cost of material that was purchased at the time of donation and installation of the playground equipment. The county records the donated playground in its capital asset records and maintains the invoice and any official minutes where the donation was accepted as backup documentation. The transferring of assets between county departments and/or disposal of assets, whether that is through surplus, destruction, or theft, should be reported promptly to the capital asset manager. Asset tags should be removed from movable assets that are being disposed of. Likewise, the function of transferred assets should be, if applicable, reclassified in the county’s capital asset records. Example: Blue County’s solid waste department agrees to transfer a pickup truck to the county’s jail in exchange for $1,000. The net value (cost less accumulated depreciation) of the asset is reclassified in the county’s capital asset software and records from asset function #55710–Sanitation Management to #54210–Jail. The
12

$1,000 is not added to the asset’s depreciable basis as this transaction is an inter-governmental exchange (i.e. between two departments of the same county government). Department heads and officials should ensure that the capital asset manager is alerted whenever assets are declared surplus so any capitalized assets can be identified, have inventory tags removed, and any applicable funds received for surplus asset sales are recorded. A sample spreadsheet for tracking disposed of assets, and the related gain or losses from these assets, is located in Appendix I. Example: Gray County declares a small school bus surplus and sells the bus at public auction. The bus is totally depreciated and has no salvage value recorded. However, lately this type of school bus has become very popular among the local farmers, who use them to haul hay. The bids come hard and fast at the auction, and the bus is sold for $1,800. Since the net book value of the bus is zero (0), the $1,800 is recorded as a gain on the sale after the bus and its accumulated depreciation is removed from the county’s capital asset software. As some officials and department heads will prove better then others on reporting purchased, donated, transferred, and surplus assets; it is necessary to ensure a thorough physical capital asset inventory is performed on at least an annual basis.
h. Identify available software to account for capital assets Capital asset software that can produce needed reports must be obtained and utilized so all county assets that are above capitalization thresholds can be accurately reported through software-generated reports. There are several vendors that currently have various capital asset software programs available; however, the software must be able to prepare the necessary capital asset reports and information included in the county’s annual financial statement. County management should show potential software vendors the reports located in Appendix D to ensure that the software is capable of producing such reports. Management also should consider the level of support that the vendor will provide after the sale, such as software updates and assistance that may be needed after the original system has been purchased and installed. Capitalization of Library Books: Considered individually, library books usually have a historical cost well below a county’s threshold for capitalizing assets. However, when valued together as a collection, the cost of library books can be significant in some counties. County management should consider if the cost of a county-owned library collection is of material enough value to capitalize. If management makes the decision to capitalize a library collection, the collection should be depreciated using a composite depreciation method.
13

Infrastructure The GASB defines infrastructure as long-lived capital assets associated with governmental activities that normally are stationary in nature and can be preserved for a significantly greater number of years than most capital assets. Examples of infrastructure are bridges, roads, dams, and lighting systems. Buildings usually are excluded from the definition of infrastructure assets unless they are an ancillary part of a network of infrastructure (i.e. a pump-house on a dam). Most small- and medium-size Tennessee counties will typically have at least two main types of infrastructure to capitalize: county-owned roads and bridges. Except for counties with less then $10 million of total revenue in fiscal year ended June 30, 1999, all Tennessee counties must capitalize all major infrastructure on a retroactive basis. While the GASB encourages all counties, regardless of size, to retroactively capitalize infrastructure, counties under the $10 million threshold are allowed to capitalize infrastructure on a prospective basis (i.e. just new additions of infrastructure beginning with the year of Statement 34 implementation). When it issued Statement 34, the GASB set forth deadlines for local governments to retroactively report assets. While the GASB encouraged early implementation, Tennessee counties with more than $10 million but less then $100 million in total revenue in the first fiscal year ending after June 15, 1999, are supposed to capitalize all major infrastructure retroactively no later then June 30, 2007. Counties with less then $10 million in total revenue are encouraged, but not required, to retroactively capitalize infrastructure assets. GASB Statement 34 requires counties to capitalize and report all county-owned infrastructure that exceed capitalization thresholds, at historical or estimated historical cost. The GASB recognized the challenge to determine an accurate historical cost in counties that are required to retroactively report assets. Therefore, counties will be required to capitalize and report only major general infrastructure assets that were acquired (purchased, constructed, or donated) in fiscal years ending after June 30, 1980, or that received major renovations, restorations, or improvements during that period. Roads: One of the biggest challenges with capitalizing roads is how to determine the historical and/or estimated historical costs of these assets. Many county-owned roads have been maintained in the county for decades, or even more then a century, and have changed over time from a simple dirt road to a multiple-lane asphalt road with numerous upgrades and courses of maintenance. The GASB considered this accounting challenge when it implemented Statement 34 and requires that counties retroactively report roads at actual or estimated historical cost only back to—
• Those acquired on or after July 1, 1980 or, • The last time the road was upgraded (gravel to oil-and-chip, etc.) or,
14
• The last time the road was replaced or resurfaced in a way that it extended the original useful life of the road (i.e. not considered routine maintenance).
Example 1: Blue County is trying to determine the historical cost for Turkey Town Road (a county-owned gravel road). The road has been a gravel road for at least 50 years. Every year, the county grades the road a couple times and drops a few loads of gravel (less than $100) on it for annual maintenance. As this road does not meet any of the requirements for capitalization (date acquired, no upgrades, only routine maintenance performed), county management chose not to capitalize this road. Example 2: Grey County is trying to determine the historical cost for Short Mountain Road (a county-owned oil-and-chip road). The road has existed for more than a hundred years. However, the road was gravel until 1994, when it was upgraded to oil-and-chip. Since this was the last major work project on this road, the county would determine an estimated historical cost (if actual cost was not known) for the cost of an oil-and-chip road and capitalize this amount as the road’s cost with the acquisition date of the road being 1994 (when it was upgraded). Example 3: Black County is trying to determine the historical cost for Biven’s Hill Road (a county-owned asphalt road). The road has been an asphalt road for a number of years; however, the road was resurfaced three years ago during a large repaving project. The original historic cost of the road would be determined at the time of resurfacing if the project extended the useful life of the road and was not considered routine maintenance. The original acquisition date for the road would be the date of this last major resurfacing. Often when new subdivisions are finished, the roads within the subdivision are brought up to county road standards and donated to the county. The capitalization cost of these roads should be the actual or estimated fair value of the roads at the time of donation. If the developer refuses to disclose the cost of the roads, the GASB has determined that a county can use an accurate estimate (based on comparable road construction costs) for the value of the donated infrastructure. Management should be cautious, if they use a cost estimate provided by a road builder, not to include the builder’s profit margin into the cost estimate for a donated road. Right-of-ways and other easements: An easement is an interest in land that is owned by another entity that entitles its holder to a specific limited use or right. Right-of-ways and other easement rights for which the county did not incur a cost are not required to be capitalized. If the easements were paid for by the county, they should be capitalized by actual or estimated historical cost. Example: Blue County has right-of-ways for a certain distance on both sides of all county roads. The county did not pay for these easement rights and private property owners
15

that live next to the roads actually pay property taxes on the land under the roads. Since Blue County did not pay for these easement rights, and the rights would cease if the road was taken off the county road list (i.e. no longer a county asset), management has decided not to capitalize these easements as infrastructure. Bridges: County-owned bridges should be capitalized at historical or estimated historical cost and depreciated as infrastructure. The Tennessee Department of Transportation bridge inspection reports are an excellent source of information for determining the construction date and dimensions of most, if not all, county-owned bridges. If the actual historical cost of the bridge cannot be located, a county can use an estimated historical cost by using a deflation calculator to index current bridge construction cost back to the year of construction. All bridges acquired on or after July 1, 1980, and above the county’s capitalization threshold should be capitalized. Major renovations and repairs, that are not considered routine maintenance and upgrades (wood to concrete, etc.) to bridges, that exceed the capitalization threshold also should be capitalized and depreciated. Example 1: Blue County has a bridge that was originally built with a wooden floor in 1945. The bridge was upgraded to a concrete span in 1985. The county implemented GASB 34 in 2006 and retroactively reported the bridge as a concrete span with an acquisition date of 1985 (when the upgrade took place). Example 2: Blue County has a concrete box-type bridge that originally was constructed in 1983; however, the bridge had extensive damage in a storm and had major repairs (that extended the bridge’s original useful life) in 1993. The bridge would be capitalized with an initial acquisition date as of 1993 (the date of the major renovation). Modified approach to reporting infrastructure: Most, if not all, Tennessee counties report their infrastructure on an individual asset basis. However, the GASB allows for a modified approach for infrastructure reporting. Under the modified approach, counties still are required to perform an initial retroactive capitalization of county-owned infrastructure (if over the $10 million threshold mentioned previously). However, instead of annually depreciating each infrastructure asset, the county must calculate a “maintenance of effort” amount that reflects the current costs for preserving infrastructure in lieu of depreciation. Counties are discouraged from implementing the modified approach since use of this method requires a county to periodically engage independent engineering consultants to perform condition assessments and demonstrate that all infrastructure has been maintained at or above a prescribed level. Leave, Sick and Compensatory Time Liability Reporting A county will have to adopt written personnel policies addressing paid time off. Paid time off includes vacation, sick, and compensatory (comp) time. A policy should address the rate that time off is accrued, the maximum amount of time that each
16

individual employee is able to accrue, and what type of leave is guaranteed to be paid upon termination or retirement of an employee. While there is no state or federal law requiring that vacation or sick leave be provided for county employees, management should note that federal labor laws require accrued comp time to be paid out in full to employees upon retirement or termination. Comp time accrues at one and one-half hours for each hour of overtime worked, and the maximum amount of comp time that can be accrued by an individual employee in public safety, emergency response, or seasonal activities is 480 hours, which represents 320 hours of overtime actually worked. Employees in other types of job classifications can accrue up to a maximum of 240 hours of comp time, which represents 160 hours of actual overtime worked. Comp time accruals for individual employees should never exceed these maximum amounts. For more information about the legal aspects of paid time off, please reference the CTAS publication Legal Aspects of Personnel Management. Once a county adopts a written personnel policy addressing paid time off, county management will have to prepare an annual report that presents accumulated dollar values by function for all leave, sick, and comp time if guarantee payment provisions for this paid time off exist in the county’s personnel policy. The annual report must present the beginning of fiscal year accumulated leave, sick, and comp time liability balances, amount of time earned by employees during the current fiscal year, amount of time used by employees during the current fiscal year, and the end of year accrued time liability. Management also will have to provide an accurate estimate of the amount of time off that will be expensed in the next fiscal year. An example of this report can be found in Appendix G. Note: One of the most common and avoidable mistakes that some counties make when preparing the annual accrued time off report is to use a beginning of current year (July 1) balance that is different than the prior fiscal year’s ending balance (June 30). These amounts should always be the same. If a prior period correction is needed, make the adjustment in the current fiscal year and make your auditors aware of this adjustment. Outstanding Long-term Debt Reporting County management will need to prepare a schedule that breaks down the percentage of the county’s long-term debt (bonds, notes, loans, and capital leases) between the county and the school department and/or other component units. Management also should obtain or prepare a schedule of the dates for semi-annual or annual payments for principal and interest on each outstanding long-term debt issue. Amortized debt payment schedules should be provided to the county when any debt (including capitalized leases) is issued. County management should compare their outstanding debt schedules with amounts that will be reported by the county’s independent auditors to ensure all outstanding debt is reported accurately.
17
Example 1: Black County issues bonded debt for jail improvements. Management notes on the long-term debt schedule the bond issue, amount, and that the debt was issued for 100-percent use with primary government operations. Management makes a copy of the debt amortization schedule as well as keeping all paperwork related to the debt issue in a central location. Example 2: Blue County issues $10 million in refunding debt for two previous debt obligations. Management prepares a schedule that details the various individual debt obligations that were refunded and notes that $3 million of the refunded debt came from the purchase of ambulances and stations for county EMS, and $7 million of the original debt was for some renovations at the high school. Management retains all information related to the debt issue in a central location for use by financial statement preparers. Internal Service Fund Reporting Internal service funds are used to report an activity that provides services or goods to other funds, departments, or agencies to the county, the school system, or component unit on a cost-reimbursement basis. Examples of internal service funds are self-insurance and workers’ compensation funds. Counties that maintain an internal service fund will have to prepare a schedule that presents a breakdown of activity applicable to the county and applicable to the school department. Further detail should be provided to break down the activity between functions (general government, administration of justice, etc.) within the primary government. See Appendix H for an example of a schedule that prorates usage of an internal service fund. Management Discussion and Analysis The Management Discussion and Analysis (MD&A) is a narrative that provides a brief, objective, and easily readable analysis of the government’s financial activities based upon currently known facts, decisions, or conditions. Further, it provides the management of a county government with the opportunity to present both a short-term and a long-term analysis of activities. MD&A is not a required part of the basic financial statements, but is supplementary information required by the GASB. Currently, the omission of the MD&A will not adversely affect the audit opinion of a Tennessee county’s financial statements. Any county that decides to include a MD&A should reference the latest edition of Governmental Accounting, Auditing and Financial Reporting (i.e. the Blue Book) and the Government Finance Officers Association Web site (www.gfoa.org) for the most up-to-date reporting requirements. Management also should communicate with their external auditor about the desire to prepare an MD&A in order to determine when the narrative must be completed for inclusion into the audit report.
18

Staying in Compliance with GASB Statement 34 Imagine that your county has adopted/updated a capital asset and/or personnel policy, capitalized all county-owned assets and infrastructure, and compiled all the reports needed for the preparation of government-wide financial statements. You also have prepared accurate backup documentation for all capitalized assets, leave liabilities, and other applicable GASB Statement 34 requirements covered in this manual. Your auditors complete the county’s audit and inform you that the county has complied with GASB Statement 34 reporting requirements. Congratulations! You have successfully complied with the one of the most significant governmental accounting pronouncements ever. However, the job is not entirely done. The county constantly will be acquiring and disposing of assets. Depreciation reports and employee leave liabilities change each year, and more debt will be issued in future years. These changes will have to be tracked and recorded on financial reports. While in most counties this maintenance of the accounting records will not be a large task, neglect of these duties could cause a county that already has complied with GASB Statement 34 to become noncompliant. This noncompliance would be due to the inability to prepare accurate financial statements because of a lack of updated financial information. The GASB has continued to issue new accounting statements (they are in the process of issuing GASB Statement 49). Many of these newer statements require the recognition of liabilities on the government-wide financial statements that are prepared under Statement 34. Without the preparation of government-wide financial statements, a county will be unable to comply with numerous current and upcoming accounting requirements. With this in mind, county management should strive to ensure that adequate resources are used to maintain the integrity of the financial reporting system in which they have invested so much already.
19

References: GASB Statement No. 34: Basic Financial Statements—and Management’s Discussion and Analysis—for State and Local Governments GASB Implementation Guides GQA34 & GQA34B: Guides to Implementation of GASB Statement 34 and Related Pronouncements Understanding GASB 34’s Infrastructure Reporting Requirements. PriceWaterHouseCoopers, 1999 State of Louisiana Legislative Auditor’s Office: Capital Asset & Depreciation Guidance State of Kentucky Office of the Auditor of Public Accountants: GASB 34 Implementation for Counties The New Financial Reporting Model for Local Government. Susan Combs, Texas Comptroller of Public Accounts
20

Appendix A - Example of Government-Wide Financial Statements
Sample County, TennesseeStatement of Net AssetsJune 30, 2005
PrimaryGovernment Component Units
Sample CommunityCounty Care of Emergency
Governmental School Sample CommunicationsActivities Department County, Inc. District
ASSETS
Cash $ 1,581,038 $ 0 $ 0 $ 2,435,363Equity in Pooled Cash and Investments 84,306,419 61,540,470 0 0Investments 169,062 0 0 0Accounts Receivable 9,189,524 426,125 0 155,812Allowance for Uncollectibles (906,162) 0 0 0Property Taxes Receivable 52,103,904 46,517,225 0 0Allowance for Uncollectible Property Taxes (863,003) (780,584) 0 0Accrued Interest Receivable 0 0 0 18,828Due from Other Governments 3,249,199 6,594,040 0 0Due from Component Units 1,391 0 0 0Prepaid Items 234,621 0 0 17,014Notes Receivable - Long-term 1,400,683 0 0 0Allowance for Doubtful Notes Receivable (1,037,302) 0 0 0Deferred Charges - Debt Issuance Costs 1,664,840 0 0 0Capital Assets: Assets Not Depreciated: Land 66,265,459 7,960,617 0 17,500 Construction in Progress 1,309,600 40,221,147 0 0 Assets Net of Accumulated Depreciation: Buildings and Improvements 49,099,532 221,251,307 0 1,098,078 Other Capital Assets 5,923,798 4,283,131 0 263,554 Infrastructure 83,660,898 0 0 0Total Assets $ 357,353,501 $ 388,013,478 $ 0 $ 4,006,149
LIABILITIES
Accounts Payable $ 497,003 $ 1,369,172 $ 0 $ 1,020Accrued Payroll 163,356 10,002,180 0 0Accrued Interest Payable 3,425,692 0 0 0Payroll Deductions Payable 95 0 0 0Deferred Revenue - Current Property Taxes 50,207,911 44,788,409 0 0Other Current Liabilities 46,253 0 0 0Noncurrent Liabilities: Due Within One Year 24,394,833 22,137 0 6,214 Due In More Than One Year (net of deferred amount on refunding and unamortized preimum on debt) 306,075,486 715,775 0 0Total Liabilities $ 384,810,629 $ 56,897,673 $ 0 $ 7,234
(Continued)
21

Appendix A - Example of Government-Wide Financial Statements (cont.)
Sample County, TennesseeStatement of Net Assets (Cont.)
PrimaryGovernment Component Units
Sample CommunityCounty Care of Emergency
Governmental School Sample CommunicationsActivities Department County, Inc. District
NET ASSETS
Invested in Capital Assets, Net of Related Debt $ 162,067,886 $ 0 $ 0 $ 0Invested in Capital Assets 0 273,716,202 0 1,379,132Restricted for: Capital Projects 14,397,305 38,446,494 0 0 Debt Service 31,323,064 0 0 0 Solid Waste/Sanitation 4,518,887 0 0 0 Adequate Facilities/Development Tax 5,827,438 0 0 0 Highway/Public Works 6,033,497 0 0 0 Other Purposes 2,924,092 1,985,445 0 0Unrestricted (254,549,297) 16,967,664 0 2,619,783
Total Net Assets $ (27,457,128) $ 331,115,805 $ 0 $ 3,998,915
(Continued)
22

App
endi
x A
- Ex
ampl
e of
Gov
ernm
ent-W
ide
Fina
ncia
l Sta
tem
ents
(con
t.)
Sam
ple
Cou
nty,
Ten
ness
eeSt
atem
ent o
f Act
iviti
esFo
r th
e Ye
ar E
nded
Jun
e 30
, 200
5
Pro
gram
Rev
enue
s
N
et (E
xpen
se) R
even
ue a
nd C
hang
es in
Net
Ass
ets
Prim
ary
Gov
ernm
ent
C
ompo
nent
Uni
tsO
pera
ting
Cap
ital
Sam
ple
Com
mun
ityC
harg
esG
rant
sG
rant
sTo
tal
Cou
nty
Car
e of
Em
erge
ncy
for
and
and
Gov
ernm
enta
lSc
hool
Sam
ple
Com
mun
icat
ions
Func
tions
/Pro
gram
sE
xpen
ses
Serv
ices
Con
trib
utio
nsC
ontr
ibut
ions
Act
iviti
esD
epar
tmen
tC
ount
y, In
c.D
istr
ict
Prim
ary
Gov
ernm
ent:
Gen
eral
Gov
ernm
ent
$1,
638,
923
$4,
225,
456
$16
,380
$0
$2,
602,
913
$0
0$
0 F
inan
ce5,
479,
541
5,51
4,06
649
,020
083
,545
00
0 A
dmin
istr
atio
n of
Jus
tice
4,75
2,61
75,
525,
030
915,
723
01,
688,
136
00
0 P
ublic
Saf
ety
26,8
07,1
443,
873,
884
789,
787
709,
943
(21,
433,
530)
00
0 P
ublic
Hea
lth a
nd W
elfa
re10
,792
,333
5,61
5,98
11,
201,
657
262,
623
(3,7
12,0
72)
00
0 S
ocia
l, C
ultu
ral a
nd R
ec S
ervi
ces
1,18
5,76
78,
289
033
2,98
1(8
44,4
97)
00
0 A
gric
ultu
re &
Nat
ural
Res
ourc
es1,
439,
522
126,
150
00
(1,3
13,3
72)
00
0 O
ther
Ope
ratio
ns6,
880,
570
00
0(6
,880
,570
)0
00
Hig
hway
s/Pu
blic
Wor
ks13
,858
,759
03,
306,
928
1,02
1,23
0(9
,530
,601
)0
00
Edu
catio
n67
,166
,917
21,6
33,8
130
0(4
5,53
3,10
4)0
00
Inte
rest
on
Long
-ter
m D
ebt
13,1
23,3
130
00
(13,
123,
313)
Oth
er D
ebt S
ervi
ce1,
146,
126
00
0(1
,146
,126
)0
00
Tota
l Pri
mar
y G
over
nmen
t$
154,
271,
532
$46
,522
,669
$6,
279,
495
$2,
326,
777
$(9
9,14
2,59
1)$
00
$0
Com
pone
nt U
nits
: S
ampl
e C
ount
y Sc
hool
Dep
artm
en$
196,
516,
751
$25
8,33
0$
16,6
50,1
65$
43,5
54,0
61$
0$
(136
,054
,195
)0
$0
Com
mun
ity C
are
of S
ampl
e C
ount
y,
00
00
00
00
Em
erge
ncy
Com
mun
icat
ions
Dis
tric
t77
4,49
21,
120,
010
00
00
034
5,51
8
Tota
l Com
pone
nt U
nits
$19
7,29
1,24
3$
1,37
8,34
0$
16,6
50,1
65$
43,5
54,0
61$
0$
(136
,054
,195
)0
$34
5,51
8
(Con
tinue
d)
23

App
endi
x A
- E
xam
ple
of G
over
nmen
t-W
ide
Fin
anci
al S
tate
men
ts (c
ont.)
Sam
ple
Cou
nty,
Ten
ness
eeSt
atem
ent o
f Act
iviti
es (C
ont.)
P
rogr
am R
even
ues
Net
(Exp
ense
) Rev
enue
and
Cha
nges
in N
et A
sset
sPr
imar
y G
over
nmen
t
Com
pone
nt U
nits
Ope
ratin
gC
apita
lSa
mpl
eC
omm
unity
Cha
rges
Gra
nts
Gra
nts
Tota
lC
ount
yC
are
ofE
mer
genc
yfo
r an
d an
dG
over
nmen
tal
Scho
olSa
mpl
eC
omm
unic
atio
nsFu
nctio
ns/P
rogr
ams
Exp
ense
sSe
rvic
esC
ontr
ibut
ions
Con
trib
utio
nsA
ctiv
ities
Dep
artm
ent
Cou
nty,
Inc.
Dis
tric
t
Gen
eral
Rev
enue
s:
Tax
es:
Pr
oper
ty ta
xes
levi
ed fo
r ge
nera
l pur
pose
s$
22,5
20,1
19$
42,4
53,1
990
$0
Pr
oper
ty ta
xes
levi
ed fo
r de
bt s
ervi
ce25
,015
,333
00
0
Loca
l opt
ion
sale
s ta
x4,
007,
499
29,8
87,1
370
0
Oth
er lo
cal t
axes
16,3
66,1
393,
708,
668
00
Gra
nts
& C
ontr
ibut
ions
not
res
tric
ted
for
spec
ific
prog
ram
s6,
011,
548
93,2
15,2
670
0U
nres
tric
ted
Inve
stm
ent E
arni
ngs
2,50
0,52
745
9,68
20
30,8
71G
ain
on d
ispo
sal o
f cap
ital a
sset
s2,
500,
000
00
0M
isce
llane
ous
325,
197
498,
204
03,
357
Tota
l Gen
eral
Rev
enue
s$
79,2
46,3
62$
170,
222,
157
0$
34,2
28
Cha
nge
in n
et a
sset
s$
(19,
896,
229)
$34
,167
,962
0$
379,
746
Net
ass
ets,
Jul
y 1,
200
4(7
,560
,899
)29
6,94
7,84
32,
604,
835
3,64
2,41
0Pr
ior
Peri
od A
djus
tmen
t0
00
(23,
241)
Net
ass
ets,
Jun
e 30
, 200
5$
(27,
457,
128)
$33
1,11
5,80
52,
604,
835
$3,
998,
915
24

Appendix B - Example of Fund Financial Statement
Sample County, TennesseeBalance SheetGovernmental FundsJune 30, 2005
Major FundsNonmajor
FundsOther Total
General General Govern- Govern-Debt Capital mental mental
General Service Projects Funds FundsASSETS
Cash $ 133,817 $ 0 $ 0 $ 1,374,197 $ 1,508,014Equity in Pooled Cash and Investments 18,071,598 29,522,367 10,188,441 16,290,209 74,072,615Investments 0 0 169,062 0 169,062Accounts Receivable 4,358,472 440,736 4,000,000 136,619 8,935,827Allowance for Uncollectibles (906,162) 0 0 0 (906,162)Due from Other Governments 1,396,769 435,151 0 1,413,639 3,245,559Due from Other Funds 279,738 0 0 0 279,738Due from Component Units 1,391 0 0 0 1,391Property Taxes Receivable 22,837,320 27,541,842 0 1,724,742 52,103,904Allowance for Uncollectible Property Taxes (389,554) (444,688) 0 (28,761) (863,003)Prepaid Items 34,621 0 0 0 34,621Notes Receivable - Long-Term 0 0 0 1,400,683 1,400,683Allowance for Doubtful Notes Receivable 0 0 0 (1,037,302) (1,037,302)
Total Assets $ 45,818,010 $ 57,495,408 $ 14,357,503 $ 21,274,026 $ 138,944,947
LIABILITIES AND FUND BALANCES
LiabilitiesAccounts Payable $ 477,319 $ 0 $ 0 $ 11,184 $ 488,503Accrued Payroll 154,307 0 0 9,049 163,356Payroll Deductions Payable 95 0 0 0 95Due to Other Funds 0 0 0 277,599 277,599Due to Litigants, Heirs, and Others 27,074 0 0 0 27,074Current Liabilities Payable from Restricted Assets:
Customer Deposits Payable 19,179 0 0 0 19,179Deferred Revenue - Current Property Taxes 21,965,961 26,580,658 0 1,661,292 50,207,911Deferred Revenue - Delinquent Property Taxes 410,166 429,822 0 29,262 869,250Other Deferred Revenues 2,849,505 218,062 0 452,664 3,520,231
Total Liabilities $ 25,903,606 $ 27,228,542 $ 0 $ 2,441,050 $ 55,573,198
Fund BalancesReserved for Encumbrances $ 1,698,254 $ 0 $ 15,008 $ 122,206 $ 1,835,468Reserved for Alcohol and Drug Treatment 310,414 0 0 0 310,414Reserved for Litigation Tax - Jail, Workhouse, or Courthouse 529,300 0 0 0 529,300Reserved for Sexual Offender Registration 1,680 0 0 0 1,680Reserved for Computer System - Register 434,329 0 0 0 434,329Reserved for Long-Term Notes Receivable 0 0 0 363,381 363,381Reserved for Other General Purposes 4,270 0 0 0 4,270Unreserved, Reported In:
General Fund 16,936,157 0 0 0 16,936,157Special Revenue Funds 0 0 0 18,307,587 18,307,587Debt Service Funds 0 30,266,866 0 0 30,266,866Capital Projects Funds 0 0 14,342,495 39,802 14,382,297
Total Fund Balances $ 19,914,404 $ 30,266,866 $ 14,357,503 $ 18,832,976 $ 83,371,749
Total Liabilities and Fund Balances $ 45,818,010 $ 57,495,408 $ 14,357,503 $ 21,274,026 $ 138,944,947
25

26

27

28

Appendix D – Sample Required Capital Asset Report
FAQ038 2003/10/23 08:26:27
TOWN OF SAMPLEVILLE FlexGen4(6.1U) Page: 1
Governmental Activities
Capital Assets
Balance Balance
07/01/2002 Increases Decreases 06/30/2003
________________________________________________________________________________
Capital Assets Not Being Depreciated
1 LAND 11,507.75 0.00 0.00 11,507.75
------------------ ------------------ ------------------ ------------------
Total Capital Assets
Not Being Depreciated 11,507.75 0.00 0.00 11,507.75
------------------ ------------------ ------------------ ------------------
Capital Assets Being Depreciated
3 BUILDINGS AND IMPROVEMENTS 309,516.33 14,595.96 0.00 324,112.29
4 INFRASTRUCTURES 12,328,643.72 1,214,868.86 0.00 13,543,512.58
5 OTHER FIXED ASSETS 3,050,857.76 394,403.00 395,615.13 3,049,645.63
------------------ ------------------ ------------------ ------------------
Total Capital Assets
Being Depreciated 15,689,017.81 1,623,867.82 395,615.13 16,917,270.50
------------------ ------------------ ------------------ ------------------
Less Accumulated Depreciation
4 INFRASTRUCTURES 4,468,956.80 0.00 0.00 4,468,956.80
5 OTHER FIXED ASSETS 13,833.35 0.00 0.00 13,833.35
------------------ ------------------ ------------------ ------------------
Total Accumulated Depreciation
4,482,790.15 0.00 0.00 4,482,790.15
------------------ ------------------ ------------------ ------------------
Total Capital Assets Being
Depreciated, Net 11,206,227.66 1,623,867.82 395,615.13 12,434,480.35
------------------ ------------------ ------------------ ------------------
Governmental Activities
Capital Assets, Net 11,217,735.41 1,623,867.82 395,615.13 12,445,988.10
================== ================== ================== ==================
* End of Report: Local Government Data Demo *
1150
7.75
+
17.8
1 =
25.5
6
0.00
+
1,62
867.
82=
1,62
867.
82
B
Cur
rent
Yea
r’s D
epre
ciat
ion
E
0.00
+
395,
615.
13 =
39
5,61
5.13
1150
7.75
+
16,9
17,2
70.5
0 =
16,9
28,7
78.2
5
AC
D
F
29
,0 ,5
3, 3,Any
de
prec
iatio
n fr
om
disp
osal
s du
ring
spec
ified
da
te ra
nge.
F
15,6
8915
,700

FAQ035 2003/10/23 08:27:04 Appendix D Cont. FlexGen4(6.1U) Page: 1
TOWN OF SAMPLEVILLE
Schedule Of General Fixed Assets
By Function & Activity Report
Governmental Governmental
Funds Capital Funds Capital
Function/ Assets Assets Accumulated Depreciation
Activity 07/01/2002 Additions Disposals Transfers 06/30/2003 Depreciation Expense
131 HIGHWAY/PUBLIC WORKS
13000 FIXED ASSETS
13200 11,507.75 0.00 0.00 0.00 11,507.75 0.00 0.00
---------------- ---------------- ---------------- ---------------- ---------------- ---------------- ----------------
13000 Total: 11,507.75 0.00 0.00 0.00 11,507.75 0.00 0.00
131 HIGHWAY/PUBLIC WORKS
68000 CAPITAL OUTLAY
68000 15689,017.81 1623,867.82 395,615.13- 0.00 16917,270.50 4482,790.15 0.00
---------------- ---------------- ---------------- ---------------- ---------------- ---------------- ----------------
68000 Total: 15689,017.81 1623,867.82 395,615.13- 0.00 16917,270.50 4482,790.15 0.00
---------------- ---------------- ---------------- ---------------- ---------------- ---------------- ----------------
131 Total: 15700,525.56 1623,867.82 395,615.13- 0.00 16928,778.25 4482,790.15 0.00
================ ================ ================ ================ ================ ================ ================
Final Total: 15700,525.56 1623,867.82 395,615.13- 0.00 16928,778.25 4482,790.15 0.00
================ ================ ================ ================ ================ ================ ================
AB
CD
E
This
shou
ld a
lway
s ne
t bac
k to
a z
ero
tota
l. T
rans
fers
are
no
t sho
wn
on th
e ca
pita
l ass
ets r
epor
t.
* End of Report: Local Government Data Demo *
This
shou
ld e
qual
the
tota
l of
box
F fr
om th
e ca
pita
l as
sets
repo
rt.
30

Appendix E-Sample Capital Asset Policy
SAMPLE COUNTY, TENNESSEE Capital Assets Policies and Procedures
The purpose of this policy is to provide guidelines for the departments of Sample County regarding capital asset reporting in the financial statements in accordance with Governmental Accounting Standards Board (GASB) Statement No. 34, Basic Financial Statement-and Management’s Discussion and Analysis-for State and Local Governments, and establishes management control and continuing accountability for all capital assets, over capitalization thresholds, acquired by county departments. Capitalization of capital assets includes land, buildings and improvements, roads and bridges, machinery and equipment, and construction-in-progress. The asset amounts represented in the county’s financial statements should be documented by an inventory listing supported with detailed records for the historical or estimated historical cost of each asset. ADMINISTRATIVE POLICIES
A. Fiscal Responsibility. 1. County Commission:
a. Determine and approve policies for capital asset management. b. Review findings and recommendations related to internal audits conducted by
inventory control personnel or external audits conducted by the state/IPA firm. c. Ensure any identified deficiencies or noncompliance with policies are
addressed and corrected.
2. Capital Asset Management: The office of capital asset management is under the direction of the county mayor’s office, which provides fiscal procedure. Capital asset management operates with respect to the responsibilities of the county mayor, as fiscal agent of the county, and the county highway department. A full cooperative effort of all parties allows the capital asset management department to maintain records in accordance with adopted capital asset policies. Areas of responsibility are outlined below:
a. Maintain a computer database inventory of all county-owned assets that exceed capitalization thresholds assets. Copies of documentation for the actual historical or estimated historical cost of each capitalized asset will be maintained in a separate file as long as each individual asset is actively on the books.
b. Works with county officials and other departments to identify newly purchased or donated assets. Tags all movable assets over capitalization thresholds and inputs all relative information into the inventory control computer system.
c. Removes asset tags upon retirement of assets from computer records upon proper notification by appropriate departments.
d. Receives copy of and reviews annual inventory of all departments to determine that capitalized assets are being properly accounted.
e. Randomly audits annual inventory listings of county departments to ensure that departments are complying with adopted capital asset policies.
f. Reports to county mayor all instances of noncompliance with capital asset policies and procedures.
g. Updates inventory of capital assets tracked on capital asset software and generates all reports needed to prepare external financial statements.
h. Works with management and external auditors on all issues concerning capital asset reporting in order to comply with GASB Statement 34.
31
3. Administrative Officials:
Administrative officials (county officials, supervisors, etc.) are responsible for the custody and maintenance of all assets purchased for or assigned to their office. Their responsibilities include, but are not limited to, the following points:
a. Report the theft or loss of property, immediately, to capital asset management by telephone, to be followed in writing to the county mayor and capital asset management department. A police report should be obtained on all losses suspected of being stolen.
b. Report to capital asset management in writing any assets deemed to be surplus and unneeded by the department so that proper transfer or disposal can proceed.
c. Any acquisition, transfer to another county department, or disposal of assets by administrative officials shall be documented in writing to the capital asset management department.
d. Allow capital asset management access to all records and inventory necessary to aid in the determining of proper disclosure of capital assets for reporting purposes.
e. Designate person(s) for the custody and control of departmental property (departmental property coordinator). The name of this person shall be submitted to capital asset management for direct communication purposes.
f. All county officials/departments are required to prepare and maintain an annual inventory of all assets assigned to their respective department. A second inventory listing of only assets with cost basis that are over the capitalization threshold for financial reporting should be prepared and submitted to the capital asset management department. All county officials/department heads are responsible for the inventories of their respective department/office.
4. Departmental Property Coordinator (each county office/department):
a. Prepare and maintain an updated (at least annually) listing for all capital assets accountable to the office.
b. Maintain a second inventory listing of only assets with a cost basis that is over the capitalization threshold for financial reporting. This inventory report should be prepared and submitted to the capital asset management department on an annual basis.
c. Notify, on a timely basis, capital asset management of new asset acquisitions not currently tagged and any item that has been declared surplus/destroyed/missing.
d. Reconcile and report differences between annual capital asset inventory and actual physical inventory to inventory control and county official/department head.
B. Assets: Assets over capitalization thresholds will be identified through various sources including county department inventories, accounting records, bond issue documents, county commission minutes, the current county road list, building and content insurance records, and data from the county’s register of deeds and tax assessor’s office. All capitalized assets will be inventoried on capital asset software that will be maintained by the capital asset management department. Recording Land – Land will be capitalized but not depreciated. It is recorded at historical or estimated historical cost and remains at that cost until disposal.
1. Recording Land Improvements – a. Non-exhaustible – Expenditures for improvements that do not require
maintenance or replacement are capitalized but not depreciated.
32

b. Exhaustible – Other improvements that are part of a site, such as parking lots, landscaping, and fencing, are depreciable. During initial implementation of GASB Statement 34, these improvements will be recorded separately to the extent that cost documentation is available.
2. Recording Buildings – Buildings will be recorded at either their acquisition cost or construction cost. Each building component (e.g., roof, HVAC systems, etc.) should be recorded separately when significant because of the difference in the useful life of these components. During initial implementation of GASB Statement 34, these components will be recorded separately to the extent that cost documentation is available.
3. Recording Building Improvements – Building improvements that extend the useful life of a building and meet the capitalization threshold will be capitalized. During initial implementation of GASB Statement 34, these improvements will be recorded separately to the extent that cost documentation is available.
4. Recording Construction-in-progress – Construction-in-progress will be capitalized and not depreciated.
5. Recording Vehicles – Vehicles will be identified by asset tags, inventoried and depreciated. 6. Recording Furniture and Equipment – Assets such as furniture, machinery, and equipment
should be identified and inventoried. If they meet the threshold levels, they will be capitalized and depreciated.
7. Interest on Debt Issued – Interest on debt issued for the construction of an asset will be capitalized as part of the asset’s cost to the extent of the interest that was incurred during the construction period only.
C. Costs:
Capital assets shall be recorded at historical cost if the cost is reasonably determinable. If historical cost data is not determinable, an estimated cost will be used. 1. Actual Cost – This will include not only the purchase or construction cost (which can be
obtained through invoice, purchase order, and paid check files) but also charges necessary to place the asset in its intended location. This includes costs such as freight and transportation, site preparation expenditures, interest costs, professional fees, and legal claims directly attributable to asset acquisition.
2. Estimated Cost – This will be based on as much documentary evidence as can be found to support the cost, such as interviews with personnel and/or price level adjustments based on the Consumer Price Index for each asset.
3. Donated Cost – These assets will be based on their estimated fair market value at time of acquisition. A determination as to the fair market value basis will be included with property records.
D. Depreciation:
Depreciation is a method for allocating the cost of buildings and equipment over their useful lives. Generally accepted accounting principles dictate that the value of the capital asset must be written off as an expense over the useful life of the asset as an indirect cost. Annual depreciation expense will be calculated using the straight-line method. The county will utilize the full-month averaging convention. By using the full-month averaging convention, property placed in service at any time during a given month is treated as if it was placed in service at the first day of that month, regardless of the actual day of the month acquired. Likewise, when the asset is disposed of, the actual date of disposal is disregarded and the disposal date is the end of the month prior to the month of disposal (i.e. no depreciation is taken for the month of disposal). The salvage value of an asset is an estimate made by management of what the value of an asset will be at the end of its useful life. Using the assumption that Sample County tends to utilize capital assets until they are literally worthless, a salvage value of zero (0) will be assigned to all capital assets and infrastructure to help decrease the cost of record keeping.
33

E. Dollar Value and Life Expectancy Tests:
Individual assets (other then infrastructure and land) with an actual or estimated historical cost of $10,000 or more and with a life expectancy of three years will be included in the capital asset records. Items under this dollar value will not be presented in the financial statements. All infrastructure that has an actual or estimated historical cost of $25,000 or greater will be capitalized. All land that has an actual or estimated historical cost of $1.00 or greater will be capitalized. While authoritative pronouncements do not require it, management will consider the grouping of large purchases of assets that individually do not meet capitalization thresholds (personal computers, library book collections, desks, etc.) if management deems the total cost of the group of assets is material in relation to the total assets of the county.
F. Asset Reduction:
Assets no longer owned by or in the possession of the county shall be removed from the capital asset records. 1. Sold and/or Retired – These assets will be removed from the capital asset records upon
formal notification from the responsible party of such disposition. Departments should be cautious about retiring assets still depreciating on books. This will result in the department having to write off a loss in the year the asset was retired.
2. Transferred Assets – Assets that are transferred to proprietary (business-type) funds will be accounted for separately from the governmental activities of the county and will be removed from the capital asset records (in relation to governmental activities) upon transfer to a proprietary fund (i.e. the asset will be accounted for in the proprietary fund).
3. Missing – Assets not seen for two consecutive annual inventories will be classified as missing and will be removed from the capital asset records upon formal notification to inventory control. These assets no longer will be searched for in regular annual inventories. However, if an asset is located at some time in the future, it will be reactivated in the system. A list of missing assets by departments should be presented to the county commission on an annual basis.
G. Surplus Equipment:
1. Existing county policy regarding the sale/disposal of surplus equipment will continue to be followed. A complete accounting of the assets and any proceeds must be reported back to the capital asset management department so that these items can be removed from the system.
2. A list of surplus equipment removed from capital asset records will be presented to the full county commission on at least an annual basis.
H. Infrastructure
GASB Statement 34 requires counties to capitalize and report county-owned infrastructure at historical or estimated historical cost. The GASB defines infrastructure as long-lived capital assets associated with governmental activities that normally are stationary in nature and can be preserved for a significantly greater number of years than most capital assets. The county will initially capitalize its infrastructure by the following method:
1. County-owned Roads:
Sample County will retroactively report roads at actual or estimated historical cost back to: • July 1, 1980, or, • The last time the road was upgraded on or after July 1, 1980, (gravel to oil-and-chip, etc.) or, • The last time the road was replaced or resurfaced in a way that it extended the original useful life of
the road (i.e. not considered routine maintenance) on or after July 1, 1980.
34

2. Bridges:
Sample County will retroactively report bridges at actual or estimated historical cost back to: • July 1, 1980, or, • The last time the bridge was upgraded (wood to concrete, etc.), if this date was on or after July 1,
1980. • Major renovations on or after July 1, 1980, that were not considered routine repairs that extended the
original useful life of the bridge, will be capitalized.
3. Right-of-ways and Other Easements: Right-of-ways and other easement rights that the county did not incur a cost for will not be capitalized. If the easements were actually paid for by the county, it should be capitalized by actual or estimated historical cost.
Capitalization Thresholds
A. Capitalization and Depreciation: The following items will be capitalized and depreciated for GASB Statement 34 reporting purposes: 1. Land $ 1 (Capitalize Only) 2. Land Improvements $ 10,000 3. Buildings $ 10,000 4. Building Improvements $ 10,000 5. Roads and Bridges $ 25,000 6. Vehicles $ 10,000 7. Machinery and Equipment * $ 10,000 8. Furniture and Fixtures * $ 10,000 9. Construction in Progress $ 1 (Capitalize Only)
35
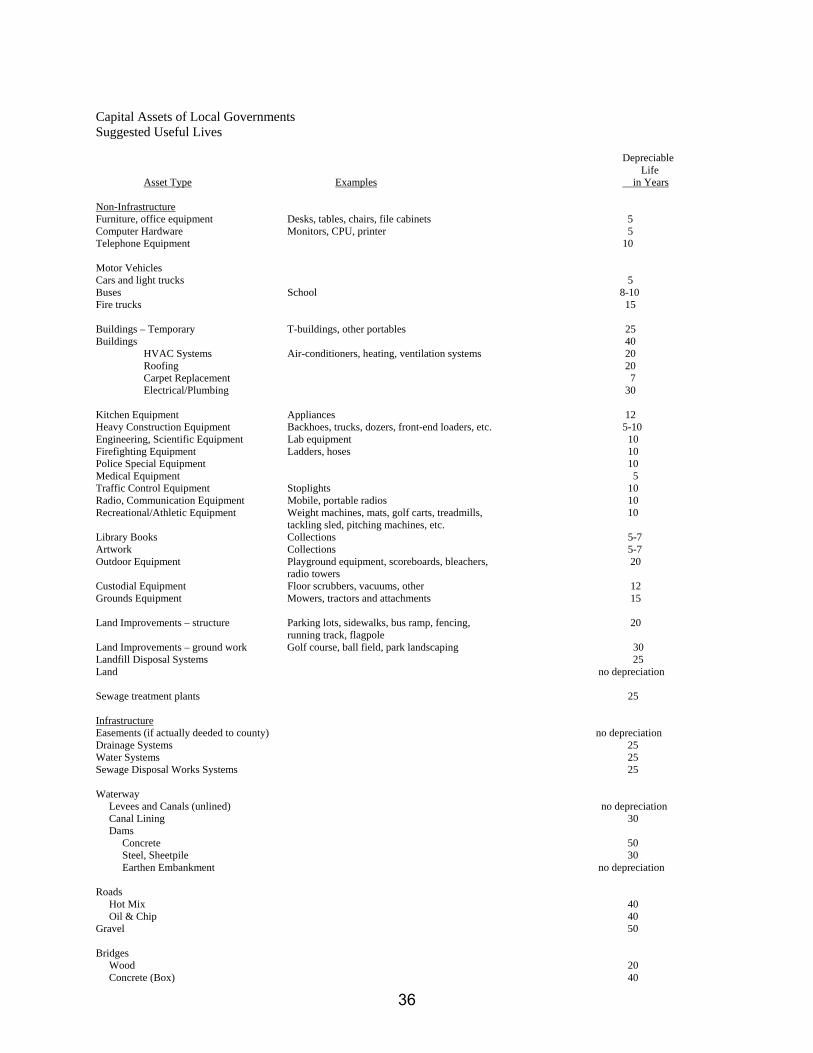
Capital Assets of Local Governments Suggested Useful Lives Depreciable Life Asset Type Examples in Years Non-Infrastructure Furniture, office equipment Desks, tables, chairs, file cabinets 5 Computer Hardware Monitors, CPU, printer 5 Telephone Equipment 10 Motor Vehicles Cars and light trucks 5 Buses School 8-10 Fire trucks 15 Buildings – Temporary T-buildings, other portables 25 Buildings 40 HVAC Systems Air-conditioners, heating, ventilation systems 20 Roofing 20 Carpet Replacement 7 Electrical/Plumbing 30 Kitchen Equipment Appliances 12 Heavy Construction Equipment Backhoes, trucks, dozers, front-end loaders, etc. 5-10 Engineering, Scientific Equipment Lab equipment 10 Firefighting Equipment Ladders, hoses 10 Police Special Equipment 10 Medical Equipment 5 Traffic Control Equipment Stoplights 10 Radio, Communication Equipment Mobile, portable radios 10 Recreational/Athletic Equipment Weight machines, mats, golf carts, treadmills, 10 tackling sled, pitching machines, etc. Library Books Collections 5-7 Artwork Collections 5-7 Outdoor Equipment Playground equipment, scoreboards, bleachers, 20 radio towers Custodial Equipment Floor scrubbers, vacuums, other 12 Grounds Equipment Mowers, tractors and attachments 15 Land Improvements – structure Parking lots, sidewalks, bus ramp, fencing, 20 running track, flagpole Land Improvements – ground work Golf course, ball field, park landscaping 30 Landfill Disposal Systems 25 Land no depreciation Sewage treatment plants 25 Infrastructure Easements (if actually deeded to county) no depreciation Drainage Systems 25 Water Systems 25 Sewage Disposal Works Systems 25 Waterway Levees and Canals (unlined) no depreciation Canal Lining 30 Dams Concrete 50 Steel, Sheetpile 30 Earthen Embankment no depreciation Roads Hot Mix 40 Oil & Chip 40 Gravel 50 Bridges Wood 20 Concrete (Box) 40
36

Steel (Span) 40
SAMPLE COUNTY, TENNESSEE PERSONAL PROPERTY ACQUISITION/DISPOSITION RECORD
LOCATION__________________________ TAG #_____________________ ACCOUNT CODE_________________________ ITEM DESCRIPTION__________________________________________________________ VENDOR_______________________________________ MAKE/MODEL__________________________________ SERIAL #____________________ PURCHASE PRICE $___________________ OR APPRAISED VALUE $_________________ ACQUISITION DATE RECEIVED_____________________ PURCHASE ORDER #______________ RECEIVED BY_______________________ CONDITION CODE________________ TRANSFERRED FROM________________________ STATUS CODE__________________ STATUS CODE (U=IN USE; R=HELD IN RESERVE; S=IN STORAGE) DONATED BY_______________________________________________________________ DISPOSITION ______TRANSFER_________STOLEN/LOST_______SURPLUS______________SCRAP OTHER_____________________________________________________________________ TRANSFERRED TO___________________________________________________________ I certify the above described equipment has been transferred, stolen/lost, declared surplus, scrapped, or disposed of by other means as indicated above. If the item was declared surplus, it is available for use by other county offices or can be sold in the prescribed manner as surplus. If stolen, a stolen property report has been filed with the police/sheriff’s department. ______________________________ SIGNATURE DEPT HEAD DATE
37

Appendix F – Sample Capital Asset Manager Job Description
Sample County, TN
County Capital Asset Manager Job Description and Duties
• Maintain inventory listings of all county-owned assets that exceed capitalization thresholds assets. Copies of documentation for each capitalized asset will be maintained in a separate file as long as each individual asset is actively on the books.
• Tag all assets over capitalization thresholds and input all relative information to the computer
system.
• Remove capital asset tags and retirement of assets from computer records upon proper notification of asset disposal by appropriate departments.
• Verify annual inventory of all departments to determine that assets are being properly accounted
for.
• Randomly audit annual department inventory listings to insure that departments are complying with adopted capital asset policies.
• Report to county mayor all instances of noncompliance with capital asset policies and procedures.
• Generate all reports needed to prepare external financial statements
• Work with management and external auditors on all issues concerning capital asset reporting in
order to comply with GASB Statement 34.
• Other duties as determined by county mayor.
38

APP
END
IX G
- SA
MPL
E LE
AVE
AC
CR
UA
L SP
REA
DSH
EET
FOR
SA
MPL
E C
OU
NTY
, TEN
NES
SEE
SCH
EDU
LE O
F C
OM
PEN
SATE
D A
BSE
NC
ESPR
IMA
RY
GO
VER
NM
ENT
AN
D D
ISC
RET
ELY
PRES
ENTE
D S
AM
PLE
CO
UN
TY S
CH
OO
L D
EPA
RTM
ENT
June
30,
200
6
FUN
CTI
ON
AN
D A
CTI
VITY
/ NA
ME
HO
UR
LY 6
-30-
0605
BA
LAN
CE
HO
UR
S A
DD
EDD
OLL
AR
S A
DD
EDH
OU
RS
TAK
END
OLL
AR
S TA
KEN
06 B
ALA
NC
E06
$ B
AL
PRIM
AR
Y G
OVE
RN
MEN
TG
ENER
AL
AD
MIN
ISTR
ATI
ON
Em
ploy
ee 1
12.5
2$6
35.6
049
.4$6
18.4
952
.25
$611
.94
51.2
9$6
42.1
5E
mpl
oyee
210
.55
$606
.57
82.4
2$8
69.5
393
.5$9
46.6
050
.19
$529
.50
Em
ploy
ee 3
11.8
0$9
65.2
776
.96
$908
.13
81$8
94.0
083
$979
.40
Em
ploy
ee 4
10.6
9$9
08.3
176
.96
$822
.70
133
$1,3
65.8
534
.16
$365
.17
Em
ploy
ee 5
14.3
5$1
,731
.91
76.9
6$1
,104
.38
94.6
2$1
,246
.02
110.
82$1
,590
.27
Em
ploy
ee 6
8.33
$0.0
062
.16
$517
.79
21$1
74.9
341
.16
$342
.86
Em
ploy
ee 7
11.0
4$1
,390
.60
75.1
1$8
29.2
179
.99
$796
.09
128.
96$1
,423
.72
Em
ploy
ee 8
8.33
$1,2
49.4
24.
24$3
5.32
10$4
6.23
148.
68$1
,238
.50
Em
ploy
ee 9
7.27
$823
.15
0$0
.00
0($
66.0
5)12
2.31
$889
.19
Em
ploy
ee 1
07.
54$1
,033
.00
6$4
5.24
50$3
45.9
597
.12
$732
.28
TOTA
L G
ENER
AL
AD
MIN
ISTR
ATI
ON
$9,3
43.8
451
0.21
$5,7
50.7
961
5.36
6,36
1.57
867.
69$8
,733
.06
FIN
AN
CE
Em
ploy
ee 1
526
.69
$0.0
041
.21
$1,0
99.8
90
$0.0
041
.21
$1,0
99.8
9E
mpl
oyee
16
$4,2
64.0
00
$0.0
016
0$4
,264
.00
0$0
.00
Em
ploy
ee 1
710
.66
$972
.78
82.4
2$8
78.6
014
3.41
$1,4
53.0
137
.37
$398
.36
Em
ploy
ee 1
89.
21$2
61.8
882
.42
$759
.09
69.5
$622
.82
43.2
3$3
98.1
5E
mpl
oyee
19
12.1
5$3
13.6
782
.42
$1,0
01.4
010
6.87
$1,2
89.4
42.
11$2
5.64
Em
ploy
ee 2
012
.55
$1,4
95.2
382
.42
$1,0
34.3
780
.25
$964
.24
124.
73$1
,565
.36
Em
ploy
ee 2
118
.68
$1,2
00.0
882
.42
$1,5
39.6
177
$1,4
03.3
271
.54
$1,3
36.3
7E
mpl
oyee
22
10.6
6$7
34.3
382
.42
$878
.60
54.5
$535
.62
101.
06$1
,077
.30
Em
ploy
ee 2
3$2
28.8
975
.14
$0.0
00
$228
.89
0$0
.00
Em
ploy
ee 2
48.
90$3
45.6
082
.42
$733
.54
55$4
67.1
868
.76
$611
.96
Em
ploy
ee 2
515
.34
$1,1
14.9
487
.88
$1,3
48.0
893
.5$1
,360
.68
71.8
6$1
,102
.33
Em
ploy
ee 2
68.
33$0
.00
66.5
7$5
54.5
340
.5$3
37.3
726
.07
$217
.16
Em
ploy
ee 2
713
.84
$489
.28
82.4
2$1
,140
.69
74.5
$1,0
00.6
645
.47
$629
.30
Em
ploy
ee 2
810
.35
$161
.03
79.2
5$8
20.2
489
.75
$918
.65
6.05
$62.
62
39

APP
END
IX G
- SA
MPL
E LE
AVE
AC
CR
UA
L SP
REA
DSH
EET
FOR
SA
MPL
E C
OU
NTY
, TEN
NES
SEE
SCH
EDU
LE O
F C
OM
PEN
SATE
D A
BSE
NC
ESPR
IMA
RY
GO
VER
NM
ENT
AN
D D
ISC
RET
ELY
PRES
ENTE
D S
AM
PLE
CO
UN
TY S
CH
OO
L D
EPA
RTM
ENT
June
30,
200
6
FUN
CTI
ON
AN
D A
CTI
VITY
/ NA
ME
HO
UR
LY 6
-30-
0605
BA
LAN
CE
HO
UR
S A
DD
EDD
OLL
AR
S A
DD
EDH
OU
RS
TAK
END
OLL
AR
S TA
KEN
06 B
ALA
NC
E06
$ B
AL
Em
ploy
ee 2
910
.20
$147
.51
33.0
2$3
36.8
015
$148
.53
32.9
2$3
35.7
8E
mpl
oyee
30
10.6
9$5
13.2
776
.96
$822
.70
43$4
44.8
583
.36
$891
.12
Em
ploy
ee 3
111
.80
$709
.76
76.9
6$9
08.1
310
5$1
,193
.56
35.9
6$4
24.3
3E
mpl
oyee
32
13.8
7$3
48.7
076
.96
$1,0
67.4
471
$963
.14
32.6
6$4
52.9
9E
mpl
oyee
33
10.6
9$3
07.1
476
.96
$822
.70
46.5
$478
.18
60.9
6$6
51.6
6E
mpl
oyee
34
8.33
$147
.08
44.3
8$3
69.6
960
$495
.44
2.56
$21.
32TO
TAL
FIN
AN
CE
$13,
755.
151,
394.
65$1
6,11
6.09
1,38
5.28
$18,
569.
5888
7.88
$11,
301.
67
AD
MIN
ISTR
ATI
ON
OF
JUST
ICE
Em
ploy
ee 3
513
.84
$1,4
65.0
982
.42
$1,1
40.6
948
.75
$583
.62
146.
11$2
,022
.16
Em
ploy
ee 3
69.
87$0
.00
82.4
2$8
13.4
984
.25
$597
.23
21.9
1$2
16.2
5E
mpl
oyee
37
11.7
7$1
,117
.50
82.4
2$9
70.0
845
$457
.91
138.
46$1
,629
.67
Em
ploy
ee 3
89.
55$2
1.28
82.4
2$7
87.1
156
.5$5
38.1
228
.3$2
70.2
7E
mpl
oyee
39
11.3
1$9
98.7
382
.42
$932
.17
101.
5$1
,081
.07
75.1
4$8
49.8
3E
mpl
oyee
40
7.91
$0.0
028
.53
$225
.67
0$0
.00
28.5
3$2
25.6
7E
mpl
oyee
41
11.3
8$3
11.5
882
.42
$937
.94
105
$1,1
75.1
06.
54$7
4.43
Em
ploy
ee 4
210
.20
$429
.95
82.4
2$8
40.6
811
9$1
,185
.97
8.3
$84.
66E
mpl
oyee
43
9.21
$613
.18
82.4
2$7
59.0
977
$674
.24
75.7
9$6
98.0
3E
mpl
oyee
44
12.1
5$1
,601
.03
81.8
9$9
94.9
610
7.5
$1,1
84.1
711
6.2
$1,4
11.8
3E
mpl
oyee
45
11.0
1$1
48.2
582
.42
$907
.44
88.0
7$9
52.8
69.
34$1
02.8
3E
mpl
oyee
46
8.33
$0.0
076
.08
$633
.75
35$2
91.5
541
.08
$342
.20
Em
ploy
ee 4
7$5
10.2
20
$0.0
044
.6$5
10.2
20
$0.0
0E
mpl
oyee
48
15.9
2$6
74.8
187
.88
$1,3
99.0
583
$1,2
74.6
850
.2$7
99.1
8E
mpl
oyee
49
12.9
5$4
49.4
387
.88
$1,1
38.0
58
$74.
4011
6.84
$1,5
13.0
8TO
TAL
AD
MIN
ISTR
ATI
ON
OFJ
UST
ICE
$8,3
41.0
81,
104.
04$1
2,48
0.18
1,00
3.17
$10,
581.
1686
2.74
$10,
240.
09
PUB
LIC
SA
FETY
Em
ploy
ee 5
017
.59
$2,7
42.4
00
$0.0
00
($72
.00)
160
$2,8
14.4
0E
mpl
oyee
51
$1,6
31.4
10
$0.0
014
8.58
$1,6
31.4
10
$0.0
0E
mpl
oyee
52
12.9
5$1
,917
.51
56.3
1$7
29.2
154
$574
.72
160
$2,0
72.0
0
40
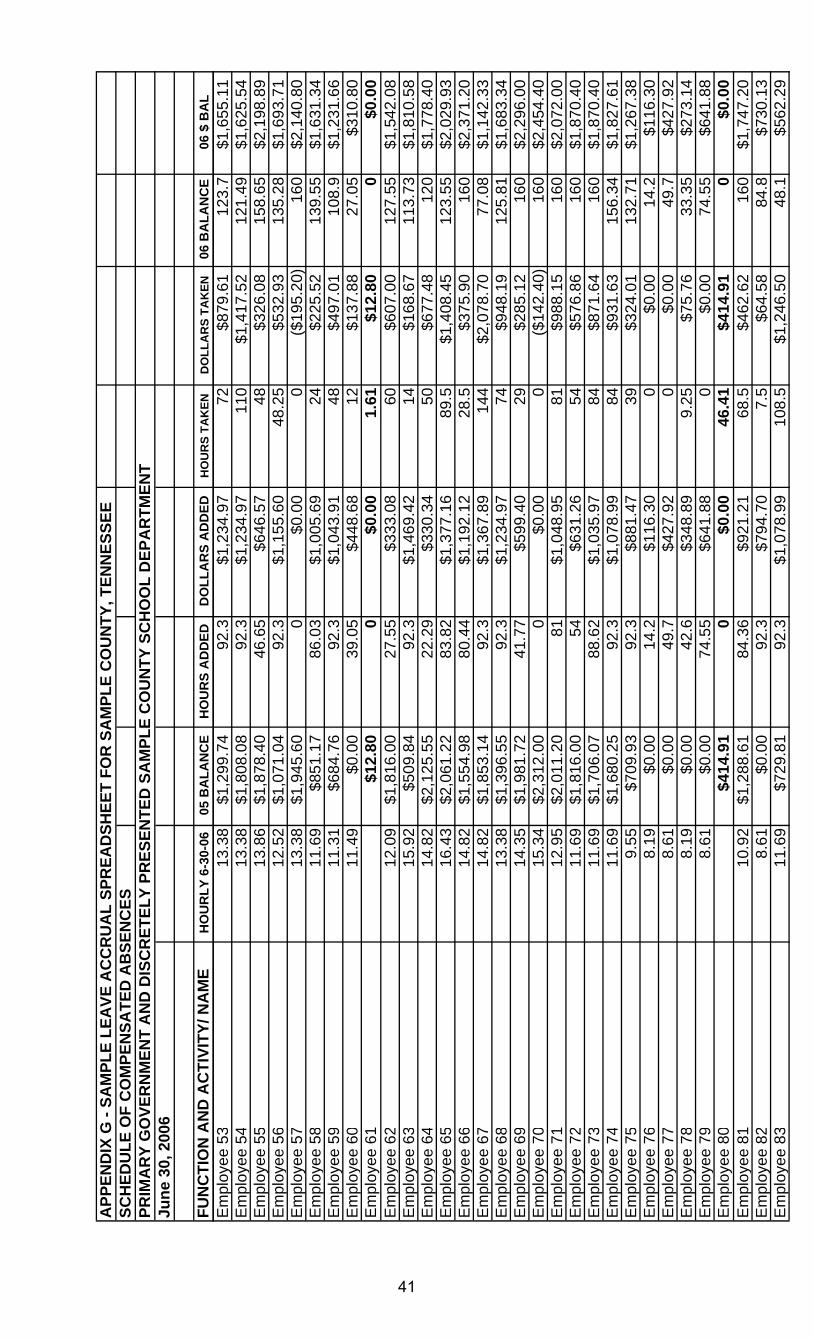
APP
END
IX G
- SA
MPL
E LE
AVE
AC
CR
UA
L SP
REA
DSH
EET
FOR
SA
MPL
E C
OU
NTY
, TEN
NES
SEE
SCH
EDU
LE O
F C
OM
PEN
SATE
D A
BSE
NC
ESPR
IMA
RY
GO
VER
NM
ENT
AN
D D
ISC
RET
ELY
PRES
ENTE
D S
AM
PLE
CO
UN
TY S
CH
OO
L D
EPA
RTM
ENT
June
30,
200
6
FUN
CTI
ON
AN
D A
CTI
VITY
/ NA
ME
HO
UR
LY 6
-30-
0605
BA
LAN
CE
HO
UR
S A
DD
EDD
OLL
AR
S A
DD
EDH
OU
RS
TAK
END
OLL
AR
S TA
KEN
06 B
ALA
NC
E06
$ B
AL
Em
ploy
ee 5
313
.38
$1,2
99.7
492
.3$1
,234
.97
72$8
79.6
112
3.7
$1,6
55.1
1E
mpl
oyee
54
13.3
8$1
,808
.08
92.3
$1,2
34.9
711
0$1
,417
.52
121.
49$1
,625
.54
Em
ploy
ee 5
513
.86
$1,8
78.4
046
.65
$646
.57
48$3
26.0
815
8.65
$2,1
98.8
9E
mpl
oyee
56
12.5
2$1
,071
.04
92.3
$1,1
55.6
048
.25
$532
.93
135.
28$1
,693
.71
Em
ploy
ee 5
713
.38
$1,9
45.6
00
$0.0
00
($19
5.20
)16
0$2
,140
.80
Em
ploy
ee 5
811
.69
$851
.17
86.0
3$1
,005
.69
24$2
25.5
213
9.55
$1,6
31.3
4E
mpl
oyee
59
11.3
1$6
84.7
692
.3$1
,043
.91
48$4
97.0
110
8.9
$1,2
31.6
6E
mpl
oyee
60
11.4
9$0
.00
39.0
5$4
48.6
812
$137
.88
27.0
5$3
10.8
0E
mpl
oyee
61
$12.
800
$0.0
01.
61$1
2.80
0$0
.00
Em
ploy
ee 6
212
.09
$1,8
16.0
027
.55
$333
.08
60$6
07.0
012
7.55
$1,5
42.0
8E
mpl
oyee
63
15.9
2$5
09.8
492
.3$1
,469
.42
14$1
68.6
711
3.73
$1,8
10.5
8E
mpl
oyee
64
14.8
2$2
,125
.55
22.2
9$3
30.3
450
$677
.48
120
$1,7
78.4
0E
mpl
oyee
65
16.4
3$2
,061
.22
83.8
2$1
,377
.16
89.5
$1,4
08.4
512
3.55
$2,0
29.9
3E
mpl
oyee
66
14.8
2$1
,554
.98
80.4
4$1
,192
.12
28.5
$375
.90
160
$2,3
71.2
0E
mpl
oyee
67
14.8
2$1
,853
.14
92.3
$1,3
67.8
914
4$2
,078
.70
77.0
8$1
,142
.33
Em
ploy
ee 6
813
.38
$1,3
96.5
592
.3$1
,234
.97
74$9
48.1
912
5.81
$1,6
83.3
4E
mpl
oyee
69
14.3
5$1
,981
.72
41.7
7$5
99.4
029
$285
.12
160
$2,2
96.0
0E
mpl
oyee
70
15.3
4$2
,312
.00
0$0
.00
0($
142.
40)
160
$2,4
54.4
0E
mpl
oyee
71
12.9
5$2
,011
.20
81$1
,048
.95
81$9
88.1
516
0$2
,072
.00
Em
ploy
ee 7
211
.69
$1,8
16.0
054
$631
.26
54$5
76.8
616
0$1
,870
.40
Em
ploy
ee 7
311
.69
$1,7
06.0
788
.62
$1,0
35.9
784
$871
.64
160
$1,8
70.4
0E
mpl
oyee
74
11.6
9$1
,680
.25
92.3
$1,0
78.9
984
$931
.63
156.
34$1
,827
.61
Em
ploy
ee 7
59.
55$7
09.9
392
.3$8
81.4
739
$324
.01
132.
71$1
,267
.38
Em
ploy
ee 7
68.
19$0
.00
14.2
$116
.30
0$0
.00
14.2
$116
.30
Em
ploy
ee 7
78.
61$0
.00
49.7
$427
.92
0$0
.00
49.7
$427
.92
Em
ploy
ee 7
88.
19$0
.00
42.6
$348
.89
9.25
$75.
7633
.35
$273
.14
Em
ploy
ee 7
98.
61$0
.00
74.5
5$6
41.8
80
$0.0
074
.55
$641
.88
Em
ploy
ee 8
0$4
14.9
10
$0.0
046
.41
$414
.91
0$0
.00
Em
ploy
ee 8
110
.92
$1,2
88.6
184
.36
$921
.21
68.5
$462
.62
160
$1,7
47.2
0E
mpl
oyee
82
8.61
$0.0
092
.3$7
94.7
07.
5$6
4.58
84.8
$730
.13
Em
ploy
ee 8
311
.69
$729
.81
92.3
$1,0
78.9
910
8.5
$1,2
46.5
048
.1$5
62.2
9
41

APP
END
IX G
- SA
MPL
E LE
AVE
AC
CR
UA
L SP
REA
DSH
EET
FOR
SA
MPL
E C
OU
NTY
, TEN
NES
SEE
SCH
EDU
LE O
F C
OM
PEN
SATE
D A
BSE
NC
ESPR
IMA
RY
GO
VER
NM
ENT
AN
D D
ISC
RET
ELY
PRES
ENTE
D S
AM
PLE
CO
UN
TY S
CH
OO
L D
EPA
RTM
ENT
June
30,
200
6
FUN
CTI
ON
AN
D A
CTI
VITY
/ NA
ME
HO
UR
LY 6
-30-
0605
BA
LAN
CE
HO
UR
S A
DD
EDD
OLL
AR
S A
DD
EDH
OU
RS
TAK
END
OLL
AR
S TA
KEN
06 B
ALA
NC
E06
$ B
AL
Em
ploy
ee 8
411
.69
$423
.94
92.3
$1,0
78.9
974
.5$8
43.4
956
.41
$659
.43
Em
ploy
ee 8
58.
75$0
.00
17.7
5$1
55.3
10
$0.0
017
.75
$155
.31
Em
ploy
ee 8
610
.55
$1,5
84.0
053
.55
$564
.95
74$6
76.7
013
9.55
$1,4
72.2
5E
mpl
oyee
87
8.90
$0.0
071
$631
.90
28.4
5$2
53.2
142
.55
$378
.70
Em
ploy
ee 8
89.
55$4
92.0
692
.3$8
81.4
784
$768
.63
63.3
4$6
04.9
0E
mpl
oyee
89
10.2
0$2
89.6
092
.3$9
41.4
677
.5$7
71.7
645
.03
$459
.31
Em
ploy
ee 9
011
.06
$1,0
70.1
887
.88
$971
.95
67.5
$676
.44
123.
48$1
,365
.69
Em
ploy
ee 9
18.
61$0
.00
67.4
5$5
80.7
412
$103
.32
55.4
5$4
77.4
2E
mpl
oyee
92
10.5
5$1
,435
.55
80.6
1$8
50.4
473
$726
.69
147.
8$1
,559
.29
Em
ploy
ee 9
310
.55
$627
.76
92.3
$973
.77
77$7
71.1
378
.71
$830
.39
Em
ploy
ee 9
48.
19$0
.00
7.1
$58.
150
$0.0
07.
1$5
8.15
Em
ploy
ee 9
5$1
41.1
90
$0.0
017
.76
$141
.19
0$0
.00
Em
ploy
ee 9
69.
55$4
74.8
092
.3$8
81.4
748
$426
.00
97.4
1$9
30.2
7E
mpl
oyee
97
8.19
$0.0
014
.2$1
16.3
00
$0.0
014
.2$1
16.3
0E
mpl
oyee
98
8.61
$0.0
081
.65
$703
.01
24$2
06.6
457
.65
$496
.37
Em
ploy
ee 9
9$8
9.84
0$0
.00
11.3
$89.
840
$0.0
0E
mpl
oyee
100
8.90
$459
.05
92.3
$821
.47
31$2
46.2
511
6.21
$1,0
34.2
7E
mpl
oyee
101
8.90
$30.
8592
.3$8
21.4
726
$229
.41
69.9
9$6
22.9
1E
mpl
oyee
102
$414
.55
0$0
.00
47.9
8$4
14.5
50
$0.0
0E
mpl
oyee
103
$64.
160
$0.0
08.
07$6
4.16
0$0
.00
Em
ploy
ee 1
04$4
01.1
10
$0.0
047
.98
$401
.11
0$0
.00
Em
ploy
ee 1
0510
.55
$818
.18
92.3
$973
.77
120
$1,2
41.2
352
.2$5
50.7
1E
mpl
oyee
106
9.55
$601
.22
92.3
$881
.47
49$4
26.9
311
0.55
$1,0
55.7
5E
mpl
oyee
107
10.5
5$1
,619
.35
77.8
2$8
21.0
080
$788
.22
156.
6$1
,652
.13
Em
ploy
ee 1
0810
.55
$1,5
91.0
987
.27
$920
.70
108
$1,0
91.2
313
4.65
$1,4
20.5
6E
mpl
oyee
109
11.6
9$1
,477
.25
92.3
$1,0
78.9
913
8.75
$1,5
26.4
688
.09
$1,0
29.7
7E
mpl
oyee
110
9.21
$122
.00
92.3
$850
.08
64.5
$586
.00
41.9
2$3
86.0
8E
mpl
oyee
111
11.6
9$1
,261
.49
91.2
6$1
,066
.83
48$4
79.5
515
8.15
$1,8
48.7
7E
mpl
oyee
112
13.8
6$1
,175
.30
92.3
$1,2
79.2
848
$357
.00
151.
34$2
,097
.57
Em
ploy
ee 1
13$4
92.1
30
$0.0
056
.96
$492
.13
0$0
.00
42

APP
END
IX G
- SA
MPL
E LE
AVE
AC
CR
UA
L SP
REA
DSH
EET
FOR
SA
MPL
E C
OU
NTY
, TEN
NES
SEE
SCH
EDU
LE O
F C
OM
PEN
SATE
D A
BSE
NC
ESPR
IMA
RY
GO
VER
NM
ENT
AN
D D
ISC
RET
ELY
PRES
ENTE
D S
AM
PLE
CO
UN
TY S
CH
OO
L D
EPA
RTM
ENT
June
30,
200
6
FUN
CTI
ON
AN
D A
CTI
VITY
/ NA
ME
HO
UR
LY 6
-30-
0605
BA
LAN
CE
HO
UR
S A
DD
EDD
OLL
AR
S A
DD
EDH
OU
RS
TAK
END
OLL
AR
S TA
KEN
06 B
ALA
NC
E06
$ B
AL
Em
ploy
ee 1
14$4
50.4
00
$0.0
052
.13
$450
.40
0$0
.00
Em
ploy
ee 1
15$5
49.0
70
$0.0
063
.55
$549
.07
0$0
.00
Em
ploy
ee 1
1616
.86
$2,7
73.9
916
.3$2
74.8
216
$294
.22
163.
38$2
,754
.59
Em
ploy
ee 1
1712
.52
$1,9
84.6
88.
25$1
03.2
98.
25$4
2.46
163.
38$2
,045
.52
TOTA
L PU
BLI
C S
AFE
TY$6
4,72
5.46
3,85
7.93
$43,
693.
563,
320.
78$3
4,46
7.48
6,04
8.98
$73,
951.
53
PUB
LIC
HEA
LTH
AN
D W
ELFA
RE
Em
ploy
ee 1
1812
.52
$1,4
27.7
182
.42
$1,0
31.9
072
.7$8
67.9
412
7.13
$1,5
91.6
7E
mpl
oyee
119
52.0
0$3
,074
.50
39.5
8$2
,058
.16
32$1
,541
.02
69.0
7$3
,591
.64
Em
ploy
ee 1
2013
.38
$419
.19
43.9
4$5
87.9
224
$389
.89
46.1
3$6
17.2
2E
mpl
oyee
121
14.8
2$8
30.0
982
.42
$1,2
21.4
614
2.01
$2,0
51.5
50
$0.0
0E
mpl
oyee
122
11.3
1$9
66.0
882
.42
$932
.17
78.2
$819
.73
95.3
6$1
,078
.52
Em
ploy
ee 1
2311
.31
$58.
2082
.42
$932
.17
61.7
5$6
91.2
326
.45
$299
.15
Em
ploy
ee 1
2417
.77
$141
.48
82.4
2$1
,464
.60
73.2
1$1
,281
.24
18.2
8$3
24.8
4E
mpl
oyee
125
14.8
2$0
.00
82.4
2$1
,221
.46
77.4
5$9
41.0
718
.92
$280
.39
TOTA
L PU
BLI
C H
EALT
H A
ND
WEL
FAR
E$6
,917
.25
578.
04$9
,449
.85
561.
32$8
,583
.67
401.
34$7
,783
.43
SOC
IAL
CU
LTU
RA
L A
ND
REC
REA
TIO
NA
L
AG
RIC
ULT
UR
E &
NA
TUR
AL
RES
OU
RC
ESE
mpl
oyee
126
10.2
0$9
57.3
376
.96
$784
.99
77$7
56.3
996
.66
$985
.93
TOTA
L A
GR
ICU
LTU
RE
$957
.33
76.9
6$7
84.9
977
.00
$756
.39
96.6
6$9
85.9
3
OTH
ER G
ENER
AL
GO
VER
NM
ENT
HIG
HW
AY
DEP
AR
TMEN
T
TOTA
L PR
IMA
RY
GO
VER
NM
ENT
$104
,040
.11
7,52
1.83
$88,
275.
456,
962.
91$7
9,31
9.85
9,16
5.29
$112
,995
.71
43

APP
END
IX G
- SA
MPL
E LE
AVE
AC
CR
UA
L SP
REA
DSH
EET
FOR
SA
MPL
E C
OU
NTY
, TEN
NES
SEE
SCH
EDU
LE O
F C
OM
PEN
SATE
D A
BSE
NC
ESPR
IMA
RY
GO
VER
NM
ENT
AN
D D
ISC
RET
ELY
PRES
ENTE
D S
AM
PLE
CO
UN
TY S
CH
OO
L D
EPA
RTM
ENT
June
30,
200
6
FUN
CTI
ON
AN
D A
CTI
VITY
/ NA
ME
HO
UR
LY 6
-30-
0605
BA
LAN
CE
HO
UR
S A
DD
EDD
OLL
AR
S A
DD
EDH
OU
RS
TAK
END
OLL
AR
S TA
KEN
06 B
ALA
NC
E06
$ B
AL
SAM
PLE
CO
UN
TY S
CH
OO
L D
EPA
RTM
ENT
INST
RU
CTI
ON
SUPP
OR
T SE
RVI
CES
Em
ploy
ee 1
2713
1.04
$1,9
65.8
012
.96
$1,6
98.2
819
$2,3
69.4
09.
88$1
,294
.68
Em
ploy
ee 1
2893
.75
$1,5
24.6
612
.96
$1,2
15.0
09
$782
.16
20.8
8$1
,957
.50
Em
ploy
ee 1
2910
1.44
$1,5
52.5
212
.96
$1,3
14.6
626
$2,5
75.0
32.
88$2
92.1
5E
mpl
oyee
130
66.5
7$7
30.6
512
.96
$862
.75
5$3
03.2
719
.38
$1,2
90.1
3E
mpl
oyee
131
72.6
6$1
,652
.52
12.9
6$9
41.6
713
.5$9
31.7
322
.88
$1,6
62.4
6E
mpl
oyee
132
72.6
6$0
.00
12.9
6$9
41.6
711
$5.8
112
.88
$935
.86
Em
ploy
ee 1
3385
.72
$0.0
06.
48$5
55.4
71
$85.
725.
48$4
69.7
5E
mpl
oyee
134
101.
75$3
45.7
713
$1,3
22.7
57
$701
.89
9.5
$966
.63
Em
ploy
ee 1
3578
.67
$840
.18
13$1
,022
.71
32$2
,492
.25
-8($
629.
36)
Em
ploy
ee 1
3610
6.87
$2,3
86.4
813
$1,3
89.3
19
$890
.30
27$2
,885
.49
Em
ploy
ee 1
3786
.70
$1,5
00.1
213
$1,1
27.1
013
$1,0
66.6
218
$1,5
60.6
0E
mpl
oyee
138
65.2
9$2
96.4
113
$848
.77
12.5
$779
.56
5.6
$365
.62
Em
ploy
ee 1
3960
.45
$267
.24
13$7
85.8
58
$442
.55
10.1
$610
.55
Em
ploy
ee 1
4065
.76
$1,0
21.4
413
$854
.88
2$1
00.8
027
$1,7
75.5
2E
mpl
oyee
141
54.6
4$6
39.2
813
$710
.32
4$1
91.2
321
.2$1
,158
.37
Em
ploy
ee 1
4254
.00
$0.0
013
$702
.00
0$0
.00
13$7
02.0
0E
mpl
oyee
143
62.4
8$1
,682
.24
6$3
74.8
86
$307
.68
28$1
,749
.44
Em
ploy
ee 1
4460
.72
$1,4
04.5
25.
5$3
33.9
627
.05
$1,4
53.1
04.
7$2
85.3
8E
mpl
oyee
145
64.3
2$1
,151
.71
13$8
36.1
615
$920
.16
16.6
$1,0
67.7
1E
mpl
oyee
146
54.0
0$0
.00
11$5
94.0
01
$54.
0010
$540
.00
Em
ploy
ee 1
4758
.96
$1,1
98.4
813
$766
.48
20$1
,133
.62
14.1
$831
.34
Em
ploy
ee 1
48$9
01.6
80
$0.0
017
$901
.68
0$0
.00
Em
ploy
ee 1
4 9$2
41.3
30
$0.0
04.
55$2
41.3
30
$0.0
0E
mpl
oyee
150
54.6
4$7
65.0
413
$710
.32
5.75
$281
.48
21.8
5$1
,193
.88
Em
ploy
ee 1
5156
.80
$1,5
27.6
81
$56.
801
($5.
92)
28$1
,590
.40
44

APP
END
IX G
- SA
MPL
E LE
AVE
AC
CR
UA
L SP
REA
DSH
EET
FOR
SA
MPL
E C
OU
NTY
, TEN
NES
SEE
SCH
EDU
LE O
F C
OM
PEN
SATE
D A
BSE
NC
ESPR
IMA
RY
GO
VER
NM
ENT
AN
D D
ISC
RET
ELY
PRES
ENTE
D S
AM
PLE
CO
UN
TY S
CH
OO
L D
EPA
RTM
ENT
June
30,
200
6
FUN
CTI
ON
AN
D A
CTI
VITY
/ NA
ME
HO
UR
LY 6
-30-
0605
BA
LAN
CE
HO
UR
S A
DD
EDD
OLL
AR
S A
DD
EDH
OU
RS
TAK
END
OLL
AR
S TA
KEN
06 B
ALA
NC
E06
$ B
AL
Em
ploy
ee 1
5254
.00
$0.0
01.
1$5
9.40
0$0
.00
1.1
$59.
40E
mpl
oyee
153
31.5
6$4
10.2
313
$410
.28
20.1
5$6
19.1
66.
38$2
01.3
5E
mpl
oyee
154
54.6
4$1
90.7
413
$710
.32
15.3
2$8
28.9
31.
32$7
2.12
Em
ploy
ee 1
5554
.64
$34.
0613
$710
.32
11$5
99.5
82.
65$1
44.8
0E
mpl
oyee
156
54.0
0$0
.00
1.1
$59.
400
$0.0
01.
1$5
9.40
Em
ploy
ee 1
5765
.76
$986
.97
13$8
54.8
817
.13
$1,0
96.7
911
.33
$745
.06
Em
ploy
ee 1
5854
.00
$0.0
04.
4$2
37.6
00
$0.0
04.
4$2
37.6
0E
mpl
oyee
159
55.2
0$1
88.2
912
.1$6
67.9
28
$433
.93
7.65
$422
.28
Em
ploy
ee 1
60($
30.0
1)4.
05$0
.00
4.05
($30
.01)
0$0
.00
Em
ploy
ee 1
6154
.00
$0.0
06.
6$3
56.4
03
$162
.00
3.6
$194
.40
Em
ploy
ee 1
6257
.44
$876
.41
13$7
46.7
212
$652
.39
16.9
$970
.74
Em
ploy
ee 1
6354
.64
$165
.06
13$7
10.3
215
$812
.54
1.15
$62.
84E
mpl
oyee
164
54.0
0$0
.00
11$5
94.0
05.
5$2
97.0
05.
5$2
97.0
0E
mpl
oyee
165
58.9
6$6
30.4
813
$766
.48
18$1
,037
.30
6.1
$359
.66
Em
ploy
ee 1
6654
.64
$602
.60
13$7
10.3
211
$575
.28
13.5
$737
.64
TOTA
L SU
PPO
RT
SER
VIC
ES$2
7,65
0.57
408.
09$2
7,56
0.15
409.
50$2
6,09
0.36
423.
59$2
9,12
0.37
OPE
RA
TIO
N O
F N
ON
-INST
RU
CTI
ON
AL
SER
VIC
ES
TOTA
L SC
HO
OL
DEP
AR
TMEN
T$2
7,65
0.57
408.
09$2
7,56
0.15
409.
50$2
6,09
0.36
423.
59$2
9,12
0.37
TOTA
L PR
IMA
RY
GO
VER
NM
ENT
AN
D S
CH
OO
L D
EPA
RTM
ENT
$131
,690
.68
7,92
9.92
$115
,835
.61
7,37
2.41
$105
,410
.21
9,58
8.88
$142
,116
.08
CO
MPE
NSA
TED
BA
LAN
CES
EXP
ECTE
D T
O B
E PA
ID O
UT
2005
DR
UG
TA
SK F
OR
CE
Em
ploy
ee 1
6720
.30
$3,3
78.8
882
.46
$1,6
73.9
484
$1,5
35.6
417
3.26
$3,5
17.1
8E
mpl
oyee
168
10.4
0$4
6.06
91.2
6$9
49.1
096
$997
.03
-0.1
8($
1.87
)TO
TAL
DR
UG
TA
SK F
OR
CE
$3,4
24.9
417
3.72
$2,6
23.0
418
0.00
$2,5
32.6
817
3.08
$3,5
15.3
1
45
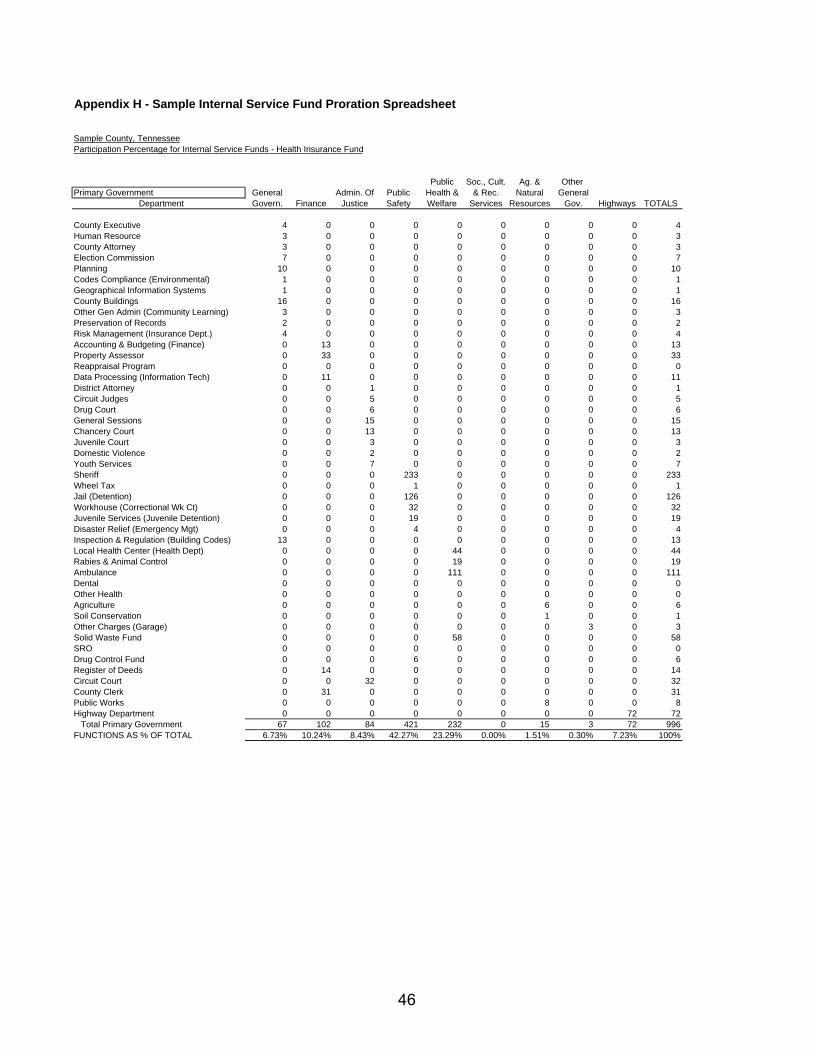
Appendix H - Sample Internal Service Fund Proration Spreadsheet
Sample County, TennesseeParticipation Percentage for Internal Service Funds - Health Insurance Fund
Public Soc., Cult. Ag. & Other Primary Government General Admin. Of Public Health & & Rec. Natural General
Department Govern. Finance Justice Safety Welfare Services Resources Gov. Highways TOTALS
County Executive 4 0 0 0 0 0 0 0 0 4Human Resource 3 0 0 0 0 0 0 0 0 3County Attorney 3 0 0 0 0 0 0 0 0 3Election Commission 7 0 0 0 0 0 0 0 0 7Planning 10 0 0 0 0 0 0 0 0 10Codes Compliance (Environmental) 1 0 0 0 0 0 0 0 0 1Geographical Information Systems 1 0 0 0 0 0 0 0 0 1County Buildings 16 0 0 0 0 0 0 0 0 16Other Gen Admin (Community Learning) 3 0 0 0 0 0 0 0 0 3Preservation of Records 2 0 0 0 0 0 0 0 0 2Risk Management (Insurance Dept.) 4 0 0 0 0 0 0 0 0 4Accounting & Budgeting (Finance) 0 13 0 0 0 0 0 0 0 13Property Assessor 0 33 0 0 0 0 0 0 0 33Reappraisal Program 0 0 0 0 0 0 0 0 0 0Data Processing (Information Tech) 0 11 0 0 0 0 0 0 0 11District Attorney 0 0 1 0 0 0 0 0 0 1Circuit Judges 0 0 5 0 0 0 0 0 0 5Drug Court 0 0 6 0 0 0 0 0 0 6General Sessions 0 0 15 0 0 0 0 0 0 15Chancery Court 0 0 13 0 0 0 0 0 0 13Juvenile Court 0 0 3 0 0 0 0 0 0 3Domestic Violence 0 0 2 0 0 0 0 0 0 2Youth Services 0 0 7 0 0 0 0 0 0 7Sheriff 0 0 0 233 0 0 0 0 0 233Wheel Tax 0 0 0 1 0 0 0 0 0 1Jail (Detention) 0 0 0 126 0 0 0 0 0 126Workhouse (Correctional Wk Ct) 0 0 0 32 0 0 0 0 0 32Juvenile Services (Juvenile Detention) 0 0 0 19 0 0 0 0 0 19Disaster Relief (Emergency Mgt) 0 0 0 4 0 0 0 0 0 4Inspection & Regulation (Building Codes) 13 0 0 0 0 0 0 0 0 13Local Health Center (Health Dept) 0 0 0 0 44 0 0 0 0 44Rabies & Animal Control 0 0 0 0 19 0 0 0 0 19Ambulance 0 0 0 0 111 0 0 0 0 111Dental 0 0 0 0 0 0 0 0 0 0Other Health 0 0 0 0 0 0 0 0 0 0Agriculture 0 0 0 0 0 0 6 0 0 6Soil Conservation 0 0 0 0 0 0 1 0 0 1Other Charges (Garage) 0 0 0 0 0 0 0 3 0 3Solid Waste Fund 0 0 0 0 58 0 0 0 0 58SRO 0 0 0 0 0 0 0 0 0 0Drug Control Fund 0 0 0 6 0 0 0 0 0 6Register of Deeds 0 14 0 0 0 0 0 0 0 14Circuit Court 0 0 32 0 0 0 0 0 0 32County Clerk 0 31 0 0 0 0 0 0 0 31Public Works 0 0 0 0 0 0 8 0 0 8Highway Department 0 0 0 0 0 0 0 0 72 72 Total Primary Government 67 102 84 421 232 0 15 3 72 996FUNCTIONS AS % OF TOTAL 6.73% 10.24% 8.43% 42.27% 23.29% 0.00% 1.51% 0.30% 7.23% 100%
46

App
endi
x I -
Sam
ple
Gai
n/Lo
ss o
n D
ispo
sal o
f Ass
ets
Spre
adsh
eet
Sam
ple
Cou
nty,
Ten
ness
eeC
apita
l Ass
ets
Gai
n or
Los
s on
Dis
posa
l of A
sset
s7-
1-06
thro
ugh
6-30
-07
Ass
et B
ook
Gai
n or
Rea
son
Ass
et
Acc
umul
ated
Val
ue a
tP
roce
eds
(Los
s) o
n A
sset
D
ate
Dat
e of
For
Orig
inal
Dep
reci
atio
nD
ate
of
From
Dis
posa
lA
sset
#Fu
nctio
nD
escr
iptio
nA
cqui
red
Dis
posa
lD
ispo
sal
Cos
tat
Dis
posa
lD
ispo
sal
Dis
posa
lof
Ass
ets
Bus
93
7271
0S
choo
l Bus
7/1/
1992
10/3
1/20
06O
ld40
,000
.00
(40,
000.
00)
0.00
1,00
0.00
1,00
0.00
Bus
55
7271
0S
choo
l Bus
7/1/
1992
10/3
1/20
06O
ld40
,000
.00
(40,
000.
00)
0.00
1,50
0.00
1,50
0.00
281
7271
0P
ick-
up T
ruck
1/1/
2004
12/3
1/20
06W
reck
ed20
,000
.00
(8,0
00.0
0)12
,000
.00
0.00
(12,
000.
00)
587
7310
0La
rge
Ove
n2/
1/19
763/
1/20
07B
roke
n12
,000
.00
(12,
000.
00)
0.00
0.00
0.00
0.00
0.00
0.00
0.00
0.00
0.00
0.00
0.00
0.00
0.00
0.00
0.00
0.00
0.00
0.00
0.00
0.00
0.00
0.00
0.00
0.00
0.00
0.00
0.00
0.00
Tota
ls11
2,00
0.00
(100
,000
.00)
12,0
00.0
02,
500.
00(9
,500
.00)
47

48
The University of Tennessee does not discriminate on the basis of race, sex, color, religion, national origin, age, disability, or veteran status in provision of educational programs and services or employment opportunities and benefits. This policy extends to both employment by and admission to the University.
The university does not discriminate on the basis of race, sex, or disability in its education programs and activities pursuant to the requirements of Title VI of the Civil Rights Act of 1964, Title IX of the Education Amendments of 1972, Section 504 of the Rehabilitation Act of 1973, and the Americans with Disabilities Act (ADA) of 1990.
Inquiries and charges of violation concerning Title VI, Title IX, Section 504, ADA or the Age Discrimination in Employment Act (ADEA) or any of the other above referenced policies should be directed to the Office of Equity and Diversity (OED), 1840 Melrose Avenue, Knoxville, TN 37996-3560, telephone (865) 974-2498 (V/TTY available) or 974-2440. Requests for accommodation of a disability should be directed to the ADA Coordinator at the UTK Office of Human Resources, 600 Henley Street, Knoxville, TN 37996-4125.
CTAS0271 300 05-07 • E15-1591-000-012-07