gas prices, fuel efficiency and endogenous product ... prices, fuel efficiency and endogenous...
TRANSCRIPT

Gas Prices, Fuel Efficiency and EndogenousProduct Selection in the U.S. Automobile Industry
Jacob Gramlich
Georgetown UniversityMcDonough School of Business
November 19, 2009
Jacob Gramlich (Georgetown) Endogenous Fuel Efficiency Choice November 19, 2009

Goals
1 Model auto manufacturers’ choices of fuel efficiency (mpg)
2 Use model to predict market equilibrium in counterfactualscenarios
I Gas prices increasesI Gasoline taxes
Jacob Gramlich (Georgetown) Endogenous Fuel Efficiency Choice November 19, 2009
Why?
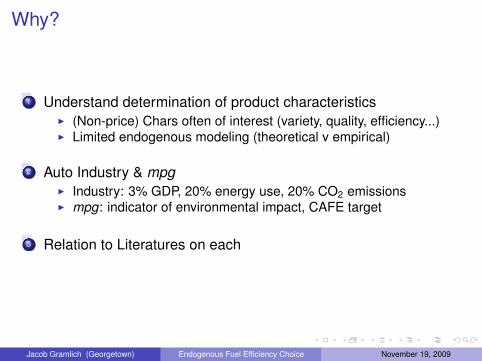
1 Understand determination of product characteristicsI (Non-price) Chars often of interest (variety, quality, efficiency...)I Limited endogenous modeling (theoretical v empirical)
2 Auto Industry & mpgI Industry: 3% GDP, 20% energy use, 20% CO2 emissionsI mpg: indicator of environmental impact, CAFE target
3 Relation to Literatures on each
Jacob Gramlich (Georgetown) Endogenous Fuel Efficiency Choice November 19, 2009

Overview
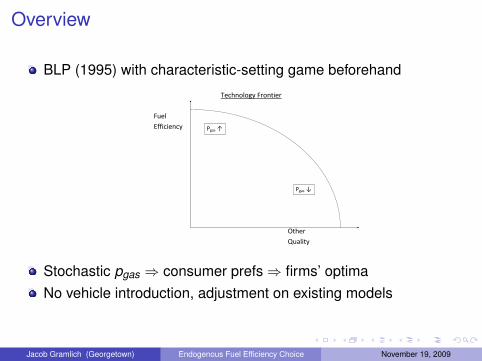
BLP (1995) with characteristic-setting game beforehand
Technology Frontier
Fuel
Efficiency
Other
Quality
Pgas ↑
Pgas ↓
Stochastic pgas ⇒ consumer prefs⇒ firms’ optimaNo vehicle introduction, adjustment on existing models
Jacob Gramlich (Georgetown) Endogenous Fuel Efficiency Choice November 19, 2009
Overview
BLP (1995) with characteristic-setting game beforehand
Technology Frontier
Fuel
Efficiency
Other
Quality
Pgas ↑
Pgas ↓
Stochastic pgas ⇒ consumer prefs⇒ firms’ optimaNo vehicle introduction, adjustment on existing models
Jacob Gramlich (Georgetown) Endogenous Fuel Efficiency Choice November 19, 2009

Preview of Results
1 Modeling1 Model product selection - find exogenous shifters2 Less restrictive ID assumptions - allow corr(mpg, ξ)3 Realistic utility estimates - unobservable quality in mpg
2 Counterfactuals - predict mpg equilibrium at any (after-tax) pgas1 Summer 2008 ($3.43): reasonable fit?2 “CAFE-equivalent" gas price: $4.55
Jacob Gramlich (Georgetown) Endogenous Fuel Efficiency Choice November 19, 2009

Model: Demand
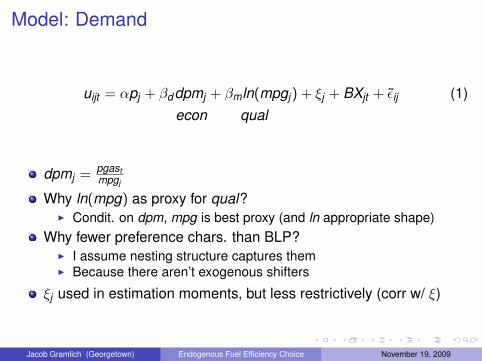
uijt = αpj + βddpmj + βmln(mpgj) + ξj + BXjt + ε̃ij (1)econ qual
dpmj = pgastmpgj
Why ln(mpg) as proxy for qual?I Condit. on dpm, mpg is best proxy (and ln appropriate shape)
Why fewer preference chars. than BLP?I I assume nesting structure captures themI Because there aren’t exogenous shifters
ξj used in estimation moments, but less restrictively (corr w/ ξ)
Jacob Gramlich (Georgetown) Endogenous Fuel Efficiency Choice November 19, 2009
Model: Demand
uijt = αpj + βddpmj + βmln(mpgj) + ξj + BXjt + ε̃ij (1)econ qual
dpmj = pgastmpgj
Why ln(mpg) as proxy for qual?I Condit. on dpm, mpg is best proxy (and ln appropriate shape)
Why fewer preference chars. than BLP?I I assume nesting structure captures themI Because there aren’t exogenous shifters
ξj used in estimation moments, but less restrictively (corr w/ ξ)
Jacob Gramlich (Georgetown) Endogenous Fuel Efficiency Choice November 19, 2009

Model: Share Function
Rewriting utility:
uijt = δj + ε̃ijt (2)(3)
Share function:
sj =e
δj1−σss
Dss∗ D
1−σss1−σs
ss
Ds∗ D
1−σs1−σts
Dt∗
D1−σttDa
(4)
lnsj
so= σss ln
sj
sss+ σs ln
sss
ss+ σv ln
ss
sv+ δj (5)
Jacob Gramlich (Georgetown) Endogenous Fuel Efficiency Choice November 19, 2009
14%
Small
Household
Low
Metro Civic Sonata Accord Intrepid
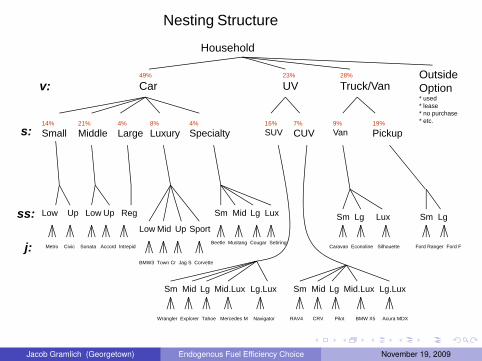
49%
Car23%
UV28%
Truck/Van
19%
Pickup21%
Middle
OutsideOption* used* lease* no purchase* etc.8%
Luxury4%
Large4%
Specialty16%SUV
9%Van
7%
CUV
Low RegUp Up
Mid SportLow Up
Mid LuxSm Lg
Mid Mid.LuxSm Lg Lg.Lux Mid Mid.LuxSm Lg Lg.Lux
BMW3 Town Cr Jag S Corvette
Beetle Mustang Cougar Sebring
Wrangler Explorer Tahoe Mercedes M Navigator RAV4 CRV Pilot BMW X5 Acura MDX
LgSm Lux
Caravan Econoline Silhouette
LgSm
Ford Ranger Ford F
v:
s:
ss:
j:
Nesting Structure
Jacob Gramlich (Georgetown) Endogenous Fuel Efficiency Choice November 19, 2009

Model: Supply
Timing of Events
Time t-1 Time t
ξt, ωt mpgt Pgas,t pt qt
Shocks Characteristic Shock Characteristic Purchases
Revealed Chosen Revealed Chosen Chosen
by nature by firms by nature by firms by csrs
Jacob Gramlich (Georgetown) Endogenous Fuel Efficiency Choice November 19, 2009

Model: FOC’s
Firm Maximization Problem
maxmpgf
Epgas
[max
pfΠf
](6)
First Order Conditions
sj +∑r∈=f
[(pr −mcr )
∂sr
∂pj+ srλ{bind}
∂mpgf
∂pj
]= 0
Epgas
∑r∈=f
[sr (
∂pr
∂mpgj− ∂mcr
∂mpgj) + (pr −mcr )
∂sr
∂mpgj+ srλ{bind}
∂mpgf
∂mpgj
] = 0
Jacob Gramlich (Georgetown) Endogenous Fuel Efficiency Choice November 19, 2009
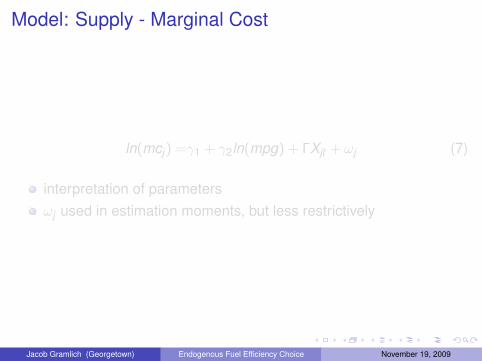
Model: Supply - Marginal Cost
ln(mcj) =γ1 + γ2ln(mpg) + ΓXjt + ωj (7)
interpretation of parametersωj used in estimation moments, but less restrictively
Jacob Gramlich (Georgetown) Endogenous Fuel Efficiency Choice November 19, 2009

Model: Supply - Marginal Cost
ln(mcj) =γ1 + γ2ln(mpg) + ΓXjt + ωj (7)
interpretation of parametersωj used in estimation moments, but less restrictively
Jacob Gramlich (Georgetown) Endogenous Fuel Efficiency Choice November 19, 2009

Model: Supply - Marginal Cost
ln(mcj) =γ1 + γ2ln(mpg) + ΓXjt + ωj (7)
interpretation of parametersωj used in estimation moments, but less restrictively
Jacob Gramlich (Georgetown) Endogenous Fuel Efficiency Choice November 19, 2009

Estimation - GMM
minθ
ξt (θ) ∗ Ht−1ωt (θ) ∗ Ht−1
Rjt (θ) ∗ It−1(θ)
Wn
ξt (θ) ∗ Ht−1ωt (θ) ∗ Ht−1
Rjt (θ) ∗ It−1(θ)
′ (8)
1 and 2 - literature adds E [ξjt ∗mpgjt ] = 03 means no systematic/predictable mis-optimization by firms
I Hansen Singleton 1982I Reduces computational burdenI Allows agnosticism on expectations of pgas
No additional assumptions, just implications of the timing
Jacob Gramlich (Georgetown) Endogenous Fuel Efficiency Choice November 19, 2009

Estimation MomentsTiming of Events
Time t‐1 Time t
Ht‐1 ξt, ωt mpgt It‐1 Pgas,t pt qt Rt
Information set Shocks Characteristic Information set Shock Characteristic Purchases Ex post regretin mpgt choice
Known Revealed Chosen Known Revealed Chosen Chosen Revealedby all by nature by firms by all by nature by firms by csrs by nature
Includes: Includes: Due to pgas,t* i d l ' * i d l '* time t models' sub‐segments
* time t models' sub‐segments
* time t models' manufacturers
* time t models' manufacturers
* pgas,t‐1 * pgas,t‐1* ξt, ωt
* mpgt
Jacob Gramlich (Georgetown) Endogenous Fuel Efficiency Choice November 19, 2009

Summary Statistics
Variable Mean Std. Dev. Min Max
Year 1992.5 11.1 1971 2007
Mpg 20.7 5.8 9.13 61
Dpm $0.10 $0.04 $0.03 $0.24
Price $30,059 $21,195 $7,038 $115,000
q 75,566 95,043 123 890,790
Price gas $2.02 $0.48 $1.31 $3.15
Price gas change $0.05 $0.24 -$0.56 $0.68
GDP Growth 3.1% 1.7% -1.9% 7.2%
N Models in Year 150.6 55.9 72 249
N Model-Years 4,820
N Years 32
N Types 3
N Segments 9
N Sub-segments 28
Note: Prices are Real 2007 Dollars
Jacob Gramlich (Georgetown) Endogenous Fuel Efficiency Choice November 19, 2009

GMM Estimation Results
Demand parameters: Cost parameters:
Variable Coeff S.E. T-stat Variable Coeff S.E. T-stat
price ($10k) α -0.33 0.02 -18.41 ln mpg γ -0.03 0.11 -0.32
ln mpg βm -0.75 0.17 -4.51 year γ 0.03 0.00 14.72
dpm Car small βd -4.70 0.66 -7.13 autonews γ 0.32 0.05 6.14
dpm Car middle βd -5.55 0.55 -10.01 asian γ 0.16 0.02 6.78
dpm Car large βd -4.68 0.65 -7.16 euro γ 0.60 0.03 21.96
dpm Car luxury βd -2.13 0.43 -4.98 Subsegment_dums ‡ γ 9.86 0.21 47.87
dpm Car specialty βd -4.02 0.44 -9.17 (range 9.02 to 10.74)
dpm CUV βd -9.07 2.95 -3.08 CAFÉ λ 347$ 3.4$ 102
dpm SUV βd -8.10 1.13 -7.20
dpm Truck βd -4.17 0.70 -5.98
dpm Van βd -3.65 0.70 -5.20
gdp gr β 2.06 0.36 5.79
gdp per cap β 0.02 0.01 1.45
cuv x year β 0.08 0.03 2.50
suv x year β 0.11 0.01 8.11
autonews datasource β 0.34 0.04 8.33
asian β -0.06 0.01 -4.52
euro β 0.14 0.03 5.30
partial year of sales β -0.57 0.02 -27.06
ln(sj|ss) † σss 0.78 0.00 388
ln(sss|s) † σs 0.92 0.00 1081
ln(ss|t) † σv 0.83 0.00 360
Subsegment_dums ‡ β 1.28 0.23 4.76
(range -4.07 to 0.56)
Notes:
† In addition to being statistically different from 0, log shares are also statistically different from 1.
They are, respectively, 108, 97, and 76 standard errors from 1.
‡ There are 31 Subsegment Dummies. Rather than report them all,
I report means of absolute values of Coeff, S.E., and T-stat.
N observations = 5,244
R2 from 2sls on demand (for starting values) is 0.95
Jacob Gramlich (Georgetown) Endogenous Fuel Efficiency Choice November 19, 2009

Estimation Results
Segment Small Middle Large Luxury Specialty CUV SUV Truck Van
Mean MPG * 31.2 28.3 20.2 20.3 22.0 22.8 16.2 17.2 18.1
20% of Mean MPG 6.2 5.7 4.0 4.1 4.4 4.6 3.2 3.4 3.6
p_gas
$4.55 1,554$ 3,457$ 4,030$ 556$ 2,380$ 7,571$ 9,964$ 4,440$ 3,413$
$3.43 720$ 2,154$ 2,586$ (33)$ 1,342$ 5,256$ 7,059$ 2,895$ 2,121$
$1.50 (718)$ (91)$ 98$ (1,047)$ (446)$ 1,265$ 2,054$ 233$ (105)$
* 2007 Sales-Weighted, Segment-Average MPG
Negative entries are due to the quality reductions required to improve MPG (within a sub-segment).
Willingness to Pay for 20% MPG increaseBy Segment and By Gas Price
Jacob Gramlich (Georgetown) Endogenous Fuel Efficiency Choice November 19, 2009

Estimation Results
1 Parameters with sensible signs and magnitudes2 CUV/SUV consumers most sensitive to mpg3 CAFE - $347 per American car since 19774 Cost parameter insignificant - as expected
Jacob Gramlich (Georgetown) Endogenous Fuel Efficiency Choice November 19, 2009

Counterfactuals
Model can calculate market equilibrium at any pgas (after-tax)1 Summer 2008 gas prices ($3.43)2 “CAFE-equivalent" after-tax gas price ($4.55)
Jacob Gramlich (Georgetown) Endogenous Fuel Efficiency Choice November 19, 2009

Counterfactuals
Table: Actual and Predicted Sales Declines, Summer 2008
Aggregation Level Actual Model PredictionCars -3% -9%Utility Vehicles -19% -23%Trucks -16% -13%Total -13% -14%
Jacob Gramlich (Georgetown) Endogenous Fuel Efficiency Choice November 19, 2009

Counterfactuals
Model Predictions for $3.43 gas
Type Segment # Models 2007 2008 2009 2007 2008 ‡ 2009 2007 2008 2009
Car 140 7,567 6,861 7,266 22.6 22.6 19.0 26.8 27.6 19.3
-9% -4% 0% -16% 3% -28%
Small 29 2,312 2,357 2,350 28.3 28.3 21.1 31.2 31.8 21.0
Middle 27 2,893 2,136 1,714 24.4 24.4 29.8 28.3 30.4 30.1
Large 14 674 479 320 19.9 19.9 24.1 20.2 20.3 23.8
Luxury 49 1,192 1,440 2,551 19.6 19.6 10.3 20.3 20.4 10.0
Specialty 21 496 451 332 21.4 21.4 18.9 22.0 22.5 18.5
UV 93 4,644 3,577 4,716 18.5 18.5 41.4 19.9 21.9 41.0
-23% 2% 0% 124% 10% 106%
CUV 54 2,636 2,320 2,058 20.6 20.6 43.2 22.8 24.7 43.4
SUV 39 2,008 1,257 2,658 15.5 15.5 39.0 16.2 16.7 39.2
Truck/Van 37 3,673 3,181 3,129 18.0 18.0 20.6 17.4 17.8 21.0
-13% -15% 0% 14% 2% 20%
Pickup 21 2,730 2,264 2,290 18.4 18.4 21.7 17.2 17.6 21.6
Van 16 943 916 839 17.6 17.6 19.1 18.1 18.4 19.2
All Vehicles 270 15,883 13,619 15,110 20.6 20.6 26.9 22.6 23.8 26.4
-14% -5% 0% 31% 5% 17%
† All percentages (shaded) are percentage changes from 2007 levels
‡ 2008 Fuel Efficiency Offerings are fixed at 2007 levels for comparability
Quantity = Sales (1000s)
MPG Offered = Raw-average MPG across models
MPG Purchased = Sales-weighted MPG
2007 - actual
2008 - predicted (before firms adjust characteristics - only consumers respond)
2009 - predicted (after firms adjustt characteristics)
For comparison, actual 2008 (Aug-YTD) Quantities were:
-3%, -19%, -16%, and -14%, for, respectively,
Cars, Utility Vehicles, Trucks/Vans, and All Vehicles.
MPG MPG
Vehicle Classification Quantity †
Offered †
Purchased †
Jacob Gramlich (Georgetown) Endogenous Fuel Efficiency Choice November 19, 2009

Counterfactuals
Model Predictions for $4.55 gas
Type Segment # Models 2007 2008 2009 2007 2008 ‡ 2009 2007 2008 2009
Car 140 7,567 5,878 6,020 22.6 22.6 25.0 26.8 28.6 25.6
-22% -20% 0% 11% 7% -5%
Small 29 2,312 2,229 1,947 28.3 28.3 27.8 31.2 33.2 27.8
Middle 27 2,893 1,252 1,420 24.4 24.4 39.6 28.3 35.0 39.9
Large 14 674 233 265 19.9 19.9 31.6 20.2 20.4 31.6
Luxury 49 1,192 1,811 2,114 19.6 19.6 13.4 20.3 20.6 13.2
Specialty 21 496 353 275 21.4 21.4 25.0 22.0 23.6 24.6
UV 93 4,644 2,348 3,907 18.5 18.5 55.1 19.9 25.8 54.4
-49% -16% 0% 198% 30% 173%
CUV 54 2,636 1,873 1,705 20.6 20.6 57.4 22.8 28.0 57.5
SUV 39 2,008 475 2,202 15.5 15.5 51.8 16.2 17.3 51.9
Truck/Van 37 3,673 2,475 2,593 18.0 18.0 27.3 17.4 18.6 27.8
-33% -29% 0% 51% 7% 59%
Pickup 21 2,730 1,622 1,897 18.4 18.4 28.7 17.2 18.5 28.7
Van 16 943 853 695 17.6 17.6 25.3 18.1 18.7 25.4
All Vehicles 270 15,883 10,701 12,520 20.6 20.6 35.7 22.6 25.7 35.0
-33% -21% 0% 73% 14% 55%
† All percentages (shaded) are percentage changes from 2007 levels
‡ 2008 Fuel Efficiency Offerings are fixed at 2007 levels for comparability
Quantity = Sales (1000s)
MPG Offered = Raw-average MPG across models
MPG Purchased = Sales-weighted MPG
2007 - actual
2008 - predicted (before firms adjust characteristics - only consumers respond)
2009 - predicted (after firms adjustt characteristics)
MPG MPG
Vehicle Classification Quantity †
Offered †
Purchased †
Jacob Gramlich (Georgetown) Endogenous Fuel Efficiency Choice November 19, 2009

Convergence
Multiple Equilibria do not appear to be a problemMultiple convergence routines find same eqbm
I New optima v. FOC derivativeI Full jumps v. partial
Ownership, nesting structure may be sufficient to pin down eqbm
Jacob Gramlich (Georgetown) Endogenous Fuel Efficiency Choice November 19, 2009

Conclusion
1 ModelI Model product choiceI Less restrictive demand IDI Realistic Fuel Efficiency preference -
Control for both economic and quality effects of mpg
2 Counterfactuals - mapping between pgas and mpg equilibriumI Summer 2008: comparison to actualsI $4.55 would induce 35 mpg
3 OtherI CAFE is costly to domestics ($347 per car)I Gas taxes would move mpg
Jacob Gramlich (Georgetown) Endogenous Fuel Efficiency Choice November 19, 2009

20
25
30
35
Yearly Characteristic ChangesToyota Celica
mpg
Weight (thous lbs.)
0
5
10
15
71 72 73 74 75 76 77 78 79 80 81 82 83 84 85 86 87 88 89 90 91 92 93 94 95 96 97 98 99 00 01 02 03 04 05
Pgas (2007 dimes)
Hp/10
Jacob Gramlich (Georgetown) Endogenous Fuel Efficiency Choice November 19, 2009

Technology Frontier 2007 U.S Vehicles
Jacob Gramlich (Georgetown) Endogenous Fuel Efficiency Choice November 19, 2009
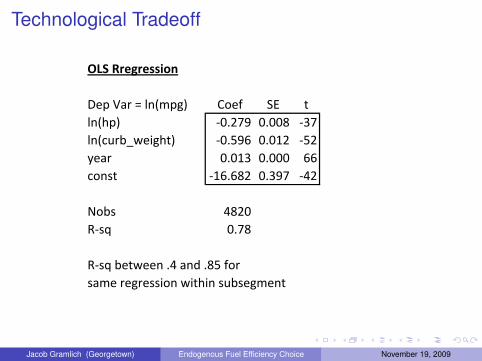
Technological Tradeoff
OLS Rregression
Dep Var = ln(mpg) Coef SE tln(hp) ‐0.279 0.008 ‐37ln(curb_weight) ‐0.596 0.012 ‐52year 0.013 0.000 66const ‐16.682 0.397 ‐42
Nobs 4820R‐sq 0.78
R‐sq between .4 and .85 forsame regression within subsegment
Jacob Gramlich (Georgetown) Endogenous Fuel Efficiency Choice November 19, 2009

Gasoline TaxesAverage Gas Taxes Per Gallon
August 2006
U.S. taxes include all State and Federal Taxes
Source: International Energy Agency (IEA), "Energy Prices and Taxes"
As reported in NYT, "Raise the Gasoline Tax?" Oct 2006
$4.24
$3.99
$3.80
$3.75
$2.07
$1.03
$0.40
$- $1.00 $2.00 $3.00 $4.00 $5.00
Britain
Germany
France
Italy
Japan
Canada
U.S.
Jacob Gramlich (Georgetown) Endogenous Fuel Efficiency Choice November 19, 2009

Estimation Results
Segment Small Middle Large Luxury Specialty CUV SUV Truck Van
Mean MPG * 31.2 28.3 20.2 20.3 22.0 22.8 16.2 17.2 18.1
20% of Mean MPG 6.2 5.7 4.0 4.1 4.4 4.6 3.2 3.4 3.6
p_gas
$4.55 3,390$ 5,293$ 5,866$ 2,392$ 4,215$ 9,407$ 11,799$ 6,276$ 5,249$
$3.43 2,556$ 3,990$ 4,422$ 1,803$ 3,178$ 7,091$ 8,895$ 4,731$ 3,957$
$1.50 1,118$ 1,745$ 1,934$ 789$ 1,390$ 3,101$ 3,890$ 2,069$ 1,730$
* 2007 Sales-Weighted, Segment-Average MPG
These WTP's:
1) hold quality constant (while improving MPG)
2) therefore do not reflect the economic model
3) are included for comparison to the previous table (which do reflect the economic model)
4) are strictly larger than their counterparts in the previous table
5) are strictly larger than 0
Without Quality Decrease:Willingness to Pay for 20% MPG increase
By Segment and By Gas Price
Jacob Gramlich (Georgetown) Endogenous Fuel Efficiency Choice November 19, 2009
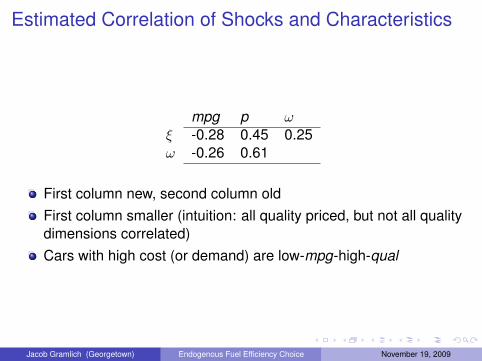
Estimated Correlation of Shocks and Characteristics
mpg p ωξ -0.28 0.45 0.25ω -0.26 0.61
First column new, second column oldFirst column smaller (intuition: all quality priced, but not all qualitydimensions correlated)Cars with high cost (or demand) are low-mpg-high-qual
Jacob Gramlich (Georgetown) Endogenous Fuel Efficiency Choice November 19, 2009

Robustness
1 Production lags of 3 and 5 years (rather than 1)2 Consumers respond to gas prices other ways (besides static
price)3 No sub-segment level in demand4 Controls on cost/demand
Jacob Gramlich (Georgetown) Endogenous Fuel Efficiency Choice November 19, 2009