gas infrastructure development in sub-saharan africa · gas infrastructure development in...
TRANSCRIPT

Source: Frost & Sullivan Source: Frost & Sullivan
Gas Infrastructure Development in Sub-Saharan Africa
- A 20 Year Horizon -

Source: Frost & Sullivan Source: Frost & Sullivan
Project Methodology and Framework
Potential Demand
Planned Infrastructure
Current Infrastructure and Demand
Gas Reserves / Resources
Product Scope
• Dry Natural Gas
• Liquefied Natural Gas (LNG)
• Liquefied Petroleum Gas (LPG)*
• Other Natural Gas Liquids (NGL)*
The project methodology utilised followed six steps:
1. Identify current gas reserves and resources 2. Identify current infrastructure and demand 3. Identify planned infrastructure 4. Identify and quantify potential demand 5. Identify potential infrastructure required 6. Identify and size the opportunity that the potential infrastructure
comprises
Opportunity Size
Potential Infrastructure

Source: Frost & Sullivan Source: Frost & Sullivan
Overview of the Gas Infrastructure opportunities in sub-Saharan Africa over the next 20 years
Sub-Saharan gas infrastructure opportunity over the next 20 years:
$ 174 billion
Regional Ranking of countries with the largest gas infrastructure opportunities: 1. Nigeria 2. Mozambique 3. Tanzania 4. Ghana 5. Cote D’Ivoire 6. South Africa Most common Gas infrastructure to be constructed over the forecast period: • Transmission and distribution
pipelines (Pipelines) • Floating and permanent regasification
units (Re-gasification) • Central processing facilities • LNG terminals • Gas-fired Power Plants
Macro-economic trends 2
• Four out of the nine countries profiled have a Gas Master plan – A comprehensive and clear plan will aid the attraction of FDI into a countries gas sector, and the direction of the FDI to particular projects.
• Political stability – Without a stable political environment the realisation of future gas infrastructure is limited and so many countries will be left with non-monetised gas resources
• There are three Current LNG terminals in sub-Saharan Africa – With the exception of Cote D’Ivoire all the countries profiled require a LNG anchor project for gas development
• Urbanisation is driving the need for increased power - Lagos, Johannesburg, Dar es-Salaam and Nairobi are areas where domestic gas demand is expected to increase significantly over the forecasted period
Key trends and challenges facing the Gas Infrastructure sector over the forecasted period
Leading LNG exporters and importers, Global, 2014
Africa is the 3rd largest exporter of LNG and does not import any LNG
1
3

Source: Frost & Sullivan Source: Frost & Sullivan
Strong economic growth in Sub Saharan Africa will need to be matched by energy investment
• City With a Minimum Population of 5 Million
• Example: Luanda, Dar es Salaam, Nairobi, Alexandria Abidjan
MEGA CITY
• Cities combining with suburbs to form regions (Population over 10 Million)
• Example: Greater Cairo, Lagos, Kinshasa
MEGA REGIONS
• Transport corridors connecting major cities or mega regions
• Example: Ibandan-Lagos-Accra Corridor, North South Corridor MEGA CORRIDORS
Economic Infrastructure Trends African Growth Expectation
South Africa
Mozambique
Egypt
Sudan
Morocco
Nigeria Ghana
Angola
DRC
Zimbabwe
Algeria Libya
Chad Niger Mali Mauritania
Uganda
Ethiopia
Namibia
Zambia
Tanzania
Kenya
Botswana
CAR
High Growth (6%+)
Medium Growth (3-6%)
Low Growth (0-3%)
Time frame: 2014 – 2019;
Source: IMF
South Sudan: 9,1% over the forecast period)
Key Takeaway: Most investment is expected not only within mega cities and regions, but also along major trade corridors.
Source: Frost & Sullivan Source: Frost & Sullivan
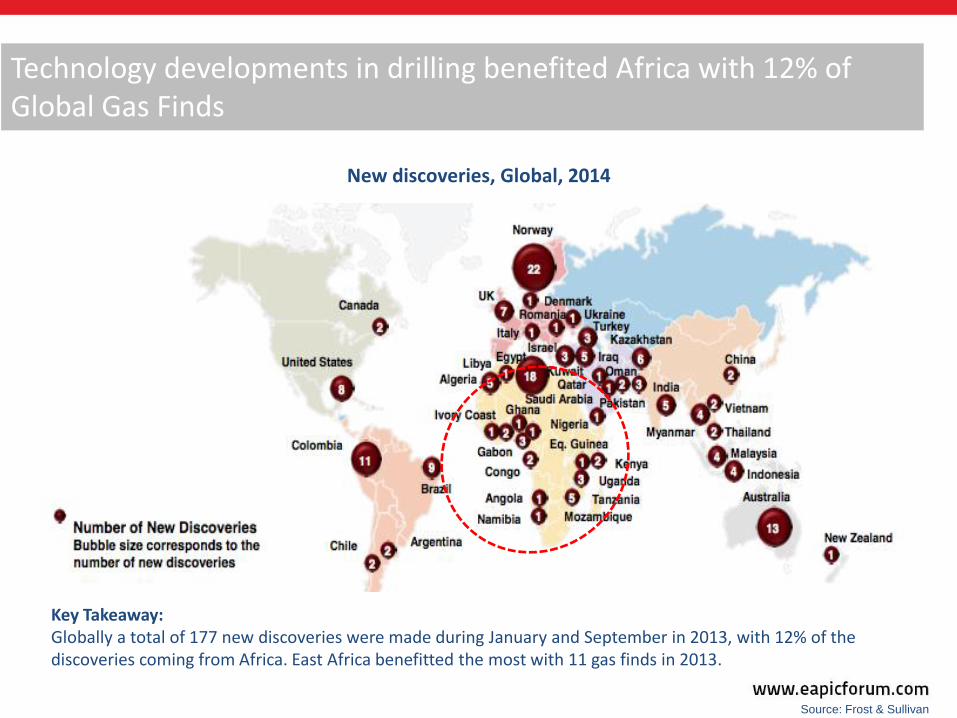
Technology developments in drilling benefited Africa with 12% of Global Gas Finds
New discoveries, Global, 2014
Key Takeaway: Globally a total of 177 new discoveries were made during January and September in 2013, with 12% of the discoveries coming from Africa. East Africa benefitted the most with 11 gas finds in 2013.

Source: Frost & Sullivan Source: Frost & Sullivan
Current gas Infrastructure is not sufficient to meet the growing gas demand in sub-Saharan Africa
Natural Gas Demand 2014-2050
Key Takeaway: Cities experiencing rapid urbanisation such as Johannesburg, Nairobi, Dar es Salam and Lagos will drive gas adoption
Source: Frost & Sullivan, Johns Hopkins

Source: Frost & Sullivan Source: Frost & Sullivan
Gas adoption is growing, coal and hydro still dominate as power sources over gas
Market Stage by Energy Source, Africa, 2014
Key Takeaway: The majority of industry and power companies still lack awareness of gas as a reliable energy source. However, in countries such as Cote D’Ivoire, gas has grown in terms of use to become the single largest energy source, while in Nigeria and Tanzania gas use is growing.
Source: Frost & Sullivan Source: Frost & Sullivan
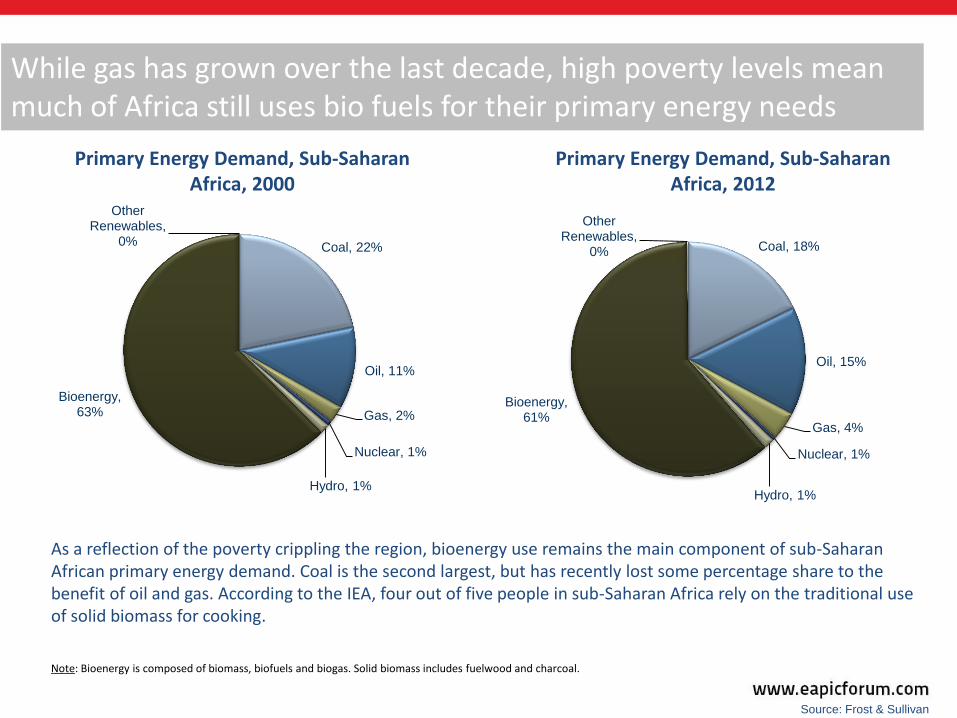
While gas has grown over the last decade, high poverty levels mean much of Africa still uses bio fuels for their primary energy needs
Coal, 22%
Oil, 11%
Gas, 2%
Nuclear, 1%
Hydro, 1%
Bioenergy, 63%
Other Renewables,
0% Coal, 18%
Oil, 15%
Gas, 4%
Nuclear, 1%
Hydro, 1%
Bioenergy, 61%
Other Renewables,
0%
Primary Energy Demand, Sub-Saharan Africa, 2000
Primary Energy Demand, Sub-Saharan Africa, 2012
As a reflection of the poverty crippling the region, bioenergy use remains the main component of sub-Saharan African primary energy demand. Coal is the second largest, but has recently lost some percentage share to the benefit of oil and gas. According to the IEA, four out of five people in sub-Saharan Africa rely on the traditional use of solid biomass for cooking.
Note: Bioenergy is composed of biomass, biofuels and biogas. Solid biomass includes fuelwood and charcoal.

Source: Frost & Sullivan Source: Frost & Sullivan
With low oil prices, focus is on projects with a clear value creation; legislation and gas utilisation plans are key to project attractiveness
Source: PWC, Ernst & Young, Deloitte, Frost & Sullivan
Key Oil and Gas Legislation, sub-Saharan Africa, 2014
Country Gas
legislation Trend
Master Plan
Royalties & Taxes
Local Content
Free Carry
Nigeria Y Y 16-20% Y 50%
Ghana Y Y 3-12% Y 10%
Cote D’Ivoire Y Y On Production N 10-20%
Angola Y N - Y -
Mozambique Y Y 6-10% Y 10-25%
Gabon Y N 6-12% Y 66-75%
Cameroon Y Y On production Y 5-25%
Tanzania Y Y (*) 12,5% N 25%
South Africa Y N (*) 0,5 – 7% Y 20%
Key
Policy certainty
Policy uncertainty
Policy waiting approval
Key Takeaway: With the exception of mature oil and gas markets such as Nigeria, Gabon and Cameroon, in order for the gas reserves in a country to be attractive and commercially realisable timeously, the country needs to have a clear gas master plan and policy in place.

Source: Frost & Sullivan Source: Frost & Sullivan
Potential infrastructure required, such as gas-to-liquid facilities & LNG plants, will support domestic gas economies
Potential Natural Gas Infrastructure, 2015 – 2035*
Lama Offshore Soyo fields
Cape Lopez
Gamba
Luanda
Tema
Temane
Secunda
Richards bay
Alexander bay
Lagos Cotonou
Rabi
Soyo
Takoradi
Beni Saf
Planned GTL facility
Planned LNG facility
Planned gas pipeline network
Gas Pipeline
Gas Pipeline (planned)
Key Takeaway: Sub-Sahara Africa plans to set-up six LNG facilities for LNG export and import of gas, 2 planned new GTL facilities and two additional LNG trains at existing LNG facilities. Four planned ring networks distributing gas within cities are also expected to be set-up, to help establish domestic gas economies for most cities.

Source: Frost & Sullivan Source: Frost & Sullivan
Six countries have been identified as providing high opportunities in the sub-Saharan African gas infrastructure industry
0.0000 0.0500 0.1000 0.1500 0.2000 0.2500 0.3000 0.3500 0.4000 0.4500
Nigeria
Mozambique
Tanzania
Ghana
Cote D’Ivoire
South Africa
Cameroon
Equ. Guinea
Angola
Gabon
Congo
Ethiopia
Namibia
Kenya
Uganda
South Sudan
Low opportunities
Medium opportunities
High opportunities
Gas Infrastructure: Opportunity Analysis - Final Score, Selected sub-Saharan African countries, 2015-2035
Source: Frost & Sullivan Source: Frost & Sullivan
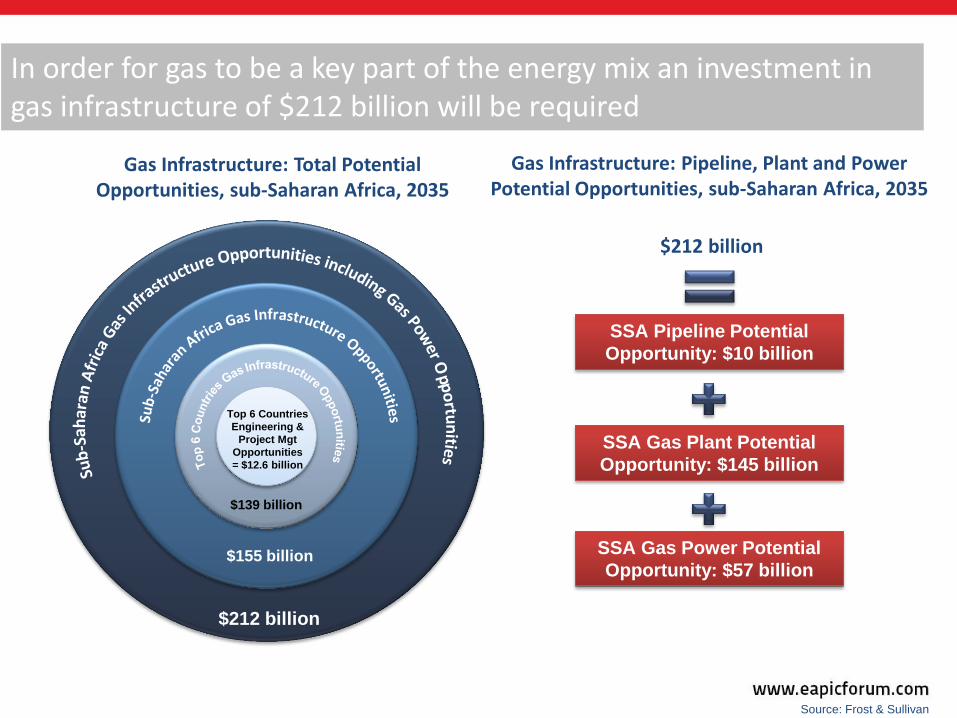
In order for gas to be a key part of the energy mix an investment in gas infrastructure of $212 billion will be required
SSA Pipeline Potential
Opportunity: $10 billion
SSA Gas Plant Potential
Opportunity: $145 billion
SSA Gas Power Potential
Opportunity: $57 billion
$212 billion
Gas Infrastructure: Pipeline, Plant and Power Potential Opportunities, sub-Saharan Africa, 2035
Gas Infrastructure: Total Potential Opportunities, sub-Saharan Africa, 2035
$212 billion
$155 billion
$139 billion
Top 6 Countries
Engineering &
Project Mgt
Opportunities
= $12.6 billion
Source: Frost & Sullivan Source: Frost & Sullivan
Thank you
Aurelia van Eeden
Business Unit Leader: Energy & Environment
+27 (0)21 680 3268
Kumbirai Kundani
Senior Analyst
+27 (0)21 680 3270