gas hydrate resources of the united · pdf filegas hydrate resources of the united states by...
TRANSCRIPT

1
GAS HYDRATE RESOURCESOF THE UNITED STATES
By Timothy S. Collett
INTRODUCTION
The 1995 National Oil and Gas Resource Assessment, conducted by the U.S. GeologicalSurvey and the Minerals Management Service, has focused on assessing theundiscovered conventional and unconventional resources of crude oil and natural gasin the United States. This assessment includes for the first time a systematic resourceappraisal of the in-place natural gas hydrate resources of the United States onshore andoffshore regions. The Minerals Management Service is historically responsible for theFederal offshore portion of the National Oil and Gas Assessment; however, following arequest from the Mineral Management Service, the U.S. Geological Survey has taken thelead on assessing the gas hydrate resources in the offshore Federal waters of the UnitedStates. This gas hydrate assessment is also unique to this study in the sense that it is theonly energy resource assessed that is reported as an in-place resource estimate withoutregards to its recoverability.
Gas hydrates are crystalline substances composed of water and gas, in which a solidwater-lattice accommodates gas molecules in a cage-like structure, or clathrate. Gashydrates are widespread in permafrost regions and beneath the sea in sediment of outercontinental margins. While methane, propane, and other gases can be included in theclathrate structure, methane hydrates appear to be the most common in nature(Kvenvolden, 1988). The amount of methane sequestered in gas hydrates is probablyenormous, but estimates of the amounts are speculative and range over three orders-of-magnitude, from about 100,000 to 270,000,000 trillion cubic feet (modified fromKvenvolden, 1993). The estimated amount of gas in the hydrate reservoirs of the worldgreatly exceeds the volume of known conventional gas reserves. The productionhistory of the Russian Messoyakha gas hydrate field demonstrates that gas hydrates arean immediate source of natural gas that can be produced by conventional methods(Makogon, 1981; Collett, 1993b).
Even though gas hydrates are known to occur in numerous arctic and marinesedimentary basins, little is known about the geologic parameters controlling theirdistribution. Most of the published gas hydrate resource estimates have, of necessity,been made by broad extrapolation of general knowledge of local geologic conditions

2
(Kvenvolden, 1993). The primary objectives of this study are to document the geologicparameters that control the occurrence of gas hydrates and to assess the volume ofnatural gas stored within the gas hydrate accumulations of the United States. Thepaper begins with a discussion of the geologic parameters that affect the stability andformation of gas hydrates, which is followed by a description of the methodology usedto assess the gas hydrate resources. This paper ends with a description of theindividual plays that were identified and assessed and a cumulative estimate of the in-place gas hydrate resources of the United States onshore and offshore regions.
GAS HYDRATE TECHNICAL REVIEW
Under appropriate conditions of temperature and pressure (fig. 1), gas hydrates usuallyform one of two basic crystal structures known as Structure I and Structure II (fig. 2).Each unit cell of Structure I gas hydrate consists of 46 water molecules that form twosmall dodecahedral voids and six large tetradecahedral voids. Structure I gas hydratescan only hold small gas molecules such as methane and ethane, with moleculardiameters not exceeding 5.2 angstroms. The unit cell of Structure II gas hydrate consistsof 16 small dodecahedral and 8 large hexakaidecahedral voids formed by 136 watermolecules. Structure II gas hydrates may contain gases with molecular dimensions inthe range of 5.9 to 6.9 angstroms, such as propane and isobutane. At conditions ofstandard temperature and pressure (STP), one volume of saturated methane hydrate(Structure I) will contain as much as 164 volumes of methane gas -- because of this largegas-storage capacity, gas hydrates are thought to represent an important source ofnatural gas.
On a macroscopic level, many of the gas hydrate mechanical properties resemble thoseof ice, because hydrates contain a minimum of 85 percent water on a molecular basis.Among the exceptions is thermal conductivity, which is relatively low in hydrates; thiscan be attributed to the molecular structural differences between ice and hydrates. Ofinterest are the phase-equilibrium properties of gas hydrates, which are mostlycontrolled by the fit of the guest gas molecules within the hydrate water cages. Forexample, the addition of propane to a pure methane hydrate changes the hydratestructure (Structure I >> Structure II) and broadens the conditions in which thehydrates can occur. For a complete description of the structure and properties ofhydrates see the summary by Sloan (1990).
Onshore gas hydrates are known to be present in the West Siberian Basin (Makogonand others, 1972) and are believed to occur in other permafrost areas of northern Russia,

3
including the Timan-Pechora province, the eastern Siberian Craton, and thenortheastern Siberia and Kamchatka areas (Cherskiy and others, 1985). Permafrost-associated gas hydrates are also present in the North American Arctic. Direct evidencefor gas hydrates on the North Slope of Alaska comes from a core-test, and indirectevidence comes from drilling and open-hole industry well logs which suggest thepresence of numerous gas hydrate layers in the area of the Prudhoe Bay and KuparukRiver oil fields (Collett, 1983; Collett, 1993a). Well-log responses attributed to thepresence of gas hydrates have been obtained in about one-fifth of the wells drilled in theMackenzie Delta, and more than half of the wells in the Arctic Islands are inferred tocontain gas hydrates (Judge, 1988; Judge and Majorowicz, 1992). The combinedinformation from Arctic gas-hydrate studies shows that, in permafrost regions, gashydrates may exist at subsurface depths ranging from about 130 to 2,000 m(Kvenvolden, 1988).
The presence of gas hydrates in offshore continental margins has been inferred mainlyfrom anomalous seismic reflectors that coincide with the predicted phase boundary atthe base of the gas-hydrate stability zone. This reflector is commonly called a bottom-simulating reflector or BSR. BSRs have been mapped at depths below the sea floorranging from about 100 to 1,100 m. (Kvenvolden, 1988). Gas hydrates have beenrecovered in gravity cores within 10 m of the sea floor in sediment of the Gulf of Mexico(Brooks and others, 1986), the offshore portion of the Eel River Basin of California(Brooks and others, 1991), the Black Sea (Yefremova and Zhizhchenko, 1974), theCaspian Sea (Ginsburg and others, 1992), and the Sea of Okhotsk (Ginsburg and others,1993). Also, gas hydrates have been recovered at greater sub-bottom depths duringresearch coring along the southeastern coast of the United States on the Blake OuterRidge (Kvenvolden and Barnard, 1983), in the Gulf of Mexico (Shipboard ScientificParty, 1986a), in the Cascadia Basin near Oregon (Shipboard Scientific Party, 1994), theMiddle America Trench (Kvenvolden and McDonald, 1985; Shipley and Didyk, 1982),offshore Peru (Kvenvolden and Kastner, 1990), and on both the eastern and westernmargins of Japan (Shipboard Scientific Party, 1990, 1991).
Because gas hydrates are widespread in permafrost regions and in offshore marinesediments, they may be a potential energy resource. World estimates for the amount ofnatural gas in gas hydrate deposits range from 5.0x10² to 1.2x10⁶ trillion cubic feet(TCFG) for permafrost areas and from 1.1x10⁵ to 2.7x10⁸ trillion cubic feet (TCFG) foroceanic sediments (adapted from Kvenvolden, 1993). The estimates in table 1 showconsiderable variation, but oceanic sediments seem to be a much greater resource of

4
natural gas than continental sediments. Current estimates of the amount of methane inthe world gas hydrate accumulations are in rough accord at about 7x10⁵ trillion cubicfeet (TCFG) (reviewed by Kvenvolden, 1993). If these estimates are valid, then theamount of methane in gas hydrates is almost two orders of magnitude larger than theestimated total remaining recoverable conventional methane resources, estimated to beabout 9x10³ trillion cubic feet (TCFG) (Masters and others, 1991).
GEOLOGIC CONTROLS ON GAS HYDRATE DISTRIBUTION
Review of previous gas hydrate studies indicates that the formation and occurrence ofgas hydrates is controlled by formation temperature, formation pore-pressure, gaschemistry, pore-water salinity, availability of gas and water, gas and water migrationpathways, and the presence of reservoir rocks and seals. In the following section, thesegeologic controls on the stability and formation of gas hydrates will be reviewed andassessed.
FORMATION-TEMPERATURE, FORMATION PORE-PRESSURE, GASCHEMISTRY
Gas hydrates exist under a limited range of temperature and pressure conditions suchthat the depth and thickness of the zone of potential gas-hydrate stability can becalculated. Depicted in the temperature/depth plots of figures 3A, 3B, and 3C are aseries subsurface temperature profiles from an onshore permafrost area and twolaboratory-derived gas-hydrate stability curves for different natural gases (modifiedfrom Holder and others, 1987). These gas-hydrate phase-diagrams (figs. 3A, 3B, and 3C)illustrate how variations in formation-temperature, pore-pressure, and gas compositioncan affect the thickness of the gas-hydrate stability zone. In each phase-diagram, themean-annual surface temperature is assumed to be -10¡C; however, the depth to thebase of permafrost (0¡C isotherm) is varied for each temperature profile (assumedpermafrost depths of 305 m, 610 m, and 914 m). Below permafrost, three differentgeothermal gradients (4.0¡C/100 m, 3.2¡C/100 m, and 2.0¡C/100 m) are used to projectthe sub-permafrost temperature profiles. The two gas-hydrate stability curvesrepresent gas hydrates with different gas chemistries. One of the stability curves is for a100 percent methane hydrate, and the other is for a hydrate that contains 98 percentmethane, 1.5 percent ethane, and 0.5 percent propane. The only difference among thethree phase-diagrams (figs. 3A, 3B, and 3C) is the assumed pore-pressure gradient.Each phase diagram is constructed assuming different pore-pressure gradient; 9.048

5
kPa/m [0.400 psi/ft] (fig. 3A), 9.795 kPa/m [0.433 psi/ft] (fig. 3B), and 11.311 kPa/m[0.500 psi/ft] (fig. 3C).
The zone of potential gas-hydrate stability in each phase-diagram (figs. 3A, 3B, and 3C)lies in the area between the intersections of the geothermal gradient and the gas-hydratestability curve. For example, in figure 3B, which assumes a hydrostatic pore-pressuregradient, the temperature profile projected to an assumed permafrost base of 610 mintersects the 100 percent methane-hydrate stability curve at about 200 m, thus markingthe upper boundary of the methane-hydrate stability zone. A geothermal gradient of4.0¡C/100 m projected from the base of permafrost at 610 m intersects the 100 percentmethane-hydrate stability curve at about 1,100 m; thus, the zone of potential methane-hydrate stability is approximately 900 m thick. However, if permafrost extended to adepth of 914 m and if the geothermal gradient below permafrost is 2.0¡C/100 m, thezone of potential methane-hydrate stability would be approximately 2,100 m thick.
Most gas-hydrate stability studies assume that the pore-pressure gradient is hydrostatic(9.795 kPa/m; 0.433 psi/ft). Pore-pressure gradients grater than hydrostatic willcorrespond to higher pore-pressures with depth and a thicker gas-hydrate stabilityzone. A pore-pressure gradient less than hydrostatic will correspond to a thinner gas-hydrate stability zone. The effect of pore-pressure variations on the thickness of thegas-hydrate stability zone can be quantified by comparing each of the phase diagramsin figures 3A, 3B, and 3C. For example, in figure 3A, which assumes a 9.048 kPa/m(0.400 psi/ft) pore-pressure gradient, the thickness of the 100 percent methane-hydratestability zone with a 610 m permafrost depth and a sub-permafrost geothermal gradientof 2.0¡C/100 m would be about 1,600 m. However, if a pore-pressure gradient of 11.311kPa/m (0.500 psi/ft) is assumed (fig. 3C) the thickness of the methane-hydrate stabilityzone would be increased to about 1,850 m.
The gas-hydrate stability curves in figures 3A, 3B, and 3C were obtained fromlaboratory data published in Holder and others (1987). The addition of 1.5 percentethane and 0.5 percent propane to the pure methane gas system shifts the stability curveto the right, thus deepening the zone of potential gas-hydrate stability. For example,assuming a hydrostatic pore-pressure gradient (fig. 3B), a permafrost depth of 610 m,and a sub-permafrost geothermal gradient of 4.0¡C/100 m, the zone of potentialmethane (100 percent methane) hydrate stability would be about 900 m thick; however,the addition of ethane (1.5 percent) and propane (0.5 percent) would thicken thepotential gas-hydrate stability zone to 1,100 m.

6
PORE-WATER SALINITY
It is well known that dissolved salt can depress the freezing-point of water. Forexample, the base of the ice-bearing permafrost on the North Slope of Alaska does notcoincide with the 0¡C isotherm but with a lower temperature (Collett and others, 1988).This freezing-point depression has been attributed in part to the presence of salt in theunfrozen pore-waters. Salt, such as NaCl, when added to a gas-hydrate system, alsolowers the temperature at which gas hydrates form. Pore-water salts in contact with thegas during gas hydrate formation can reduce the crystallization temperature by about0.06¡C for each part per thousand of salt (Holder and others, 1987). Therefore, a pore-water salinity similar to that of seawater (32 ppt) would shift the gas-hydrate stabilitycurves in figures 3A, 3B, and 3C to the left about 2¡C and reduce the thickness of thegas-hydrate stability zone.
AVAILABILITY OF GAS AND WATER
Most naturally occurring gas hydrates are characterized by two crystal structuresknown as Structure I and Structure II (reviewed by Sloan, 1990). The ideal gas/waterratio of Structure I gas hydrate is 8/46, whereas the ideal gas/water ratio of Structure IIgas hydrate is 24/136. These ideal ratios confirm the observation that gas hydratescontain a substantial volume of gas. For example, if all the cages of Structure I gashydrate are occupied, each volume of gas hydrate will contain 189 volumes of gas atstandard temperature and pressure. The ideal hydrate gas/water ratios also indicatethat there is a substantial amount of water stored in the gas-hydrate structure. Thesehigh gas and water concentrations demonstrate that the formation of gas hydraterequires a large source of both gas and water. Thus, it becomes necessary to quantifythe potential sources of gas and water when assessing a potential gas-hydrateaccumulation.
GAS AND WATER MIGRATION PATHWAYS
Other factors controlling the availability of gas and water are the geologic controls onfluid migration. As previously shown, gas hydrates contain a substantial volume of gasand water that must be supplied to a developing gas-hydrate accumulation. If effectivemigration pathways are not available, it is unlikely that a significant volume of gashydrates would accumulate. Therefore, geologic parameters such as rock permeabilityand the nature of faulting must be evaluated to determine if the required gas and watercan be delivered to the potential hydrate reservoir.
PRESENCE OF RESERVOIR ROCKS AND SEALS

7
The study of gas-hydrate samples recovered during research coring operations inoceanic sediments suggests that the physical nature of in-situ gas hydrates may behighly variable (reviewed by Sloan, 1990). Gas hydrates were observed to be (1)occupying pores of coarse-grained rocks; (2) nodules disseminated within fine-grainedrocks; (3) a solid, filling fractures; or (4) a massive unit composed mainly of solid gashydrate with minor amounts of sediment. Because of the limited number of gas-hydrate samples, it is not known if gas hydrates are usually pore-filling material oroccur as massive units. A study of well logs from northern Alaska (Collett and others,1988) indicate that gas hydrates occur there as pore-filling constituents within coarse-grained reservoir rocks. This study suggests that porous rock intervals serve asreservoir rocks in which gas and water can be concentrated in the amounts necessaryfor gas-hydrate formation. Therefore, the presence of reservoir rocks may play a role ingas-hydrate formation, particularly in well-consolidated rock intervals.
It is also speculated that the presence of effective reservoir seals or traps may play a rolein gas-hydrate formation. Gas generated at depth moves upward, generally along tiltedpermeable carrier beds, until it either seeps at the surface or meets an impermeablebarrier (trap) that stops or impedes its flow. As migrating gas accumulates below aneffective seal, the total gas concentrations may reach the critical amounts necessary forthe formation of gas hydrates. Thus, impermeable seals can provide a mechanism bywhich the required gas can be concentrated within reservoir rocks.
Besides conventional reservoirs and trapping mechanisms, it is possible for gas hydrateto form its own reservoir and trap. As gas migrates into the zone of gas-hydratestability, it may interact with the available pore water to generate gas hydrate. With theappropriate volumes of gas and water, the pore space within the reservoir rock could becompletely filled, thus making the rock impermeable to further hydrocarbon migration.The plugging of gas pipelines and production tubing by gas hydrates is testimony tothe sealing potential of gas hydrates (Sloan, 1990). It has also been shown that, inmarine environments, gas hydrates can mechanically displace sediments to form theirown reservoir. Thus, the availability of reservoir quality rocks may not always be alimiting factor.
ASSESSMENT METHOD
The major goal of this resource appraisal is to estimate the gas hydrate resources in theUnited States, both onshore and offshore. Similar to the assessment of the conventionalresources in the 1995 U.S. Geological Survey (USGS) Oil and Gas Assessment, this

8
appraisal of gas hydrates is based on a play-analysis scheme, which was conducted on aprovince-by-province basis. We have defined, described, and assessed all the gashydrate-plays in the United States regardless of their current economic or technologicalstatus. Therefore, this assessment is concerned with the in-place gas hydrate resources--that is, the amount of gas that may exist within the gas hydrates without reference to itsrecoverability. In a play analysis method, prospects (potential hydrocarbonaccumulations) are grouped according to their geologic characteristics into plays. Thegeologic settings of the hydrocarbon occurrences in the play are then modeled.Probabilities are assigned to the geologic attributes of the model necessary forgeneration and accumulation of hydrocarbons. In this appraisal method, geologistsmake judgments about the geologic factors necessary for the formation of ahydrocarbon accumulation and quantitatively assess the geologic factors that determineits size. For this gas hydrate assessment, a play consists of a single prospect (prospect =play). This assumption has been made due to the relative lack of knowledge pertainingto individual gas-hydrate accumulation sizes and distribution.
ASSESSMENT DATA FORM
The assessment data form used for this gas-hydrate appraisal was modified from a formused for "conventional" oil and gas assessments (Dolton and others, 1987, 1993). Anexample of the gas-hydrate assessment form is shown in figure 4. This modifiedassessment data form is divided into two sections: the upper section deals with riskingthe play and prospect attributes and the lower part deals with assessing the gas-hydratevolumetric parameters. Play attributes are the geologic characteristics that apply to theentire play. In this assessment, the play attributes include the presence of a natural gassource (GS) (assessment of both microbial and thermogenic sources); timing (T), whichrelates the time of trap formation and the time of hydrocarbon movement; migration(M), which estimates the probability of effective gas movement; and potential reservoirfacies (R), which estimates the probability of occurrence of a rock that may have porositycapable of containing gas hydrates. The product of these individually assessedprobabilities determines the marginal play probability (MP), which reflects thefavorability for the occurrence of gas hydrates within the play. Prospect attributes arethose geologic parameters that control the occurrence of gas hydrates at the prospectlevel. They include the presence of trapping mechanisms (TM), effective porosity (P), andhydrate accumulation (C); the latter refers to the probability of hydrocarbons beingavailable to the individual prospect with appropriate timing relative to the formation ofthe trap. Each prospect attribute is assessed as to its probability of occurrence, and the

9
product of these attributes is referred to as the conditional deposit probability (CP). Theprobability that a gas hydrate accumulation exists at a prospect is the product of themarginal play probability (MP) and the conditional deposit probability (CP).
In the lower part of the assessment data form (fig. 4), the volume of gas hydrates isestimated as a function of the probability distributions of five gas-hydrate volumetricparameters. These parameters are: (1) volume of the hydrate stability field, (2)reservoir-rock thickness, (3) effective porosity, (4) hydrate saturation, and (5) hydrategas yield. These parameters describe the geologic characteristics of the assessed gas-hydrate play and are treated as statistically independent. These parameters areuncertain quantities, described as distributions, and are assessed by seven fractiles(probabilities of 100, 95, 75, 50, 25, 5, and 0). The volume of gas hydrates wasdetermined by using a modified version of the computer program FASPU (Crovelli andBalay, 1990), which utilizes probability theory to process the geologic data on theassessment data form. The probabilistic method used for calculating gas hydrateresources can be considered in three steps: (1) determine if the play contains gashydrates; (2) assess the gas volume within the play; and(3) combine (1) and (2) to determine statistically the play resource potential. Theestimated resources of each play are aggregated, using probability theory, to determinethe total gas hydrate resources.
PLAY AND PROSPECT ATTRIBUTES
In assessing each play, the assessment team reviewed and synthesized extensive datasummaries and geologic interpretations. A typical data summary for a play consistedof numerous maps, cross sections, charts, and graphs. Such comprehensive datasummaries are critical for a reliable assessment and were based upon data derived fromseismic, geological, geochemical, and other studies, as well as subsurface data fromanalog areas. These syntheses were used to assign risk to the geologic attributes on theassessment data form; judgment values were elicited by consensus. The identifiedplays have been defined such that each play and prospect attribute could be assigned asingle risk probability. For example, a probability of 1 assumes that the attribute isfavorable somewhere in the play or prospect, and, even though the attribute may not befavorable throughout the entire play or prospect, it does not affect the gas-hydrateresource potential of the assessed area. As previously discussed, there are nine playand prospect attributes, each of which are discussed in more detail below.

10
The play attributes microbial hydrocarbon source (S1), microbial source sediment thickness(S2), and thermogenic hydrocarbon source (S4) collectively deal with assessing the potentialhydrocarbon source of the gas (GS) within a hydrate play. The hydrocarbon source playattribute (GS) estimates the probability of occurrence of a rock unit that has generatedand expelled gas. Evaluation of this attribute is accomplished by recording a singlevalue between 0 (total certainty that the attribute is absent) and 1 (total certainty thatthe attribute is present) for the probability that enough gas is present to form a gas-hydrate accumulation within the play. This evaluation is based on a set of minimumsource-rock criteria that includes organic richness (total organic carbon, TOC), sedimentthickness, and thermal maturity. It has been shown that the availability of largequantities of hydrocarbon gas from both microbial and thermogenic sources is animportant factor controlling the formation and distribution of natural gas hydrates(Collett, 1993a; Kvenvolden, 1993). Carbon isotope analyses indicate that the methanein many oceanic hydrates is derived from microbial sources. However, molecular andisotopic analyses indicate a thermal origin for the methane in several offshore Gulf ofMexico and onshore Alaskan gas-hydrate occurrences.
Microbial gas is produced by the decomposition of organic matter by microorganisms.Two primary pathways have been identified for the generation of microbial gas: carbondioxide (CO2) reduction and fermentation. Although fermentation is the pathway forgas generation in some modern environments, CO2 reduction is the most importantprocess leading to the development of ancient microbial gas accumulations. CO2needed for reduction to generate methane is mostly from the oxidation and thermaldecarboxylation of in-situ organic matter. Thus, abundant organic matter is needed forthe formation of microbial methane. Organic matter is generally concentrated in finergrained sediments, and minimum total organic carbon (TOC) values of about 0.5percent are required for microbial gas generation (Rice, 1993). Finley and Krason (1989)have shown that, for geologic conditions observed on the Blake Bahama Plateau, amarine sediment with a 1 percent organic carbon content (TOC) could yield enough gasto form hydrates within 28 percent of the available pore space of a 50 percent porositysediment, if all the organic matter were converted to methane. However, organiccarbon to methane conversion efficiency of 100 percent is unreasonable (Kvenvoldenand Claypool, 1988), and a lower efficiency of 50 percent has been assumed for thisassessment (Finley and Krason, 1989). Using the organic carbon to gas hydrateconversion factors developed by Finley and Krason (1989), we have assumed that theminimum organic carbon content (TOC) needed for hydrate formation within most

11
deep marine environments is 0.5 percent, and an organic carbon content (TOC) of 2.0percent would assure the formation of a methane-hydrate accumulation. For each playidentified, therefore, we have assigned a probability of a sufficient microbial hydrocarbonsource (S1) as 0 if the organic carbon content (TOC) of the sediments is below 0.5percent. A microbial hydrocarbon source (S1) probability of 1.0 was assigned to plays witha sediment organic carbon content (TOC) of 2.0 percent or greater [microbial hydrocarbonsource probability (S1): TOC ³ 2 percent, probability equal to 1; 2 percent > TOC ³ 1percent, probability equal to 0.5; 1 percent > TOC ³ 0.5 percent, probability equal to 0.4;TOC < 0.5 percent, probability equal to 0].
Due to the limited thickness of the gas-hydrate stability zone and the relatively loworganic carbon content of most sediments, production of microbial methane internallywithin the gas-hydrate stability zone is a limiting factor for the development ofsignificant gas-hydrate accumulations. Paull and others (1994) have shown that gasrecycling and upward migration of methane in a marine sedimentary sequence isessential in forming significant gas-hydrate accumulations. Once a gas-hydrate stabilityzone is established, microbial gas may accumulate as a result of recycling natural gasfrom below the base of the stability zone and from continued microbial gas productionat depth. Therefore, it is important to assess the volume of in-situ organic carbon (TOC)available for microbial methane generation relative to the thickness of the sedimentarysection. Finley and Krason's (1989) organic carbon to gas hydrate conversion factors,used to determine the microbial hydrocarbon source probability (S1) in this assessment,assume the source of methane is limited to the conversion of the organic matter withinthe hydrate stability zone (i.e., no external or recycled gas). Most of the recoveredmicrobial-sourced marine gas-hydrate samples are from areas where the methane-hydrate stability zone was at least 500 m thick (Kvenvolden, 1993), therefore, we haveassigned a microbial source sediment thickness (S2) probability of 0 for a gas-hydrate playwith a sediment thickness of less than 0.5 km. A probability of 1 was used if the playwas characterized by sediment thickness greater than 3 km [microbial source sedimentthickness probability (S2): sediment thickness ³ 3 km, probability equal to 1; 3 km >sediment thickness ³ 2 km, probability equal to 0.75; 2 km > sediment thickness ³ 1 km,probability equal to 0.5; 1 km > sediment thickness ³ 0.5 km, probability equal to 0.25;sediment thickness < 0.5 km, probability equal to 0]. The cumulative microbialhydrocarbon source probability (S3) is the product of the microbial hydrocarbon source (S1)and microbial source sediment thickness (S2) probabilities.

12
Thermogenic methane is generated during the thermochemical alteration of organicmatter. During early thermal maturation, thermal methane is produced along withother hydrocarbon and non-hydrocarbon gases and is often associated with crude oil.At the highest thermal maturities, methane alone is formed by the cracking of carbon-carbon bonds in kerogen, bitumen, and oils. As temperature increases during thermalmaturation, each of the hydrocarbon species is formed during optimal thermalwindows. For methane, optimum generation occurs at 150¡C (Tissot and Welte, 1978;Wiese and Kvenvolden, 1993). For each play assessed, we have assumed a minimumthermal maturation temperature of 150¡C (about 1.3 percent vitrinite reflectance, Ro) formethane. Therefore, a play in which the sedimentary section is thick enough tocorrespond to a formation temperature of 150¡C or more, the thermogenic hydrocarbonsource probability (S4) is assigned a 1 [thermogenic hydrocarbon source probability (S4):formation temperature ³ 150¡C, probability equal to 1; formation temperature < 150¡C,probability equal to 0].
The hydrocarbon source play attribute (GS) is assumed to be either the cumulative microbialhydrocarbon source probability (S3) or the thermogenic hydrocarbon source probability (S4);the highest of these two probabilities is assigned as the hydrocarbon source play attribute(GS). The hydrocarbon source play attribute (GS) is 1 if gas hydrates are known tooccur in the play.
The evaluation of the play attribute timing (T) is accomplished by recording a singlevalue between 0 (total certainty that the attribute is absent) and 1 (total certainty thatthe attribute is present) for the probability that a suitable relationship exists between thetime of trap formation and the time of gas movement into the play. The evaluation ofthis attribute is dependent on knowledge of the time of trap formation and estimates ofthe time of natural gas generation from either microbial or thermogenic sources.Because gas hydrates can form their own trap, this play attribute probability is oftenequal to 1. When gas hydrates are known to occur in the play, this attribute probabilityis 1.
The play attribute migration (M) estimates the probability of effective movement ofnatural gas and water through conduits that may be permeable clastic or carbonaterocks, joints, or faults. Evaluation of this attribute is accomplished by recording a singlevalue between 0 (total certainty that the attribute is absent) and 1 (total certainty thatthe attribute is present) for the probability that gas and water have migrated insufficient quantities to form a gas-hydrate accumulation. The evaluation of this

13
attribute is mostly based on structural and stratigraphic information from whichinferences can be drawn concerning the presence of suitable migration conduits. Whengas hydrates are known to occur in the play, the migration (M) play attribute probabilityis 1.
The potential reservoir facies (R) attribute, estimates the probability of occurrence of arock that may contain porosity and permeability capable of containing a natural gas-hydrate accumulation. Evaluation of this attribute is accomplished by recording asingle value between 0 (total certainty that the attribute is absent) and 1 (total certaintythat the attribute is present) for the probability that favorable reservoir rocks occur inthe play. In most marine environments the potential reservoir facies attributeprobability is 1 because marine gas hydrates can form their own reservoir bymechanically displacing sediments. When gas hydrates are known to occur in the play,this attribute probability is 1.
As previously discussed, the marginal play probability (MP) [the product of thehydrocarbon source (GS), timing (T), migration (M), and potential reservoir facies (R) playprobabilities] expresses the probability that all the first four play attributes are favorablesomewhere but not necessarily everywhere in the play. A known gas-hydrateaccumulation in the play is an indication that all the play attributes are favorable, andtherefore the marginal play probabilityis 1.
The prospect attribute trapping mechanism (TM) estimates the probability of occurrenceof a structural or stratigraphic configuration that provides a trap for migrating naturalgas. Evaluation of this attribute is accomplished by recording a single value between 0(total certainty that the attribute is absent) and 1 (total certainty that the attribute ispresent) for the probability that a trap will exist in the prospect. Data used to assess thisattribute includes regional geologic information, seismic records, and appropriateanalog comparisons. Gas hydrates are known to form their own trap; therefore, thisprospect attribute is often equal to 1.
The effective porosity prospect attribute (P) estimates the probability of occurrence ofsignificant interconnected void space within the potential reservoir facies (R). Evaluationof this attribute is accomplished by recording a single value between 0 (total certaintythat the attribute is absent) and 1 (total certainty that the attribute is present) for theprobability that porosity equal to or greater than 3 percent will be found within theprospect. Data used to evaluate this attribute is based on available core measurements,

14
well log calculations, and projected analog comparisons. Because gas hydrates formtheir own void space within unconsolidated sediments and because gas hydrates occurnear the surface in relatively high porosity reservoirs, the effective porosity prospectattribute probability (P) is often 1.
The hydrocarbon accumulation prospect attribute (C) estimates the probability of thecombination of hydrocarbon source (GS), timing (T), and migration (M) necessary for theformation of gas hydrate accumulations. Evaluation of this attribute is accomplished byrecording a single value between 0 (total certainty that the attribute is absent) and 1(total certainty that the attribute is present) for the probability that enough gas will beavailable to fill at least 1 percent of the prospect. This attribute deals primarily with theavailability of natural gas to the prospect.
As previously discussed, the conditional deposit probability (CP) expresses theprobability that the first three prospect attributes are favorable in the prospect and theconditional deposit probability (CP) is the product of the three prospect attributeprobabilities.
GAS HYDRATE VOLUMETRIC PARAMETERS
As previously discussed and shown on the assessment data form, the volume of gaswithin the gas hydrates of a given play is dependent on five parameters: (1) volume orgeographic area of the hydrate stability zone, (2) reservoir-rock thickness, (3) effectiveporosity, (4) hydrate saturation, and (5) hydrate gas yield. These volumetric parametersare discussed below and are assessed for each play in the Province and PlayDescriptions section of this paper.
The hydrate stability zone volume parameter describes the possible extent of the zonein which gas hydrates may exist. This parameter is evaluated by entering stability zonevolumes at seven fractiles ranging from 100 percent (total certainty that at least thisvalue will be attained) to 0 percent (total certainty that this value will not be exceeded).Intermediate fractile values indicate the relative confidence that the gas-hydratestability zone volume is at least as great as the recorded fractile values. The primaryfactors controlling the distribution of the gas-hydrate stability zone are formationtemperature or geothermal gradient, formation pore-pressure, gas chemistry, and pore-fluid salinity. In the areas assessed, geothermal-gradient data are available from high-resolution well-bore surveys, near-surface thermal conductivity probe measurements,estimates based on log identification of the base of ice-bearing permafrost, and fromtemperature profiles projected from marine gas-hydrate bottom simulating reflectors

15
(BSRs). Most gas-hydrate stability studies assume that the subsurface pore-pressuregradient is hydrostatic (9.795 kPa/m or 0.433 psi/ft). As previously discussed, pore-pressure gradients greater than hydrostatic will result in a thicker gas-hydrate stabilityzone. Pore-pressure gradients have been calculated from shut-in pressures recordedduring drill-stem testing in petroleum wells, from well-log studies of sedimentcompaction gradients, and from published regional analog studies. The next mostimportant variable when considering gas-hydrate stability is the chemistry of theincluded gas. In plays with known gas-hydrate accumulations, we have used thechemical analyses of recovered samples to select appropriate gas-hydrate stabilitycurves. In plays where gas hydrates have not been sampled, we have used availablemud-log gas-chromatographic data, analyses of formation free-gas samples, andappropriate analogs to predict the gas chemistry of the potential gas-hydrateaccumulations. In the plays assessed, pore-fluid salinity data have been obtained fromwater samples collected during petroleum-formation testing, marine research coringactivity, and from spontaneous-potential well-log calculations.
A computer program was written to facilitate calculations of the limits of the gas-hydrate stability zone. In onshore (permafrost) environments, the program requires asinput the mean annual surface temperature, the depth to the base of ice-bearingpermafrost, the temperature at the base of ice-bearing permafrost, and the ratio betweenthe geothermal gradient from above to below the base of the ice-bearing permafrost.The program will project the geothermal gradient above and below the base of the ice-bearing permafrost. The program also will allow the user to input temperature datafrom other sources, such as high-resolution equilibrated well-bore temperature surveys.In offshore marine environments, the computer program requires as input informationon seabed temperature, geothermal gradient, and water depth. The program calculatesthe depths of the upper and lower boundaries of the zone of gas-hydrate stability.
The gas-hydrate stability curves used for this study were based on a stability model andexperimental results published in Holder and others (1987). For each play assessed, anappropriate gas-hydrate stability curve was selected to represent the suspected gaschemistry and pore-fluid salinities. In this example, the methane stability curve (100percent methane gas) for a pure water system (no salt) is given as a function oftemperature in two equations:
P(kPa)=exp[14.7170-1886.79/T (K)] (from 248 to 273 K or -25 to 0¡C)
P(kPa)=exp[38.9803-8533.80/T (K)] (from 273 to 298 K or 0 to 25¡C)
16
The P(kPa) represents the dissociation or formation pressure of a methane hydrate at agiven temperature, T (K). For the purpose of calculating subsurface gas-hydratestability conditions, the variable T (K) represents the equilibrium temperature inKelvins at any given depth. The depth values of the stability curve can be calculated byconverting the derived pressure, P (kPa), with the pore-pressure gradient. To calculatethe thickness of the gas hydrate stability zone in each of the plays identified, we haveselected a series of transects within each play along which we used the preparedbathymetric (plates 1, 8, and 15), seabed temperature (plates 4, 11, and 18), andgeothermal gradient (plates 5, 12, and 19) maps to obtain the data necessary to calculatethe thickness of the gas hydrate stability zone (plates 6, 13, 20, and 22).
The gas volume parameter reservoir thickness estimates the possible range for thethickness of the potential gas-hydrate reservoir. This parameter is evaluated byentering reservoir thicknesses at seven fractiles ranging from 100 percent (total certaintythat at least this value will be attained) to 0 percent (total certainty that this value willnot be exceeded). Intermediate fractile values indicate the relative confidence that thereservoir thickness is at least as great as the recorded fractile values. The recordedthickness values are the maximum reservoir thickness for a single reservoir or stackedmultiple reservoir with effective porosity of 3 percent or more. Data used to evaluatethis parameter includes seismic records, surface and subsurface geologic maps, andanalog comparisons. In most marine basins, the entire gas-hydrate stability zone occurswithin sediments with porosities exceeding the 3 percent reservoir limit. Thus, thereservoir thickness parameter is often equal to the thickness of the gas-hydrate stabilityzone in most offshore gas-hydrate plays. However, within onshore areas theavailability of adequate reservoirs is a limiting factor. The gas-hydrate stability zonevolume parameter is converted to a gas-hydrate stability zone area parameter (total areaof geographic coverage) when assessing an onshore play due to the dependence ofreservoir availability.
The effective porosity gas volume parameter is the average value for the amount ofinterconnected void space in the available reservoir rock. This parameter is evaluatedby entering porosity estimates at seven fractiles ranging from 100 percent (totalcertainty that at least this value will be attained) to 0 percent (total certainty that thisvalue will not be exceeded). Intermediate fractile values indicate the relative confidencethat the effective porosity is at least as great as the recorded fractile values. A minimumthreshold value of 3 percent was used and the probability that this minimum value isachieved is incorporated into the effective porosity (P) prospect attribute. Data used to

17
evaluate this parameter is based on analyses of recorded petroleum industry andresearch well cores, well log calculations, and analog comparisons. The mechanicaldevelopment of porosity by hydrate formation probably does not add a significantamount of porosity to the total available volume. Therefore, we have used available"undisturbed" sediment porosity data to assess the gas-hydrate reservoir volume.
The gas volume parameter hydrate saturation estimates the possible volume of gashydrates as a percentage of the porous volume within the available reservoirs. Thisparameter is evaluated by estimating percentage values at seven fractiles ranging from100 percent (total certainty that at least this value will be attained) to 0 percent (totalcertainty that this value will not be exceeded). Intermediate fractile values indicate therelative confidence that the reservoir is at least as full as the recorded fractile value. Aminimum threshold value of 2 percent is used at the 100th fractile. The probability thatthis minimum value is achieved is incorporated into the hydrocarbon accumulation (C)prospect attribute. Evaluation of this parameter is based on analog comparisons fromthe North Slope of Alaska (Collett, 1993a) and the Blake Outer Ridge (Lee and others,1993).
The hydrate gas yield volumetric parameter describes how much free gas is stored witha gas hydrate. This parameter is evaluated by estimating percentage values at sevenfractiles ranging from 100 percent (total certainty that at least this value will be attained)to 0 percent (total certainty that this value will not be exceeded). If the clathratestructure of a hydrate is completely filled with methane, 1 m3 of the hydrate wouldcontain 172 m3 of methane at standard temperature and pressure conditions (STP).Most researchers believe that a completely filled clathrate is not likely to be found innature. However, gas hydrates are not stable if the clathrate cages are less then 70percent occupied by gas. For the purpose of this study, we have assumed a minimumthreshold hydrate gas yield of 139 m3 (70 percent cage occupation) for the 100th fractileand a maximum (0 fractile) hydrate gas yield of 164 m3 (90 percent cage occupation).The intermediate fractile values indicate the relative confidence that the hydrate gasyield parameter is at least as large as the recorded fractile value. This range in thehydrate gas yields fully represents the likely minimum and maximum values that occurin nature (Collett, 1993a).
PROVINCE AND PLAY DESCRIPTIONS
In this assessment, 11 gas-hydrate plays were identified within four offshore and oneonshore petroleum provinces (fig. 5); for each play, in-place gas hydrate resources were

18
estimated. Estimates for each of the 11 plays were aggregated to produce the estimateof total gas hydrate resources in the United States. The offshore petroleum provincesassessed consist of the U.S. Exclusive Economic Zone (EEZ) adjacent to the lower 48States and Alaska. The only onshore province assessed was the North Slope of Alaska,which included State water areas and some offshore Federal waters. The provincesshown in figure 5 are geographic in character; however, their formation represents anattempt to group the individual petroleum provinces along broad geologic lines. Mapsdepicting the geologic data required for this hydrate assessment have been included inthis publication as a series of individual plates. Maps of bathymetry, sedimentarythickness, total organic carbon (TOC) content of the sediments, seabed temperature,geothermal gradient, and hydrate stability zone thickness have been included for allfour offshore provinces assessed. Maps depicting the thickness of the onshore gas-hydrate stability zone in northern Alaska are also included.
The primary organization of this part of the report is by the five provinces shown infigure 5. In the following section, each of the provinces is described; the format for eachprovince description includes an introduction covering the geologic setting and areview of the geologic parameters controlling the potential distribution and volume ofgas hydrate resources in the province. Following each province description is asystematic discussion of the individual gas hydrate plays within the province. Eachplay description includes a play map (plates 7, 14, 21, and 23) that shows the play limitsand the thickness of the gas-hydrate stability field. Also included are the assessmentdata forms and the estimate of in-place natural gas hydrate resources.
ATLANTIC OCEAN PROVINCE
GEOLOGIC SETTING
The Atlantic Ocean province covers an area of approximately 1,000,000 km2; itsnorthern, eastern, and southern borders are the limits of the U.S. Exclusive EconomicZone (EEZ), and its western border is the 3-mile State water boundary. The Atlanticcontinental margin of the United States is a classic "passive" margin and is generallyused as an example of a geologic feature developed during continental rifting (Bally,1981). During rifting of North America from North Africa and subsequent subsidence,a thick wedge of Mesozoic and Cenozoic sediments built out onto the subsidingcontinental margin. Major deltaic systems prograded across the continental shelf,which occasionally were interrupted by more open marine conditions. Carbonate reefsand micritic limestone buildups marked the shelf-slope break. The major sedimentary

19
basins along the Atlantic margin are generally elongated parallel to the present-daycoast and most contain more than 10,000 m of sediment. The major basins include theScotian, Georges Bank, Baltimore Canyon Trough, Carolina Trough, and Blake Plateau.North of the Carolinas, the continental margin above 2,000-m bathymetric depth is lessthan 150 km wide, whereas to the south, into the Florida-Bahama region, the continentalmargin broadens to about 500 km. Beneath this broad continental shelf region arelocated the Carolina Trough and Blake Plateau Basin, which is bounded to the northeastby the Blake Outer Ridge.
Seismic profiles along the Atlantic margin are often marked by large-amplitudereflection events that parallel the sea-floor, known as bottom simulating reflectors(BSRs) (Dillon and others, 1993; Lee and others, 1993). BSRs are believed to be causedby large acoustic impedance contrast at the base of the gas-hydrate stability zone thatjuxtaposes sediments containing gas hydrates with sediments containing free gas. BSRshave been extensively mapped at two locations off the east coast of the United States --along the crest of the Blake Outer Ridge and beneath the upper continental rise of NewJersey and Delaware (Tucholke and others, 1977; Dillon and others, 1993). The firstdirect evidence that gas hydrates might be present along the Atlantic margin was foundduring deep-sea drilling on the Blake Outer Ridge in 1970 (Shipboard Scientific Party,1972). Cores recovered from the Deep-Sea Drilling Project (DSDP) Sites 102, 103, and104 contained large quantities of methane, which suggested the presence of gashydrates. In addition, measured acoustic velocities (>2 km/sec.) within the suspectedgas-hydrate-bearing section exceeded normal marine sediment velocities -- this alsoindicated the presence of gas hydrates. The occurrence of gas hydrates on the BlakeOuter Ridge was confirmed during Leg 76 of the DSDP when a sample of gas hydratewas recovered from a sub-bottom depth of 238 m at Site 533 (Shipboard Scientific Party,1980).
GEOLOGIC CONTROLS ON GAS HYDRATE
Formation Temperature
Within the Atlantic Ocean province, geothermal gradient data are available from 35 sea-floor temperature-probe measurements (Gerard and others, 1962; Langseth and vonHerzen, 1970), from well-bore surveys in two research core holes (Shipboard ScientificParty, 1980; Kvenvolden and Barnard, 1983), and from estimates based on identificationof BSRs on available seismic records (35 locations) (Tucholke and others, 1977;MacLeod, 1982; Yamano and others, 1982; Krason and Ridley, 1985a, 1985b; Dillon and

20
others, 1993). Additional temperature data (23 geothermal gradients) have beenobtained from a geothermal gradient map of North America published by the AmericanAssociation of Petroleum Geologists and the U.S. Geological Survey (GeothermalSurvey of North America Subcommittee, 1976). To further augment our Atlantictemperature data base, we have utilized a method of evaluating heat flow fromidentified BSRs. In this method, developed by Yamano and others (1982), in-situtemperatures at the BSR can be estimated when the pressure and gas composition areknown, thus providing additional geothermal-gradient data.
A comparison of geothermal gradients calculated from the different temperature datasources are similar over most of the Atlantic Ocean province; however, the near-surfacetemperature probe data of Langseth and von Herzen (1970) generally yield slightlyhigher geothermal gradients. The geothermal gradient in the Atlantic Ocean provinceranges from approximately 3.0¡C/100 m along the coast and increases seaward tovalues over 4.0¡C/100 m (plate 5).
For the Atlantic Ocean, seabed temperatures needed to calculate the distribution andthickness of the gas-hydrate stability zone are available from numerous publications(Fuglister, 1960; Schroeder, 1963; Barrett, 1965; Gerard and others, 1962; NavalOceanographic Office, 1967; Tucholke and others, 1977; Kvenvolden and Barnard, 1983;Krason and Ridley, 1985a, 1985b). In general, seabed temperatures at bathymetricdepths of less than 500 m range from about 10 to 20¡C, whereas below 1,000 m waterdepth, the seabed is at a relatively uniform temperature of about 2 to 3¡C (plate 4).
Formation Pore-Pressure
A review of available data sources uncovered no evidence of significant pore-pressureanomalies in the near-surface (0-1,500 m) sedimentary sequence of the Atlantic Oceanprovince. Therefore, the gas-hydrate stability calculations in this paper for the AtlanticOcean have been made assuming a hydrostatic pore-pressure gradient (9.795 kPa/m;0.433 psi/ft).
Gas Chemistry
Analysis of gas samples recovered during research coring [Deep Sea Drilling Project(DSDP) and Ocean Drilling Program (ODP) operations] along the Atlantic marginindicate the presence of mostly methane, some carbon dioxide, occasional hydrogensulfide, and traces of ethane (Legs 11, 43, 44, 76, 101, 102; Shipboard Scientific Party,1972, 1978, 1979, 1980, 1986b). Because methane appears to be the dominant

21
hydrocarbon gas within the sediments of the Atlantic margin and because only traceamounts of higher molecular weight hydrocarbon gases have been found, we haveassumed a pure methane chemistry for the gas-hydrate stability calculations in theAtlantic Ocean province.
Pore-Water Salinity
Salinity data from the near-surface sediments of the Atlantic Ocean province areavailable from water samples collected from numerous DSDP and ODP researchcoreholes (Legs 11, 43, 44, 76, 101, 102; Shipboard Scientific Party, 1972, 1978, 1979, 1980,1986b). In general, the reported (bulk) pore-water salinities are similar that of sea water(32 ppt), ranging from about 31 to 36 ppt. Therefore, the gas-hydrate stabilitycalculations in this paper for the Atlantic Ocean province have been made assuming apore-water salinity of 32 ppt (average sea-water salinity).
Gas-Hydrate Stability Calculations
In most marine environments, the thickness of the gas-hydrate stability zone is equal tothe depth below the sea-floor of the base of the gas-hydrate stability zone. Thus, theisopach map in plate 6 depicts both the thickness of the methane-hydrate stability zoneand the depth below the sea-floor of the base of the methane-hydrate stability zone inthe Atlantic Ocean province. It shows that the methane-hydrate stability zone reaches amaximum thickness of about 700 m in the east-central portion of the Atlantic Oceanprovince and that gas hydrate should not be present at water depths less thanapproximately 750 m.
Availability of Gas and Water
Analysis of the gas evolved from the gas-hydrate sample obtained in the DSDP Site 533corehole on the Blake Outer Ridge revealed that methane was present in highconcentrations and methane/ethane ratios of 4,000 to 35,000 indicated that the methaneis of microbial origin (Brooks and others, 1983). Carbon isotopic composition of themethane from the recovered gas hydrate sample ranged from -67 to -91 per mill, whichsupports the contention of a microbial origin for the methane. Geochemical analyses ofthe carbon isotopic composition of carbon dioxide sampled in the Site 533 coreholefurther indicated that the formation of the methane resulted from the microbialreduction of carbon dioxide. The organic carbon required for the microbial generationof methane is not widely abundant along the Atlantic margin. The total organic carbon(TOC) content of the near-surface (0-1,500 m) sediments in the Atlantic Ocean province

22
ranges from below 0.5 percent to about 2.0 percent (plate 3; modified from Premuzic,1980; Premuzic and others, 1982). As previously discussed, TOC contents of less than0.5 percent are thought to preclude the occurrence of microbially sourced methanehydrate accumulations. Therefore, the map of total organic carbon (TOC) content of thesurficial sediments in the Atlantic Ocean province in plate 3 also depicts the limits(areas >0.5 percent TOC) of potential microbial sourced methane hydrateaccumulations.
With sediment thicknesses exceeding 15 to 17 km it is also possible that thermochemicalalteration of organic matter at depths exceeding 4 km has contributed to the generationof methane in the Atlantic Ocean province (sediment thickness map in plate 2 ismodified from Tucholke and others, 1982; Drummond, 1986). However, no significantthermogenic gas accumulations have been discovered along the Atlantic margin.
In most near-surface (0-1,500 m) marine sedimentary sections, water is generallyconsidered to be a ubiquitous substance. In addition, DSDP and ODP drilling have notrevealed any evidence of dewatered sediments; thus, the availability of water is notjudged to be a limiting gas hydrate formation factor in the Atlantic Ocean province.
Gas and Water Migration Pathways
The "passive" margin nature of the Atlantic Ocean province has not lent itself to thedevelopment of significant fault systems, thus limiting the number of potential gas- andwater-migration pathways. This limitation reduces the potential for significant gashydrate accumulations due to the inability of gas and water to migrate and sourcedeveloping gas hydrate accumulations.
Reservoir Rocks and Seals
Porosities in the near-surface (0-1,500 m) sediments of the Atlantic Ocean provincerange from about 30 to 80 percent and average about 57 percent (Lee and others, 1993);thus, the entire marine sedimentary section is considered to be an excellenthydrocarbon reservoir based on porosity alone. Due to the high-porosity nature ofmost marine sediments and because gas hydrates can form their own void space withinunconsolidated rocks, we do not consider porosity to be a gas hydrate limiting factor inthe Atlantic Ocean province. The relative lack of reservoir seals, on the other hand, maylimit the occurrence of gas hydrates along the Atlantic Ocean margin. As previouslydiscussed, the "passive" nature of the Atlantic margin has not lent itself to significantfault development, which, in turn, has limited the number of structural traps that could

23
effect the accumulation of gas hydrates in the Atlantic Ocean Province. However, theBSR-inferred gas hydrate accumulation of the Blake Outer Ridge is associated with alarge regional anticinal structure. Stratigraphic traps, common to "passive" marginsequences, may contribute to the accumulation of gas hydrates; however, there is noevidence of stratigraphically controlled gas hydrate accumulations along the Atlanticmargin.
Northeastern Atlantic Ocean Play
The Northeastern Atlantic Ocean Play (plate 7; fig. 6) is limited to the sedimentarysection in the northern part of the Atlantic Ocean province with organic carbon (TOC)contents exceeding 0.5 percent. This play consists of limited structural and stratigraphictraps in clastic rocks of Cenozoic age. The Cenozoic sedimentary section along thenortheastern margin of the United States consists of Paleocene to Eocene shale,Oligocene to Miocene mudstone and shale, Miocene to Pliocene unconsolidated sand,and Pleistocene silty clays, sands, and gravels.
The methane-hydrate stability zone reaches a maximum thickness of nearly 700 m in thesoutheast corner of the play. Thermal conditions should preclude the occurrence of gashydrates above the 700-m bathymetric contour along the continental margin.
Potential reservoirs consist of hemipelagic muds and clays, coarse turbidite sands, andwell-compacted deltaic to shallow-marine clastics.
The potential for microbially sourced methane within this play is limited due to the lowamount of organic carbon within the near-surface (0-1,500 m) sedimentary section.Methane from thermogenic sources may contribute to gas hydrate formation in thisplay, but there is no evidence of significant thermogenic gas accumulations in theNortheastern Atlantic Ocean play.
Postulated traps are mostly stratigraphic and are related to facies changes along thecontinental margin. Structural traps are believed to be relatively rare. Shales areexpected to provide fair to good seals, although their effectiveness may be reduced dueto the poorly consolidated nature of the sedimentary section.
Southeastern Atlantic Ocean Play
The Southeastern Atlantic Ocean play (plate 7; fig. 7) consists of the area in the southernpart of the Atlantic Ocean province where the sedimentary section organic carbon(TOC) content exceeds 0.5 percent. The major geologic feature of this play is the BlakeOuter Ridge, which is a positive topographic sedimentary feature on the continental

24
slope and rise. The Blake Outer Ridge was built upon transitional continental to oceaniccrust by the complex accretion of marine sediments deposited by longitudinal driftcurrents. West of the Jurassic paleoshelf edge, a thick wedge of Mesozoic sedimentsexists that progressively thins to the east beneath the Blake Outer Ridge, which consistof Tertiary to Quaternary sediments of hemipelagic muds and silty clays.
The thickness of the methane-hydrate stability zone in this play ranges from zero alongthe northwestern edge of the play to a maximum thickness of about 700 m along theeastern edge of the play.
The reservoirs in the Blake Outer Ridge area are relatively poor, consisting ofhemipelagic muds and clays; however, measured porosities are high, ranging from 40to 80 percent.
Potential source rocks within this play include deeply buried, thermally mature, marineshales and carbonates. Low organic carbon content (TOC) of the sediments in this playreduces the amount of microbial methane available for gas hydrate formation.
Hydrocarbon traps within this play include both stratigraphic and regional anticlinalstructural traps. Minor faults and surrounding thick marine clays are expected toprovide poor to fair seals.
GULF OF MEXICO PROVINCE
GEOLOGIC SETTING
The Gulf of Mexico province covers an area of approximately 500,000 km2; its western,northern, and eastern borders are the State water boundaries of Texas, Louisiana,Alabama, Mississippi, and Florida, and the southern border of the province is the limitof the U.S. Exclusive Economic Zone (EEZ). The geology of the Gulf of Mexico has beenstudied in detail by many industry, government, and academic research organizations,and it is one of the most hydrocarbon-rich regions in the world (Wilhelm and Ewing,1972; Bouma, 1982). The oldest sedimentary rocks in the Gulf of Mexico are isolatedTriassic red-bed sequences, which are overlain by extensive Jurassic evaporite deposits.Subsidence during the Cretaceous and the development of deep marine conditions leadto the deposition of thick marine clastics throughout the basin. Increased sedimentinflux during the Tertiary and Quaternary, and glacially induced sea-level fluctuationsresulted in the deposition of a thick marine to nonmarine sedimentary section.

25
The geology of the northwestern and northern margins of the Gulf of Mexico isdominated by salt diapirism and heavy Cenozoic deposition. The geologic features ofthe region include massive slumps, intraslope basins, graben structures over shallowsalt diapers, and growth faults (Bouma, 1982). The Gulf of Mexico is bounded to theeast by the broad, partly submerged, Florida platform, which is overlain by a thick, flat-lying Cretaceous and Tertiary sedimentary section composed of mostly limestone. TheFlorida platform is not considered to be a significant petroleum region.
Bottom-simulating reflectors (BSRs), believed to be related to the occurrence of gashydrates, have been identified throughout most of the Gulf of Mexico (Shipley andothers, 1979; Hedberg, 1980; Krason and others, 1985). Most of the BSRs described byShipley and others (1979) and Hedberg (1980) in the Gulf of Mexico are restricted to thecores of tightly folded anticlines at water depths ranging from 1,200 to 2,000 m. Krasonand others' (1985) detailed study of gas hydrates in the western Gulf of Mexico hasrevealed numerous BSRs covering an area of approximately 5,000 km2. This regionallyextensive inferred gas hydrate accumulation is found in water depths of 1,200 to 2,700m, and the BSR sub-bottom depths range from 400 to 600 m.
The first direct evidence of gas hydrates in the Gulf of Mexico was obtained in 1970 onLeg 10 of the DSDP when gas-rich sediment cores were recovered from the deep-waterSigsbee Plain and the Gulf of Campeche (Shipboard Scientific Party, 1973a). Theoccurrence of gas hydrates in the Gulf of Mexico was confirmed during Leg 96 of theDSDP when numerous gas hydrate samples were recovered from sub-bottom depthsranging from 20 to 40 m in the Orca Basin (Sites 618 and 618A), which is located about300 km south of Louisiana beneath about 2,000 m of water (Shipboard Scientific Party,1986a). Near-surface (0-5 m) marine sediment coring has also recovered numerous gashydrate samples on the Louisiana continental slope (Brooks and others 1986, 1994).These seabed gas hydrate discoveries occur as small to medium nodules, interspersedlayers, and as solid masses at water depths ranging from 530 to 2,400 m.
GEOLOGIC CONTROLS ON GAS HYDRATE
Formation Temperature
Within the Gulf of Mexico province, geothermal-gradient data are available from 16 sea-floor temperature probe measurements (Langseth and von Herzen, 1970), from well-bore surveys in three research core holes (Shipboard Scientific Party, 1973a, 1986a), andfrom estimates based on identification of BSRs on available seismic records (11

26
locations) (Shipley and others, 1979; Krason and others, 1985; Brooks and others 1986).Additional temperature data (20 geothermal gradients) have been obtained from ageothermal gradient map of North America published by the American Association ofPetroleum Geologists and the U.S. Geological Survey (Geothermal Survey of NorthAmerica Subcommittee, 1976). The geothermal gradient in the Gulf of Mexico rangesfrom about 2.0 - 3.0¡C/100 m along the coast and increases seaward to values greaterthan 4.0¡C/100 m in the central portion of the basin (plate 5).
Published water-column temperature data from the Gulf of Mexico (Schroeder, 1963;Naval Oceanographic Office, 1967; Krason and others, 1985; Brooks and others 1986)reveals that, at bathymetric depths of less than 500 m, the seabed temperature rangesfrom about 12 to 19¡C, whereas below 1,000 m water depth, the seabed is at relativelyuniform temperatures of about 4 to 5¡C (plate 4).
Formation Pore-Pressure
Formation over-pressuring is well documented within the Gulf of Mexico (Hunt andothers, 1994); however, the major over-pressured zones occur several thousand metersbelow the zone of predicted gas-hydrate stability (to be discussed later in this paper).Within the near-surface (0-1,500 m) sedimentary section of the Gulf of Mexico, there isno evidence of anomalous pore-pressures. Therefore, the gas-hydrate stabilitycalculations in this paper for the Gulf of Mexico have been made assuming ahydrostatic pore-pressure gradient (9.795 kPa/m; 0.433 psi/ft).
Gas Chemistry
Analysis of gas samples recovered during research coring (DSDP operations) in thedeep Gulf of Mexico indicate the presence of mostly methane, some ethane, and tracesof carbon dioxide (Shipboard Scientific Party, 1973a). The gas hydrate samplesrecovered from the DSDP Site 618 corehole also contained predominantly methane,with only small to trace amounts of other gases (Shipboard Scientific Party, 1986a).Four of the eight near-surface (0-5 m) gas-hydrate-bearing sediment cores recoveredfrom the Louisiana slope contained significant amounts of ethane (1.2 - 9.2 percent),propane (0 - 22.8 percent), and iso-butane (0 - 4.5 percent) in addition to methane (61.9 -93.4 percent) (Brooks and others, 1986). These apparent thermogenic (to be discussedlater) gas hydrates are probably near-surface phenomenon and are closely associatedwith major fault systems that have acted as fluid migration pathways from more deeplyburied hydrocarbon sources (Brooks and others, 1986). It appears that most of the gaswithin the gas-hydrate accumulations in the Gulf of Mexico are from microbial sources;

27
therefore, we have assumed a pure methane gas chemistry for the gas-hydrate stabilitycalculations in the Gulf of Mexico province.
Pore-Water Salinity
Analysis of water samples collected during ODP research coring operations in the Gulfof Mexico yielded pore-water salinities averaging about 32 ppt (Shipboard ScientificParty, 1973a, 1986a); therefore, the gas-hydrate stability calculations in this paper for theGulf of Mexico province have been made assuming a pore-water salinity of 32 ppt(average sea water salinity).
Gas-Hydrate Stability Calculations
The isopach map of the methane-hydrate stability zone in plate 6 for the Gulf of Mexicoprovince reveals that the zone in which methane hydrates potentially may exist reachesa maximum thickness of about 600 m in the south-eastern corner of the province, butstability conditions preclude the occurrence of methane hydrates above the 600-mbathymetric contour.
Availability of Gas and Water
Geochemical analysis of the gas evolved from the gas-hydrate samples obtained in theDSDP Site 618 corehole in the Orca Basin yielded methane/ethane ratios of 18,400 andstable methane carbon isotopic compositions of -71.3 per mill, both of which areindicative of hydrocarbon gases generated by microbial processes (Shipboard ScientificParty, 1986a). Geochemical data from other DSDP coreholes within the Gulf of Mexicoconfirm the predominance of microbially derived methane in the near-surfacesedimentary section of the basin (Shipboard Scientific Party, 1973a). However, gas-hydrate-bearing seabed sediment cores from areas of active hydrocarbon seepage on theLouisiana slope contain a significant amount of thermogenic gas (Brooks and others,1986). As previously indicated, these thermogenic gas hydrates are believed to be anear-surface phenomenon and not widely distributed. Most of the gas hydrates in theGulf of Mexico are likely derived from microbial natural gas sources; however, the totalorganic carbon (TOC) content of the near-surface (0-1,500 m) sediments in the Gulf ofMexico is low, averaging about 0.5 percent (plate 3; modified from Premuzic, 1980;Premuzic and others, 1982). It is known that thermogenic gas sources have contributedto gas hydrate formation in the Gulf of Mexico; however, the importance of this sourceis not known (sediment thickness map in plate 2 is modified from Tucholke and others,1982; Drummond, 1986).
28
The water required for gas hydrate formation in the Gulf of Mexico province should beavailable in ample supply.
Gas and Water Migration Pathways
The occurrence of fault-controlled thermogenic gas-hydrate accumulations within thenear-surface sedimentary section of the Gulf of Mexico reveals the presence of effectivenatural gas migration pathways. In addition, most of the Gulf of Mexico province isdominated by large-scale growth faults, salt diapers, and graben features, which havecontributed to the migration and accumulation of significant conventional hydrocarbonresources.
Reservoir Rocks and Seals
Porosities in the near-surface (0-1,500 m) sediments of the Gulf of Mexico province aresimilar to those in the Atlantic Ocean province, ranging from 30 to 80 percent; thus, theentire marine sedimentary section can be considered to be an excellent reservoir basedon porosity alone. The abundance of structural traps in the Gulf of Mexico directlycontribute to the formation and accumulation of gas hydrates. For example, most of theGulf of Mexico BSR-inferred gas-hydrate accumulations occur within anticlinalstructures and are in close association with major fault systems.
Gulf of Mexico Play
The Gulf of Mexico play, the only play within the Gulf of Mexico province, is limited tothe area in the province where the organic carbon (TOC) content of the sedimentarysection exceeds 0.5 percent (plate 2). The Gulf of Mexico play covers an area ofapproximately 240,000 km2 and is divided into a northern and southern section (plate 7;fig. 8). This play consists of abundant structural, stratigraphic, and combinedstructural-stratigraphic traps in clastic rocks of Mesozoic to Quaternary age. Thesedimentary section in the Gulf of Mexico play is characterized by interbedded turbiditeclastics and hemipelagic muds.
The methane-hydrate stability zone reaches a maximum thickness of more than 600 mwithin the deepest portion of the Gulf of Mexico, and the 600-m bathymetric contour isthe upper limit of the methane-hydrate stability zone.
Potential reservoirs consist of turbidite sands, limited shelf carbonates, and hemipelagicmuds and silts.
29
Potential source rocks beneath the play sequence include numerous thermally maturegas sources, some of which have contributed to the fault-controlled thermogenic gashydrate occurrences on the Louisiana slope. Low organic carbon content (TOC) of thesediments in this play reduces the amount of microbial methane available for gashydrate formation.
Hydrocarbon traps in this play are mostly structural and are often related to large-scalegrowth faults and salt diapers.
PACIFIC OCEAN PROVINCE
GEOLOGIC SETTING
The Pacific Ocean province covers an area of approximately 800,000 km2; its northern,western, and southern borders are the limits of the U.S. Exclusive Economic Zone(EEZ), and its eastern border is the 3-mile State water boundary of Washington, Oregon,and California. The structural development and depositional history of the Pacific coastmargin are mostly controlled by the motion of the Pacific and North American plates asreviewed by Atwater and Molnar (1973). Because of the active tectonic history of thePacific Ocean province, during which older basins were destroyed and new onescreated, rocks prospective for petroleum are limited mainly to basins that formedduring Cenozoic time. The major Cenozoic basins along the Pacific margin include theEel River, Point Arena, Bodega, Outer Santa Cruz, Santa Maria, and Santa Barbara-Ventura. The northern part of the Pacific Ocean province, offshore from Washingtonand Oregon, contains numerous small forearc basins composed of thick sedimentaryand volcanic rocks of Tertiary age. This northern region is stratigraphically complexbut only moderately folded and faulted; only several small occurrences of natural gashave been reported. The California coastal basins south of the Mendocino FractureZone contain very thick Neogene sedimentary rock fill. Several of these basins havebeen exceedingly rich in discovered petroleum, including the Santa Maria and SantaBarbara-Ventura Basins.
BSRs, believed to be related to the occurrence of gas hydrates, have been extensivelymapped on the inner continental margin of northern California (Field and Kvenvolden,1985). These constitute a single, inferred, gas-hydrate accumulation that covers an areaof at least 3,000 km2 on the Klamath Plateau and the upper continental slope at waterdepths ranging from 800 to 1,200 m. Limited seismic data show that this regionallyextensive inferred gas-hydrate occurrence extends northward to offshore Oregon andseaward at least to the base of the slope (3,000 m). The occurrence of gas hydrates in the

30
Pacific Ocean Province was confirmed in 1989 when numerous gas-hydrate sampleswere obtained during seabed (0-6 m) sediment coring operations (water depths rangingbetween 510 and 642 m) in the Eel River Basin (Brooks and others, 1991). Recoveredgas-hydrate samples consisted of dispersed crystals, small nodules, and layered bands.The location of these gas hydrates coincides nearly, but not exactly, with the area ofBSR-inferred gas hydrates described by Field and Kvenvolden (1985) along the northernCalifornia coast. These gas hydrate-samples appear to confirm Field and Kvenvolden's(1985) observation that gas hydrates are present north of the Mendocino Fracture Zonebut are probably absent to the south, into the Point Arena Basin. Recently, gas hydrateswere unexpectedly recovered along the Pacific margin from a relatively restricted zonewithin 19 m of the sea-floor in three ODP (Leg 146) research coreholes: Sites 892A, 892D,and 892E (Shipboard Scientific Party, 1994). All of these coreholes are located on theOregon continental slope in about 675 m of water.
GEOLOGIC CONTROLS ON GAS HYDRATE
Formation Temperature
Within the Pacific Ocean province, geothermal gradient data are available from 10 sea-floor temperature-probe measurements (Langseth and von Herzen, 1970), from well-bore surveys in six research core holes (Shipboard Scientific Party, 1992, 1994), and fromestimates based on identification of BSRs on available seismic records (10 locations)(Field and Kvenvolden, 1985; Krason and Ciesnik, 1986; Singh and others, 1993; Zwart,1993). Additional temperature data (13 geothermal gradients) have been obtained froma geothermal-gradient map of North America published by the American Association ofPetroleum Geologists and the U.S. Geological Survey (Geothermal Survey of NorthAmerica Subcommittee, 1976). The geothermal gradient in the Pacific Ocean provinceranges from about 3.0 - 5.0¡C/100 m along the coast and increases seaward to values ofmore than 7.0¡C/100 m in the northwest and southwest corners of the province (plate12).
Pacific Ocean seabed temperatures necessary to calculate the thickness of the gas-hydrate stability zone are available from a number of publications (Lee and Cox, 1966;Field and Kvenvolden, 1985; Krason and Ciesnik, 1986; Brooks and others 1991;Shipboard Scientific Party, 1992, 1994). In general, seabed temperatures at bathymetricdepths of less than 500 m range from about 6 to 8¡C, whereas, below 1,000 m waterdepth, the seabed is at relatively uniform temperature of about 2¡C (plate 11).

31
Formation Pore-Pressure
Within the near-surface (0-1,500 m) sedimentary section of the Pacific Ocean province,there is no evidence of significant pore-pressure anomalies. Therefore, the gas-hydratestability calculations in this paper for the Pacific Ocean province have been madeassuming a hydrostatic pore-pressure gradient (9.795 kPa/m; 0.433 psi/ft).
Gas Chemistry
Analysis of gas samples recovered during research coring (DSDP and ODP operations)in the Pacific Ocean province indicate the presence of mostly methane, some carbondioxide, occasional hydrogen sulfide, and varying amounts of ethane and propane(Shipboard Scientific Party, 1970, 1973b, 1981, 1992, 1994). The occurrence of ethane (0-5,723 ppmv) and propane (0-1,788 ppmv) appears to be limited to several coreholeslocated on the continental slope near Washington (Shipboard Scientific Party, 1992).The gas-hydrate samples recovered from the sea-floor (0-6 m subsurface) in the EelRiver Basin by Brooks and others (1991) contained mostly methane, with only small totrace amounts of ethane and propane. Geochemical analysis of the gas-hydrate samplesrecovered during Leg 146 of the ODP (Shipboard Scientific Party, 1994) indicate thepresence of mainly methane (132,767 ppmv) with only minor amounts of carbondioxide (578 ppmv) and ethane (77 ppmv). In addition, carbon disulfide (CS2) wasidentified in the sediment gases associated with the recovered gas hydrate samples onLeg 146. Because methane appears to be the dominant hydrocarbon gas within thesediments of the Pacific margin and because the occurrence of other hydrate-forminggases appears to be limited, we have assumed a pure methane chemistry for the gas-hydrate stability calculations in the Pacific Ocean province.
Pore-Water Salinity
Salinity data from the near-surface (0-1,500 m) sedimentary section of the Pacific Oceanprovince are available from water samples collected from numerous DSDP and ODPresearch coreholes (Legs 5, 18, 63, 139, 146; Shipboard Scientific Party, 1970, 1973b, 1981,1992, 1994). The reported (bulk) pore-water salinities are similar to that of sea water (32ppt), ranging from about 30 to 36 ppt. Therefore, the gas-hydrate stability calculationsfor the Pacific Ocean province have been made assuming a pore-water salinity of 32 ppt(average sea-water salinity).
Gas-Hydrate Stability Calculations
32
The isopach map in plate 13 shows that the methane-hydrate stability zone is about 400m thick throughout most of the Pacific Ocean province, and gas hydrates should not bepresent at water depths less than approximately 600 m.
Availability of Gas and Water
The seabed (0-6 m) gas-hydrate samples recovered from the Eel River basin by Brooksand others (1991) contained mostly methane and only small to trace amounts of ethanewith methane/ethane ratios of 456 to 8,030, which indicates a microbial gas source. Thestable carbon isotopic composition of the methane evolved from these seabed gashydrates ranges from -57.6 to -69.1 per mill, which also indicates a microbial source forthe methane within the gas hydrates. Analysis of the gas evolved from the gas-hydratesamples in the ODP Site 892 coreholes on the Oregon continental slope revealed thatmethane was present in high concentrations, and methane/ethane ratios of 102 to 4,397indicated that both microbial- and thermogenic-sourced natural gas is included withinthe recovered gas-hydrate samples (Shipboard Scientific Party, 1994). On the basis ofmolecular composition alone, however, the relative amount of thermogenic gas withinthese samples is unknown; stable carbon isotopes are required to ascertain the degree ofmicrobial and thermogenic gas mixing at ODP Site 892. Most of the gas hydrates in thePacific Ocean province are likely derived from microbial natural gas sources. Theorganic carbon required for the microbial generation of methane is abundant in thePacific Ocean province, with the total organic carbon (TOC) content of the near-surface(0-1,500 m) sediments ranging from 1.0 to 2.0 percent (plate 10; modified fromPremuzic, 1980; Premuzic and others, 1982). It is likely that thermogenic gas sourceshave contributed to gas-hydrate formation in the Pacific Ocean province; however, theimportance of this source is not known (sediment thickness map in plate 9 is modifiedfrom Drummond, 1986).
The water required for gas hydrate formation in the Pacific Ocean province should beavailable in ample supply.
Gas and Water Migration Pathways
The active tectonic nature of the Pacific continental margin has lead to the developmentof significant fault systems, which, in turn, provide potential gas and water migrationpathways. ODP Leg 146 has revealed large-scale fluid flow systems within theaccretionary wedge of the Juan de Fuca Plate (Shipboard Scientific Party, 1994), whichfurther indicates the presence of effective migration pathways in the Pacific Oceanprovince. There is also evidence that the ODP Site 892 gas-hydrate occurrences are
33
closely associated with a large thrust fault that may have acted as a migration conduitfor the gas required for gas-hydrate formation (Shipboard Scientific Party, 1994).
Reservoir Rocks and Seals
Porosities in the near-surface (0-1,500 m) sediments of the Pacific Ocean province aresimilar to those observed in most marine basins (averaging about 60 percent); thus, theentire marine sedimentary section can be considered an excellent reservoir based onporosity alone. The moderately to highly faulted nature of the Pacific continentalmargin has lead to the development of numerous structural traps; however, none of theknown gas-hydrate accumulations in the Pacific Ocean province occur withinconventional hydrocarbon traps.
Northern Pacific Ocean Play
The Northern Pacific Ocean play covers an area of approximately 253,000 km2 and islimited to the region north of the Mendocino Fracture Zone within the Pacific Oceanprovince (plate 14; fig. 9). Tectonically, the region north of the Mendocino FractureZone is characterized by active plate subduction. This play consists of abundantstructural traps in clastic rocks of mostly Tertiary age. The lithostratigrahic section inthe Northern Pacific Ocean play is dominated by shallow-marine-type sediments,including well-indurated mudstone, siltstone, and minor amounts of sandstone andconglomerate.
The methane-hydrate stability zone is about 400 m thick throughout most of the play,and the 600-m bathymetric contour marks the approximate eastern limit of themethane-hydrate stability zone.
Potential reservoirs consist of shallow marine clastics, with measured porosities ofabout 60 percent.
Potential source rocks within this play include deeply buried, thermally mature, marineand nonmarine shales. Relatively high organic carbon contents (TOC) within the near-surface sediments of this play represents an important source of microbial methane.
Hydrocarbon traps in this play are mostly structural and are often associated withlarge-scale tectonic plate movement.
Southern Pacific Ocean Play
The Southern Pacific Ocean play covers an area of approximately 442,000 km2 and islimited to the region south of the Mendocino Fracture Zone within the Pacific Ocean
34
province (plate 14; fig. 10). Tectonically, this play is characterized by right-lateral strike-slip plate movement. This play includes abundant structural and stratigraphic traps infractured chert-shale reservoirs and conventional clastic reservoirs of Micocene toPleistocene age.
The thickness of the methane-hydrate stability zone in this play ranges from zero alongthe eastern edge of the play to a maximum thickness of about 400 m within the center ofthe play.
Potential reservoirs consist of high-porosity uncompacted hemipelagic muds and clays,coarse sands, and deltaic to shallow-marine clastics.
Potential source rocks are organic-rich mudrocks of Miocene and early Pliocene age. Inaddition, high organic carbon contents (TOC) within the seabed sediments may be animportant source of microbial methane.
Hydrocarbon traps in this play consist of mainly structural traps associated withfaulting; however, several of the conventional oil and gas fields in the Santa Maria Basinare stratigraphically trapped.
ALASKA OFFSHORE PROVINCE
GEOLOGIC SETTING
The Alaska Offshore province includes all the Federal waters within the U.S. ExclusiveEconomic Zone (EEZ) adjacent to Alaska. We have divided this province into fourplays: Beaufort Sea, Bering Sea, Aleutian Trench, Gulf of Alaska. The tectonic settingfor each of the assessed plays can be classified as either active or quiescent. TheAleutian Trench and Gulf of Alaska plays are located south and southeast of thevolcanogenic arc of the Aleutian Islands, which is the northern boundary of thesubducting Pacific Ocean plate. The Bering Sea and Beaufort Sea plays, on the otherhand, are in tectonically quiescent settings and are characterized by thick sedimentarysections.
The Beaufort Sea is the southern part of the Arctic Ocean east of the Chukchi Sea,offshore of the northern coast of Alaska. The Beaufort Sea play is underlain mainly bysediments derived from the Brooks Range in Alaska. The Early Cretaceous to Tertiaryuplift of the Brooks Range to the south introduced large volumes of terrigenoussediments to the north into the developing Canada Basin (Grantz and May, 1984).Hydrocarbon discoveries in Tertiary sediments of the Alaskan Beaufort continental

35
shelf indicate good hydrocarbon-generation potential in correlative lithologiesthroughout the play.
The Bering Sea play spreads to the north of the Aleutian Islands and is bounded bywestern Alaska, eastern Siberia, and the Bering Strait. The Bering Sea Basin, typical ofmany other marginal basins surrounding the Pacific Ocean, contains a thick (2-9 km)section of mostly Cenozoic sediment impounded behind the outer island arc of theAleutian Islands (Cooper and others, 1979). Regional geologic studies suggest that themajor requirements for hydrocarbon formation and accumulation are presentthroughout the play (Carlson and others, 1985).
The Aleutian Trench is located south of the Aleutian Island Chain, which links theAlaska Peninsula on the east to the Kamchatka Peninsula to the west. The AleutianIsland Chain is a large, mostly submerged mountain range of volcanic and sedimentaryrocks. Sandwiched between the Aleutian Trench and the Aleutian Islands is the 20- to300-km-wide Aleutian accretionary wedge (McCarthy and others, 1984). Within thisaccretionary wedge of mostly Miocene through Pleistocene marine sediments, seismicreflection profiles reveal an abundance of potential hydrocarbon traps. Petroleumgeology studies of the Aleutian Island arc system reveal that all the conditionsnecessary for the formation of hydrocarbon accumulations exist in the Aleutian Trenchplay (McCarthy and others, 1984; Kvenvolden and von Huene, 1986).
The geology of the Gulf of Alaska play is not well known. Theories pertaining to thetectonic development of this region are frequently embroiled in controversial scientificdebates. Within the continental slope of the Gulf of Alaska play, the prevailinglithologies consist of clayey silt and turbidite sands interbedded with volcanic ash(Krason and Ciesnik, 1987). The petroleum potential for this area is generallyconsidered to be poor (Kvenvolden and von Huene, 1986; Krason and Ciesnik, 1987).
The most extensive BSR-inferred gas-hydrate accumulation mapped in Alaska is in theBeaufort Sea play (Grantz and others, 1982; Kvenvolden, 1987; Finley and Krason, 1988).The BSRs described by Grantz and others (1982) occur within 300 to 700 m of the seafloor, where water depths range from about 500 to more than 2,500 m. This inferredgas-hydrate accumulation, not yet directly tested by the drill, covers an area of at least7,500 km2.
BSRs, believed to be related to the occurrence of gas hydrates, have been identified onthe Bering Sea continental slope and rise near the Navarin Basin in water depthsranging from 1,000 to 2,400 m (Marlow and others, 1981; Carlson and others, 1985;

36
Krason and Ciesnik, 1987). The sub-bottom depths of these BSRs range from about 200to 500 m. Other regional geophysical surveys imply that large areas of the deep-water(3,700 - 4,000 m) portion of the Bering Sea Basin are underlain by pore-filling deposits ofmethane hydrates (Scholl and Hart, 1993). Seismic surveys have revealed numerousdistinctive acoustic velocity and amplitude anomalies (VAMPs), indicative of local gas-hydrate occurrences, throughout the Bering Sea play. Scholl and Hart (1993)determined that the VAMPs in the Bering Sea occur over an area of approximately400,000 km2. No gas hydrates have been recovered from the Bering Sea play, possiblydue to limited drilling.
Seismic reflection profiles from the area of the Aleutian Trench and Arc systemcommonly reveal BSRs at sub-bottom depths near 1,000 m (Kvenvolden, 1987). DSDPresearch coring in the Aleutian accretionary wedge (Site 186; Shipboard Scientific Party,1973c), near the margin of the Atka Basin, encountered a high amount of methane gas inclose association with a BSR, suggesting that BSRs in this area are a reflection of free-gasunderlying a gas-hydrate-bearing section.
Seismic reflection profiles from the Gulf of Alaska have revealed BSRs on the uppercontinental slope southeast of Kodiak Island at water depths from 1,600 to 2,300 m andat sub-bottom depths of 570 to 670 m (Kvenvolden and von Huene, 1986; Krason andCiesnik, 1987). MacLeod (1982) also shows depths of BSRs in sediments of the Gulf ofAlaska, but the locations are not given. Other than seismic data, there is no evidence ofgas hydrates in the Gulf of Alaska.
GEOLOGIC CONTROLS ON GAS HYDRATE
Formation Temperature
Within the Alaska offshore province, geothermal-gradient data are available from 85sea-floor temperature-probe measurements (Foster, 1962; Langseth and von Herzen,1970; Scholl and Hart, 1993), from well-bore surveys in seven research coreholes(Shipboard Scientific Party, 1973b, 1973c, 1993), and from estimates based on theidentification of BSRs on available seismic records (41 locations) (Cooper and others,1979; Shipley and others, 1979; Marlow and others, 1981; Grantz and others, 1982;MacLeod, 1982; McCarthy and others, 1984; Carlson and others, 1985; Kvenvolden andvon Huene, 1986; Krason and Ciesnik, 1987; Kvenvolden, 1987; Finley and Krason, 1988;Scholl and Hart, 1993). Additional temperature data (35 geothermal gradients) havebeen obtained from the geothermal-gradient map of North America published by theAmerican Association of Petroleum Geologists and the U.S. Geological Survey

37
(Geothermal Survey of North America Subcommittee, 1976). The geothermal gradientin the Beaufort Sea play ranges from about 3.0- 5.0¡C/100 m (plate 19). In the BeringSea play, the geothermal gradient is about 4.0¡C/100 m along the northeastern edge ofthe play and increases to the southwest to values exceeding 8.0¡C/100 m near theAleutian Islands (plate 19). The geothermal gradient in both the Aleutian Trench andGulf of Alaska plays ranges from very low values of less than 2.0¡C/100 m in the deep-marine portion of the plays to values exceeding 6.0 - 7.0¡C/100 m beneath the AleutianIslands. The geothermal-gradient pattern observed in the Aleutian Trench play (plate19) can be directly attributed to the regional heat flow pattern across the AleutianTrench--Arc system (Shipboard Scientific Party, 1973c).
Seabed temperatures needed to calculate the thickness of the gas-hydrate stability zonein the Alaska Offshore province are available from a number of publications (NavyHydrographic Office, 1958; Schroeder, 1963; Shipboard Scientific Party, 1973b, 1973c,1993; Shipley and others, 1979; Kvenvolden and von Huene, 1986; Krason and Ciesnik,1987; Finley and Krason, 1988; Scholl and Hart, 1993; Schweitzer, 1993). In the BeaufortSea play, the seabed temperature is relatively uniform, averaging about 0¡C (plate 18).In the Bering Sea, Aleutian Trench, and Gulf of Alaska plays, the seabed temperature atbathymetric depths of less than 500 m is about 5¡C, whereas below 1,000 m water depth,the seabed is at a temperature of about 2¡C (plate 18).
Formation Pore-Pressure
The review of all available data has revealed no evidence of significant pore-pressureanomalies within the near-surface (0-1,500 m) sedimentary section of the AlaskaOffshore province. Therefore, the gas-hydrate stability calculations for the Alaskaoffshore province have been made assuming a hydrostatic pore-pressure gradient (9.795kPa/m; 0.433 psi/ft).
38
Gas Chemistry
Relatively few gas samples have been collected from the Alaska Offshore province duemainly to the lack of drilling. Analysis of the gas samples recovered during DSDP(Legs 18 and 19; Shipboard Scientific Party 1973b, 1973c), ODP (Leg 145; ShipboardScientific Party 1993), and seabed (Cooper and others, 1979; Marlow and others, 1981;Carlson and others, 1985; Kvenvolden and von Huene, 1986; Krason and Ciesnik, 1987;Finley and Krason, 1988; Scholl and Hart, 1993) sediment coring in the Alaska Offshoreprovince indicates the presence of mostly methane and only small to trace amounts ofother hydrate-forming hydrocarbon gases. Because methane appears to be thedominant hydrocarbon gas within all the plays of the Alaska offshore province, wehave assumed a pure methane chemistry for the gas-hydrate stability calculations in theAlaska Offshore province.
Pore-Water Salinity
Salinity data from the near-surface (0-1,500 m) sedimentary section of the AlaskaOffshore province are available from water samples collected during DSDP (Legs 18and 19; Shipboard Scientific Party 1973b, 1973c), ODP (Leg 145; Shipboard ScientificParty 1993), and seabed (Krason and Ciesnik, 1987; Finley and Krason, 1988) sedimentcoring activity. The reported (bulk) pore-water salinities are similar to that of sea water(32 ppt), ranging from about 30 to 36 ppt. Therefore, the gas-hydrate stabilitycalculations for the Alaska Offshore province have been made assuming a pore-watersalinity of 32 ppt (average sea-water salinity).
Gas-Hydrate Stability Calculations
The isopach map in plate 20 shows that the methane-hydrate stability zone in theBeaufort Sea play is more than 700 m thick in the north-central portion of the play, andmethane hydrates should not occur above the 500-m bathymetric contour. Throughoutmost of the Bering Sea play, the methane-hydrate stability zone is about 400 m thick.The gas-hydrate stability zone in the Aleutian Trench and Gulf of Alaska plays reachesa maximum thickness of about 1,200 m within and to the south of the Aleutian Trench.Thermal conditions should preclude the occurrence of methane hydrates above the 600-m bathymetric contour in both the Aleutian Trench and Gulf of Alaska plays.

39
Availability of Gas and Water
There are insufficient data to fully interpret the availability of natural gas in most of theAlaska Offshore province. All of the plays here appear to contain hydrocarbon gas ofmostly microbial origin; however, thermogenic gas has also been found in most of theplays (Shipboard Scientific Party 1973b, 1973c, 1993; Marlow and others, 1981;McCarthy and others, 1984; Carlson and others, 1985; Kvenvolden and von Huene,1986; Krason and Ciesnik, 1987; Finley and Krason, 1988; Scholl and Hart, 1993). Theorganic carbon required for the microbial generation of methane is generally availablein amounts sufficient for the formation of methane hydrates in most of the Alaskaoffshore plays (plate 17; modified from Premuzic, 1980; Premuzic and others, 1982).The near-surface (0-1,500 m) sedimentary section in the Aleutian Trench play exhibitsthe greatest range in available organic carbon (TOC), with values ranging from below0.5 percent to very high values of over 2.0 percent. It is likely that thermogenic gassources have contributed to gas-hydrate formation in the Alaska Offshore province;however, the importance of these sources is not known (sediment thickness map inplate 16 is modified from Drummond, 1986; Tucholke and others, 1982).
The water required for formation of gas hydrates in the Alaska Offshore provinceshould be available in ample supply.
Gas and Water Migration Pathways
The quiescent tectonic setting of the Beaufort Sea and Bering Sea plays has not lent itselfto the development of significant fault systems, thus limiting the number of potentialgas- and water-migration pathways. However, the active tectonic nature of theAleutian Trench and Gulf of Alaska plays has lead to the development of major normal-fault systems, large-scale grabens, and numerous sub-basins along the southerncontinental margin of Alaska, which may allow for numerous migration pathways.
Reservoir Rocks and Seals
Porosities in the near-surface sediments (0-1,500 m) of the in the Alaska Offshoreprovince are similar to those observed in most marine basins (ranging from about 30 to80 percent); thus, the entire marine sedimentary section can be considered to be anexcellent reservoir based on porosity alone. The active tectonic nature of the AleutianTrench and Gulf of Alaska plays has lead to the development of numerous structuraltraps. On the other hand, the quiescent tectonic setting of the Beaufort Sea and BeringSea plays has not lent itself to the development of significant structural traps that could
40
effect the accumulation of gas hydrates. Stratigraphic traps may contribute to theaccumulation of gas hydrates in these plays; however, there is no evidence ofstratigraphically controlled gas-hydrate accumulations in the Offshore Alaska province.
Beaufort Sea Play
The Beaufort Sea play (plate 21; fig. 11) is limited to a sedimentary section of clasticdetritus derived from the uplift of the Brooks Range to the south. This play consists oflimited structural and stratigraphic traps related to facies changes or traps formedagainst small-displacement faults. The Cretaceous and Tertiary sedimentary section inthe Beaufort Sea play varies in thickness from less than 1 km over the Barrow Arch to 11km beneath the outer Beaufort Sea continental shelf.
The thickness of the methane-hydrate stability zone in this play ranges from zero alongthe southern edge of the play to a maximum thickness of about 700 m in the north-central portion of the play.
Potential reservoirs consist of high-porosity hemipelagic muds and clays, coarseturbidite sands, and deltaic to shallow-marine clastics.
The proximity of huge conventional hydrocarbon accumulations along the southernmargin of the Beaufort Sea play indicates that rich, mature source rocks exist in theregion. However, the composition and thermal history of the strata beneath the outercontinental shelf and slope of the Beaufort Sea are not known due to limited drilling.Adequate organic carbon (TOC) content of the sediments on the Beaufort Seacontinental margin indicates a good potential for microbial methanogensis (plate 17).
Hydrocarbon traps within this play likely include stratigraphic traps associated withregional facies changes.
Bering Sea Play
The Bering Sea play (plate 21; fig. 12) is limited to the deep-water (more than 700 m)portion of the Bering Sea Basin to the southwest of the Alaskan continental shelf. TheBering Sea play consists of mostly stratigraphic traps in a thick (1 to 9 km) flat-lyingCenozoic sedimentary section. Major lithologies in the play are represented bydiatomaceous mudstones and siltstones interbedded with sandstones, shales, andvolcanic ashes.

41
The methane-hydrate stability zone is about 400 m thick throughout most of the play,and thermal conditions should preclude the occurrence of methane hydrates above the600-m bathymetric contour in the Bering Sea.
Porous marine lithologies within the Bering Sea play consist of diatomaceous sedimentswith varying amounts of silt and clay that is more compressed with depth (reportedporosities range from 58 to 85 percent).
Organic carbon content values for the near-surface (0-1,500 m) sedimentary section inthe Bering Sea play average about 1 percent, which indicates there should be anadequate supply of microbial methane for gas-hydrate formation (plate 17). Regionalpetroleum studies suggest that only limited parts of the play have conditions favorablefor thermogenic hydrocarbon generation.
Postulated traps are mostly stratigraphic and are related to facies changes along thecontinental margin. Structural traps are believed to be relatively rare.
Aleutian Trench Play
The Aleutian Trench play (plate 21; fig. 13) covers an area of about 530,000 km2 and islimited to the region south of the Aleutian Islands and west of the Shumagin Islandswhere the organic carbon content of the sedimentary section exceeds 0.5 percent (plate17). The play consists of abundant structural and stratigraphic traps in Tertiaryturbidite sandstones and porous diatomaceous pelagic deposits.
The thickness of the methane-hydrate stability zone ranges from zero near the 600-mbathymetric contour along the northern margin of the play to about 1,200 m along thesouthern boundary of the play.
Potential reservoirs consist of hemipelagic muds and clays, turbidite sandstones,diatomaceous sediments, and volcanic ashes.
The organic carbon (TOC) content of the sediments in the Aleutian Trench play variesfrom 0.5 to over 2.0 percent (plate 17), which may represent an important source ofmicrobial methane. Due to the limited thickness (0 to 3 km) of the sedimentary sectionin the Aleutian Trench play, it is unlikely that a significant amount of thermogenic gaswould be found in the play.
Hydrocarbon traps in this play are mostly structural and are often associated withlarge-scale tectonic plate movement.
Gulf of Alaska Play

42
The Gulf of Alaska play (plate 21; fig. 14) is limited to the region south of the KodiakIsland and Prince William Sound area and east of the Shumagin Islands where thesedimentary section organic carbon (TOC) content exceeds 0.5 percent (plate 17). Thisplay consists of relatively limited structural and stratigraphic traps in clayey silt andsandstone deposits of Cenozoic age.
The thickness of the methane-hydrate stability zone ranges from zero along thenorthern edge of the play to a maximum thickness of about 1,200 m within the center ofthe play.
Potential reservoirs consist of unconsolidated hemipelagic muds and clays, turbiditesandstones, diatomaceous sediments, and volcanic ashes.
Low organic carbon (TOC) content of the sediments in this play indicates a low amountof microbial methane available for gas hydrate formation. The potential forthermogenically derived hydrocarbons in this play is believed to be moderate to low(Kvenvolden and von Huene, 1986).
Hydrocarbon traps in this play should consist of mainly structural traps associated withlarge-scale tectonic plate movement.
ALASKA ONSHORE PROVINCE
GEOLOGIC SETTING
The Alaska Onshore province extends 950 km from the Chukchi Sea on the west to theCanadian border on the east. Its maximum width is about 320 km. The total area of theprovince is about 140,000 km2. The geology and petroleum geochemistry of rocks onthe North Slope of Alaska are described in considerable detail in a number ofpublications (Lerand, 1973; Grantz and others, 1975; Carman and Hardwick, 1983; Birdand Magoon, 1987; and Gryc, 1988). The sedimentary rocks of the North Slope can beconveniently grouped into three sequences that indicate major episodes in the tectonicdevelopment of the region and, to a degree, its lithologic character. Defined on thebasis of source area, these sequences, proposed by Lerand (1973) and applied tonorthern Alaska by Grantz and others (1975) are, in ascending order, the Franklinian(Cambrian through Devonian), the Ellesmerian (Mississippian to lower mostCretaceous), and the Brookian (Lower Cretaceous to Holocene).
The only confirmation of natural-gas hydrate on the North Slope was obtained in 1972when ARCO and EXXON successfully recovered a core containing gas hydrates

43
(reviewed by Collett and others, 1988). Well-log data from an additional 445 NorthSlope wells were examined for possible gas-hydrate occurrences (Collett, 1993a). Thisreview of all available data revealed that gas hydrates are inferred to occur in 50 of thesurveyed wells. Many of these wells have multiple gas-hydrate-bearing units, andindividual occurrences range from 3 to 31 m thick. The well-log inferred gas hydratesoccur in six laterally continuous sandstone and conglomerate units and aregeographically restricted to the east end of the Kuparuk River production unit and thewest end of the Prudhoe Bay production unit. Open-hole logs from wells in the westend of the Prudhoe Bay field also indicate the presence of a large free-gas accumulationtrapped stratigraphically downdip below four of the log-inferred gas hydrates. Thepotential volume of gas within the log-inferred gas hydrates (exclusive of the associatedfree-gas) of the Prudhoe Bay-Kuparuk River area is approximately 37 to 44 trillion cubicfeet (at STP) [approximately 1.0 x 10¹² to 1.2 x 10¹² cubic meters of gas] (Collett, 1993a).
GEOLOGIC CONTROLS ON GAS HYDRATE
Formation Temperature
On the North Slope, subsurface temperature data come from high-resolution,equilibrated well-bore surveys in 46 wells and from estimates based on identification ofthe base of ice-bearing permafrost in 102 other wells (Collett and others, 1988).Beginning in 1958, a series of 46 North Slope wells, considered to be in or near thermalequilibrium, have been surveyed with high-resolution temperature devices(Lachenbruch and others, 1987). Geothermal gradients needed to predict the depth andthickness of the gas-hydrate stability zone can be interpreted directly from theseequilibrated temperature profiles. The high-resolution temperature surveys haveprovided 39 geothermal gradients within the ice-bearing sequence and 35 below thebase of the ice. However, specific evaluation of subsurface temperatures at any oneparticular site on the North Slope is subject to error because of the vastness of the regionand the limited number of equilibrated well-bore temperature surveys.
To augment the limited North Slope temperature data base, a new method ofevaluating local geothermal gradients has been developed (for a complete descriptionof this method see Collett and others, 1988). In this method, well-log picks for the baseof the ice-bearing permafrost from 102 wells have been combined with regionaltemperature constants derived from the high-resolution surveys to extrapolatetemperature data.

44
A comparison of geothermal gradients calculated from the high-resolution temperaturesurveys and projected from known ice-bearing permafrost depths are similar over mostof the North Slope, with gradient values in the ice-bearing sequence ranging from about1.5¡C/100 m in the Prudhoe Bay area to about 4.5¡C/100 m in the National PetroleumReserve in Alaska (NPRA). The calculated and projected geothermal gradients frombelow the ice-bearing sequence range from about 1.6¡C/100 m to about 5.2¡C/100 m.
Formation Pore-Pressure
On the North Slope, pressure data from petroleum drill-stem testing in 17 wells, and logevaluation of discontinuities in overburden compaction profiles (pore-pressure profiles)in 22 wells have been used to evaluate pore-pressures within the near-surface sediments(0-1,500 m).
Pore-pressure gradients calculated from shut-in pressures recorded during drill-stemtesting in wells from the North Slope range from 9.3 to 11.2 kPa/m, with an averagegradient of 9.7 kPa/m (0.43 psi/ft), near hydrostatic (data from State of Alaska wellfiles). To further evaluate pore-pressures, well logs have been used to studyoverburden compaction profiles. Within the near-surface (0-1,500 m) sediments of theNorth Slope, no significant pore-pressure discontinuities were observed. Pore-pressures in the wells we have examined are a product of a hydrostatic pore-pressuregradient; therefore, the gas-hydrate stability determinations for northern Alaska in thispaper assume a hydrostatic pore-pressure gradient (9.795 kPa/m; 0.433 psi/ft).
Gas Chemistry
The analysis of mud-log gas-chromatographic data from 320 wells indicates thatmethane is the dominant hydrocarbon gas in the near-surface (0-1,500 m) sedimentaryrocks of the North Slope (Collett and others, 1988). Analysis of gas evolved fromrecovered gas-hydrate samples in the Prudhoe Bay area suggest that the in-situ gashydrates are composed mostly of methane (87 to 99 percent). Therefore, the gas-hydrate stability calculations in this paper for northern Alaska have been madeassuming a pure methane chemistry.
Pore-Water Salinity
Salinity data within the near-surface sediments of the North Slope are available frompetroleum drill-stem and production tests, water samples from cores within thepermafrost sequence, and spontaneous potential well-log calculations. Analyses of 55water samples collected during petroleum formation testing in rock units from below

45
the permafrost sequence are available. These analyses indicate that (bulk) pore-watersalinities range from 0.5 to 19.0 ppt. Spontaneous potential well-log calculationsindicate that pore-water salinities within the near-surface sediments of the North Slopeare similar, ranging from 2 to 19 ppt. Analysis of cores from within the ice-bearingsequence of the BP 12-10-14A well (located in the Prudhoe Bay oil field) indicates thatsalinities within the sands of the ice-bearing permafrost sequence are also low, rangingfrom 0.15 to 0.50 ppt (Howitt, 1971). The gas-hydrate stability calculations in this paperfor northern Alaska have been made assuming a pore-water salinity of 19 ppt(maximum recorded value).
Gas-Hydrate Stability Calculations
The calculated total thickness of the methane-hydrate stability zone in northern Alaskais isopached in plate 22; this map reveals that the methane-hydrate stability zone on theNorth Slope is thickest in the Prudhoe Bay area, with calculated values slightly greaterthan 1,000 m. The offshore extent of the gas-hydrate stability zone is not wellestablished; however, "relic" permafrost and gas hydrates may exist on the Beaufort Seacontinental shelf to a present water depth of 50 m (Collett, 1993a).
Availability of Gas and Water
Geochemical similarities suggest that a large amount of the gas within the hydratestability zone of the Prudhoe Bay-Kuparuk River area of the North Slope has migratedfrom deep thermogenic gas sources (Collett and others, 1990). The stable carbonisotopic composition of the methane within the gas-hydrate-bearing rock units averagesapproximately -49 per mill, suggesting that the hydrates contain gas from a mixture ofthermogenic and microbial sources. Geochemical analyses indicate that about 50 to 70percent of the methane within the hydrate stability field has migrated from thermogenicsources (Collett, 1993a). Locally within the Prudhoe Bay-Kuparuk River area, theoccurrence of gas hydrates appears to be controlled by the availability of a significantthermogenic gas source. Outside the immediate Prudhoe Bay-Kuparuk River area thereappears to be a limited supply of natural gas that may restrict the occurrence ofadditional gas hydrate resources.
The Prudhoe Bay-Kuparuk River gas-hydrate accumulation lies within and beneath athick (500 to 600 m) permafrost sequence, which may restrict regional ground-waterflow. Recharge into an arctic sedimentary basin is usually limited to thawed zonesbeneath large lakes and major rivers. However, Deming and others (1992) suggest thatthe bulk of ground-water recharge on the North Slope takes place in the Brooks Range.

46
Their proposed topographically driven ground-water flow system, which wouldtransport water from areas of high elevation in the Brooks Range to areas of lowelevation on the coastal plain, would provide the water necessary for gas-hydrateformation in the Prudhoe Bay-Kuparuk River area. The lack of pore-pressure anomalieswithin the North Slope sedimentary sequence (as discussed in a previous section) alsoindicates that there is a sufficient source of water to maintain regional ground-waterflow and hydrostatic pore-pressures.
Gas and Water Migration Pathways
The occurrence of gas hydrates in the Prudhoe Bay-Kuparuk River area is largelycontrolled by the availability of a significant quantity of thermogenic hydrocarbon gasthat has migrated from depth along major fault systems. The occurrence of largethermogenic-gas accumulations within the near-surface sedimentary section of theNorth Slope reveals the presence of effective natural-gas migration pathways. Thereview of regional seismic data also reveals numerous near-surface faults that may actas gas- and water-migration pathways.
Reservoir Rocks and Seals
As previously noted, most of the well-log-inferred gas hydrates in the Prudhoe Bay-Kuparuk River area occur in a series of laterally continuous lower Tertiary sandstoneand conglomerate units. These gas-hydrate-bearing rock units likely served as lateralconduits for up-dip-migrating thermogenic gas and provided the reservoirs in which toconcentrate the gas required for gas-hydrate formation.
Multiple trapping mechanisms for the gas incorporated in the hydrates may exist in thePrudhoe Bay-Kuparuk River area. For instance, deeply buried fault traps described byWerner (1987) may extend into the overlying gas-hydrate units. In addition, most of thesediments that make up the gas-hydrate reservoir rocks were deposited in a delta-plainto shelf environment in which stratigraphic traps are common. Lateral facies changesmay provide hydrocarbon traps within these horizons; however, because these rocksare unconsolidated, the efficiency of potential seals may be reduced. Ice-bearingpermafrost is believed to be an impermeable barrier to migrating gas. Although ice-bearing permafrost is not believed to be the trapping mechanism for any conventionalhydrocarbon accumulations on the North Slope (Werner, 1987), it may form trapswithin the near-surface (0-1,500 m) sedimentary sequence.

47
Two plays (plate 23) were defined and individually assessed within the AlaskanOnshore province: (1) Topset play and (2) Fold Belt play.
Topset Play
The Topset play (plate 23; fig. 15) consists of stratigraphic traps and sandstonereservoirs of Cretaceous and Tertiary age and includes those rocks represented onseismic records in the topset position of a clinaform sequence. This play is limited tothe relatively undeformed rocks north of the Brooks Range fold belt. These rocks, theNanushuk Group and Sagavanirktok Formation, consist of marine and nonmarinedeltaic sandstone, siltstone, shale, conglomerate, and coal.
The methane-hydrate stability zone in this play reaches a maximum thickness of about1,000 m within the area of the Prudhoe Bay field. The northern offshore limit of thehydrate stability zone corresponds with the 50-m bathymetric contour.
Reservoir rocks consist of sandstone and conglomerate and may comprise as much as75 percent of the total thickness of the gas-hydrate stability zone, even thoughindividual beds seldom exceed 20 m. Fair to good reservoir continuity is expected, butmarked changes may occur over short distances.
Potential source rocks within the play interval are interbedded deltaic shales andmudstones, which are immature. Beneath the methane-hydrate stability zone arenumerous potential thermally mature gas sources, some of which have contributed tothe known gas hydrate accumulations in the Prudhoe Bay-Kuparuk River area.
Postulated traps are mostly stratigraphic and are related to facies changes, or trapsformed against small-displacement normal faults. Faults and interbedded shales areexpected to provide only fair to poor conventional seals.
This play includes onshore State lands and offshore State and Federal waters. The gas-hydrate resource estimate for this play is divided into two parts, with one estimaterepresenting the hydrate resources within the State lands and waters and the secondrepresenting the offshore Federal hydrate resources (exclusive of the deep marinehydrate resources of the Beaufort Sea play).
Fold Belt Play
The Fold Belt play (plate 23; fig. 16) consists of anticlinal traps in Cretaceous andTertiary sandstone reservoirs in the northern part of the Brooks Range fold belt. Theplay is situated north of the Brooks Range thrust belt and south of undisturbed deposits

48
of the Topset play; its western border is the Chukchi Sea; its eastern border extendsoffshore to the 50-m bathymetric contour in the Beaufort Sea. In the eastern part, thisplay encompasses rocks of the Sagavanirktok and Canning Formations, Hue Shale,pebble shale unit, and Kemik Sandstone; in the western part of the play, it includesparts of the Nanushuk Group and Torok Formation.
The methane-hydrate stability zone in this play reaches a maximum thickness of about500 m in the north-central portion of the play area, and thermal conditions preclude theoccurrence of gas hydrates in about half of the play.
Potential reservoirs are sandstone units, representing deltaic and shallow-marineenvironments. Sandstone porosities are expected to range from about 5 to 20 percent.
Potential source rocks include gas-prone shale units of the Nanushuk Group and theSagavanirktok, Torok, and Canning Formations. Gas-prone source rocks within theplay range from immature to mature.
Conventional traps within this play consist of fault-cored anticlines related to BrooksRange thrusting. Stratigraphic traps, such as updip pinchouts on the flanks ofanticlines, may also be present. Shales are expected to provide fair to good seals,although the effectiveness of these seals may be reduced by faulting.
This play includes onshore State lands and offshore State and Federal waters. The gas-hydrate resource estimate for this play is divided into two parts, with one estimaterepresenting the hydrate resources within the State lands and waters and the secondrepresenting the offshore Federal hydrate resources (exclusive of the deep-marinehydrate resources of the Beaufort Sea play).

49
ESTIMATES OF IN-PLACE RESOURCES
The estimates of in-place gas-hydrate resources included in this report are presented inthe form of complementary cumulative probability distributions (table 2, fig. 17). Thesedistributions summarize the range of estimates generated by the FASPU computerprogram (Crovelli and Balay, 1990) as a single probability curve in a "greater than"format (fig. 17). Our estimates are reported at the mean and at the 95th, 75th, 50th, 25th,and 5th fractiles (table 2). We consider the 95th and 5th fractiles to be "reasonable"minimum and maximum values, respectively
In-place gas resources within the gas hydrates of the United States are estimated torange from 112,765 to 676,110 trillion cubic feet of gas (TCFG) [3,193 to 19,142 trillioncubic meters of gas (TCMG)], at the 0.95 and 0.05 probability levels, respectively (table2, figure 17). Although these ranges of values show a high degree of uncertainty, theydo indicate the potential for enormous quantities of gas stored as gas hydrates. Themean in-place value for the entire United States is calculated to be 320,222 TCFG (9,066TCMG). This assessment of in-place gas hydrates represents those deposits thatconstitute the resource base without reference to recoverability.

50
REFERENCES CITED
Atwater, T., and Molnar, P., 1973, Relative motion of the Pacific and North Americanplates deduced from sea-floor spreading in the Atlantic, Indian, and South PacificOceans: Stanford University Publications, Geologic Publications, Geologic Science,v. 13, p. 136-148.
Bally, A.W., 1981, Atlantic type margins, in Bally, A.W., ed., Geology of PassiveContinental Margins -- History, structure, and sedimentologic record: AmericanAssociation of Petroleum Geologists Education Course Note Series 19, p. 1-1 to 1-48.
Barrett, J.R., Jr., 1965, Subsurface currents off Cape Hatteras: Deep Sea Research, v. 12,p. 173-184.
Bird, K.J., and Magoon, L.B., 1987, Petroleum geology of the northern part of the ArcticNational Wildlife Refuge, Northeastern Alaska: U.S. Geological Survey Bulletin1778, 324 p.
Bouma, A.H., 1982, Intraslope basins of the Gulf of Mexico: A key to ancient submarinecanyons and fans, in Watkins, J.S., and Drake, C.L., eds., Studies in ContinentalMargin Geology: American Association of Petroleum Geologists Memoir 34, p.567-581.
Brooks, J.M., Anderson, A.L., Sassen, R., MacDonald, I.R., Kennicutt, M.C., andGuinasso, N.L., Jr., 1994, Hydrate occurrences in shallow subsurface cores fromcontinental slope sediments, in Sloan, E.D. Jr., Happel, J., and Hnatow, M.A., eds.,International Conference on Natural Gas Hydrates: Annals of the New YorkAcademy of Sciences, v. 715, p. 381-391.
Brooks, J.M., Barnard, L.A., Wiesenburg, D.A., Kennicutt, M.C., and Kvenvolden, K.A.,1983, Molecular and isotopic composition of hydrocarbons at Site 533, Deep SeaDrilling Project Leg 76, in Sheridan, R.E., Gradstein, F.M., and others, InitialReports of the Deep Sea Drilling Project, College Station, Texas, v. 76, p. 367-375.
Brooks, J.M., Cox, B.H., Bryant, W.R., Kennicutt, M.C., Mann, R.G., McDonald, T.J.,1986, Association of gas hydrates and oil seepage in the Gulf of Mexico: OrganicGeochemistry, v. 10, p. 221-234.
Brooks, J.M., Field, M.E., and Kennicutt, M.C., 1991, Observations of gas hydrates inmarine sediments, offshore northern California: Marine Geology, v. 96, p. 103-109.

51
Carlson, P.R., Golan-Bac, Margaret, Karl, H.A., and Kvenvolden, K.A., 1985, Seismicand geochemical evidence for shallow gas in sediment on Navarin continentalmargin, Bering Sea: American Association of Petroleum Geologists Bulletin, v. 69,no. 3, p. 422-436.
Carman, G.J., and Hardwick, Peter, 1983, Geology and regional setting of the Kuparukoil field, Alaska: American Association of Petroleum Geologists Bulletin, v. 67, no.6, p. 1014-1031.
Cherskiy, N.V., Tsarev, V.P., and Nikitin, S.P., 1985, Investigation and prediction ofconditions of accumulation of gas resources in gas-hydrate pools: PetroleumGeology, v. 21, p. 65-89.
Collett, T.S., 1983, Detection and evaluation of natural gas hydrates from well logs,Prudhoe Bay, Alaska, in Proceedings of the Fourth International Conference onPermafrost, Fairbanks, Alaska: Washington D.C., National Academy of Sciences, p.169-174.
Collett, T.S., 1993a, Natural gas hydrates of the Prudhoe Bay and Kuparuk River area,North Slope, Alaska: American Association of Petroleum Geologists Bulletin, v. 77,no. 5, p. 793-812.
Collett, T.S., 1993b, Natural gas production from Arctic gas hydrates, in Howell, D.G.,ed., The Future of Energy Gases: U.S. Geological Survey Professional Paper 1570,p. 299-312.
Collett, T.S., Bird, K.J., Kvenvolden, K.A., and Magoon, L.B., 1988, Geologicinterrelations relative to gas hydrates within the North Slope of Alaska: U.S.Geological Survey Open-File Report 88-389, 150 p.
Collett, T.S., Kvenvolden, K.A., and Magoon, L.B., 1990, Characterization ofhydrocarbon gas within the stratigraphic interval of gas-hydrate stability on theNorth Slope of Alaska: Applied Geochemistry, v. 5,. p. 279-287.
Cooper, A.K., Scholl, D.W., Marlow, M.S., Childs, J.R., Redden, G.D., Kvenvolden, K.A.,and Stevenson, A.J., 1979, Hydrocarbon potential of Aleutian Basin, Bering Sea:American Association of Petroleum Geologist Bulletin, v. 63, no. 11, p. 2070-2087.
Crovelli, A.C., and Balay, R.H., 1990, FASPU english and metric version: analyticpetroleum resource appraisal microcomputer programs for play analysis using areservoir-engineering model: U.S. Geological Survey Open-File Report 90-509, 23p.
52
Deming, David, Sass, J.H., Lachenbruch, A.H., and DeRito, R.F., 1992, Heat flow andsubsurface temperature as evidence for basin-scale ground water flow, NorthSlope of Alaska: Geological Society of America Bulletin, v. 104, no. 5, p. 528-542.
Dillon, W.P., Lee, M.W., Fehlhaber, K., and Coleman, D.F., 1993, Gas hydrates on theAtlantic continental margin of the United States -- Controls on concentration, inHowell, D.G., ed., The Future of Energy Gases: U.S. Geological Survey ProfessionalPaper 1570, p. 313-330.
Dobrynin, V.M., Korotajev, Yu. P., and Plyuschev, D.V., 1981, Gas hydrates--A possibleenergy resource, in Meyer, R.F., and Olson, J.C., eds., Long-Term EnergyResources: Boston, Pitman, Publishers, p. 727-729.
Dolton, G.D., Bird, K.J., and Crovelli, R.A., 1987, Assessment of in-place oil and gasresources, in Bird, K.J., and Magoon, L.B., eds., Petroleum Geology of the NorthernPart of the Arctic National Wildlife Refuge, Northeastern Alaska: U.S. GeologicalSurvey Bulletin 1778, p. 277-298.
Dolton, G.L., Gautier, D.L., Mast, R.F., and Root, D.H., 1993, U.S. Geological Surveyestimates of natural-gas energy resources, in Howell, D.G., ed., The Future ofEnergy Gases: U.S. Geological Survey Professional Paper 1570, p. 495-505.
Drummond, K.J., 1986, Energy-resources map of the circum-pacific region, northeastquadrant: American Association of Petroleum Geologists, [available throughAmerican Association of Petroleum Geologists Bookstore, Tulsa, Oklahoma], 1plate.
Field, M.E., and Kvenvolden, K.A., 1985, Gas hydrates on the northern Californiacontinental margin: Geology, v.13, p. 517-520.
Finley, P.D., and Krason, J., 1988, Geological evolution and analysis of confirmed orsuspected gas hydrate locations -- Basin analysis, formation and stability of gashydrates of the Beaufort Sea: U.S. Department of Energy Publication,DOE/MC/21181-1950, v. 12, 227p.
Finley, P.D., 1989, Evaluation of geological relations to gas hydrate formation andstability -- Summary report: U.S. Department of Energy Publication,DOE/MC/21181-1950, v. 15, 111 p.
Foster, T.D., 1962, Heat-flow measurements in the northeastern Pacific and in the BeringSea: Journal of Geophysical Research, v. 67, no. 7, p. 2991-2993.
Fuglister, F.C., 1960, Atlantic Ocean atlas of temperature and salinity profiles and datafrom the International Geophysical Year of 1957-1958: Woods Hole, Mass., WoodsHole Oceanographic Institution, 209 p.

53
Geothermal Survey of North America Subcommittee, 1976, Geothermal gradient map ofNorth America: American Association of Petroleum Geologists and U.S.Geological Survey, [available through U.S. Geological Survey, Reston, Va.], 2plates.
Gerard, R., Langseth, M.G., and Ewing, M., 1962, Thermal gradient measurements inthe water and bottom sediment of the western Atlantic: Journal of GeophysicalResearch, v. 67, no. 2, p. 785-803.
Ginsburg, G.D., Guseinov, R.A., Dadashev, A.A., Ivanova, G.A., Kazantsev, S.A.,Soloviev, V.A., Telepnev, Ye.V., Askery-Nasirov, R.E., Yesikov, A.D., Mal'tseva,V.I., Mashirov, Yu.G., and Shabayeva, I.Yu., 1992, Gas hydrates in the southernCaspian Sea: Izvestiya Akademii Nauk Serya Geologisheskaya, v. 7, p. 5-20.
Ginsburg, G.D., Soloviev, V.A., Cranston, R.E., Lorenson, T.D., and Kvenvolden, K.A.,1993, Gas hydrates from the continental slope, offshore from Sakhalin Island,Okhotsk Sea: Geo-Marine Letters, v. 13, p. 41-48.
Grantz, Arthur, Dinter, D.A., Hill, E.R., May, S.D., McMullin, R.H., Phillips, R.L., andReimnitz, Erk., 1982, Geologic framework, hydrocarbon potential, andenvironmental conditions for exploration and development of proposed oil andgas lease sale 87 in the Beaufort and northeast Chukchi Seas -- A summary report:U.S. Geological Survey Open-File Report 82-482, 71 p.
Grantz, Arthur, Holmes, M.L., and Kososki, B.A., 1975, Geologic framework of theAlaskan continental terrace in the Chukchi and Beaufort Seas, in Yorath, C.J.,Parker, E.R., and Glass, D.J., eds., Canada's Continental Margins and OffshorePetroleum Exploration: Canadian Society of Petroleum Geologists Memoir 4, p.669-700.
Grantz, Arthur, and May, S.D., 1984, Rifting and structural development of thecontinental margin north of Alaska, in Watkins, J.S., and Drake, C.L., eds., Studiesin Continental Margin Geology: American Association of Petroleum GeologistMemoir 34, p. 77-100.
Gryc, George, 1988, Geology and exploration of the National Petroleum Reserve inAlaska, 1974 to 1982: U.S. Geological Survey Professional Paper 1399, 940 p.
Hedberg, H.D., 1980, Methane generation and petroleum migration, in Roberts, W.H.,and Cordell, R.J., eds., Problems of Petroleum Migration: American Association ofPetroleum Geologists Studies in Geology, no. 10, p. 179-206.
Holder, G.D., Malone, R.D., Lawson, W.F., 1987, Effects of gas composition andgeothermal properties on the thickness and depth of natural-gas-hydrate zone:Journal of Petroleum Technology, September, p.1147-1152.

54
Howitt, Frank, 1971, Permafrost geology at Prudhoe Bay, Alaska: World Petroleum, v.42, no. 8, p. 28-38.
Hunt, J.M., Whelan, J.K., Eglinton, L.B., and Cathles, L.M., 1994, Gas generation -- Amajor cause of deep Gulf Coast overpressures: Oil and Gas Journal, July, p. 63-68.
Judge, A.S., 1988, Mapping the distribution and properties of natural gas hydrates inCanada: Proceedings of the American Chemical Society Third Chemical Congressof the North American Continent, June 6-7, Toronto, Ontario, Abstract no. 29.
Judge, A.S., and Majorowicz, J.A., 1992, Geothermal conditions for gas hydrate stabilityin the Beaufort-Mackenzie area: The global change aspect: Global and PlanetaryChange, v. 98, no. 2/3, p. 251-263.
Krason, J., and Ciesnik, M.S., 1986, Geological evolution and analysis of confirmed orsuspected gas hydrate locations -- Basin analysis, formation and stability of gashydrates in the northern California offshore: U.S. Department of EnergyPublication, DOE/MC/21181-1950, v. 8, 53 p.
Krason, J., and Ciesnik, M.S., 1987, Geological evolution and analysis of confirmed orsuspected gas hydrate locations -- Basin analysis, formation and stability of gashydrates of the Aleutian Trench and the Bering Sea: U.S. Department of EnergyPublication, DOE/MC/21181-1950, v. 10, 152 p.
Krason, J., Finley, P. and Rudloff, B., 1985, Geological evolution and analysis ofconfirmed or suspected gas hydrate locations -- Basin analysis, formation andstability of gas hydrates in the western Gulf of Mexico: U.S. Department of EnergyPublication, DOE/MC/21181-1950, v. 3, 167 p.
Krason, J., and Ridley, W.I., 1985a, Geological evolution and analysis of confirmed orsuspected gas hydrate locations -- Blake Bahama Outer Ridge-U.S. East Coast: U.S.Department of Energy Publication, DOE/MC/21181-1950, v. 1, 98 p.
Krason, J., and Ridley, W.I., 1985b, Geological evolution and analysis of confirmed orsuspected gas hydrate locations -- Baltimore Canyon Trough and Environs-U.S.East Coast: U.S. Department of Energy Publication, DOE/MC/21181-1950, v. 2,102 p.
Kvenvolden, K.A., 1987, Gas hydrates offshore Alaska and western continental UnitedStates, in Scholl, D.W., Grantz, Arthur, and Vedder, J.G., eds., Geology andResource Potential of the Continental Margin of Western North America andAdjacent Ocean Basins -- Beaufort Sea to Baja California: Circum-Pacific Councilfor Energy and Mineral Resources Earth Science Series, v. 6, p. 581-593.
Kvenvolden, K.A., 1988, Methane hydrate--A major reservoir of carbon in the shallowgeosphere?: Chemical Geology, v. 71, p. 41-51.

55
Kvenvolden, K.A., 1993, Gas hydrates as a potential energy resource -- A review of theirmethane content, in Howell, D.G., ed., The Future of Energy Gases: U.S. GeologicalSurvey Professional Paper 1570, p. 555-561.
Kvenvolden, K.A., and Barnard, L.A., 1983, Hydrates of natural gas in continentalmargins, in Watkins, J.S., and Drake, C.L., eds., Studies in Continental MarginGeology: American Association of Petroleum Geologists Memoir 34, p. 631-641.
Kvenvolden, K.A., and Claypool, G.E., 1988, Gas hydrates in oceanic sediment: U.S.Geological Survey Open-File Report 88-216, 50 p.
Kvenvolden, K.A., and Kastner, M., 1990, Gas hydrates of the Peruvian outercontinental margin, in Suess, E., von Huene, R., and others, Proceedings, OceanDrilling Program, Scientific Results, College Station, Texas, v. 112, p. 517-526.
Kvenvolden, K.A., McDonald, T.J., 1985, Gas hydrates of the Middle America Trench,Deep Sea Drilling Project Leg 84, in von Huene, R., Aubouin, J., and others, InitialReports Deep Sea Drilling Project, Washington, D.C., U.S. Government PrintingOffice, v. 84, p. 667- 682.
Kvenvolden, K.A., and von Huene, Roland, 1986, Natural gas generation in sedimentsof the convergent margin of the eastern Aleutian Trench area, in Howell, D.G., ed.,Tectonostratigraphic Terranes of the Circum-Pacific Region: Circum-PacificCouncil for Energy and Mineral Resources Earth Science Series, no. 1, p. 31-49.
Lachenbruch, A.H., Sass, J.H., Lawver, L.A., Brewer, M.C., Marshall, B.V., Munroe, R.J.,Kennelly, J.P., Jr., Galanis, S.P., Jr., and Moses, T.H., Jr., 1987, Temperature anddepth of permafrost on the Alaskan North Slope, in Tailleur, I.L., and Weimer,Paul, eds., Alaskan North Slope Geology: Bakersfield, California, Pacific Section,Society of Economic Paleontologists and Mineralogists and the Alaska GeologicalSociety, Book 50, v. 2, p. 545-558.
Langseth, M.G., von Herzen, R.P., 1970, Heat flow through the floor of the worldoceans, chapter 9, in Maxwell, A.E., ed., The Sea, v. 4: New York, Wiley-Interscience, p. 299-352.
Lee, W.H.K., and Cox, C.S., 1966, Time variation of oceanic temperatures and itsrelation to internal waves and oceanic heat flow measurements: Journal ofGeophysical Research, v. 71, no. 8, p. 2101-2111.
Lee, M.W., Hutchinson, D.R., Dillon, W.P., Miller, J.J., Agena, W.F., and Swift, B.A.,1993, Method of estimating the amount of in situ gas hydrates in deep marinesediments: Marine and Petroleum Geology, v. 10, p. 493-506.
56
Lerand, M., 1973, Beaufort Sea, in McCrossan, R.G., ed., Future petroleum provinces ofCanada--Their geology and potential: Canadian Society of Petroleum GeologistsMemoir 1, p. 315-386.
MacDonald, G.T., 1990, The future of methane as an energy resource: Annual Review ofEnergy, v. 15, p. 53-83.
MacLeod, M.K., 1982, Gas hydrates in ocean bottom sediments: American Associationof Petroleum Geologists Bulletin, v. 66, no. 12, p. 2649-2662.
Makogon, Y.F., 1981, Hydrates of natural gas: Tulsa, Penn Well Publishing Company,237 p.
Makogon, Y.F., Trebin, F.A., Trofimuk, A.A., Tsarev, V.P., and Cherskiy, N.V., 1972,Detection of a pool of natural gas in a solid (hydrate gas) state: Doklady Academyof Sciences U.S.S.R., Earth Science Section, v. 196, p. 197-200.
Marlow, M.S., Carson, P., Cooper, A.K., Karl, H., McLean, H., McMullin, R., and Lynch,M.B., 1981, Hydrocarbon resource report for proposed OCS sale number 83,Navarin Basin, Alaska: U.S. Geological Survey Open-File Report 81-252, 83 p.
Masters, C.D., Root, D.H., and Attanasi, E.D., 1991, Resource constraints in petroleumproduction potential: Science, v. 253, p. 146-152.
McCarthy, Jill, Stevenson, A.J., Scholl, D.W., and Vallier, T.L., 1984, Speculations on thepetroleum geology of the accretionary body: An example from the centralAleutians: Marine and Petroleum Geology, v. 1, p. 151-167.
McIver, R.D., 1981, Gas hydrates, in Meyer, R.F., and Olson, J.C., eds., Long-TermEnergy Resources: Boston, Pitman, p. 713-726.
Meyer, R.F., 1981, Speculations on oil and gas resources in small fields andunconventional deposits, in Meyer, R.F., and Olson, J.C., eds., Long-Term EnergyResources: Boston, Pitman, p. 49-72.
Navy Hydrographic Office, 1958, Oceanographic atlas of the Polar Seas, Part II Arctic:U.S. Navy Hydrographic Office, Publication 705, 220 p.
Naval Oceanographic Office, 1967, Oceanographic atlas of the north Atlantic Ocean,Section II physical properties: U.S. Naval Oceanographic Office, Publication 700,219 p.
Paull, C.K., Ussler, W. III, and Borowaki, W.S., 1994, Sources of biogenic methane toform marine gas hydrates -- In-situ production or upward migration, in Sloan, E.D.

57
Jr., Happel, J., and Hnatow, M.A., eds., International Conference on Natural GasHydrates: Annals of the New York Academy of Sciences, v. 715, p. 392-409.
Premuzic, E.T., 1980, Organic carbon and nitrogen in the surface sediments of worldoceans and seas -- Distribution and relationship to bottom topography:Brookhaven National Laboratory, BNL Report 51084, p. 1-118.
Premuzic, E.T., Benkovitz, C.M., Gaffney, J.S., and Walsh, J.J., 1982, The nature anddistribution of organic matter in the surface sediments of world oceans and seas:Organic Geochemistry, v. 4, p. 63-77.
Rice, D.D., 1993, Biogenic gas -- Controls, habitats, and resource potential, in Howell,D.G., ed., The Future of Energy Gases: U.S. Geological Survey Professional Paper1570, p. 583-606.
Scholl, D.W., and Hart, P.E., 1993, Velocity and amplitude structures on seismic-reflection profiles -- Possible massive gas-hydrate deposits and underlying gasaccumulations in the Bering Sea Basin, in Howell, D.G., ed., The Future of EnergyGases: U.S. Geological Survey Professional Paper 1570, p. 331-351.
Schroeder, E.H., 1963, North Atlantic Temperatures at a depth of 200 meters, inWebster, W., ed., Serial Atlas of the Marine Environment: New York, AmericanGeographical Society, Folio 2, Plates 2 and 3.
Schweitzer, P.N., 1993, Modern average global sea-surface temperature: U.S. GeologicalSurvey Digital Data Series DDS-10, 1 CD-ROM.
Shipboard Scientific Party, 1970, Sites 32-43, in McManus, D.A., and others,Proceedings, Deep Sea Drilling Project, Initial Reports, Washington D.C., U.S.Government Printing Office, v. 5, p. 3-420.
Shipboard Scientific Party, 1972, Sites 102, 103, 104, in Hollister, C.D., and others,Proceedings, Deep Sea Drilling Project, Initial Reports, Washington D.C., U.S.Government Printing Office, v. 11, p. 135-218.
Shipboard Scientific Party, 1973a, Sites 85-97, in Worzel, J.L., and others, Proceedings,Deep Sea Drilling Project, Initial Reports, Washington D.C., U.S. GovernmentPrinting Office, v. 10, p. 3-336.
Shipboard Scientific Party, 1973b, Sites 172-182, in Kulm, L.D., and others, Proceedings,Deep Sea Drilling Project, Initial Reports, Washington D.C., U.S. GovernmentPrinting Office, v. 18, p. 5-514.

58
Shipboard Scientific Party, 1973c, Sites 183-192, in Creager, J.S., and others, Proceedings,Deep Sea Drilling Project, Initial Reports, Washington D.C., U.S. GovernmentPrinting Office, v. 19, p. 3-566.
Shipboard Scientific Party, 1978, Sites 388-394, in Benson, W.E., and others, Proceedings,Deep Sea Drilling Project, Initial Reports, Washington D.C., U.S. GovernmentPrinting Office, v. 44, p. 3-410.
Shipboard Scientific Party, 1979, Sites 382-387, in Tucholke, B.E., and others,Proceedings, Deep Sea Drilling Project, Initial Reports, Washington D.C., U.S.Government Printing Office, v. 43, p. 3-392.
Shipboard Scientific Party, 1980, Site 533 and 534, in Sheridan, R.E., and others,Proceedings, Deep Sea Drilling Project, Initial Reports, Washington D.C., U.S.Government Printing Office, v. 76, p. 35-80.
Shipboard Scientific Party, 1981, Sites 467-469, in Yeats, R.S., and others, Proceedings,Deep Sea Drilling Project, Initial Reports, Washington D.C., U.S. GovernmentPrinting Office, v. 63, p. 3-226.
Shipboard Scientific Party, 1986a, Sites 614-624, in Bouma, A.H., and others,Proceedings, Deep Sea Drilling Project, Initial Reports, Washington D.C., U.S.Government Printing Office, v. 96, p. 3-424.
Shipboard Scientific Party, 1986b, Legs 101 and 102, in Austin, J.A., and others,Proceedings, Ocean Drilling Program, Initial Reports, College Station, Texas, v.101/102, p. 5-558.
Shipboard Scientific Party, 1990, Site 796, in Tamake, K., and others, Proceedings, OceanDrilling Program, Initial Reports, College Station, Texas, v. 127, p. 247-322.
Shipboard Scientific Party, 1991, Site 808, in Taira, A., and others, Proceedings, OceanDrilling Program, Initial Reports, College Station, Texas, v. 131, p. 71-269.
Shipboard Scientific Party, 1992, Sites 855-858, in Davis, E.E., and others, Proceedings,Ocean Drilling Program, Initial Reports, College Station, Texas, v. 139, p. 5-572.
Shipboard Scientific Party, 1993, Sites 881-887, in Rea, D.K., and others, Proceedings,Ocean Drilling Program, Initial Reports, College Station, Texas, v. 145, p. 5-394.
Shipboard Scientific Party, 1994, Site 892, in Westbrook, G.K., and others, Proceedings,Ocean Drilling Program, Initial Reports, College Station, Texas, v. 146, p. 301-375.
59
Shipley, T.H., and Didyk, B.M., 1982, Occurrence of methane hydrates offshore Mexico,in Watkins , J.S., Moore, J.C., and others, Initial Reports, Deep Sea Drilling Project:Washington D.C., U.S. Government Printing Office, v. 66, p. 547-555.
Shipley, T.H., Houston, M.H., Buffler, R.T., Shaub, F.J., McMillen, K.J., Ladd, J.W., andWorzel, J.L., 1979, Seismic evidence for widespread possible gas hydrate horizonson continental slopes and rises: American Association of Petroleum GeologistsBulletin, v. 63, no. 12, p. 2204-2213.
Singh, S.C., Minshull, T.A., and Spence, G.D., 1993, Velocity structure of a gas hydratereflector: Science, v. 260, p. 204-207.
Sloan, E.D., 1990, Clathrate hydrates of natural gases: New York, Marcel Dekker, Inc.,641 p.
Tissot, B.P., and Welte, D.H., 1978, Petroleum formation and occurrence: New York,Springer-Verlag, 538 p.
Tomoaki, S., 1992, Energy-resources map of the circum-pacific region, northwestquadrant: American Association of Petroleum Geologists and U.S. GeologicalSurvey, [available through the U.S. Geological Survey, Reston, Va.], Circum-PacificMap Series, CP-40, 1 plate.
Trofimuk, A.A., Cherskiy, N.V., and Tsarev, V.P., 1977, The role of continentalglaciation and hydrate formation on petroleum occurrences, in Meyer, R.F., ed.,Future Supply of Nature-Made Petroleum and Gas: New York, Pergamon Press, p.919-926.
Tucholke, B.E., Bryan, G.M., and Ewing, J.I., 1977, Gas-hydrate horizons detected inseismic-profiler data from the western North Atlantic: American Association ofPetroleum Geologists Bulletin, v. 61, no. 5, p. 698-707.
Tucholke, B.E., Houtz, R.E., and Ludwig, W.J., 1982, Isopach map of sediments in thewestern North Atlantic Ocean: American Association of Petroleum Geologists,[available through The American Association of Petroleum Geologists Bookstore,Tulsa, Okla.], 2 plates.
Werner, M.R., 1987, Tertiary and Upper Cretaceous heavy oil sands, Kuparuk Riverarea, Alaskan North Slope, in Tailleur, I.L., and Weimer, Paul, eds., Alaskan NorthSlope Geology: Bakersfield, Calif., Pacific Section, Society of EconomicPaleontologists and Mineralogists and the Alaska Geological Society, Book 50, v. 1,109-118.

60
Wiese, K., and Kvenvolden, K.A., 1993, Introduction to microbial and thermal methane,in Howell, D.G., ed., The Future of Energy Gases: U.S. Geological SurveyProfessional Paper 1570, p. 13-20.
Wilhelm, O., and Ewing, M., 1972, Geology and history of the Gulf of Mexico:Geological Society of America Bulletin, v. 83, p. 575-600.
Yamano, M., Uyeda, S., Aoki, Y., and Shipley, T.H., 1982, Estimates of heat flow derivedfrom gas hydrates: Geology, v. 10, p. 339-343.
Yefremova, A.G., and Zhizhchenko, B.P., 1974, Occurrence of crystal hydrates of gas insediments of modern marine basins: Doklady Akademii Nauk SSSR, v. 214, p.1179-1181.
Zwart, G., 1993, Variations in temperature gradient of the Oregon accretionary prism:EOS Transactions, American Geophysical Union, v. 74, no. 43, p. 369.

61
FIGURE AND TABLE CAPTIONS
Table 1 World estimates of the amount of methane in gas hydrates of continentaland oceanic settings (modified from Kvenvolden, 1993).
Table 2 Estimates of the in-place gas resources within the gas hydrates of theUnited States.
Figure 1. Arbitrary examples of different depth-temperature zones in which gashydrates are stable: A, a permafrost region; and B, an outer continentalmargin setting (modified from Kvenvolden, 1988).
Figure 2. Two gas hydrate crystal structures: A, Structure I; and B, Structure II (modifiedfrom Sloan, 1990).
Figure 3A. Graph showing the depth-temperature zone in which gas hydrates arestable in a permafrost region [assuming a 9.048 kPa/m pore-pressuregradient] (modified from Holder and others, 1987).
Figure 3B. Graph showing the depth-temperature zone in which gas hydrates arestable in a permafrost region [assuming a 9.795 kPa/m pore-pressuregradient] (modified from Holder and others, 1987).
Figure 3C. Graph showing the depth-temperature zone in which gas hydrates arestable in a permafrost region [assuming a 11.311 kPa/m pore-pressuregradient] (modified from Holder and others, 1987).
Figure 4. Gas hydrate assessment data form used to estimate the volume of naturalgas trapped within a gas hydrate play. S3 = Cumulative microbialhydrocarbon source probability, GS = Hydrocarbon source play attribute.
Figure 5. Gas hydrate play map for the United States.
Figure 6. Northeastern Atlantic Ocean play. A, Assessment data form. B, Estimatednatural gas resources.
Figure 7. Southeastern Atlantic Ocean play. A, Assessment data form. B, Estimatednatural gas resources.
Figure 8. Gulf of Mexico play. A, Assessment data form. B, Estimated natural gasresources.
Figure 9. Northern Pacific Ocean play. A, Assessment data form. B, Estimatednatural gas resources.

62
Figure 10. Southern Pacific Ocean play. A, Assessment data form. B, Estimatednatural gas resources.
Figure 11. Beaufort Sea play. A, Assessment data form. B, Estimated natural gasresources.
Figure 12. Bering Sea play. A, Assessment data form. B, Estimated natural gasresources.
Figure 13. Aleutian Trench play. A, Assessment data form. B, Estimated natural gasresources.
Figure 14. Gulf of Alaska play. A, Assessment data form. B, Estimated natural gasresources.
Figure 15. Topset play. A1, Assessment data form for the onshore State lands andwaters portion of the play. A2, Assessment data form for the offshoreFederal waters portion of the play. B1, Estimated natural gas resourceswithin the onshore State lands and waters portion of the play. B2,Estimated natural gas resources within the offshore Federal watersportion of the play.
Figure 16. Fold Belt play. A1, Assessment data form for the onshore State lands andwaters portion of the play. A2, Assessment data form for the offshoreFederal waters portion of the play. B1, Estimated natural gas resourceswithin the onshore State lands and waters portion of the play. B2,Estimated natural gas resources within the offshore Federal watersportion of the play.
Figure 17. Cumulative probability curve showing the estimated in-place gasresources within the gas hydrates of the United States. The curve is readas follows: there is a 95 percent chance that the gas hydrate resourcepotential is greater than 112,765 trillion cubic feet of gas (TCFG), and thereis a 5 percent chance that the gas hydrate resource is greater than 676,110trillion cubic feet of gas (TCFG).

63
CONTENTSPage
Introduction Geologic Controls on Gas Hydrate Distribution Assessment Method Province and Play Descriptions Estimates of In-Place Resources References Cited
FIGURESFigure 1. Gas hydrate stability diagrams
2. Gas hydrate crystal structures 3. Permafrost environment gas hydrate stability diagrams 4. Gas hydrate assessment data form 5. Gas hydrate play map 6. Northeastern Atlantic Ocean play gas hydrate assessment 7. Southeastern Atlantic Ocean play gas hydrate assessment 8. Gulf of Mexico play gas hydrate assessment 9. Northern Pacific Ocean play gas hydrate assessment
10. Southern Pacific Ocean play gas hydrate assessment 11. Beaufort Sea play gas hydrate assessment 12. Bering Sea play gas hydrate assessment 13. Aleutian Trench play gas hydrate assessment 14. Gulf of Alaska play gas hydrate assessment 15. Alaska Topset play gas hydrate assessment 16. Alaska Fold Belt play gas hydrate assessment 17. United States gas hydrate resources
TABLESTable 1. World gas hydrate resources
2. United States gas hydrate resources
64
PLATES
1. Bathymetric map of the Atlantic Ocean and Gulf of Mexico provinces
2. Sediment thickness map of the Atlantic Ocean and Gulf of Mexico provinces
3. Map of the total organic carbon content of the surficial sediments in the Atlantic
Ocean and Gulf of Mexico provinces
4. Seabed temperature map of the Atlantic Ocean and Gulf of Mexico provinces
5. Geothermal-gradient map of the Atlantic Ocean and Gulf of Mexico provinces
6. Gas-hydrate stability zone thickness map for the Atlantic Ocean and Gulf of
Mexico provinces
7. Map of the Northeastern Atlantic Ocean, Southeastern Atlantic Ocean, and Gulf of
Mexico gas hydrate plays
8. Bathymetric map of the Pacific Ocean province
9. Sediment thickness map of the Pacific Ocean province
10. Map of the total organic carbon content of the surficial sediments in the Pacific
Ocean province
11. Seabed temperature map of the Pacific Ocean province
12. Geothermal-gradient map of the Pacific Ocean province
13. Gas-hydrate stability zone thickness map for the Pacific Ocean province
14. Map of the Northern Pacific Ocean and Southern Pacific Ocean gas hydrate plays
15. Bathymetric map of the Alaska Offshore province
16. Sediment thickness map of the Alaska Offshore province
17. Map of the total organic carbon content of the surficial sediments in the Alaska
Offshore province
18. Seabed temperature map of the Alaska Offshore province
19. Geothermal-gradient map of the Alaska Offshore province
20. Gas-hydrate stability zone thickness map for the Alaska Offshore province

65
21. Map of the Beaufort Sea, Bering Sea, Aleutian Trench, and Gulf of Alaska gas
hydrate plays
22. Gas-hydrate stability zone thickness map for the Alaska Onshore province
23. Map of the Alaska Topset and Fold Belt gas hydrate plays

66
Table 1.--World estimates of the amount of methane in gas hydrates of continental andoceanic settings (modified from Kvenvolden, 1993).
Continental Gas Hydrates
Estimated in-place natural gas resources Reference (trillion cubic feet) (cubic meters)
5.0 x 10² 1.4 x 10¹³ Meyer (1981)1.1 x 10³ 3.1 x 10¹³ McIver (1981)2.0 x 10³ 5.7 x 10¹³ Trofimuk and others (1977)2.6 x 10⁴ 7.4 x 10¹⁴ MacDonald (1990)1.2 x 10⁶ 3.4 x 10¹⁶ Dobrynin and others (1981)
Oceanic Gas Hydrates
Estimated in-place natural gas resources Reference (trillion cubic feet) (cubic meters)
1.1 x 10⁵ 3.1 x 10¹⁵ McIver (1981)1.8 to 8.8 x 10⁵ 5 to 25 x 1015 Trofimuk and others (1977)
7 x 10⁵ 2 x 10¹⁶ Kvenvolden (1988)7.4 x 10⁵ 2.1 x 10¹⁶ MacDonald (1990)1.4 x 10⁶ 4 x 10¹⁶ Kvenvolden and Claypool
(1988)2.7 x 10⁸ 7.6 x 10¹⁸ Dobrynin and others (1981)

67
Remaining Recoverable Conventional Natural Gas
Estimated in-place natural gas resources Reference (trillion cubic feet) (cubic meters)
9 x 10³ 2.5 x 10¹⁴ Masters and others (1991)

68
Table 2.--Estimates of the in-place gas resources within the gas hydrates of the UnitedStates
ESTIMATED IN-PLACE NATURAL GAS RESOURCES (TRILLIONS OF FT3)
PROVINCES/PLAYS MEAN F95 F75 F50 F25 F5
Atlantic Ocean ProvinceNortheastern Atlantic Ocean play 30,251 0 0 14,128 49,448 109,491Southeastern Atlantic Ocean play 21,580 6,464 11,656 17,660 27,196 49,448
Gulf of Mexico ProvinceGulf of Mexico play 38,251 11,444 20,839 31,435 49,448 88,300
Pacific Ocean ProvinceNorthern Pacific play 53,721 16,035 29,315 45,916 67,108 123,619Southern Pacific play 7,350 0 0 0 0 63,576
Alaska Offshore provinceBeaufort Sea play 32,304 0 0 15,188 52,980 116,555Bering Sea play 73,289 0 0 34,613 120,087 264,899Aleutian Trench play 21,496 0 0 0 0 183,663Gulf of Alaska play 41,360 0 0 0 0 257,835
OFFSHORE PROVINCES TOTAL 319,632 112,346 190,709 275,482 397,936 675,503 Table 2.--Estimates of the in-place gas resources within the gas hydrates of the UnitedStates
(Continued)
ESTIMATED IN-PLACE NATURAL GAS RESOURCES (TRILLIONS OF FT3)
PROVINCES/PLAYS MEAN F95 F75 F50 F25 F5
Alaska Onshore provinceTopset play--State lands & waters 105 0 0 0 0 388Topset play--Federal waters 43 0 0 0 0 161Fold Belt play--State lands & waters 414 0 0 0 490 1,914Fold Belt play--Federal waters 28 0 0 0 33 128
ONSHORE PROVINCES TOTAL 590 0 0 236 668 2,357

69
UNITED STATES TOTAL 320,222 112,765 191,261 276,119 398,626 676,110

70
Figure 4.--Gas hydrate assessment data form used to estimate the volume of natural gas trapped within a gas hydrate play. S3= Cumulative microbial hydrocarbon source probability, GS = Hydrocarbon source play attribute.
Attribute Probability of Comments favorable
Play Microbial hydrocarbonAttrib. source (S1) S1 S1*S2=S3, if
S3=1 , then GS=1S3
Microbial source sediment S2 GS If S4=1, then GS=1thickness (S2) Use the > value
of S3 or 34Thermogenic hydrocarbon S4source (S4)
Timing (T) T
Migration (M)M
Potential reservoir facies (R) R
Marginal play probability (GS*T*M*R=MP) MP
Prosp. Trapping mechanism (TM) TMAttrib.
Effective porosity (>3%) (P) P
Hydrocarbon accumulation (C) C
Conditional deposit probability (TM*P*C=CP) CP GasVol. Attribute Probability of equal to or greater thanParam. 100 95 75 50 25 5 0
Volume or Area of hydratestability zone(1012m3 or 106m2)
Reservoir thickness innonmarine systems (m)
Effective porosity (%)

71
Hydrate saturation (%)
Hydrate gas yield (m3)
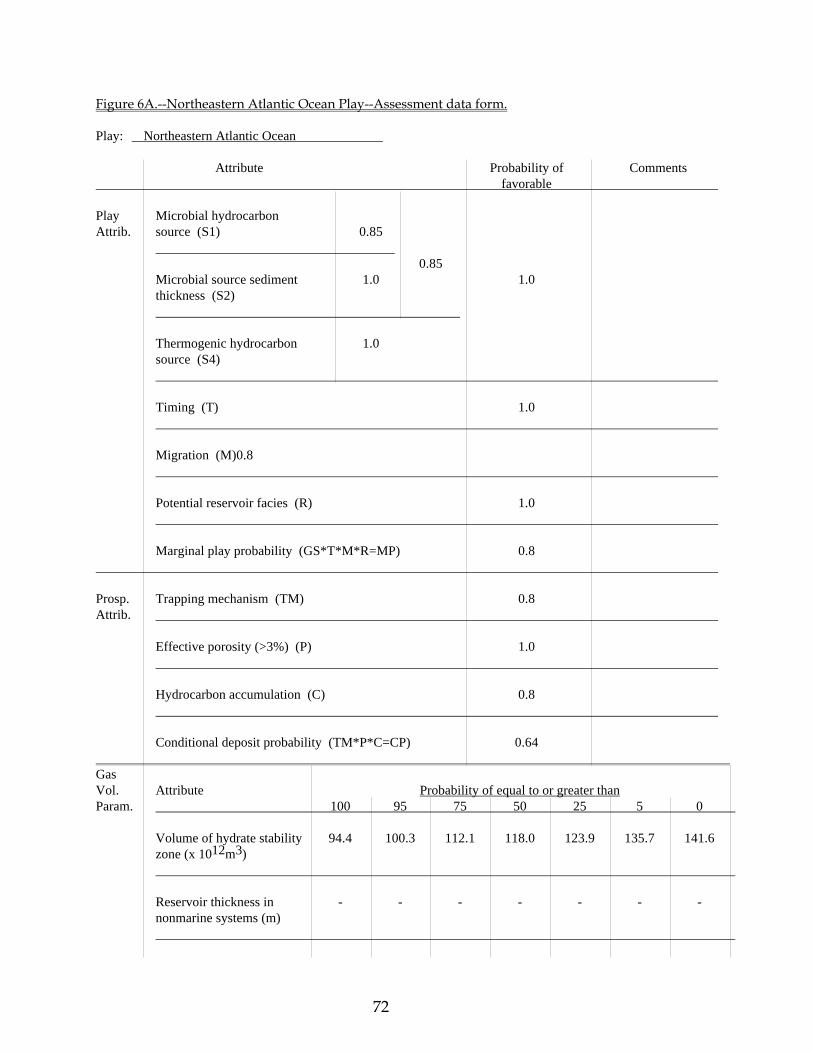
72
Figure 6A.--Northeastern Atlantic Ocean Play--Assessment data form.
Play: Northeastern Atlantic Ocean
Attribute Probability of Comments favorable
Play Microbial hydrocarbonAttrib. source (S1) 0.85
0.85
Microbial source sediment 1.0 1.0thickness (S2)
Thermogenic hydrocarbon 1.0source (S4)
Timing (T) 1.0
Migration (M)0.8
Potential reservoir facies (R) 1.0
Marginal play probability (GS*T*M*R=MP) 0.8
Prosp. Trapping mechanism (TM) 0.8Attrib.
Effective porosity (>3%) (P) 1.0
Hydrocarbon accumulation (C) 0.8
Conditional deposit probability (TM*P*C=CP) 0.64 GasVol. Attribute Probability of equal to or greater thanParam. 100 95 75 50 25 5 0
Volume of hydrate stability 94.4 100.3 112.1 118.0 123.9 135.7 141.6zone (x 1012m3)
Reservoir thickness in - - - - - - -nonmarine systems (m)
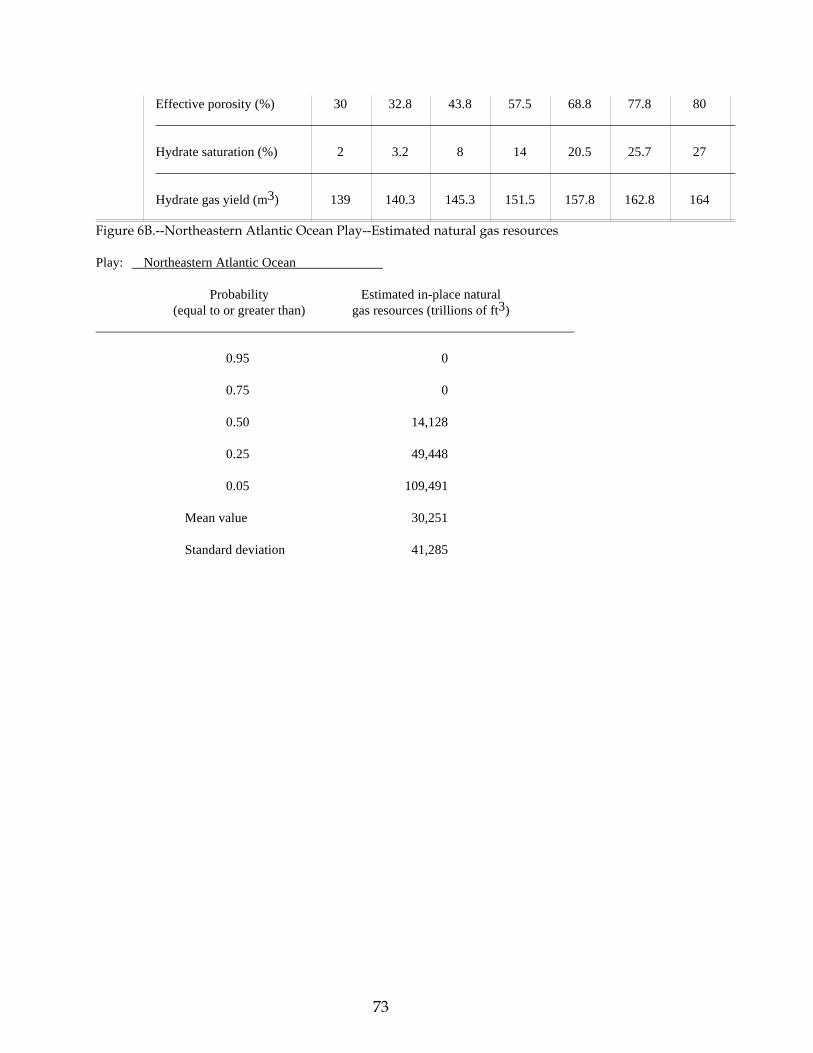
73
Effective porosity (%) 30 32.8 43.8 57.5 68.8 77.8 80
Hydrate saturation (%) 2 3.2 8 14 20.5 25.7 27
Hydrate gas yield (m3) 139 140.3 145.3 151.5 157.8 162.8 164 Figure 6B.--Northeastern Atlantic Ocean Play--Estimated natural gas resources
Play: Northeastern Atlantic Ocean
Probability Estimated in-place natural(equal to or greater than) gas resources (trillions of ft3)
0.95 0
0.75 0
0.50 14,128
0.25 49,448
0.05 109,491
Mean value 30,251
Standard deviation 41,285

74
Figure 7A.--Southeastern Atlantic Oc ean Play--Assessment data form.
Play: Southeastern Atlantic Ocean
Attribute Probability of Comments favorable
Play Microbial hydrocarbonAttrib. source (S1) 1.0
1.0
Microbial source sediment 1.0 1.0thickness (S2)
Thermogenic hydrocarbon 1.0source (S4)
Timing (T) 1.0
Migration (M)1.0
Potential reservoir facies (R) 1.0
Marginal play probability (GS*T*M*R=MP) 1.0
Prosp. Trapping mechanism (TM) 1.0Attrib.
Effective porosity (>3%) (P) 1.0
Hydrocarbon accumulation (C) 1.0
Conditional deposit probability (TM*P*C=CP) 1.0 GasVol. Attribute Probability of equal to or greater thanParam. 100 95 75 50 25 5 0
Volume of hydrate stability 34.5 36.6 40.9 43.1 45.3 49.6 51.7zone (x 1012m3)
Reservoir thickness in - - - - - - -nonmarine systems (m)

75
Effective porosity (%) 30 32.8 43.8 57.5 68.8 77.8 80
Hydrate saturation (%) 2 3.2 8 14 20.5 25.7 27
Hydrate gas yield (m3) 139 140.3 145.3 151.5 157.8 162.8 164 Figure 7B.--Southeastern Atlantic Ocean Play--Estimated natural gas resources.
Play: Southeastern Atlantic Ocean
Probability Estimated in-place natural(equal to or greater than) gas resources (trillions of ft3)
0.95 6,464
0.75 11,656
0.50 17,660
0.25 27,196
0.05 49,448
Mean value 21,580
Standard deviation 14,728

76
Figure 8A.--Gulf of Mexico Play--Assessment data form.
Play: Gulf of Mexico
Attribute Probability of Comments favorable
Play Microbial hydrocarbonAttrib. source (S1) 1.0
1.0
Microbial source sediment 1.0 1.0thickness (S2)
Thermogenic hydrocarbon 1.0source (S4)
Timing (T) 1.0
Migration (M)1.0
Potential reservoir facies (R) 1.0
Marginal play probability (GS*T*M*R=MP) 1.0
Prosp. Trapping mechanism (TM) 1.0Attrib.
Effective porosity (>3%) (P) 1.0
Hydrocarbon accumulation (C) 1.0
Conditional deposit probability (TM*P*C=CP) 1.0 GasVol. Attribute Probability of equal to or greater thanParam. 100 95 75 50 25 5 0
Volume of hydrate stability 61.1 64.9 72.6 76.4 80.2 87.9 91.7zone (x 1012m3)
Reservoir thickness in - - - - - - -nonmarine systems (m)

77
Effective porosity (%) 30 32.8 43.8 57.5 68.8 77.8 80
Hydrate saturation (%) 2 3.2 8 14 20.5 25.7 27
Hydrate gas yield (m3) 139 140.3 145.3 151.5 157.8 162.8 164 Figure 8B.--Gulf of Mexico Play--Estimated natural gas resources.
Play: Gulf of Mexico
Probability Estimated in-place natural(equal to or greater than) gas resources (trillions of ft3)
0.95 11,444
0.75 20,839
0.50 31,435
0.25 49,448
0.05 88,300
Mean value 38,251
Standard deviation 26,105

78
Figure 9A.--Northern Pacific Ocean Play--Assessment data form.
Play: Northern Pacific Ocean
Attribute Probability of Comments favorable
Play Microbial hydrocarbonAttrib. source (S1) 1.0
1.0
Microbial source sediment 1.0 1.0thickness (S2)
Thermogenic hydrocarbon 1.0source (S4)
Timing (T) 1.0
Migration (M)1.0
Potential reservoir facies (R) 1.0
Marginal play probability (GS*T*M*R=MP) 1.0
Prosp. Trapping mechanism (TM) 1.0Attrib.
Effective porosity (>3%) (P) 1.0
Hydrocarbon accumulation (C) 1.0
Conditional deposit probability (TM*P*C=CP) 1.0 GasVol. Attribute Probability of equal to or greater thanParam. 100 95 75 50 25 5 0
Volume of hydrate stability 85.8 91.2 101.9 107.3 112.7 123.4 128.8zone (x 1012m3)
Reservoir thickness in - - - - - - -nonmarine systems (m)

79
Effective porosity (%) 30 32.8 43.8 57.5 68.8 77.8 80
Hydrate saturation (%) 2 3.2 8 14 20.5 25.7 27
Hydrate gas yield (m3) 139 140.3 145.3 151.5 157.8 162.8 164 Figure 9B.--Northern Pacific Ocean Play--Estimated natural gas resources.
Play: Northern Pacific Ocean
Probability Estimated in-place natural(equal to or greater than) gas resources (trillions of ft3)
0.95 16,035
0.75 29,315
0.50 45,916
0.25 67,108
0.05 123,619
Mean value 53,721
Standard deviation 36,662

80
Figure 10A.--Southern Pacific Ocean Play--Assessment data form.
Play: Southern Pacific Ocean
Attribute Probability of Comments favorable
Play Microbial hydrocarbonAttrib. source (S1) 0.5
0.125
Microbial source sediment 0.25 0.125thickness (S2)
Thermogenic hydrocarbon 0.0source (S4)
Timing (T) 1.0
Migration (M)1.0
Potential reservoir facies (R) 1.0
Marginal play probability (GS*T*M*R=MP) 0.125
Prosp. Trapping mechanism (TM) 0.8Attrib.
Effective porosity (>3%) (P) 1.0
Hydrocarbon accumulation (C) 0.8
Conditional deposit probability (TM*P*C=CP) 0.64 GasVol. Attribute Probability of equal to or greater thanParam. 100 95 75 50 25 5 0
Volume of hydrate stability 146.8 156.0 174.3 183.5 192.7 211.0 220.2zone (x 1012m3)
Reservoir thickness in - - - - - - -nonmarine systems (m)

81
Effective porosity (%) 30 32.8 43.8 57.5 68.8 77.8 80
Hydrate saturation (%) 2 3.2 8 14 20.5 25.7 27
Hydrate gas yield (m3) 139 140.3 145.3 151.5 157.8 162.8 164 Figure 10B.--Southern Pacific Ocean Play.
Play: Southern Pacific Ocean
Probability Estimated in-place natural(equal to or greater than) gas resources (trillions of ft3)
0.95 0
0.75 0
0.50 0
0.25 0
0.05 63,576
Mean value 7,350
Standard deviation 30,592
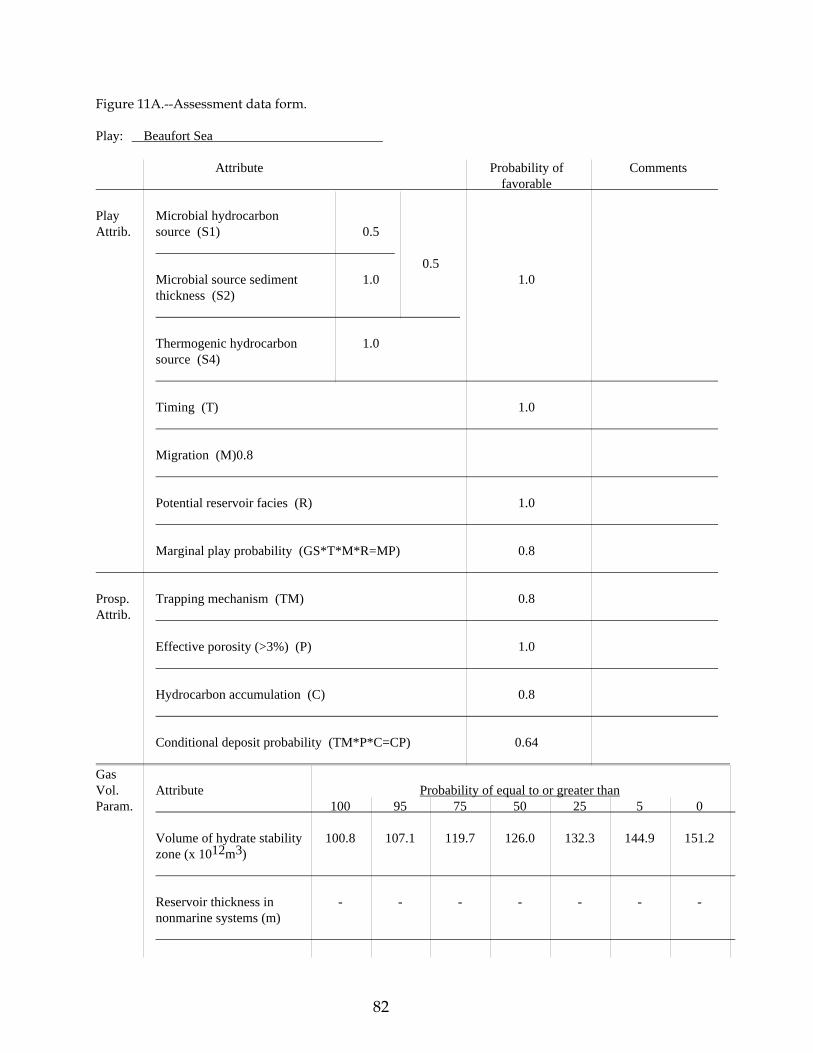
82
Figure 11A.--Assessment data form.
Play: Beaufort Sea
Attribute Probability of Comments favorable
Play Microbial hydrocarbonAttrib. source (S1) 0.5
0.5
Microbial source sediment 1.0 1.0thickness (S2)
Thermogenic hydrocarbon 1.0source (S4)
Timing (T) 1.0
Migration (M)0.8
Potential reservoir facies (R) 1.0
Marginal play probability (GS*T*M*R=MP) 0.8
Prosp. Trapping mechanism (TM) 0.8Attrib.
Effective porosity (>3%) (P) 1.0
Hydrocarbon accumulation (C) 0.8
Conditional deposit probability (TM*P*C=CP) 0.64 GasVol. Attribute Probability of equal to or greater thanParam. 100 95 75 50 25 5 0
Volume of hydrate stability 100.8 107.1 119.7 126.0 132.3 144.9 151.2zone (x 1012m3)
Reservoir thickness in - - - - - - -nonmarine systems (m)
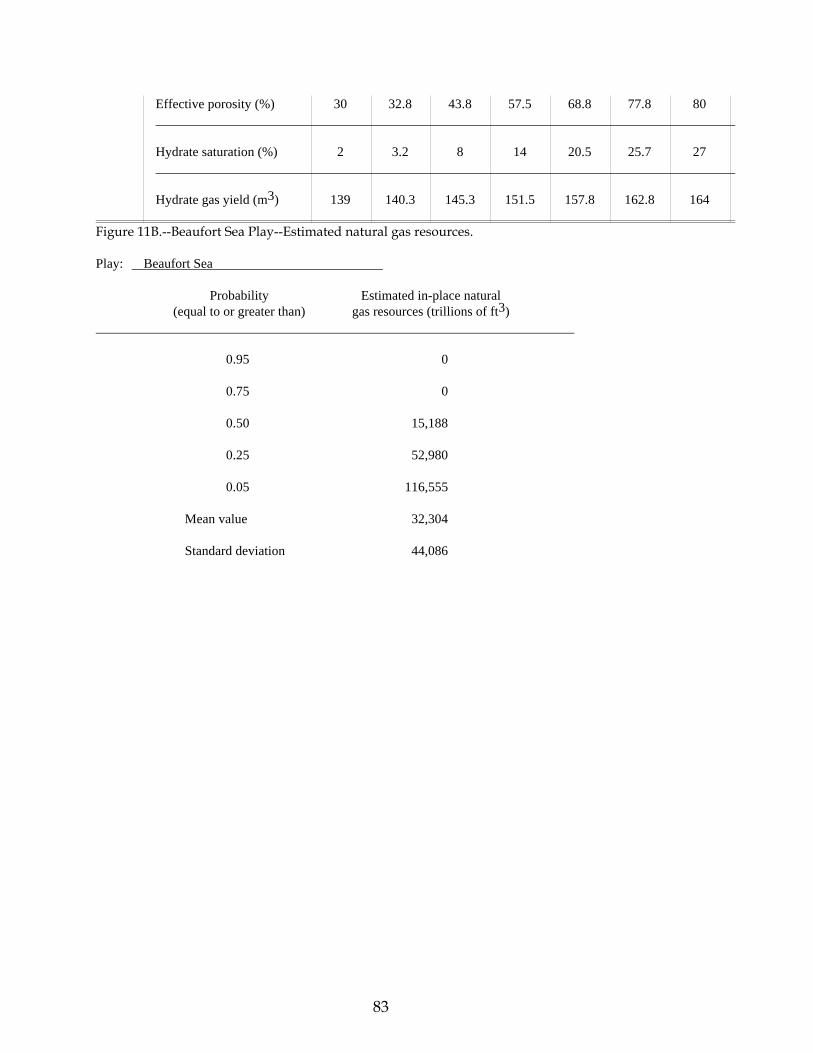
83
Effective porosity (%) 30 32.8 43.8 57.5 68.8 77.8 80
Hydrate saturation (%) 2 3.2 8 14 20.5 25.7 27
Hydrate gas yield (m3) 139 140.3 145.3 151.5 157.8 162.8 164 Figure 11B.--Beaufort Sea Play--Estimated natural gas resources.
Play: Beaufort Sea
Probability Estimated in-place natural(equal to or greater than) gas resources (trillions of ft3)
0.95 0
0.75 0
0.50 15,188
0.25 52,980
0.05 116,555
Mean value 32,304
Standard deviation 44,086

84
Figure 12A.--Bering Sea Play--Assessment data form.
Play: Bering Sea
Attribute Probability of Comments favorable
Play Microbial hydrocarbonAttrib. source (S1) 0.5
0.5
Microbial source sediment 1.0 1.0thickness (S2)
Thermogenic hydrocarbon 1.0source (S4)
Timing (T) 1.0
Migration (M)0.8
Potential reservoir facies (R) 1.0
Marginal play probability (GS*T*M*R=MP) 0.8
Prosp. Trapping mechanism (TM) 0.8Attrib.
Effective porosity (>3%) (P) 1.0
Hydrocarbon accumulation (C) 0.8
Conditional deposit probability (TM*P*C=CP) 0.64 GasVol. Attribute Probability of equal to or greater thanParam. 100 95 75 50 25 5 0
Volume of hydrate stability 228.7 243.0 271.6 285.9 300.2 328.8 343.1zone (x 1012m3)
Reservoir thickness in - - - - - - -nonmarine systems (m)

85
Effective porosity (%) 30 32.8 43.8 57.5 68.8 77.8 80
Hydrate saturation (%) 2 3.2 8 14 20.5 25.7 27
Hydrate gas yield (m3) 139 140.3 145.3 151.5 157.8 162.8 164 Figure 12B.--Estimated natural gas resources.
Play: Bering Sea
Probability Estimated in-place natural(equal to or greater than) gas resources (trillions of ft3)
0.95 0
0.75 0
0.50 34,613
0.25 120,087
0.05 264,899
Mean value 73,289
Standard deviation 100,033

86
Figure 13A.--Aleutian Trench Play--Assessment data form.
Play: Aleutian Trench
Attribute Probability of Comments favorable
Play Microbial hydrocarbonAttrib. source (S1) 0.5
0.125
Microbial source sediment 0.25 0.125thickness (S2)
Thermogenic hydrocarbon 0.0source (S4)
Timing (T) 1.0
Migration (M)1.0
Potential reservoir facies (R) 1.0
Marginal play probability (GS*T*M*R=MP) 0.125
Prosp. Trapping mechanism (TM) 0.8Attrib.
Effective porosity (>3%) (P) 1.0
Hydrocarbon accumulation (C) 0.8
Conditional deposit probability (TM*P*C=CP) 0.64 GasVol. Attribute Probability of equal to or greater thanParam. 100 95 75 50 25 5 0
Volume of hydrate stability 429.3 456.1 509.8 536.6 563.4 617.1 643.9zone (x 1012m3)
Reservoir thickness in - - - - - - -nonmarine systems (m)

87
Effective porosity (%) 30 32.8 43.8 57.5 68.8 77.8 80
Hydrate saturation (%) 2 3.2 8 14 20.5 25.7 27
Hydrate gas yield (m3) 139 140.3 145.3 151.5 157.8 162.8 164 Figure 13B.--Aleutian Trench Play--Estimated natural gas resources.
Play: Aleutian Trench
Probability Estimated in-place natural(equal to or greater than) gas resources (trillions of ft3)
0.95 0
0.75 0
0.50 0
0.25 0
0.05 183,663
Mean value 21,496
Standard deviation 89,458

88
Figure 14A.--Gulf of Alaska Play--Assessment data form.
Play: Gulf of Alaska
Attribute Probability of Comments favorable
Play Microbial hydrocarbonAttrib. source (S1) 0.4
0.4
Microbial source sediment 1.0 0.4thickness (S2)
Thermogenic hydrocarbon 0.0source (S4)
Timing (T) 1.0
Migration (M)0.8
Potential reservoir facies (R) 1.0
Marginal play probability (GS*T*M*R=MP) 0.32
Prosp. Trapping mechanism (TM) 0.8Attrib.
Effective porosity (>3%) (P) 1.0
Hydrocarbon accumulation (C) 0.8
Conditional deposit probability (TM*P*C=CP) 0.64 GasVol. Attribute Probability of equal to or greater thanParam. 100 95 75 50 25 5 0
Volume of hydrate stability 322.7 342.9 383.2 403.4 423.6 463.9 484.1zone (x 1012m3)
Reservoir thickness in - - - - - - -nonmarine systems (m)

89
Effective porosity (%) 30 32.8 43.8 57.5 68.8 77.8 80
Hydrate saturation (%) 2 3.2 8 14 20.5 25.7 27
Hydrate gas yield (m3) 139 140.3 145.3 151.5 157.8 162.8 164 Figure 14B.--Gulf of Alaska Play--Estimated natural gas resources.
Play: Gulf of Alaska
Probability Estimated in-place natural(equal to or greater than) gas resources (trillions of ft3)
0.95 0
0.75 0
0.50 0
0.25 0
0.05 257,835
Mean value 41,360
Standard deviation 102,643

90
Figure 15A1.--Topset Play--Assessment data form for the onshore State lands and waters portion of theplay.
Play: Alaska Onshore Province--Topset Play - State lands and watersAttribute Probability of Comments
favorable
Play Microbial hydrocarbonAttrib. source (S1) 1.0
1.0
Microbial source sediment 1.0 1.0thickness (S2)
Thermogenic hydrocarbon 1.0source (S4)
Timing (T) 1.0
Migration (M)1.0
Potential reservoir facies (R) 1.0
Marginal play probability (GS*T*M*R=MP) 1.0
Prosp. Trapping mechanism (TM) 0.3Attrib.
Effective porosity (>3%) (P) 1.0
Hydrocarbon accumulation (C) 0.2
Conditional deposit probability (TM*P*C=CP) 0.06 GasVol. Attribute Probability of equal to or greater thanParam. 100 95 75 50 25 5 0
Area of hydrate stability 50609 53772 60098 63261 66424 72750 75913(x 106m2)
Reservoir thickness in 15 23 30 61 91 152 229nonmarine systems (m)
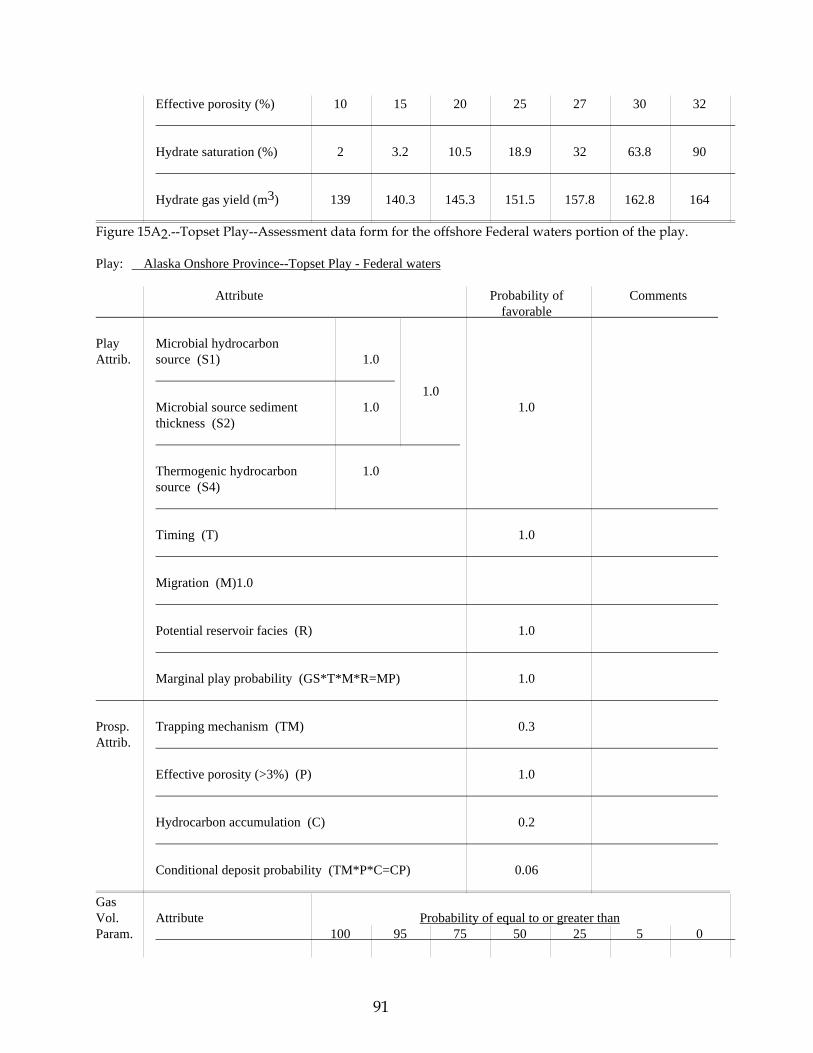
91
Effective porosity (%) 10 15 20 25 27 30 32
Hydrate saturation (%) 2 3.2 10.5 18.9 32 63.8 90
Hydrate gas yield (m3) 139 140.3 145.3 151.5 157.8 162.8 164 Figure 15A2.--Topset Play--Assessment data form for the offshore Federal waters portion of the play.
Play: Alaska Onshore Province--Topset Play - Federal waters
Attribute Probability of Comments favorable
Play Microbial hydrocarbonAttrib. source (S1) 1.0
1.0
Microbial source sediment 1.0 1.0thickness (S2)
Thermogenic hydrocarbon 1.0source (S4)
Timing (T) 1.0
Migration (M)1.0
Potential reservoir facies (R) 1.0
Marginal play probability (GS*T*M*R=MP) 1.0
Prosp. Trapping mechanism (TM) 0.3Attrib.
Effective porosity (>3%) (P) 1.0
Hydrocarbon accumulation (C) 0.2
Conditional deposit probability (TM*P*C=CP) 0.06 GasVol. Attribute Probability of equal to or greater thanParam. 100 95 75 50 25 5 0

92
Area of hydrate stability 20950 22259 24878 26187 27496 30115 31424(x 106m2)
Reservoir thickness in 15 23 30 61 91 152 229nonmarine systems (m)
Effective porosity (%) 10 15 20 25 27 30 32
Hydrate saturation (%) 2 3.2 10.5 18.9 32 63.8 90
Hydrate gas yield (m3) 139 140.3 145.3 151.5 157.8 162.8 164 Figure 15B1.--Topset Play--Estimated natural gas resources within the onshore State lands and waters portionof the play.
Play: Alaska Onshore Province--Topset Play - State lands and waters
Probability Estimated in-place natural(equal to or greater than) gas resources (trillions of ft3)
0.95 0
0.75 0
0.50 0
0.25 0
0.05 388
Mean value 105
Standard deviation 712

93
Figure 15B2.--Topset Play--Estimated natural gas resources within the offshore Federal waters portion ofthe play.
Play: Alaska Onshore Province--Topset Play - Federal waters
Probability Estimated in-place natural(equal to or greater than) gas resources (trillions of ft3)
0.95 0
0.75 0
0.50 0
0.25 0
0.05 161
Mean value 43
Standard deviation 295

94
Figure 16A1.--Fold Belt Play--Assessment data form for the onshore State lands and waters portion of theplay.
Play: Alaska Onshore Province--Fold Belt Play - State lands and waters
Attribute Probability of Comments favorable
Play Microbial hydrocarbonAttrib. source (S1) 1.0
1.0
Microbial source sediment 1.0 1.0thickness (S2)
Thermogenic hydrocarbon 1.0source (S4)
Timing (T) 1.0
Migration (M)1.0
Potential reservoir facies (R) 1.0
Marginal play probability (GS*T*M*R=MP) 1.0 Prosp. Trapping mechanism (TM) 0.6Attrib.
Effective porosity (>3%) (P) 0.8
Hydrocarbon accumulation (C) 0.9
Conditional deposit probability (TM*P*C=CP) 0.432 GasVol. Attribute Probability of equal to or greater thanParam. 100 95 75 50 25 5 0
Area of hydrate stability 41376 43962 49134 51720 54306 59478 62064(x 106m2)
Reservoir thickness in 1.5 8.6 15.8 22.9 55.3 78.7 152.4nonmarine systems (m)

95
Effective porosity (%) 3 7 11 15 19.3 26.3 32
Hydrate saturation (%) 2 15.6 37 52.5 56 76.5 90
Hydrate gas yield (m3) 139 140.3 145.3 151.5 157.8 162.8 164

96
Figure 16A2.--Fold Belt Play--Assessment data form for the Offshore Federal waters portion of the play.
Play: Alaska Onshore Province--Fold Belt Play - Federal waters
Attribute Probability of Comments favorable
Play Microbial hydrocarbonAttrib. source (S1) 1.0
1.0
Microbial source sediment 1.0 1.0thickness (S2)
Thermogenic hydrocarbon 1.0source (S4)
Timing (T) 1.0
Migration (M)1.0
Potential reservoir facies (R) 1.0
Marginal play probability (GS*T*M*R=MP) 1.0
Prosp. Trapping mechanism (TM) 0.6Attrib.
Effective porosity (>3%) (P) 0.8
Hydrocarbon accumulation (C) 0.9
Conditional deposit probability (TM*P*C=CP) 0.432 GasVol. Attribute Probability of equal to or greater thanParam. 100 95 75 50 25 5 0
Area of hydrate stability 2758 2930 3275 3447 3619 3964 4136(x 106m2)
Reservoir thickness in 1.5 8.6 15.8 22.9 55.3 78.7 152.4nonmarine systems (m)

97
Effective porosity (%) 3 7 11 15 19.3 26.3 32
Hydrate saturation (%) 2 15.6 37 52.5 56 76.5 90
Hydrate gas yield (m3) 139 140.3 145.3 151.5 157.8 162.8 164

98
Figure 16B1.--Fold Belt Play--Estimated natural gas resources within the onshore State lands and watersportion of the play.
Play: Alaska Onshore Province--Fold Belt Play - State lands and waters
Probability Estimated in-place natural(equal to or greater than) gas resources (trillions of ft3)
0.95 0
0.75 0
0.50 0
0.25 490
0.05 1,914
Mean value 414
Standard deviation 925

99
Figure 16B2.--Fold Belt Play--Estimated natural gas resources within the offshore Federal waters portionof the play.
Play: Alaska Onshore Province--Fold Belt Play - Federal waters
Probability Estimated in-place natural(equal to or greater than) gas resources (trillions of ft3)
0.95 0
0.75 0
0.50 0
0.25 33
0.05 128
Mean value 28
Standard deviation 62