garvey school district curricular guide 2014-2015 grade ... · garvey school district curricular...
TRANSCRIPT
Garvey School District Curricular Guide 2014-2015
Grade Level:_8th Grade Mathematics CCSS
Standards for Mathematical Practice 1.Make sense of problems and persevere in solving them.
2.Reason abstractly and quantitatively.
3.Construct viable arguments and critique the reasoning of others.
4.Model with mathematics.
5.Use appropriate tools strategically.
6.Attend to precision.
7.Look for and make use of structure.
8.Look for and express regularity in repeated reasoning.
The Number System Know that there are numbers that are not rational, and approximate them by rational numbers.
Expressions and Equations Work with radicals and integer exponents.
Understand the connection between proportional relationships, lines, and linear equations.
Analyze and solve linear equations and pairs of simultaneous linear equations.
Functions Define, evaluate, and compare functions.
Use functions to model relationships between quantities.
Geometry Understand congruence and similarity using physical models, transparencies, or geometry software.
Understand and apply the Pythagorean Theorem.
Solve real-world and mathematical problems involving volume of cylinders, cones, and spheres.
Statistics and Probability Investigate patterns of association in bivariate data.
The Number System 8.NS Know that there are numbers that are not rational, and approximate them by rational numbers.
1. Know that numbers that are not rational are called irrational. Understand informally that every number has a decimal
expansion; for rational numbers show that the decimal expansion repeats eventually, and convert a decimal expansion
which repeats eventually into a rational number.
2. Use rational approximations of irrational numbers to compare the size of irrational numbers, locate them approximately on a
number line diagram, and estimate the value of expressions (e.g.,π 2). For example, by truncating the decimal expansion of
√2, show that √2 is between 1 and 2, then between 1.4 and 1.5, and explain how to continue on to get better approximations.
Expressions and Equations 8.EE Work with radicals and integer exponents.
1. Know and apply the properties of integer exponents to generate equivalent numerical expressions. For example,
32 × 3–5 = 3–3 = 1/33 = 1/27.
2. Use square root and cube root symbols to represent solutions to equations of the form x2 = p and x3 = p, where p is a
Garvey School District Curricular Guide 2014-2015
Grade Level:_8th Grade Mathematics CCSS
positive rational number. Evaluate square roots of small perfect squares and cube roots of small perfect cubes. Know that
√2 is irrational.
3. Use numbers expressed in the form of a single digit times an integer power of 10 to estimate very large or very small
quantities, and to express how many times as much one is than the other. For example, estimate the population of the
United States as 3 × 10⁸ and the population of the world as 7 × 10⁹, and determine that the world population is more
than 20 times larger.
4. Perform operations with numbers expressed in scientific notation, including problems where both decimal and scientific
notation are used. Use scientific notation and choose units of appropriate size for measurements of very large or very small
quantities (e.g., use millimeters per year for seafloor spreading). Interpret scientific notation that has been generated by
technology.
Understand the connections between proportional relationships, lines, and linear equations.
5. Graph proportional relationships, interpreting the unit rate as the slope of the graph. Compare two different proportional
relationships represented in different ways. For example, compare a distance-time graph to a distance-time equation to
determine which of two moving objects has greater speed.
6. Use similar triangles to explain why the slope m is the same between any two distinct points on a non-vertical line in the
coordinate plane; derive the equation y = mx for a line through the origin and the equation y = mx + b for a line intercepting
the vertical axis at b.
Analyze and solve linear equations and pairs of simultaneous linear equations.
7. Solve linear equations in one variable.
a. Give examples of linear equations in one variable with one solution, ininitely many solutions, or no solutions. Show
which of these possibilities is the case by successively transforming the given equation into simpler forms, until an
equivalent equation of the form x = a, a = a, or a = b results (where a and b are different numbers).
b. Solve linear equations with rational number coeficients, including equations whose solutions require expanding
expressions using the distributive property and collecting like terms.
8. Analyze and solve pairs of simultaneous linear equations.
a. Understand that solutions to a system of two linear equations in two variables correspond to points of intersection of
their graphs, because points of intersection satisfy both equations simultaneously.
b. Solve systems of two linear equations in two variables algebraically, and estimate solutions by graphing the equations.
Solve simple cases by inspection. For example, 3x + 2y = 5 and 3x + 2y = 6 have no solution because 3x + 2y cannot
simultaneously be 5 and 6.
c. Solve real-world and mathematical problems leading to to linear equations in two variables. For example, given
coordinates for two pairs of points, determine whether the line through the irst pair of points intersects the line through
the second pair.
Functions 8.F Define, evaluate, and compare functions.
1. Understand that a function is a rule that assigns to each input exactly one output. The graph of a function is the set of
ordered pairs consisting of an input and the corresponding output.1
2. Compare properties of two functions each represented in a different way (algebraically, graphically, numerically in tables,
or by verbal descriptions). For example, given a linear function represented by a table of values and a linear function
represented by an algebraic expression, determine which function has the greater rate of change.
3. Interpret the equation y = mx + b as deining a linear function, whose graph is a straight line; give examples of functions

Garvey School District Curricular Guide 2014-2015
Grade Level:_8th Grade Mathematics CCSS
that are not linear. For example, the function A = s2 giving the area of a square as a function of its side length is not linear
because its graph contains the points (1,1), (2,4) and (3,9), which are not on a straight line.
Use functions to model relationships between quantities.
4. Construct a function to model a linear relationship between two quantities. Determine the rate of change and initial value
of the function from a description of a relationship or from two (x, y) values, including reading these from a table or from a
graph. Interpret the rate of change and initial value of a linear function in terms of the situation it models, and in terms of
its graph or a table of values.
5. Describe qualitatively the functional relationship between two quantities by analyzing a graph (e.g., where the function is
increasing or decreasing, linear or nonlinear). Sketch a graph that exhibits the qualitative features of a function that has
been described verbally.
Geometry 8.G Understand congruence and similarity using physical models, transparencies, or geometry software.
1. Verify experimentally the properties of rotations, reflections, and translations:
a. Lines are taken to lines, and line segments to line segments of the same length.
b. Angles are taken to angles of the same measure.
c. Parallel lines are taken to parallel lines.
2. Understand that a two-dimensional figure is congruent to another if the second can be obtained from the first by a sequence
of rotations, reflections, and translations; given two congruent figures, describe a sequence that exhibits the congruence
between them.
3. Describe the effect of dilations, translations, rotations, and reflections on two-dimensional figures using coordinates.
4. Understand that a two-dimensional igure is similar to another if the second can be obtained from the first by a sequence
of rotations, reflections, translations, and dilations; given two similar two-dimensional figures, describe a sequence that
exhibits the similarity between them.
5. Use informal arguments to establish facts about the angle sum and exterior angle of triangles, about the angles created
when parallel lines are cut by a transversal, and the angle-angle criterion for similarity of triangles. For example, arrange
three copies of the same triangle so that the sum of the three angles appears to form a line, and give an argument in
terms of transversals why this is so.
Understand and apply the Pythagorean Theorem.
6. Explain a proof of the Pythagorean Theorem and its converse.
7. Apply the Pythagorean Theorem to determine unknown side lengths in right triangles in real-world and mathematical
problems in two and three dimensions.
8. Apply the Pythagorean Theorem to find the distance between two points in a coordinate system.
Solve real-world and mathematical problems involving volume of cylinders, cones, and spheres.
9. Know the formulas for the volumes of cones, cylinders, and spheres and use them to solve real-world and mathematical
problems.
Statistics and Probability 8.SP Investigate patterns of association in bivariate data.
1. Construct and interpret scatter plots for bivariate measurement data to investigate patterns of association between two
quantities. Describe patterns such as clustering, outliers, positive or negative association, linear association, and nonlinear

Garvey School District Curricular Guide 2014-2015
Grade Level:_8th Grade Mathematics CCSS
association.
2. Know that straight lines are widely used to model relationships between two quantitative variables. For scatter plots that
suggest a linear association, informally it a straight line, and informally assess the model it by judging the closeness of the
data points to the line.
3. Use the equation of a linear model to solve problems in the context of bivariate measurement data, interpreting the slope
and intercept. For example, in a linear model for a biology experiment, interpret a slope of 1.5 cm/hr as meaning that an
additional hour of sunlight each day is associated with an additional 1.5 cm in mature plant height.
4. Understand that patterns of association can also be seen in bivariate categorical data by displaying frequencies and relative
frequencies in a two-way table. Construct and interpret a two-way table summarizing data on two categorical variables
collected from the same subjects. Use relative frequencies calculated for rows or columns to describe possible association
between the two variables. For example, collect data from students in your class on whether or not they have a curfew on
school nights and whether or not they have assigned chores at home. Is there evidence that those who have a curfew also
tend to have chores?

Garvey School District Curricular Guide 2014-2015
Grade Level:_8th Grade Mathematics CCSS
Time Frame Big Ideas/Topics Essential Standards Instructional Materials for
Consideration Academic and
Domain
Vocabulary
Supplemental
Resources,
Formative
Assessments,
Summative Performance
Tasks
Instructional
Period 1
● Real Numbers ● Exponents and
Scientific Notation ● Proportional
Relationships ● Nonproportional
Relationships ● Writing Linear
Equations
8.NS.1, 2
Know that there are numbers that
are not rational, and approximate
them by rational numbers.
1. Know that numbers that are not rational
are called irrational. Understand informally that every number has a
decimal expansion; for rational numbers
show that the decimal expansion repeats eventually, and convert a decimal
expansion which repeats eventually into a
rational number.
2. Use rational approximations of
irrational numbers to compare the size of
irrational numbers, locate them approximately on a number line diagram,
and estimate the value of expressions (e.g.,
π2). For example, by truncating the decimal expansion of √2, show that √2 is
between 1 and 2, then between 1.4 and
1.5, and explain how to continue on to get better approximations.
8.EE.1,2,3,4
Work with radicals and integer
exponents. 1.Know and apply the properties of integer
exponents to generate equivalent
numerical expressions. For example, 32 × 3–5 = 3–3 = 1/33 = 1/27.
Holt
Mathematics
Course 2:
Pre-Algebra
(bolded font)
Holt
Mathematics
Algebra 1
(underlined
font)
8.NS.1
Ch.4.8, 2.1
8.NS.2
Ch. 4.6, 4.7
8.EE.1
Ch. 4.2, 4.3
8.EE.2
Ch. 1.4, 1.5,
7.1-7.5
Houghton
Mifflin
Harcourt Go
Math Middle
School Grade
8
Module 1
Module 1
Module 2
Module 1
Tier 2 Academic
Vocabulary:
■ Appropriate ■ Approximate ■ Assess ■ Construct ■ Convert ■ Derive ■ Display ■ Distinct ■ Equivalent ■ Eventually ■ Evidence ■ Expand ■ Evaluate ■ Generate ■ Initial ■ Investigate ■ Similar ■ Symbols ■ Technology Tier 3 Domain
Vocabulary:
■ Axis
8.NS.1,2
Number System
(Short Novice
Task- MARS)
8.EE.1,2,3,4
Estimating
Length Using
Scientific
Notation
(FAL-MARS)
8 EE.1,2,3,4
“Ponzi”
Pyramid
Schemes
Giantburgers
100 People
A Million
Dollars
All instructional materials for your consideration are to be used at teacher discretion. Please refer to the assessment calendar for exact number of days for each
instructional period and for exact testing dates

Garvey School District Curricular Guide 2014-2015
Grade Level:_8th Grade Mathematics CCSS
2. Use square root and cube root symbols
to represent solutions to equations of the
form x2 = p and x3 = p, where p is a positive rational number. Evaluate square
roots of small perfect squares and cube
roots of small perfect cubes. Know that √2 is irrational.
3. Use numbers expressed in the form of a single digit times an integer power of 10
to estimate very large or very small
quantities, and to express how many times as much one is than the other. For
example, estimate the population of the
United States as 3 × 10⁸ and the population of the world as 7 × 10⁹, and
determine that the world population is
more than 20 times larger.
4. Perform operations with numbers
expressed in scientific notation, including problems where both decimal and
scientific notation are used. Use scientific notation and choose units of appropriate
size for measurements of very large or
very small quantities (e.g., use millimeters per year for seafloor spreading). Interpret
scientific notation that has been generated
by technology.
8.EE.5,6
Understand the connections
between proportional relationships,
lines, and linear equations.
5. Graph proportional relationships,
interpreting the unit rate as the slope of the
graph. Compare two different proportional
relationships represented in different
ways. For example, compare a distance-time graph to a distance-time equation to
determine which of two moving objects
has greater speed.
6. Use similar triangles to explain why the
slope m is the same between any two distinct points on a non-vertical line in the
coordinate plane; derive the equation y =
8.EE.3
Ch. 1.4, 1.5,
7.1-7.5
8.EE.4
Ch. 1.4, 1.5,
7.1-7.5
8.EE.5
Ch. 5.1-5.5
8.EE.6
Ch. 5.1-5.5
8.F.4
Ch. 4.1-4.3
8.SP.1
Ch. 4.4
Module 2
Module 2
Module 3
Module 3, 4
Module 3, 4, 5
Module 5, 14
■ Coordinate ■ Bivariate ■ Clustering ■ Cube root ■ Decimal ■ Diagram ■ Digit ■ Equation ■ Exponents ■ Expression ■ Graph ■ Integer ■ Irrational number ■ Millimeters ■ Negative ■ Positive ■ Proportional ■ Rational numbers ■ Scientific notation ■ Square root ■ Truncating ■ Vertical
How old are
they?
(Apprentice
Tasks- MARS)
8 EE.5,6
Bike Ride
Journey
Shelves
(Apprentice
Task- MARS)

Garvey School District Curricular Guide 2014-2015
Grade Level:_8th Grade Mathematics CCSS
mx for a line through the origin and the equation y = mx + b for a line intercepting
the vertical axis at b. Analyze and solve
linear equations and pairs of simultaneous linear equations.
8.F.4
Use functions to model relationships
between quantities.
4. Construct a function to model a linear
relationship between two quantities. Determine the rate of change and initial
value of the function from a description of
a relationship or from two (x, y) values, including reading these from a table or
from a graph. Interpret the rate of change
and initial value of a linear function in terms of the situation it models, and in
terms of its graph or a table of values.
5. Describe qualitatively the functional relationship between two quantities by
analyzing a graph (e.g., where the function
is increasing or decreasing, linear or nonlinear). Sketch a graph that exhibits the
qualitative features of a function that has
been described verbally.
8.SP.1
Investigate patterns of association
in bivariate data.
1. Construct and interpret scatter plots for
bivariate measurement data to investigate
patterns of association between two quantities. Describe patterns such as
clustering, outliers, positive or negative
association, linear association, and nonlinear association.
Benchmark 1
Garvey School District Curricular Guide 2014-2015
Grade Level:_8th Grade Mathematics CCSS
Time Frame
Big Ideas/Topics Essential Standards Instructional Materials for
Consideration Academic and
Domain
Vocabulary
Supplemental
Resources,
Formative
Assessments,
Summative
Performance
Tasks
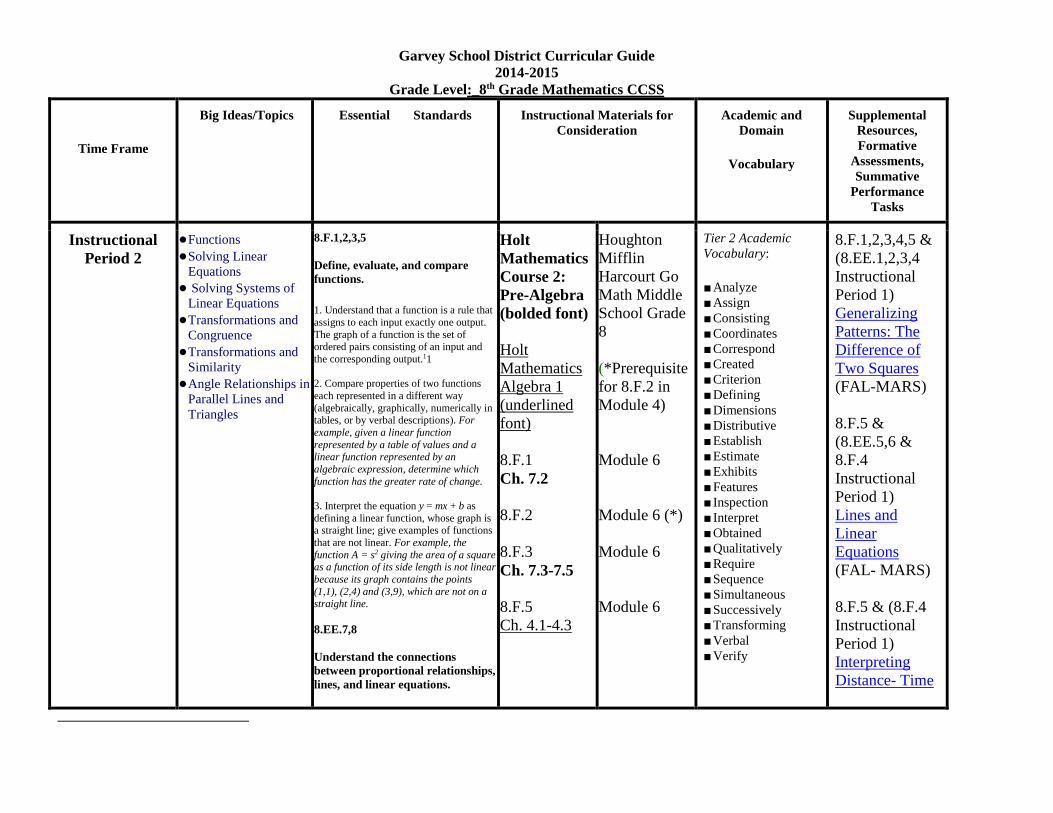
Instructional
Period 2
● Functions ● Solving Linear
Equations ● Solving Systems of
Linear Equations ● Transformations and
Congruence ● Transformations and
Similarity ● Angle Relationships in
Parallel Lines and
Triangles
8.F.1,2,3,5
Define, evaluate, and compare
functions.
1. Understand that a function is a rule that
assigns to each input exactly one output.
The graph of a function is the set of ordered pairs consisting of an input and
the corresponding output.11
2. Compare properties of two functions
each represented in a different way
(algebraically, graphically, numerically in tables, or by verbal descriptions). For
example, given a linear function
represented by a table of values and a linear function represented by an
algebraic expression, determine which
function has the greater rate of change.
3. Interpret the equation y = mx + b as
defining a linear function, whose graph is a straight line; give examples of functions
that are not linear. For example, the
function A = s2 giving the area of a square as a function of its side length is not linear
because its graph contains the points
(1,1), (2,4) and (3,9), which are not on a
straight line.
8.EE.7,8
Understand the connections
between proportional relationships,
lines, and linear equations.
Holt
Mathematics
Course 2:
Pre-Algebra
(bolded font)
Holt
Mathematics
Algebra 1
(underlined
font)
8.F.1
Ch. 7.2
8.F.2
8.F.3
Ch. 7.3-7.5
8.F.5
Ch. 4.1-4.3
Houghton
Mifflin
Harcourt Go
Math Middle
School Grade
8
(*Prerequisite
for 8.F.2 in
Module 4)
Module 6
Module 6 (*)
Module 6
Module 6
Tier 2 Academic
Vocabulary:
■ Analyze ■ Assign ■ Consisting ■ Coordinates ■ Correspond ■ Created ■ Criterion
■ Defining ■ Dimensions ■ Distributive ■ Establish ■ Estimate ■ Exhibits ■ Features ■ Inspection ■ Interpret ■ Obtained ■ Qualitatively ■ Require ■ Sequence ■ Simultaneous ■ Successively ■ Transforming ■ Verbal ■ Verify
8.F.1,2,3,4,5 &
(8.EE.1,2,3,4
Instructional
Period 1)
Generalizing
Patterns: The
Difference of
Two Squares
(FAL-MARS)
8.F.5 &
(8.EE.5,6 &
8.F.4
Instructional
Period 1)
Lines and
Linear
Equations
(FAL- MARS)
8.F.5 & (8.F.4
Instructional
Period 1)
Interpreting
Distance- Time

Garvey School District Curricular Guide 2014-2015
Grade Level:_8th Grade Mathematics CCSS
7.Solve linear equations in one variable.
a. Give examples of linear equations
in one variable with one solution,
infinitely many solutions, or no solutions. Show which of these
possibilities is the case by
successively transforming the given equation into simpler forms, until an
equivalent equation of the form x =
a, a = a, or a = b results (where a and b are different numbers).
b. Solve linear equations with rational number coefficients,
including equations whose solutions
require expanding expressions using the distributive property and
collecting like terms.
8. Analyze and solve pairs of simultaneous linear equations.
a. Understand that solutions to a system of two linear equations in
two variables correspond to points
of intersection of their graphs, because points of intersection satisfy
both equations simultaneously.
b. Solve systems of two linear
equations in two variables
algebraically, and estimate solutions by graphing the equations. Solve
simple cases by inspection.
c. Solve real-world and
mathematical problems leading to
linear equations in two variables.
8.G.1,2,3,4,5
Understand congruence and
similarity using physical models,
transparencies, or geometry
software.
8.EE.7
Ch. 2.1-2.4
8.EE.8
Ch. 6.1-6.4
8.G.1
Ch. 8.6, 8.7
8.G.2
p. 415
8.G.3
8.G.4
Ch. 5.5
8.G.5
Ch. 8.3, 8.4
Module 7
Module 8
Module 9
Module 9
Module 9, 10
Module 10
Module 11
Tier 3 Domain
Vocabulary:
■ Algebraically ■ Area ■ Coefficient ■ Congruent ■ Dilation ■ Experimentally ■ Exterior angle of a
triangle ■ Graphically ■ Infinitely ■ Input ■ Intersection ■ Line segment ■ Linear ■ Nonlinear ■ Output ■ Parallel ■ Quantitative ■ Rotations ■ Segment ■ Transversal ■ Two dimensional ■ Variable
Graphs
Modeling
Situations with
Linear
Equations
(FAL-MARS)
8.F.1,2,3,4,5
Functions
(Short Novice
Task- MARS)
8.F.1,2,3,4,5
Baseball
Jerseys
Linear Graphs
(Apprentice
Task- MARS)
8.F.4,5
Meal Out
(Apprentice
Task- MARS)
8 EE.7,8
Building to
Solving
Equations 1
Solving Real
Life Problems:
Baseball

Garvey School District Curricular Guide 2014-2015
Grade Level:_8th Grade Mathematics CCSS
1. Verify experimentally the properties of rotations, reflections, and translations:
a. Lines are taken to lines, and line segments to line segments of the
same length.
b. Angles are taken to angles of the
same measure.
c. Parallel lines are taken to parallel
lines.
2. Understand that a two-dimensional
figure is congruent to another if the second
can be obtained from the first by a sequence of rotations, reflections, and
translations; given two congruent figures,
describe a sequence that exhibits the congruence between them.
3. Describe the effect of dilations, translations, rotations, and reflections on
two-dimensional figures using coordinates.
4. Understand that a two-dimensional
figure is similar to another if the second can be obtained from the first by a
sequence of rotations, reflections,
translations, and dilations; given two similar two-dimensional figures, describe
a sequence that exhibits the similarity
between them.
5. Use informal arguments to establish
facts about the angle sum and exterior
angle of triangles, about the angles created when parallel lines are cut by a
transversal, and the angle-angle criterion
for similarity of triangles. For example, arrange three copies of the same triangle
so that the sum of the three angles appears
to form a line, and give an argument in terms of transversals why this is so.
Solve real-world and mathematical
problems involving volume of cylinders, cones, and spheres.
Jerseys
Classifying
Solutions to
Systems of
Equations
Solving Linear
Equations in
One Variable
(FAL-MARS)
8.EE.7,8 &
(8.NS.1,2
Instructional
Period 1)
Repeating
Decimals
(FAL-MARS)
8.EE.1,2,3,4,5,6
,7,8
Expressions and
Equations
(Short Novice
Task- MARS)
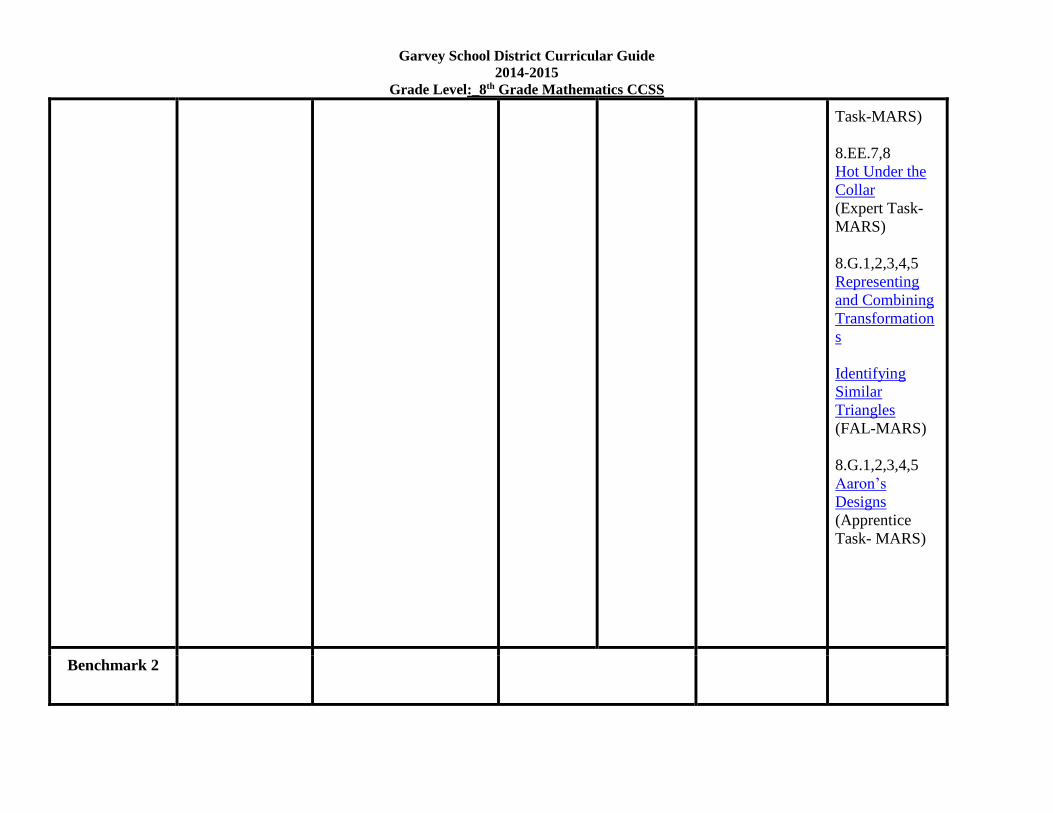
8 EE.7,8
Buying Chips
and Candy
Multiple
Solutions
(Apprentice
Garvey School District Curricular Guide 2014-2015
Grade Level:_8th Grade Mathematics CCSS
Task-MARS)
8.EE.7,8
Hot Under the
Collar
(Expert Task-
MARS)
8.G.1,2,3,4,5
Representing
and Combining
Transformation
s
Identifying
Similar
Triangles
(FAL-MARS)
8.G.1,2,3,4,5
Aaron’s
Designs
(Apprentice
Task- MARS)
Benchmark 2

Garvey School District Curricular Guide 2014-2015
Grade Level:_8th Grade Mathematics CCSS
Time Frame Big Ideas/Topics Essential Standards Instructional Materials for
Consideration
Academic and
Domain
Vocabulary
Supplemental
Resources,
Formative
Assessments,
Summative
Performance
Tasks
Instructional
Period 3
● The Pythagorean
Theorem ● Volume ● Scatter Plots ● Two-Way Tables
8.G.6,7,8,9
Understand and apply the
Pythagorean Theorem.
6. Explain a proof of the Pythagorean
Theorem and its converse.
7. Apply the Pythagorean Theorem to determine unknown side lengths in right
triangles in real-world and mathematical problems in two and three dimensions.
8. Apply the Pythagorean Theorem to find
the distance between two points in a coordinate system.
Solve real world mathematical problems
involving volume of cylinders, cones, and spheres.
9. Know the formulas for the volumes of cones, cylinders, and spheres and use them
to solve real-world and mathematical
problems.
Solve real-world and mathematical
problems involving volume of cylinders,
cones, and spheres.
9. Know the formulas for the volumes of
cones, cylinders, and spheres and use them
to solve real-world and mathematical problems.
Holt
Mathematics
Course 2:
Pre-Algebra
(bolded font)
Holt
Mathematics
Algebra 1
(underlined
font)
8.G.6
Ch. 4.9
8.G.7
Ch. 4.9
8.G.8
Ch. 4.9
8.G.9
Ch. 10.2,
10.3, 10.6
Houghton
Mifflin
Harcourt Go
Math Middle
School Grade
8
Module 12
Module 12
Module 12
Module 13
Tier 2 Academic
Vocabulary:
■ Context ■ Converse ■ Data ■ Investigate ■ Summarize
Tier 3 Domain
Vocabulary:
■ Bivariate ■ Categorically ■ Clustering ■ Intercept ■ Linear model ■ Negative ■ Outlier ■ Positive ■ Scatter plot ■ Theorem ■ Three dimensions ■ volume
8.G.6,7,8
The
Pythagorean
Theorem:
Square Areas
(FAL-MARS)
8.G.6,7,8
Jane’s TV
(Apprentice
Task- MARS)
8.G.6,7,8
Proofs of the
Pythagorean
Theorem
Pythagorean
Triples
Circles and
Squares
(Expert Task-
MARS)

Garvey School District Curricular Guide 2014-2015
Grade Level:_8th Grade Mathematics CCSS
8.SP.1,2,3,4
Investigate patterns of association
in bivariate data.
1. Construct and interpret scatter plots for
bivariate measurement data to investigate patterns of association between two
quantities. Describe patterns such as
clustering, outliers, positive or negative association, linear association, and
nonlinear association.
2. 2. Know that straight lines are widely used
to model relationships between two
qualitative variables. For scatter plots that suggest a linear association, informally fit
a straight line, and informally assess the
model fit by judging the closeness of the data points to the lien.
3. 3. Use the equation of a linear model to solve problems in the context of bivariate
measurement data, interpreting the slope
and intercept. Understand that patterns of association can
also be seen in bivariate categorical data
by displaying frequencies and relative frequencies in a two-way table.
4. Construct and interpret a two-way table summarizing data on two categorical
variables collected from the same subjects.
Use relative frequencies calculated for rows or columns to describe possible
association between the two variables.
8.SP.1
Ch. 4.4
8.SP.2
Ch. 4.4
8.SP.3
Ch 5.1-5.5
8.SP.4
Module 14
Module 5, 14
Module 14
Module 15
8.G.9
Modeling:
Making
Matchsticks
(FAL-MARS)
8.G.1,2,3,4,5,6,
7,8,9
Geometry
(Short Novice
Task- MARS)
8.G.9
Matchsticks
(Apprentice
Task- MARS)
8.SP.1,2,3,4
Statistics and
Probability
(Short Novice
Task- MARS)
8.SP.1,2,3,4
Birds’ Eggs
Scatter Diagram
Sugar Prices
(Apprentice
Task- MARS)

Garvey School District Curricular Guide 2014-2015
Grade Level:_8th Grade Mathematics CCSS
Benchmark 3
Smarter
Balanced
Assessment
Alhambra
Placement Test
Instructional
Period 4
(Building a
foundation for
the next grade)
Performance
Tasks and
Aligned
Learning
Experiences
Garvey School District Curricular Guide 2014-2015
Grade Level:_8th Grade Mathematics CCSS
Supplemental resources:
http://mathworksheetsland.com (Categorized by grade level. Includes lessons, guided practice, independent practice, homework and quizzes for
every CCSS standard.)
http://map.mathshell.org/materials/index.php (MARS website, categorized grades 6-8 and high school. Includes formative assessment lessons
(FAL), apprentice and expert tasks, tests and more.)
www.learnzillion.com (A free account that links you to common core based lessons for grades K-8.)
http://www.cde.ca.gov/ci/ma/cf/documents/aug2013gradeeight.pdf (Eighth grade mathematics frameworks.)
Revised 1/10/2014