garden state offshore energy, llc application for
TRANSCRIPT

Garden State Offshore Energy, LLC
Application for Incidental Harassment Authorization for the Non-Lethal Taking of Marine Mammals: Site Characterization Surveys
Lease OCS-A 0482
Prepared by CSA Ocean Sciences Inc.
November 2020 Revised April 2021

Application for Incidental Harassment Authorization for the Non-Lethal Taking of Marine Mammals:
Site Characterization Surveys
Lease OCS-A 0482
DOCUMENT NO.CSA-ORSTED-FL-21-81107-3468-05-REP-01-FIN
Version Date Description Prepared by: Reviewed by: Approved by:
01 10/2/2019 Initial draft for review
M. Barkaszi K. Hartigan A. Lawson M. Barkaszi
02 5/13/2020 Revised draft M. Barkaszi K. Hartigan
B. Douglas G. Dodillet
M. Barkaszi
03 9/3/2020 Client revisions K. Hartigan M. Barkaszi M. Barkaszi
04 10/30/2020 Client revisions K. Hartigan M. Barkaszi M. Barkaszi
FIN 04/02/2021 Final K. Hartigan M. Barkaszi M. Barkaszi

Contents (Continued)
Page
The electronic PDF version of this document is the Controlled Master Copy at all times. A printed copy is considered to be uncontrolled ,and it is the holder’s responsibility to ensure that they have the current version. Controlled copies are available upon request from the CSA Document Production Department.
Suggested citation: CSA Ocean Sciences Inc. 2021. Application for incidental harassment authorization for the non-lethal taking of marine mammals: site characterization surveys Lease OCS-A 0482. Submitted to Orsted. November 2020, Revised April 2021. 80 pp.

Incidental Harassment Authorization - Site Characteriztion Suveys OCS-A 0482 iv
Table of Contents Page
List of Tables .............................................................................................................................................. vi List of Figures ............................................................................................................................................ vii List of Acronyms ...................................................................................................................................... viii 1.0 Description of Proposed Activities ................................................................................................... 1
1.1 PROJECT DESCRIPTION ....................................................................................................... 1 1.2 ACTIVITIES CONSIDERED IN THIS APPLICATION......................................................... 3
1.2.1 Acoustic Analysis of Activities Considered in this Application .................................... 3 1.3 SURVEY EQUIPMENT ........................................................................................................... 6
1.3.1 Equipment Summary ..................................................................................................... 8 1.4 DISTANCES TO REGULATORY THRESHOLDS .............................................................. 12
1.4.1 Environmental Assessments of Site Characterization Geophysical Sources ............... 13 2.0 Survey Dates, Duration, and Specific Geographic Region .......................................................... 14
2.1 SURVEY ACTIVITY DATES AND DURATION ................................................................ 14 2.2 SPECIFIC GEOGRAPHIC REGION ..................................................................................... 14 2.3 SURVEY ACTIVITIES .......................................................................................................... 14
3.0 Species and Numbers of Marine Mammals .................................................................................. 15 3.1 PROTECTED POPULATIONS .............................................................................................. 15 3.2 MARINE MAMMAL SPECIES ............................................................................................. 15
4.0 Affected Species Status and Distribution ...................................................................................... 19 4.1 MYSTICETES ........................................................................................................................ 20
4.1.1 North Atlantic Right Whale (Eubalaena glacialis) ..................................................... 20 4.1.2 Humpback Whale (Megaptera novaeangliae) ............................................................. 22 4.1.3 Fin Whale (Balaenoptera physalus) ............................................................................ 24 4.1.4 Sei Whale (Balaenoptera borealis).............................................................................. 24 4.1.5 Minke Whale (Balaenoptera acutorostrata) ................................................................ 25
4.2 ODONTOCETES .................................................................................................................... 26 4.2.1 Sperm Whale (Physeter macrocephalus) ..................................................................... 26 4.2.2 Risso’s Dolphin (Grampus griseus) ............................................................................. 27 4.2.3 Long-finned Pilot Whale (Globicephala melas) .......................................................... 28 4.2.4 Short-finned Pilot Whale (Globicephala macrorhynchus) .......................................... 29 4.2.5 Atlantic White-Sided Dolphin (Lagenorhynchus acutus) ............................................ 30 4.2.6 Common Dolphin (Delphinus delphis) ........................................................................ 30 4.2.7 Atlantic Spotted Dolphin (Stenella frontalis) .............................................................. 31 4.2.8 Common Bottlenose Dolphin (Tursiops truncatus) ..................................................... 32 4.2.9 Harbor Porpoise (Phocoena phocoena) ....................................................................... 33
4.3 PHOCIDS ................................................................................................................................ 34 4.3.1 Harbor Seal (Phoca vitulina) ....................................................................................... 34 4.3.2 Gray Seal (Halichoerus grypus) .................................................................................. 35
5.0 Type of Incidental Take Requested ............................................................................................... 36
Table of Contents (Continued) Page
Incidental Harassment Authorization - Site Characteriztion Suveys OCS-A 0482 v
6.0 Take Estimates for Marine Mammals ........................................................................................... 37 6.1 BASIS FOR ESTIMATING NUMBERS OF MARINE MAMMALS THAT MIGHT BE
TAKEN BY HARASSMENT ................................................................................................. 37 6.1.1 Zone of Influence Calculations .................................................................................... 38 6.1.2 Marine Mammal Density Calculation .......................................................................... 39 6.1.3 Take Calculation .......................................................................................................... 43
6.2 ESTIMATED NUMBERS OF MARINE MAMMALS THAT MIGHT BE TAKEN BY HARASSMENT ...................................................................................................................... 43 6.2.1 Estimated Level A Harassment of Marine Mammals .................................................. 43 6.2.2 Estimated Level B Harassment of Marine Mammals .................................................. 44 6.2.3 Requested Level B Takes ............................................................................................. 45
7.0 Effects on Marine Mammal Species or Stocks ............................................................................. 47 7.1 MITIGATION ......................................................................................................................... 47 7.2 MULTIPLE EXPOSURES AND SEASONALITY ............................................................... 47 7.3 VOLUMETRIC DENSITY CALCULATIONS ..................................................................... 48 7.4 NEGLIGIBLE IMPACTS ....................................................................................................... 48
8.0 Minimization of Adverse Effects to Subsistence Uses .................................................................. 49 9.0 Anticipated Impacts on Habitat ..................................................................................................... 50
9.1 SHORT-TERM IMPACTS ..................................................................................................... 50 9.2 LONG-TERM IMPACTS ....................................................................................................... 50
10.0 Anticipated Effects of Habitat Impacts on Marine Mammals .................................................... 51 10.1 SHORT-TERM IMPACTS ..................................................................................................... 51 10.2 LONG-TERM IMPACTS ....................................................................................................... 51
11.0 Mitigation Measures ......................................................................................................................... 52 11.1 VESSEL STRIKE AVOIDANCE PROCEDURES ................................................................ 52 11.2 SEASONAL RIGHT WHALE OPERATING REQUIREMENTS ........................................ 53 11.3 MONITORING, EXCLUSION, AND LEVEL B HARASSMENT ZONES ......................... 53 11.4 VISUAL MONITORING ........................................................................................................ 54
11.4.1 Nighttime Monitoring .................................................................................................. 54 11.4.2 Data Recording ............................................................................................................ 55
11.5 PRE-START CLEARANCE OF EXCLUSION ZONE ......................................................... 55 11.6 RAMP-UP PROCEDURES .................................................................................................... 55 11.7 SHUTDOWN PROCEDURES ............................................................................................... 56 11.8 SURVEY COMMUNICATION AND COORDINATION FOR MARINE MAMMAL
DETECTIONS ........................................................................................................................ 56 12.0 Arctic Plan of Cooperation ............................................................................................................. 57 13.0 Monitoring and Reporting ............................................................................................................. 58 14.0 Suggested Means of Coordinated Research .................................................................................. 59 15.0 List of Preparers .............................................................................................................................. 60 16.0 References ........................................................................................................................................ 61

Incidental Harassment Authorization - Site Characteriztion Suveys OCS-A 0482 vi
List of Tables Table Page
1 Acoustic metric definitions and their units used in this document ....................................... 3 2 Summary of National Marine Fisheries Service acoustic criteria for Level
A and Level B acoustic exposure from impulsive and non-impulsive sources .................................................................................................................................. 5
3 List of all representative geophysical sound sources with operating frequencies below 200 kHz that may be used during the site characterization surveys and were assessed for marine mammal takes ............................. 10
4 Maximum distance to weighted Level A and unweighted Level B thresholds for each sound source or comparable sound source category for all marine mammal hearing groups1 ................................................................................... 12
5 Marine mammals with geographic ranges that include the Project Area (NMFS, 2020a; BOEM, 2012) ........................................................................................... 16
6 Calculated Zone of Influence (ZOI) encompassing Level A and Level B thresholds1 for each sound source or comparable sound source category .......................... 38
7 Estimated monthly and average annual density (animals per km2) of potentially affected marine mammals within the Lease Area OCS-A-0482 based on monthly habitat density models (Roberts et al., 2016; Roberts, 2018, 2020) .......................................................................................................... 41
8 Estimated monthly and average annual density (animals per km2) of potentially affected marine mammals within the export cable route area based on monthly habitat density models (Roberts et al., 2016; Roberts, 2018, 2020) .......................................................................................................... 42
9 Maximum potential Level A take exposures for each equipment category operating for a total of 200 days in the Lease Area and 150 days in the export cable route area ....................................................................................................... 44
10 Summary of maximum potential Level B take exposures resulting from 100% usage of the sparker systems during all 200 days of surveys in the Lease Area and 150 days of surveys in the export cable route (ECR) area ....................... 45
11 Summary of requested Level B takes for this Project ........................................................ 46

Incidental Harassment Authorization - Site Characteriztion Suveys OCS-A 0482 vii
List of Figures Figure Page
1 Project Area for the site characterization surveys, indicated in gray, which includes Lease Area and the potential export cable route area ............................................ 2
2 Mid-Atlantic Seasonal Management Areas for North Atlantic right whales (Eubalaena glacialis) ......................................................................................................... 21
3 Sample density blocks (Roberts et al., 2016; Roberts, 2018, 2020) used to determine monthly marine mammal densities within the Project Area ............................. 40

Incidental Harassment Authorization - Site Characteriztion Suveys OCS-A 0482 viii
List of Acronyms μPa micropascal AA Applied Acoustics AMAPPS Atlantic Marine Assessment Program for Protected Species AWS Atlantic white-sided (dolphin) BOEM Bureau of Ocean Energy Management CETAP Cetacean and Turtles Assessment Program CFR Code of Federal Regulations CHIRP Compressed High-Intensity Radiated Pulse dB decibel DE Delaware DMA Dynamic Management Area DoN Department of the Navy DPS distinct population segment EA environmental assessment EBS environmental baseline study ECR export cable route EIS environmental impact statement ESA Endangered Species Act ET EdgeTech EZ exclusion zone FR Federal Register G&G geophysical and geotechnical GAPS Global Acoustic Positioning System HF high-frequency HRG high-resolution geophysical IHA Incidental Harassment Authorization ISO International Organization for Standardization J joule LF low-frequency MAI Marine Acoustics, Inc. MABS Mid-Atlantic Baseline Studies/Maryland Baseline Studies MBES multibeam echosounder MF mid-frequency MMPA Marine Mammal Protection Act NARW North Atlantic right whale NJDEP New Jersey Department of Environmental Protection NMFS National Marine Fisheries Service NOAA National Oceanic and Atmospheric Administration OCS Outer Continental Shelf OPR Office of Protected Resources PBR Potential Biological Removal PSO Protected Species Observer PTS permanent threshold shift PW phocid pinniped in water re referenced to RPM Reasonable and Prudent Measure RWSAS Right Whale Sighting Advisory System
List of Acronyms (Continued)
Incidental Harassment Authorization - Site Characteriztion Suveys OCS-A 0482 ix
SAR Stock Assessment Report SBP sub-bottom profiler SEL24h sound exposure level over 24-hours SFV sound field verification SL source level SMA Seasonal Management Area PK zero-to-peak sound pressure level SPL root-mean-square sound pressure level SSS side-scan sonar TL transmission loss TTS temporary threshold shift UHD ultra-high definition UME Unusual Mortality Event USBL ultra-short baseline USFWS U.S. Fish and Wildlife Service WEA wind energy area WFA weighing factor adjustment ZOI zone of influence

Incidental Harassment Authorization - Site Characteriztion Suveys OCS-A 0482 1
1.0 Description of Proposed Activities
The Applicant submits this request for Incidental Harassment Authorization (IHA) pursuant to Section 101(a)(5) of the Marine Mammal Protection Act (MMPA) for the incidental take of small numbers of marine mammals by Level B harassment during site characterization surveys, including high resolution geophysical (HRG) sources operating at frequencies less than 200 kHz, to support the development of offshore wind farm technology within the Bureau of Ocean Energy Management (BOEM) Delaware (DE) Wind Energy Area (WEA). The information provided in this document is submitted in response to the requirements of 50 Code of Federal Regulations (CFR) § 216.104 to allow for the incidental harassment of small numbers of marine mammals resulting from site characterization surveys.
1.1 PROJECT DESCRIPTION
Garden State Offshore Energy, LLC (Applicant), on its behalf and on behalf of any successors in interest or assignee, submits this application to the National Oceanic and Atmospheric Administration (NOAA) National Marine Fisheries Service (NMFS) requesting the issuance of an IHA to allow for the incidental harassment of small numbers of marine mammals resulting from site characterization surveys to support the development of offshore wind farm technology. The Applicant is proposing to conduct site characterization surveys within federal waters located in the area of Commercial Lease of Submerged Lands for Renewable Energy Development on the Outer Continental Shelf (OCS) Lease Area OCS-A 0482 (Lease Area) and potential export cable routes (ECRs) to landfall locations in New Jersey and Delaware. Figure 1 shows the Lease Area and survey boundaries (gray shaded area) for the site characterization surveys, which include the potential ECR area (Project Area).
Geophysical and geotechnical surveys are required by BOEM and the Applicant to provide data concerning seabed (geophysical, geotechnical, and geohazard), ecological, and archeological conditions within the footprint of offshore wind facility development. Surveys are also conducted to support engineering design and to map Unexploded Ordinance (UXO survey). The HRG and geotechnical surveys are planned to begin in 15 April 2021 and continue through 14 April 2022. The IHA is being requested to allow for the incidental harassment of small numbers of marine mammals resulting from the operation of HRG sources with frequencies less than 200 kHz.
Survey equipment will be deployed from multiple vessels or ROV during the site characterization activities conducted within the Project Area. HRG surveys will include the use of seafloor mapping equipment with operating frequencies above 200 kHz (e.g., side scan sonar [SSS], multibeam echosounder [MBES]); magnetometers and gradiometers that have no acoustic output; and shallow- to medium-penetration sub-bottom profiling (SBP) equipment (e.g., parametric sonars, compressed high-intensity radiated pulses [CHIRPs], boomers, sparkers) with operating frequencies below 200 kHz. No deep-penetration SBP surveys (e.g., airgun or bubble gun surveys) will be conducted.

Incidental Harassment Authorization - Site Characteriztion Suveys OCS-A 0482 2
Figure 1 Project Area for the site characterization surveys, indicated in gray, which includes Lease
Area and the potential export cable route area.

Incidental Harassment Authorization - Site Characteriztion Suveys OCS-A 0482 3
1.2 ACTIVITIES CONSIDERED IN THIS APPLICATION
Site characterization surveys described in this Application will include HRG surveys. Only activities using HRG sources with operating frequencies below 200 kHz are considered in this Application, as sources with operating frequencies >200 kHz are outside the general hearing range of most marine mammals (Section 1.2.1.2).
All site characterization activities will utilize one or more of the survey methods and acoustic sources identified below. As applicable, surveys will follow BOEM Lease stipulations and will be conducted in accordance with the following BOEM guidelines:
• Guidelines for Providing Archaeological and Historic Property Information Pursuant to 30 CFR Part 585 (March 2017); and
• Guidelines for Providing Geophysical, Geotechnical, and Geohazard Information Pursuant to 30 CFR Part 585 (July 2015).
1.2.1 Acoustic Analysis of Activities Considered in this Application
1.2.1.1 Acoustic Terminology
This document follows International Organization for Standardization (ISO) 18405:2017 (ISO, 2017) for all acoustic terminology. Underwater acoustic source levels (SLs), exposure levels, and associated measurements are expressed in decibels (dB) referenced to (re) 1 micropascal (µPa). In turn, acoustic metrics can be expressed in several ways depending on the quantity being reported. Table 1 provides a list of the acoustic units used in this document.
Table 1. Acoustic metric definitions and their units used in this document.
Quantity Abbreviation Units Reference Root-mean-square sound pressure level SPL dB re 1 µPa ISO 18405
Zero-to-peak sound pressure level (peak sound pressure level is a synonym) PK dB re 1 µPa ISO 18405
Sound exposure level over 24 hours SEL24h dB re 1 µPa2 s ISO 18406
Source level SL dB re 1 µPa m ISO 18405
µPa = micropascal dB = decibel; re = referenced to.
1.2.1.2 Regulatory Criteria
The included analysis applies the most recent noise exposure criteria utilized by NMFS Office of Protected Resources (OPR) to estimate acoustic harassment (NMFS, 2018a). The MMPA defines two levels of harassment: Level A harassment is statutorily defined as any act of pursuit, torment, or annoyance that has the potential to injure a marine mammal or marine mammal stock in the wild; Level B harassment is any act of pursuit, torment, or annoyance that has the potential to disturb a marine mammal or marine mammal stock in the wild by causing disruption of behavioral patterns, including, but not limited to, migration, breathing, nursing, breeding, feeding, or sheltering. The NMFS acoustic criteria were developed primarily to address the regulatory requirements of the MMPA when assessing the effect of sound on marine mammal species. In the guidance, NMFS establishes acoustic thresholds that, if exceeded, have the potential to cause auditory injury or behavioral disturbance for marine mammals. In 2018, NMFS published a revision to the acoustic guidance for marine mammals for use in impact assessments (NMFS, 2018a).

Incidental Harassment Authorization - Site Characteriztion Suveys OCS-A 0482 4
NMFS recognizes two main types of sound sources: impulsive (e.g., sparkers, boomers) and non-impulsive (e.g., parametric sonars, CHIRPs); sources are further broken down into continuous or intermittent categories. Only intermittent sources are included in this Application. Sound source characteristics and acoustic thresholds are used to establish the ensonified area of received zero-to-peak sound pressure level, (PK), root-mean-square sound pressure level (SPL) or sound exposure level over 24-hours (SEL24h) depending on the source type and marine mammal hearing group. This ensonified area constitutes the zone of influence (ZOI), within which impacts and takes of marine mammals are considered.
Hearing Groups
Recognizing that marine mammal species do not have equal hearing capabilities, marine mammals are separated into hearing groups (Southall et al., 2007; NMFS, 2018a; Southall et al., 2019). Hearing groups are used in acoustic impact assessment through the application of frequency weighting functions. Frequency weighting functions use physiological parameters to scale a species’ sensitivity to a propagated sound source depending on the spectral content of the sound source and the hearing acuity of that animal to that spectral content. Sound energy contained within the hearing range of an animal has the potential to affect hearing while sound energy outside an animal’s hearing range is unlikely to affect its hearing.
Marine mammal hearing groups, originally identified by Southall et al., 2007 then later modified by Finneran (2016) and adopted by NMFS (2018a), are categorized as low-frequency (LF) cetaceans, mid-frequency (MF) cetaceans, high-frequency (HF) cetaceans, phocid pinnipeds in water (PW), and otariid pinnipeds in water. Each category has a defined auditory weighting function and estimated acoustic threshold for the onset of temporary and injury-level hearing impacts.
More recently, Southall et al. (2019) conducted a broad, structured assessment of the audiometric, physiological, and acoustic output bases for the categorization of these hearing groups using the best available data at that time. Their assessment revealed several important features and distinctions present within the cetaceans that were not reflected in the less robust assessments used in previous categorizations of hearing groups. However, Southall et al. (2019) acknowledged that there is presently insufficient direct data within several groups to explicitly derive distinct thresholds and weighting functions. They thus proposed retaining the thresholds and functions developed by Finneran (2016) and adopted by NMFS (2018a), but with slightly different categorical identifiers. This results in slightly different grouping nomenclature from the NMFS (2018a) designations, but the overall conclusions of Southall (2019) remain congruent with the current regulatory guidance (NMFS, 2018a).
The four hearing groups of marine mammals, based on the NMFS (2018a) nomenclature, that potentially occur in the Project Area include:
• LF cetaceans ‒ mysticetes with a collective generalized hearing range of approximately 7 Hz to 35 kHz;
• MF cetaceans ‒ most dolphins, all toothed whales except for Kogia spp., and all beaked and bottlenose whales with a generalized hearing range of approximately 150 Hz to 160 kHz;
• HF cetaceans ‒ all true porpoises and Kogia spp. with a generalized hearing range of approximately 275 Hz to 160 kHz; and
• PW – all true seals with a generalized hearing range of 50 Hz to 86 kHz.
The 2018 NMFS guidance also defines an otariid pinniped underwater hearing group; however, this group does not occur within the Project Area.

Incidental Harassment Authorization - Site Characteriztion Suveys OCS-A 0482 5
Impact Levels
Level A auditory impacts under the MMPA include a permanent threshold shift (PTS), which is a condition that occurs when sound intensity is very high and/or of such long duration that the result is a permanent loss of hearing sensitivity which is an irreversible auditory tissue injury (Southall et al., 2007). Level A acoustic thresholds are defined as sound exposures that potentially elicit the onset of a PTS in marine mammal hearing. The acoustic thresholds are used to establish the ensonified area of received sound depending on the source type and marine mammal hearing group.
The sound sources of potential concern during site characterization surveys include non-impulsive intermittent sources and impulsive sources. For non-impulsive sources, only the sound exposure level over 24-hours (SEL24h) metric is used to assess potential injury-level impacts. For impulsive noises, both zero-to-peak sound pressure level (PK) and SEL24h criteria are identified to account for the intensity of impulsive sounds and the duration required to elicit PTS.
Level B harassment impacts include temporary threshold shift(s) (TTS) and behavioral responses. Compared to PTS, TTS is a lesser impact to hearing. TTS results when sounds of sufficient loudness cause a transient condition in which an animal's hearing sensitivity over the frequency band of exposure is impaired for a period of time (minutes to days). A TTS does not cause permanent damage and is not considered a tissue injury (Richardson et al., 1995; Southall et al., 2007). Similarly, underwater sound may elicit a behavioral response from marine mammals that may or may not be biologically significant. In principle, behavioral thresholds are lower than TTS thresholds. TTS thresholds are defined in the 2018 criteria; however, TTS thresholds and behavioral response thresholds have not yet been separated within a regulatory framework and are all considered Level B harassment. Currently, the regulatory framework uses interim guidance to define Level B thresholds (NMFS, 2019a) provided as unweighted root-mean-square sound pressure level (SPL) to assess Level B behavioral impacts (NMFS, 2018a, 2019a).
The corresponding Level A and Level B acoustic threshold criteria are summarized in Table 2. While the Level B threshold for non-impulsive sources is an SPL of 120 dB re 1 µPa, an SPL of 160 dB re 1 µPa is considered more appropriate for intermittent sources such as those assessed in this Application.
Table 2. Summary of National Marine Fisheries Service acoustic criteria for Level A and Level B acoustic exposure from impulsive and non-impulsive sources.
Hearing Group Source Type
Non-Impulsive Impulsive Level B1 Level A2 Level B1 Level A3 Level A2
Low-frequency Cetacean
160
199
160
219 183 Mid-frequency Cetacean 198 230 185 High-frequency Cetacean 173 202 155 Phocid Pinniped (in water) 201 218 185
µPa = micropascal; dB = decibel; re = referenced to; SEL24h = sound exposure level over 24-hours; PK = zero-to-peak sound pressure level; SPL = root-mean-square sound pressure level. 1Units expressed as SPL in dB re 1 µPa (unweighted). Level B criteria are the same for all intermittent sources, both non-impulsive and impulsive, which are considered in this Application. 2Units expressed as SEL24h in dB re 1 µPa2 s (weighted). 3Units expressed as PK in dB re 1 µPa (unweighted).

Incidental Harassment Authorization - Site Characteriztion Suveys OCS-A 0482 6
1.3 SURVEY EQUIPMENT
Operational SLs and operational parameters will vary throughout the survey and therefore a level of judgment is required to establish appropriate parameters and SLs to estimate the distances to regulatory thresholds. Typically, field-measured data is considered the best available science for HRG sources due to the high site- and result-specific variables that direct frequency content, power, beamwidths, and other user-defined parameters. The same equipment used in a deep-water, clay bottom environment may be operated very differently; and therefore produce, different acoustic propagation characteristics than if it were operated in a shallow water, sand bottom environment. Recent communication with NMFS OPR indicates that, due to inconsistencies in field verifications conducted on existing wind leases, Crocker and Fratantonio (2016) measurements are preferable to field measurement results at this time. Therefore, the following hierarchy was used for selecting input to the NMFS User Spreadsheet Tool (NMFS, 2018b) and transmission loss (TL) equations:
1. For equipment that was measured in Crocker and Fratantonio (2016), the reported SL for the most likely operational parameters was selected; and
2. For equipment not measured in Crocker and Fratantonio (2016), the best available manufacturer specifications were selected. Use of manufacturer specifications represent the absolute maximum output of any source and do not adequately represent the operational source. Therefore, they should be considered an overestimate of the sound propagation range for that equipment.
The operational parameters (e.g., operating frequency, SL, pulse duration, ping rate) for each piece of equipment, as well as the output parameters (e.g., SPLs, propagation distance, frequency content) are generally similar within each category and therefore the overall magnitude of impact radii can often be predicted based on the equipment category (Crocker and Fratantonio, 2016).
The operational characteristics and supplemental source information considered in the analyses for this Application, as well as justification for selected proxy equipment, and categories excluded from analysis, are provided below. Survey equipment is either towed, pole mounted, hull-mounted on the vessel, or equipment mounted on the source itself or on an ROV (Table 3).
Shallow penetration SBPs (CHIRPs) are used to map the near-surface stratigraphy (top 0 to 10 m) of sediment below seabed. A CHIRP system emits sonar pulses that increase in frequency from approximately 2 to 20 kHz over time. The pulse length frequency range can be adjusted to meet project variables. These shallow penetration SPBs are typically mounted on a pole, either over the side of the vessel or through a moon pool in the bottom of the hull; not towed behind the vessel. This configuration significantly reduces the likelihood of the beam intersecting an animal.
Parametric SBPs, also called sediment echosounders, are used for providing high data density in sub-bottom profiles that are typically required for cable routes, very shallow water, and archaeological surveys. Parametric SPBs are typically mounted on a pole, either over the side of the vessel or through a moon pool in the bottom of the hull. there are no relevant information sources or measurement data within the Crocker and Fratantonio (2016) reference for parametric SBPs. Source information is available from the manufacturer; however, no field measurements or propagation characteristics are provided with the manufacturer specifications. Due to the highly specialized nature of these sonars (high frequencies and narrow beamwidths) the source information alone is not sufficient to fully evaluate the expected propagation. The parametric SBPs are deployed through a moonpool or on a side pole; not towed behind the vessel. This configuration significantly reduces the likelihood of the beam intersecting an animal.
The specific parametric sonar proposed for the HRG work, the Innomar SES-2000 or similar SBP, uses the principle of “parametric” or “nonlinear” acoustics to generate short, very narrow-beam sound pulses
Incidental Harassment Authorization - Site Characteriztion Suveys OCS-A 0482 7
at very high frequencies (generally around 85 to 100 kHz). The transducer projects a beamwidth of approximately 1° to 3.5°. The narrow beamwidth significantly reduces the impact range of the source while the high frequencies of the source are rapidly attenuated in sea water. Neither high frequency sonar nor narrow beamwidth sources are well-captured in the NMFS User Spreadsheets used to calculate Level A isopleths. Therefore, the SL reported by the manufacturer as an SPL was converted to SEL then exposure distances were calculated for each hearing group following guidance provided by NMFS OPR in September 2019 (NMFS, 2019b) which considers both the beamwidth and frequency absorption as previously mentioned. Because of the high frequency of the source and narrow bandwidth, parametric SBPs do not produce Level A isopleths beyond 2 m and do not produce Level B isopleths beyond 4 m. No Level A or Level B exposures can be reasonably expected from the operation of these sources; therefore, the Innomar parametric SBPs were not carried forward in the Application analysis.
Medium penetration SBPs (boomers) are used to map deeper subsurface stratigraphy as needed. A boomer is a broad-band sound source operating in the 3.5 Hz to 10 kHz frequency range. This system is commonly mounted on a sled and towed behind the vessel.
Medium penetration SBPs (sparkers) are used to map deeper subsurface stratigraphy as needed. Sparkers create acoustic pulses from 50 Hz to 4 kHz omnidirectionally from the source. Sparkers are typically towed behind the vessel with adjacent hydrophone arrays to receive the return signals.
Acoustic cores unlike the other mobile geophysical sources, acoustic corers are stationary and made up of three distinct sound sources comprised of a HF parametric sonar (which will not be included in this assessment), a HF CHIRP sonar, and a LF CHIRP sonar with each source having its own transducer. The corer is seabed-mounted; therefore, propagation for similar towed equipment are unlikely to be fully comparable.
The beam width of the parametric sonar is narrow (3.5° to 8°) and the sonar is operated roughly 3.5 m above the seabed with the transducer pointed directly downward. This configuration represents the expected operation of the acoustic corer during the survey to maximize the energy channeled into the seabed and subsequently results in nominal horizontal propagation. There are no relevant information sources or measurement data within the Crocker and Fratantonio (2016) reference for acoustic corers; however, an acoustic assessment similar to a sound field verification (SFV) and a modeling assessment were conducted for the acoustic corer by the manufacturer. The modeling assessment showed much larger propagation distances than those that were measured in the field (Pangeo Subsea, 2018), further demonstrating the significant reduction in operational propagation distances for these highly directional, seabed-mounted sources.
Because of the operation close to the seabed and minimal resulting propagation distances, no Level A or Level B exposures can be reasonably expected from the operation of these sources; therefore, the acoustic corers were not carried forward in the Application analysis.
Ultra-short baseline (USBL) positioning systems are used to provide high accuracy ranges by measuring the time between the acoustic pulses transmitted by the vessel transceiver and a transponder (or beacon) necessary to produce the acoustic profile. It is a two-component system with a moonpool- or side pole-mounted transceiver and one or several transponders mounted on other survey equipment. there are no relevant information sources or measurement data within the Crocker and Fratantonio (2016) reference for USBLs and only limited manufacturer SL information. However, USBL sound field verifications (SFVs) conducted by the Applicant resulted in no Level A thresholds being met and Level B zones less than 7 m (MAI, 2018). USBLs have a wide variety of configurations, source levels, and beamwidths but have been shown to produce extremely small acoustic propagation distances in their typical operating configuration. There are numerous options for make and model of USBLs, and of

Incidental Harassment Authorization - Site Characteriztion Suveys OCS-A 0482 8
combinations pairing USBL transceivers and beacons. Eleven USBL systems have been identified as possible equipment on the site characterization surveys; therefore, the proxy source used was the Sonardyne Ranger 2 operating with an omnidirectional beamwidth is representative of the maximal proxy because it has the highest reported SL at 194 dB re 1 µPa m.
Geophysical sources have been extensively reviewed in the Gulf of Mexico OCS due to the large amount of ongoing and planned oil and gas geophysical and geotechnical (G&G) surveys. A programmatic environmental impact statement (EIS) was issued for G&G surveys in the Gulf of Mexico in 2017 (BOEM, 2017). Within this EIS, non-airgun HRG sources were considered for potential impacts. USBLs were not considered in the assessment. Additionally, in the most recent petition for a Gulf of Mexico incidental take regulation USBLs were not considered for take requests by NMFS in the final rule published on 19 January 2021 (86 FR 5322). In the rule, HRG surveys with equipment comparable to the equipment proposed in these activities were fully evaluated and USBLs were not considered in the take evaluation.
There is, therefore, precedence for not considering USBLs as sound sources likely to propagate sound levels reaching Level A or Level B thresholds. Based on this information, no Level A or Level B exposures can be reasonably expected from the operation of these sources; therefore, the USBLs were not carried forward in the Application analysis.
MBESs are used to determine water depths and general bottom topography. MBES sonar systems project sonar pulses in several angled beams from a transducer mounted to a ship’s hull. The beams radiate out from the transducer in a fan-shaped pattern orthogonally to the ship’s direction. The proposed MBESs all have operating frequencies >200 kHz, they are outside the general hearing range of marine mammals likely to occur in the Project Area and are not likely to affect these species. Therefore, this equipment category will not be discussed further in this Application.
SSS are used for seabed sediment classification purposes and to identify natural and man-made acoustic targets on the seafloor. The sonar device emits conical or fan-shaped pulses down toward the seafloor in multiple beams at a wide angle, perpendicular to the path of the sensor through the water column. The acoustic return of the pulses is recorded in a series of cross-track slices, which can be joined to form an image of the sea bottom within the swath of the beam. SSSs are typically towed beside or behind the vessel or from an autonomous vehicle. The proposed SSSs all have operating frequencies >200 kHz, they are outside the general hearing range of marine mammals likely to occur in the Project Area and are not likely to affect these species. Therefore, this equipment category will not be discussed further in this Application.
1.3.1 Equipment Summary
The operational parameters for each piece of equipment are typically provided as a range of options that can be specified by the user. The precise settings are often field-specific depending on each contractor’s individual survey methodologies and data needs. The selected parameters will affect the impact analysis for each piece of equipment within each category; therefore, the parameters used in the analysis must be as closely aligned as possible with the expected operation at the time of the survey. This information helps determine the expected acoustic output for this Project by selecting the appropriate measurements reported in Crocker and Fratantonio (2016). For equipment that was not measured by Crocker and Fratantonio (2016), manufacturer information was used with the most applicable operational parameters (Table 3).
Incidental Harassment Authorization - Site Characteriztion Suveys OCS-A 0482 9
SFV measurements on most proposed equipment types were previously conducted by the Applicant on this Lease and on other wind farm areas between 2015 and 2018. However, due to significant variation in SFV methodologies and SFV reporting, NMFS OPR provided supplemental guidance to the Applicant in September 2019 for methods applied in lieu of using SFVs (NMFS, 2019b). Because there are no standardized field measurements for HRG survey equipment, NMFS recommended that the controlled measurements provided in Crocker and Fratantonio (2016) be the primary reference for equipment SLs with manufacturer information supplementing for equipment that was not measured in the Crocker and Fratantonio (2016) study. Where applicable, SFV measurements are provided in equipment descriptions to supplement the data used in the analysis; however, SFV measurements were not used to define SLs or acoustic threshold distances.
Although the final equipment choices will vary depending on the final survey design, vessel availability, make and model updates, and survey contractor selection, all sources that are representative of those that could be employed during the HRG surveys are provided in Table 3 along with details of the parameters used in acoustic analyses within this Application.

Incidental Harassment Authorization - Site Characteriztion Suveys OCS-A 0482 10
Table 3. List of all representative geophysical sound sources with operating frequencies below 200 kHz that may be used during the site characterization surveys and were assessed for marine mammal takes. Equipment types not carried through for take analysis are not included in the table. All source information that was used to calculate threshold isopleths are provided in the table.
Equipment Source Type
Frequency used for WFA in User Spreadsheets (kHz)1 Reference for SL Operational Parameters
Low
-fre
quen
cy
Cet
acea
ns
Mid
-fre
quen
cy
Cet
acea
ns
Hig
h-fr
eque
ncy
Cet
acea
ns
Phoc
id P
inni
peds
in
Wat
er
CF=
Cro
cker
and
Fr
atan
toni
o (2
016)
M
AN
= M
anuf
actu
rer
Ope
ratin
g Fr
eque
ncy
(kH
z)
SL (S
PL, d
B re
1 µ
Pa m
)
SL (P
K, d
B re
1 µ
Pa m
)
Puls
e D
urat
ion
(wid
th)
(mill
isec
ond)
Rep
etiti
on R
ate
(Hz)
Bea
mw
idth
(deg
rees
)
T =
tow
ed;
PM =
pol
e-m
ount
ed;
HM
= hu
ll-m
ount
ed;
SM =
seab
ed-m
ount
ed;
EM
= e
quip
men
t-mou
nted
Shallow Sub-bottom Profilers (CHIRP Sonars) ET 216 (2000DS or 3200 top unit)
Non-impulsive, mobile, intermittent 2 16 16 6.2 MAN 2–16
2–8 195 - 20 6 24 PM/T/EM
ET 424 Non-impulsive, mobile, intermittent 4 24 24 6.2 CF 4–24 176 - 3.4 2 71 PM/T/EM
ET 512 Non-impulsive, mobile, intermittent 1.7 12 12 6.2 CF 0.7–12 179 - 9 8 80 PM/T/EM
GeoPulse 5430A Non-impulsive, mobile, intermittent 2 17 17 6.2 MAN 2–17 196 - 50 10 55 PM/T/EM
Teledyne Benthos Chirp III - TTV 170
Non-impulsive, mobile, intermittent 2 7 7 6.2 MAN 2–7 197 - 60 15 100 PM/T/EM
Medium Sub-bottom Profilers (Sparkers & Boomers) AA, Dura-spark UHD (400 tips, 500 J)2 Impulsive, mobile 1 CF 0.3–1.2 203 211 1.1 4 Omni T
AA, Dura-spark UHD (400+400)2 Impulsive, mobile 1 CF (AA Dura-spark
UHD Proxy) 0.3–1.2 203 211 1.1 4 Omni T
GeoMarine, Geo-Source dual 400 tip sparker (800 J)2
Impulsive, mobile 1.5 CF
(AA Dura-spark UHD Proxy)
0.4–5 203 211 1.1 2 Omni T
GeoMarine Geo-Source 200 tip light weight sparker (400 J)2
Impulsive, mobile 1 CF (AA Dura-spark UHD Proxy) 0.3–1.2 203 211 1.1 4 Omni T
GeoMarine Geo-Source 200-400 tip freshwater sparker (400 J)2
Impulsive, mobile 1 CF (AA Dura-spark UHD Proxy) 0.3–1.2 203 211 1.1 4 Omni T

Table 3. (Continued).
Incidental Harassment Authorization - Site Characteriztion Suveys OCS-A 0482 11
Equipment Source Type
Frequency used for WFA in User Spreadsheets (kHz)1 Reference for SL Operational Parameters
Low
-fre
quen
cy
Cet
acea
ns
Mid
-fre
quen
cy
Cet
acea
ns
Hig
h-fr
eque
ncy
Cet
acea
ns
Phoc
id P
inni
peds
in
Wat
er
CF=
Cro
cker
and
Fr
atan
toni
o (2
016)
M
AN
= M
anuf
actu
rer
Ope
ratin
g Fr
eque
ncy
(kH
z)
SL (S
PL, d
B re
1 µ
Pa m
)
SL (P
K, d
B re
1 µ
Pa m
)
Puls
e D
urat
ion
(wid
th)
(mill
isec
ond)
Rep
etiti
on R
ate
(Hz)
Bea
mw
idth
(deg
rees
)
T =
tow
ed;
PM =
pol
e-m
ount
ed;
HM
= hu
ll-m
ount
ed;
SM =
seab
ed-m
ount
ed;
EM
= e
quip
men
t-mou
nted
AA, triple plate S-Boom (700–1,000 J)3
Impulsive, mobile 3.4 CF 0.1–5 205 211 0.6 4 80 T
- = not applicable; NR = not reported; µPa = micropascal; AA = Applied Acoustics; dB = decibel; ET = EdgeTech; HF = high-frequency; J = joule; LF = low-frequency; Omni = omnidirectional source; re = referenced to; PK = zero-to-peak sound pressure level; SL = source level; SPL = root-mean-square sound pressure level; UHD = ultra-high definition; WFA = weighting factor adjustments. 1WFAs were selected in the User Spreadsheet for each marine mammal hearing group based on estimated hearing sensitivities of each group and the operational frequency of the source. 2The Dura-spark measurements and specifications provided in Crocker and Fratantonio (2016) were used for all sparker systems proposed for the survey. The data provided in Crocker and Fratantonio (2016) represent the most applicable data for similar sparker systems with comparable operating methods and settings when manufacturer or other reliable measurements are not available. 3Crocker and Fratantonio (2016) provide S-Boom measurements using two different power sources (CSP-D700 and CSP-N). The CSP-D700 power source was used in the 700 J measurements but not in the 1,000 J measurements. The CSP-N source was measured for both 700 J and 1,000 J operations but resulted in a lower SL; therefore, the single maximum SL value was used for both operational levels of the S-Boom.
Incidental Harassment Authorization - Site Characteriztion Suveys OCS-A 0482 12
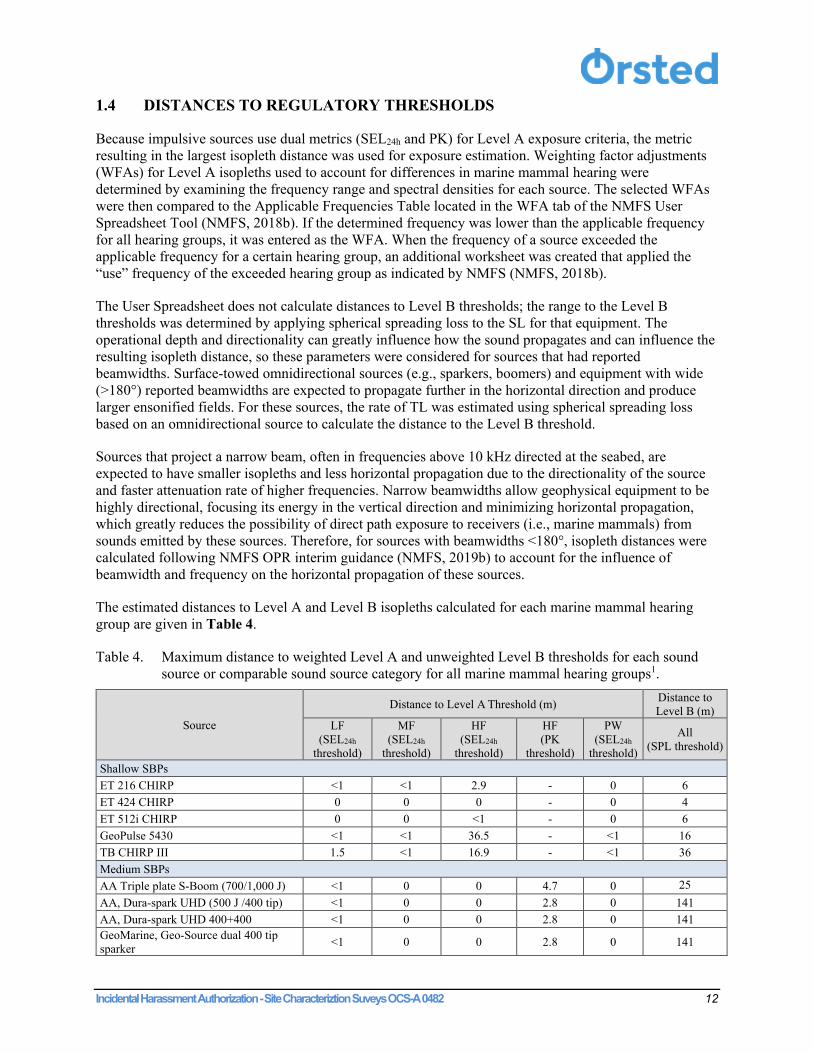
1.4 DISTANCES TO REGULATORY THRESHOLDS
Because impulsive sources use dual metrics (SEL24h and PK) for Level A exposure criteria, the metric resulting in the largest isopleth distance was used for exposure estimation. Weighting factor adjustments (WFAs) for Level A isopleths used to account for differences in marine mammal hearing were determined by examining the frequency range and spectral densities for each source. The selected WFAs were then compared to the Applicable Frequencies Table located in the WFA tab of the NMFS User Spreadsheet Tool (NMFS, 2018b). If the determined frequency was lower than the applicable frequency for all hearing groups, it was entered as the WFA. When the frequency of a source exceeded the applicable frequency for a certain hearing group, an additional worksheet was created that applied the “use” frequency of the exceeded hearing group as indicated by NMFS (NMFS, 2018b).
The User Spreadsheet does not calculate distances to Level B thresholds; the range to the Level B thresholds was determined by applying spherical spreading loss to the SL for that equipment. The operational depth and directionality can greatly influence how the sound propagates and can influence the resulting isopleth distance, so these parameters were considered for sources that had reported beamwidths. Surface-towed omnidirectional sources (e.g., sparkers, boomers) and equipment with wide (>180°) reported beamwidths are expected to propagate further in the horizontal direction and produce larger ensonified fields. For these sources, the rate of TL was estimated using spherical spreading loss based on an omnidirectional source to calculate the distance to the Level B threshold.
Sources that project a narrow beam, often in frequencies above 10 kHz directed at the seabed, are expected to have smaller isopleths and less horizontal propagation due to the directionality of the source and faster attenuation rate of higher frequencies. Narrow beamwidths allow geophysical equipment to be highly directional, focusing its energy in the vertical direction and minimizing horizontal propagation, which greatly reduces the possibility of direct path exposure to receivers (i.e., marine mammals) from sounds emitted by these sources. Therefore, for sources with beamwidths <180°, isopleth distances were calculated following NMFS OPR interim guidance (NMFS, 2019b) to account for the influence of beamwidth and frequency on the horizontal propagation of these sources.
The estimated distances to Level A and Level B isopleths calculated for each marine mammal hearing group are given in Table 4.
Table 4. Maximum distance to weighted Level A and unweighted Level B thresholds for each sound source or comparable sound source category for all marine mammal hearing groups1.
Source
Distance to Level A Threshold (m) Distance to Level B (m)
LF (SEL24h
threshold)
MF (SEL24h
threshold)
HF (SEL24h
threshold)
HF (PK
threshold)
PW (SEL24h
threshold)
All (SPL threshold)
Shallow SBPs ET 216 CHIRP <1 <1 2.9 - 0 6 ET 424 CHIRP 0 0 0 - 0 4 ET 512i CHIRP 0 0 <1 - 0 6 GeoPulse 5430 <1 <1 36.5 - <1 16 TB CHIRP III 1.5 <1 16.9 - <1 36 Medium SBPs AA Triple plate S-Boom (700/1,000 J) <1 0 0 4.7 0 25 AA, Dura-spark UHD (500 J /400 tip) <1 0 0 2.8 0 141 AA, Dura-spark UHD 400+400 <1 0 0 2.8 0 141 GeoMarine, Geo-Source dual 400 tip sparker <1 0 0 2.8 0 141
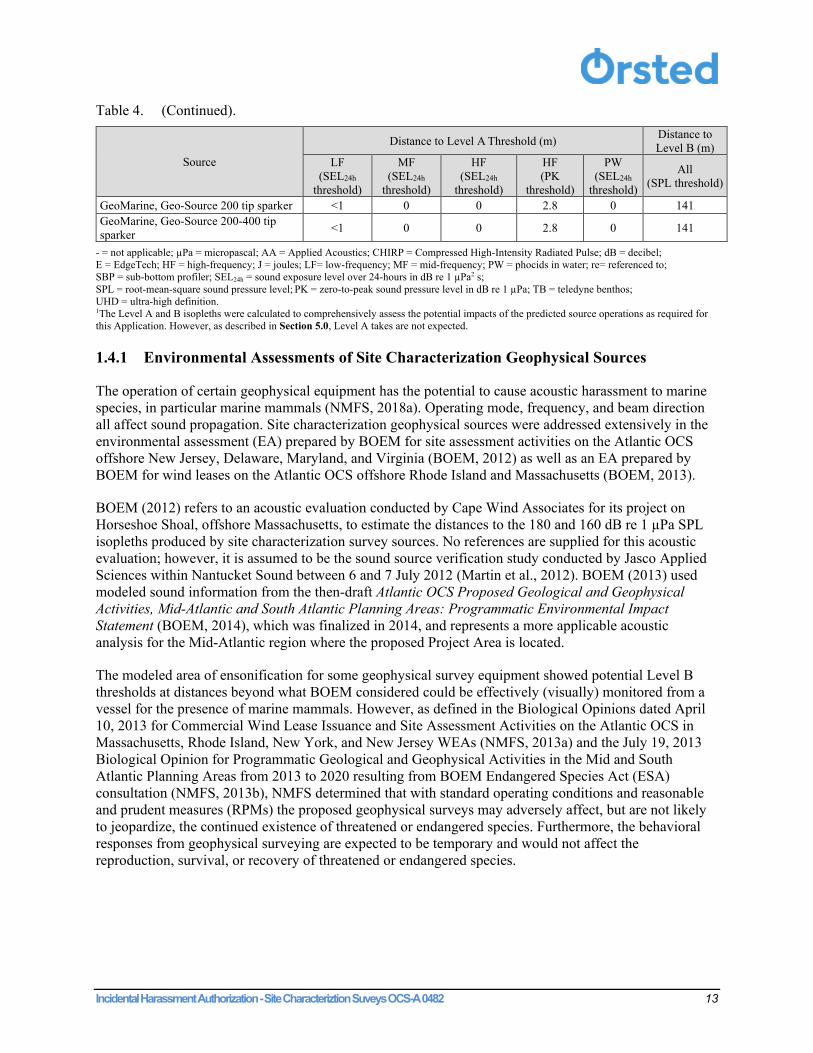
Table 4. (Continued).
Incidental Harassment Authorization - Site Characteriztion Suveys OCS-A 0482 13
Source
Distance to Level A Threshold (m) Distance to Level B (m)
LF (SEL24h
threshold)
MF (SEL24h
threshold)
HF (SEL24h
threshold)
HF (PK
threshold)
PW (SEL24h
threshold)
All (SPL threshold)
GeoMarine, Geo-Source 200 tip sparker <1 0 0 2.8 0 141 GeoMarine, Geo-Source 200-400 tip sparker <1 0 0 2.8 0 141
- = not applicable; µPa = micropascal; AA = Applied Acoustics; CHIRP = Compressed High-Intensity Radiated Pulse; dB = decibel; E = EdgeTech; HF = high-frequency; J = joules; LF= low-frequency; MF = mid-frequency; PW = phocids in water; re= referenced to; SBP = sub-bottom profiler; SEL24h = sound exposure level over 24-hours in dB re 1 µPa2 s; SPL = root-mean-square sound pressure level; PK = zero-to-peak sound pressure level in dB re 1 µPa; TB = teledyne benthos; UHD = ultra-high definition. 1The Level A and B isopleths were calculated to comprehensively assess the potential impacts of the predicted source operations as required for this Application. However, as described in Section 5.0, Level A takes are not expected.
1.4.1 Environmental Assessments of Site Characterization Geophysical Sources
The operation of certain geophysical equipment has the potential to cause acoustic harassment to marine species, in particular marine mammals (NMFS, 2018a). Operating mode, frequency, and beam direction all affect sound propagation. Site characterization geophysical sources were addressed extensively in the environmental assessment (EA) prepared by BOEM for site assessment activities on the Atlantic OCS offshore New Jersey, Delaware, Maryland, and Virginia (BOEM, 2012) as well as an EA prepared by BOEM for wind leases on the Atlantic OCS offshore Rhode Island and Massachusetts (BOEM, 2013).
BOEM (2012) refers to an acoustic evaluation conducted by Cape Wind Associates for its project on Horseshoe Shoal, offshore Massachusetts, to estimate the distances to the 180 and 160 dB re 1 µPa SPL isopleths produced by site characterization survey sources. No references are supplied for this acoustic evaluation; however, it is assumed to be the sound source verification study conducted by Jasco Applied Sciences within Nantucket Sound between 6 and 7 July 2012 (Martin et al., 2012). BOEM (2013) used modeled sound information from the then-draft Atlantic OCS Proposed Geological and Geophysical Activities, Mid-Atlantic and South Atlantic Planning Areas: Programmatic Environmental Impact Statement (BOEM, 2014), which was finalized in 2014, and represents a more applicable acoustic analysis for the Mid-Atlantic region where the proposed Project Area is located.
The modeled area of ensonification for some geophysical survey equipment showed potential Level B thresholds at distances beyond what BOEM considered could be effectively (visually) monitored from a vessel for the presence of marine mammals. However, as defined in the Biological Opinions dated April 10, 2013 for Commercial Wind Lease Issuance and Site Assessment Activities on the Atlantic OCS in Massachusetts, Rhode Island, New York, and New Jersey WEAs (NMFS, 2013a) and the July 19, 2013 Biological Opinion for Programmatic Geological and Geophysical Activities in the Mid and South Atlantic Planning Areas from 2013 to 2020 resulting from BOEM Endangered Species Act (ESA) consultation (NMFS, 2013b), NMFS determined that with standard operating conditions and reasonable and prudent measures (RPMs) the proposed geophysical surveys may adversely affect, but are not likely to jeopardize, the continued existence of threatened or endangered species. Furthermore, the behavioral responses from geophysical surveying are expected to be temporary and would not affect the reproduction, survival, or recovery of threatened or endangered species.

Incidental Harassment Authorization - Site Characteriztion Suveys OCS-A 0482 14
2.0 Survey Dates, Duration, and Specific Geographic Region
2.1 SURVEY ACTIVITY DATES AND DURATION
Site characterization surveys considered under this application will occur between 15 April 2021 and 14 April 2022. The exact dates are not yet established. A survey day is defined here as a 24-hour activity period in which the assumed number of line km are surveyed. The number of anticipated survey days was calculated as the number of days needed to reach the overall level of effort required to meet survey objectives assuming any single vessel travels 4 kn and surveys, on average 70 line km per 24-hour operations.
During the one-year period covered by this IHA, the Applicant is proposing up to 350 vessel survey days during which HRG surveys will be conducted within Lease Area OCS-A 0482 and the associated ECR area. The number of estimated survey days varies between the Lease Area and ECR area, with 200 vessel survey days expected in the Lease Area and 150 vessel survey days in the ECR area. All survey days will include the use of sparker systems which produce the largest impact isopleths.
2.2 SPECIFIC GEOGRAPHIC REGION
The proposed survey activities will occur within the Project Area in federal waters in the Lease Area and potential ECR area to landfall locations in New Jersey and Delaware, as shown in Figure 1. The Lease Area is approximately 284 km2 and is within the DE WEA of BOEM’s Mid-Atlantic planning area. Water depths in the Lease Area range from approximately 15 to 30 m. Water depths within the ECR area in federal waters extend from the shoreline to approximately 30 m.
2.3 SURVEY ACTIVITIES
Site characterization survey activities will include multibeam depth sounding, seafloor imaging, and shallow and medium penetration sub-bottom profiling to meet BOEM requirements as set out in the Guidelines for Providing Archaeological and Historic Property Information Pursuant to 30 CFR Part 585 [March, 2017]; the Guidelines for Providing Geophysical, Geotechnical, and Geohazard Information Pursuant to 30 CFR Part 585 [July, 2015] (BOEM, 2019), as applicable; and to support engineering design and UXO surveys.
Site characterization survey activities considered in this IHA (HRG sources with operating frequencies below 200 kHz) will use combinations of the equipment listed in Table 3 to collect multiple aspects of geophysical data along a transect. Equipment with operating frequencies above 200 kHz (e.g., SSS, MBES) and equipment that does not have an acoustic output (e.g., magnetometers) will also be used but are not considered in the IHA analysis. Selection of equipment combinations is based on specific survey objectives. Field operation modes of each acoustic equipment source are based on survey parameters and ongoing modification due to field conditions and data quality constraints.

Incidental Harassment Authorization - Site Characteriztion Suveys OCS-A 0482 15
3.0 Species and Numbers of Marine Mammals
3.1 PROTECTED POPULATIONS
All marine mammal species are protected under the MMPA. Some marine mammal stocks (defined as a group of nonspecific individuals that are managed separately) (NMFS, 2020a) may be designated as strategic under the MMPA, which requires the jurisdictional agency (NMFS or U.S. Fish and Wildlife Service [USFWS]) to impose additional protection measures.
A stock is considered strategic if:
• Direct human-caused mortality exceeds its Potential Biological Removal (PBR) level (defined as the maximum number of animals, not including natural mortality, that can be removed from the stock while still allowing the stock to reach or maintain its optimum sustainable population level);
• It is listed under the ESA; • It is declining and likely to be listed under the ESA; or • It is designated as depleted under the MMPA.
A depleted species or population stock is defined by the MMPA as any case in which:
• The Secretary, after consultation with the Marine Mammal Commission and the Committee of Scientific Advisors on Marine Mammals established under MMPA Title II, determines that a species or population stock is below its optimum sustainable population;
• A State, to which authority for the conservation and management of a species or population stock is transferred under Section 109 of the MMPA, determines that such species or stock is below its optimum sustainable population; or
• A species or population stock is listed as an endangered species or a threatened species under the ESA.
Some species are further protected under the ESA. Under the ESA, a species is considered endangered if it is “in danger of extinction throughout all or a significant portion of its range.” A species is considered threatened if it “is likely to become an endangered species within the foreseeable future throughout all or a significant portion of its range.”
3.2 MARINE MAMMAL SPECIES
There are 36 species (comprising 37 stocks) of marine mammals in the Western North Atlantic OCS Region that are protected by the MMPA (Table 5) (BOEM, 2012). The marine mammal assemblage comprises 31 species of cetaceans, including 25 members of the suborder Odontoceti (toothed whales, dolphins, and porpoises) and 6 of the suborder Mysticeti (baleen whales). There are five whale species listed as endangered under the ESA with ranges that include the Project Area:
• Fin whale (Balaenoptera physalus); • Sei whale (Balaenoptera borealis); • Blue whale (Balaenoptera musculus); • North Atlantic right whale (Eubalaena glacialis); and • Sperm whale (Physeter macrocephalus).
Along with cetaceans, seals are also protected under the MMPA. Four species of phocids (true seals) with ranges that include the Project Area include harbor seals (Phoca vitulina), gray seals (Halichoerus grypus), harp seals (Pagophilus groenlandicus), and hooded seals (Cystiphora cristata)

Incidental Harassment Authorization - Site Characteriztion Suveys OCS-A 0482 16
(NMFS, 2020a). Finally, one species of sirenian, the Florida manatee (Trichechus manatus), is an occasional visitor to the region during summer months (USFWS, 2019). The manatee is listed as threatened under the ESA and is protected under the MMPA along with the other marine mammals.
The expected occurrence of each species is based on the following criteria and/or on the habitat models (i.e., Best et al., 2012; Roberts et al., 2016; Roberts, 2018, 2020) for the Project Area and species available in the model analyses:
• Common – occurring consistently in moderate to large numbers; • Regular – occurring in low to moderate numbers on a regular basis or seasonally; • Uncommon – occurring in low numbers or on an irregular basis; • Rare – records for some years but limited; and • Not expected – range includes the Project Area but due to habitat preferences and distribution
information, species are not expected to occur in the Project Area although records may exist for adjacent waters.
The protection status, stock identification, occurrence, and abundance estimates of the species listed in Table 5 are discussed in more detail in Section 4.0.
Table 5. Marine mammals with geographic ranges that include the Project Area (NMFS, 2020a; BOEM, 2012).
Common Name Scientific Name Stock Federal
ESA/MMPA Status1
Relative Occurrence in the
Region
Best Estimate1
Fin whale Balaenoptera physalus Western North Atlantic
ESA Endangered/Depleted and Strategic
Regular 6,802
Sei whale Balaenoptera borealis Nova Scotia
ESA Endangered/Depleted and Strategic
Uncommon 6,292
Minke whale Balaenoptera acutorostrata
Canadian East Coast
Non-strategic Regular 21,968
Blue whale Balaenoptera musculus Western North Atlantic
ESA Endangered/Depleted and Strategic
Rare 402
Humpback whale Megaptera novaeangliae Gulf of Maine Non-strategic Common 1,393
North Atlantic right whale Eubalaena glacialis Western North
Atlantic
ESA Endangered/Depleted and Strategic
Regular 412
Sperm whale Physeter macrocephalus North Atlantic
ESA Endangered/Depleted and Strategic
Uncommon 4,349
Dwarf sperm whale Kogia sima Western North Atlantic
Non-strategic Rare 7,750
Pygmy sperm whale Kogia breviceps Western North Atlantic
Non-strategic Rare 7,750

Table 5. (Continued).
Incidental Harassment Authorization - Site Characteriztion Suveys OCS-A 0482 17
Common Name Scientific Name Stock Federal
ESA/MMPA Status1
Relative Occurrence in the
Region
Best Estimate1
Killer whale Orcinus orca Western North Atlantic
Non-strategic Rare Unknown
Pygmy killer whale Feresa attenuata Western North Atlantic
Non-strategic Not Expected Unknown
False killer whale Pseudorca crassidens Western North Atlantic Strategic Rare 1,791
Northern bottlenose whale Hyperoodon ampullatus Western North
Atlantic Non-strategic Not Expected Unknown
Cuvier’s beaked whale Ziphius cavirostris Western North Atlantic
Non-strategic Rare 5,744
Mesoplodon beaked whales2 Mesoplodon spp. Western North
Atlantic Depleted Rare 10,107
Melon-headed whale Peponocephala electra Western North Atlantic
Non-strategic Not Expected Unknown
Risso’s dolphin Grampus griseus Western North Atlantic
Non-strategic Common 35,493
Long-finned pilot whale Globicephala melas Western North
Atlantic Strategic Common 39,215
Short-finned pilot whale
Globicephala macrorhynchus
Western North Atlantic Strategic Uncommon 28,924
Atlantic white-sided dolphin Lagenorhynchus acutus Western North
Atlantic Non-strategic Uncommon 93,233
White-beaked dolphin Lagenorhynchus albirostris
Western North Atlantic
Non-strategic Rare 536,016
Common dolphin Delphinus delphis Western North Atlantic
Non-strategic Common 172,974
Atlantic spotted dolphin Stenella frontalis Western North
Atlantic Non-strategic Uncommon 39,921
Pantropical spotted dolphin Stenella attenuata Western North
Atlantic Non-strategic Rare 6,593
Striped dolphin Stenella coeruleoalba Western North Atlantic
Non-strategic Rare 67,036
Fraser’s dolphin Lagenodelphis hosei Western North Atlantic
Non-strategic Rare Unknown
Rough toothed dolphin Steno bredanensis Western North Atlantic
Non-strategic Rare 136
Clymene dolphin Stenella clymene Western North Atlantic
Non-strategic Not Expected 4,237
Spinner dolphin Stenella longirostris Western North Atlantic
Non-strategic Rare 4,102
Common bottlenose dolphin2 Tursiops truncatus Western North
Atlantic, Offshore Non-strategic Uncommon 62,851
Common bottlenose dolphin2 Tursiops truncatus
Western North Atlantic, northern migratory coastal
Strategic Common 6,639
Harbor porpoise Phocoena phocoena Gulf of Maine/Bay of Fundy
Non-strategic Uncommon 95,543
Harbor seal Phoca vitulina Western North Atlantic
Non-strategic Regular 75,834

Table 5. (Continued).
Incidental Harassment Authorization - Site Characteriztion Suveys OCS-A 0482 18
Common Name Scientific Name Stock Federal
ESA/MMPA Status1
Relative Occurrence in the
Region
Best Estimate1
Gray seal Halichoerus grypus Western North Atlantic
Non-strategic Regular 27,131
Harp seal Pagophilus groenlandica Western North Atlantic
Non-strategic Rare Unknown
Hooded seal Cystophora cristata Western North Atlantic
Non-strategic Rare Unknown
Florida manatee3 Trichechus manatus -
ESA Threatened/Depleted and Strategic
Rare 13,0003
- = not applicable for this species; ESA = Endangered Species Act; MMPA = Marine Mammal Protection Act. 1Best estimate from the most recently published Draft National Oceanic and Atmospheric Administration Stock Assessment Report (NMFS, 2020a). 2Common bottlenose dolphins likely to occur in this area belong to two distinct stocks. 3Current range-wide estimate from the USFWS (2019).

Incidental Harassment Authorization - Site Characteriztion Suveys OCS-A 0482 19
4.0 Affected Species Status and Distribution
Of the 36 marine mammal species with geographic ranges that include the Project Area (Table 5), 16 species can be reasonably expected to reside, traverse, or occasionally visit the Project Area and may be considered affected. Species information is based on NMFS stock assessment reports (SARs) (Waring et al., 2010, 2014, 2015, 2016; Hayes et al., 2017, 2019, 2020; NMFS, 2020a), and regional survey records (e.g., Cetacean and Turtle Assessment Program [CETAP], 1982; Atlantic Marine Assessment Program for Protected Species [AMAPPS], 2010 to 2014 [Palka et al, 2017]; North Atlantic Right Whale Sighting Survey and Right Whale Sighting Advisory System (RWSAS); BOEM Mid-Atlantic EA [BOEM, 2012]; the Northeast Large Pelagic Survey Collaborative Aerial and Acoustic Surveys for Large Whales and Sea Turtles [Kraus et al., 2016]); and preliminary results (unpublished) of PSO/PAM mitigation surveys conducted by the Applicant during site investigation surveys in 2017 and 2018.
Affected species are those that have a common, uncommon, or regular relative occurrence in Project Area (Table 5) or have a very wide distribution with limited distribution or abundance details. Species that are rare or not expected are not carried forward in this application. Therefore, the Applicant requests an IHA for Level B disturbance for the 16 species (one of which comprises 2 stocks) listed below and described in the following sections.
• North Atlantic right whale (Eubalaena glacialis) • Humpback whale (Megaptera novaeangliae) • Fin whale (Balaenoptera physalus) • Sei whale (Balaenoptera borealis) • Minke whale (Balaenoptera acutorostrata) • Sperm whale (Physeter microcephalus) • Risso’s dolphin (Grampus griseus) • Long-finned pilot whale (Globicephala melas) • Short-finned pilot whale (Globicephala macrorhynchus) • Atlantic white-sided dolphin (AWS) (Lagenorhynchus acutus) • Common dolphin (Delphinus delphis) • Atlantic spotted dolphin (Stenella frontalis) • Common bottlenose dolphin (Tursiops truncatus)
o Western North Atlantic offshore stock o Northern migratory stock
• Harbor porpoise (Phocoena phocoena) • Harbor seal (Phoca vitulina) • Gray seal (Halichoerus grypus)
Species will not be equally affected by the proposed activities due to individual exposure patterns, the context in which noise is received, and, most prominently, individual hearing sensitivities. To account for acoustic sensitivity, marine mammal species are categorized into hearing groups that are designated to better predict and quantify impacts of noise (NMFS, 2018a; Southall et al., 2007, 2019). These functional hearing groups are described below with associated reference frequencies. While all these species likely hear beyond these bounds, primary sensitivities fall within the listed frequencies (Section 1.2.1.1).

Incidental Harassment Authorization - Site Characteriztion Suveys OCS-A 0482 20
The following information summarizes data on the status and trends, distribution and habitat preferences, behavior and life history, and auditory capabilities of marine mammals found in the Project Area as available in published literature and reports, including NMFS marine mammal SARs (Waring et al., 2010, 2014, 2015, 2016; Hayes et al., 2017, 2019, 2020; NMFS, 2020a).
4.1 MYSTICETES
4.1.1 North Atlantic Right Whale (Eubalaena glacialis)
The North Atlantic right whale (NARW) is the only member of the Mysticete family Balaenidae found in North Atlantic waters. They are skim feeders that primarily consume zooplankton including copepods, euphausiids, and cyprids. The NARW is listed as endangered and is considered one of the most endangered large whale species in the world (Jefferson et al., 2011). The most recent draft NMFS SAR estimated a population size for the Western North Atlantic stock of only 412 individuals (NMFS, 2020a), which has recovered only slightly from the estimated 100 individuals in the 1930s just prior to the species being afforded protection (Reeves, 2001). The minimum population size for this stock is based on a published state-space model of the sighting histories of individual whales using photo identification techniques. A review of the photo-ID recapture database which included information up through January 2018 indicated that 408 is the current minimum estimate of abundance for NARWs (NMFS, 2020a).
NARWs have been sighted in the Mid-Atlantic Bight in all months of the year but show peak abundances to the north in Cape Cod Bay during late winter and Georges Basin in late summer (Winn et al., 1986; Kenney et al., 1995, 2001). The most recent draft NMFS SAR (NMFS, 2020a) identified seven areas where Western North Atlantic NARW aggregate seasonally: the coastal waters of the southeastern U.S., the Great South Channel, Jordan Basin, Georges Basin along the northeastern edge of Georges Bank, Cape Cod and Massachusetts Bays, the Bay of Fundy, and the Roseway Basin on the Scotian Shelf (Brown et al., 2001; Cole et al., 2013). Several of these congregation areas correlate with seasonally high copepod concentrations (Pendleton et al., 2009). New England waters are a primary feeding habitat for NARWs during late winter through spring, with feeding moving into deeper and more northerly waters during summer and fall. Less is known regarding winter distributions; however, it is understood that calving takes place during this time in coastal waters of the Southeastern U.S.
Passive acoustic studies of NARWs have demonstrated their year-round presence in the Gulf of Maine (Morano et al., 2012; Bort et al., 2015), New Jersey (Whitt et al., 2013), and Virginia (Salisbury et al., 2016). Additionally, NARWs were acoustically detected off Georgia and North Carolina during 7 of the 11 months monitored (Hodge et al., 2015). All of this work further demonstrates the highly mobile nature of NARWs. Movements within and between habitats are extensive and the area off the Mid-Atlantic states is an important migratory corridor. While no critical habitat is listed within the Project Area, 11 NARWs were identified in the Mid-Atlantic Baseline Studies (MABS) surveys conducted between 2012 and 2014 with a total of nine sightings occurring in February and March (Williams et al., 2015a,b). Davis et al. (2017) recently examined detections from passive acoustic monitoring devices and documented a broad-scale use of much more of the U.S. Eastern Seaboard than was previously believed, and an apparent shift in habitat use patterns to the south of traditionally identified NARW congregations. Increased use of Cape Cod Bay and decreased use of the Great South Channel were also observed (Davis et al., 2017).
Off the coast of New Jersey, NARWs were acoustically detected in all seasons and visually observed in winter, spring, and summer during an environment baseline study (EBS) conducted by the New Jersey Department of Environmental Protection (NJDEP, 2010). The greatest number of acoustic detections occurred during April and May (Whitt et al., 2013). Reports from the RWSAS for the Mid-Atlantic
Incidental Harassment Authorization - Site Characteriztion Suveys OCS-A 0482 21
Region (New Jersey through Virginia) show 24 records off the coast of New Jersey since 2015: January (7), March (1), April (4), October (1) and December (11) (NOAA, 2019).
The major threat to the NARW stock is human-caused mortality through incidental fishery entanglement that averaged 6.85 incidents per year and ship strikes that averaged 1.3 incident records per year based on data from 2014 through 2018 (NMFS, 2020a). In June 2017, NMFS declared an Unusual Mortality Event (UME) following an increase in NARW mortalities in the U.S. and Canada. As of 17 February 2021, a total of 33 dead stranded whales have been reported, 21 in Canada, and 12 in the U.S.; the preliminary cause of death for most of these cases was determined to be due to vessel strike or entanglement (NMFS, 2021a). The SAR for NARW sets the PBR level at 0.8; therefore, any mortality or serious injury for this stock can be considered significant (NMFS, 2020a). The Western North Atlantic stock is considered strategic by NMFS because the average annual human-related mortality and serious injury exceeds PBR, and because the NARW is an endangered species.
Seasonal Management Areas (SMAs) for reducing ship strikes of the NARW have also been designated in the U.S. and Canada. All vessels greater than 19.8 m in overall length must operate at speeds of 10 knots or less within these areas during specified time periods (NMFS, 2021b). The closest SMA to the Project Area is at the entrance to Delaware Bay which is, in effect, seasonal from November 1 to April 30 (Figure 2).
Figure 2. Mid-Atlantic Seasonal Management Areas for North Atlantic right whales
(Eubalaena glacialis). (NMFS, 2021b).

Incidental Harassment Authorization - Site Characteriztion Suveys OCS-A 0482 22
The NARW underwent a NMFS 5-year review in 2017, which resulted in no change to its listing status. In 2009, NMFS received a petition to expand the critical habitat, and the agency considered this petition in the rulemaking process. In January 2016, two additional units comprising over 102,000 km2 of marine habitat were designated as critical habitat to encompass the northeast feeding area in the Gulf of Maine/Georges Bank and the southeast calving grounds from North Carolina to Florida.
The following final rules notices are associated with the NARW:
• Critical Habitat Designation: 59 FR 28805, June 3, 1994; • Atlantic Large Whale Take Reduction Plan: 62 FR 39157, July 22, 1997; • Federal Regulations Governing the Approach to North Atlantic right whales: 69 FR 69536,
November 30, 2004; • Final Rule to Implement Speed Restrictions to Reduce the Threat of Ship Collisions with
North Atlantic right whales: 73 FR 60173, October 10, 2008; • Findings on Petition to Revise Critical Habitat: 75 FR 61690, October 6, 2010; • Final Rule to Remove the Sunset Provision of the Final Rule Implementing Vessel Speed
Restrictions to Reduce the Threat of Ship Collisions with North Atlantic right whales 78 FR 73726 December 9, 2013; and
• Final Rule for North Atlantic right whale (Eubalaena glacialis) Critical Habitat 81 FR 4838, January 27, 2016.
NARWs are LF cetaceans that vocalize using a number of distinctive call types, most of which have peak acoustic energy below 500 Hz. Most vocalizations do not go above 4 kHz (Matthews et al., 2014). One typical NARW vocalization is the “up call”; a short sweep that rises from roughly 50 to 440 Hz over a period of 2 seconds. These up calls are characteristic of NARWs and are used by research and monitoring programs for indication of species presence. A characteristic “gunshot” call is believed to be produced by male NARWs. These pulses can have SLs of 174 to 192 dB re 1 µPa m with frequency range from 50 to 2,000 Hz (Parks et al., 2005; Parks and Tyack, 2005). Other tonal calls range from 20 to 1,000 Hz and have SLs between 137 and 162 dB re 1 µPa m.
4.1.2 Humpback Whale (Megaptera novaeangliae)
The humpback whale is a robust and medium-sized mysticete. It is distinguished from all other cetaceans by its long flippers, which are approximately one-third the length of the body (Jefferson et al., 2008). One species of the humpback whale is currently recognized (Committee on Taxonomy, 2018). Humpback whales are largely piscivorous, feeding primarily on herring (Clupea spp.), sand lance (Ammodytes spp.), and other small fishes as well as euphausiids in the Gulf of Maine (Hayes et al., 2019). Humpbacks show fidelity to feeding sites; however, local distribution is driven by prey availability and bathymetry, resulting in the whales transiting widely throughout their feeding habitat between spring and fall in search of prey. Feeding is the principal activity of humpback whales in New England waters, and their distribution in this region has been largely correlated to prey species and abundance (Payne et al., 1986, 1990).
The humpback whales occurring within the Project Area are believed to be mainly part of the Gulf of Maine stock (NMFS, 2020a). Humpback whales have a global distribution and follow a migratory pattern of feeding in the high latitudes during summers and spending winters in the lower latitudes for calving and mating. The Gulf of Maine stock follows this pattern with winters spent in the Caribbean and West Indies, although acoustic recordings show a small number of males persisting in Stellwagen Bank throughout the year (Vu et al., 2012). The Gulf of Maine stock is an estimated 1,393 individuals (NMFS, 2020a).

Incidental Harassment Authorization - Site Characteriztion Suveys OCS-A 0482 23
Sightings of humpback whales in the Mid-Atlantic are common (Barco et al., 2002), as are strandings (Wiley et al., 1995). Barco et al. (2002) suggested that the Mid-Atlantic region primarily represents a supplemental winter feeding ground used by humpbacks. During the MABS surveys, a total of 13 humpback whales were recorded between 2012 and 2014: eight during the winter, one during the summer, and four during the fall (Williams et al., 2015a,b). There was a total of 17 groups sighted during the NJDEP EBS, nine of which occurred during winter months (Whitt et al., 2015).
Primary threats to humpback whales are fishing gear entanglements and ship strikes. Mortality and serious injury records for large whales in the Western North Atlantic over a 40-year period (1970 to 2009) were reviewed to assess the magnitude of human related mortalities (van der Hoop et al., 2013). Results showed that roughly 27% of mortalities and serious injuries were humpback whale records. Of the humpback records where a cause could be determined (203 records), 57% of mortalities were caused by entanglements in fishing gear and 15% were attributable to vessel strikes. Glass et al. (2009) reported that between 2002 and 2006, humpback whales belonging to the Gulf of Maine stock were involved in 77 confirmed fishing gear entanglements and nine confirmed ship strikes. Records assessed between 2014 and 2018 resulted in a minimum annual rate of human-caused mortality and serious injury to the Gulf of Maine stock of 15.25 animals per year (NMFS, 2020a). This value includes an annual rate of incidental fishery interactions (9.45) and vessel strikes (5.8) (NMFS, 2020a). In 2016, a high number of humpback mortalities prompted NMFS to declare a UME starting in January (NMFS, 2021c). As of 5 February 2021, a total of 146 humpback whales have been found dead between Maine and Florida. Of these mortalities, eight occurred in Delaware, two in Maryland, 16 in New Jersey, and 31 in New York. Of the carcasses examined, approximately 50% had evidence of human interaction such as vessel strike or entanglement (NMFS, 2021c).
On September 8, 2016, NMFS published a final decision changing the status of humpback whales under the ESA (81 FR 62259), effective as of October 11, 2016. Previously, humpback whales were listed under the ESA as an endangered species worldwide. In the 2016 decision, NMFS recognized the existence of 14 distinct population segments (DPSs), of which four were listed as endangered, one was listed as threatened, and the remaining nine did not warrant protection under the ESA. A status review of the humpback whale was undertaken by NMFS in 2015 (Bettridge et al., 2015) to identify taxonomic units such as DPSs and assess the extinction risk of these units. To be considered a DPS, a population or group of populations must be “discrete” from the remainder of the taxon to which it belongs, and “significant” to the taxon to which it belongs. Information on distribution, ecological situation, genetics, and other factors is used to evaluate a population’s discreteness and significance. This review process resulted in the identification of a West Indies DPS, which includes the Gulf of Maine stock. The West Indies DPS was considered not to be at risk of extinction. Subsequently, the Gulf of Maine stock is not a strategic stock and no critical habitat has been designated for the humpback whale (NMFS, 2020a).
Like other large whales, increases in noise levels may affect this species’ ability to transmit and access acoustic cues in the environment. For example, Clark et al. (2009) predicted an 8% reduction in communication space due to shipping for singing humpback whales in the northeast. Humpbacks are LF species but have one of the most varied vocal repertoires of the baleen whales. Male humpbacks will arrange vocalizations into a complex, repetitive sequence to produce a characteristic “song.” Songs are variable, but typically occupy in frequency bands between 300 and 3,000 Hz and last upwards of 10 minutes. Songs are predominately produced while on breeding grounds; however, they have been recorded on feeding grounds throughout the year (Clark and Clapham, 2004; Vu et al., 2012). Typical feeding calls are centered at 500 Hz with some other calls and songs reaching 20 kHz. Common humpback calls also contain series of grunts between 25 and 1,900 Hz as well as strong, LF pulses (with SLs up to 176 dB re 1 µPa m) between 25 and 90 Hz (Clark and Clapham, 2004; Vu et al., 2012).

Incidental Harassment Authorization - Site Characteriztion Suveys OCS-A 0482 24
4.1.3 Fin Whale (Balaenoptera physalus)
Fin whales are a widely distributed species found in all oceans of the world. The fin whale is listed as endangered under the ESA and a Final Recovery Plan for fin whales is available for review (NMFS, 2010). Fin whales transit between summer feeding grounds in the high latitudes and their wintering, calving, or mating habitats in low latitudes or offshore. However, acoustic records indicate that fin whale populations may be less migratory than other mysticetes whose populations make distinct annual migrations (Watkins et al., 2000). Fin whales typically feed on sand lance, capelin (Mallotus villosus), euphausiids, herring, copepods, and cephalopods (i.e., squid) in deeper waters near the edge of the continental shelf (90 to 180 m) but will migrate towards coastal areas following prey distribution.
The fin whales that occur within the Project Area are part of the Western North Atlantic stock of fin whales. This is considered a strategic stock because fin whales are listed as endangered throughout their range. In February 2019, NMFS undertook a 5-year status review (NMFS, 2019c) of the fin whale and determined that there should be no change in its listing status. The best population abundance estimate is 6,802 individuals (NMFS, 2020a).
Along the Atlantic seaboard, they are mainly found from Cape Hatteras northward with a distribution in both continental shelf and deep-water habitats (NMFS, 2020a). The Northern fin whale subspecies is found within the Project Area. Fin whales accounted for 46% of the large whales sighted during aerial surveys along the continental shelf (CETAP, 1982) between Cape Hatteras and Nova Scotia from 1978 to 1982. Fin whales were also the most frequently sighted large whale species during the NJDEP EBS with 37 groups sighted throughout all seasons (Whitt et al., 2015). MABS reported two fin whales during the winter and two during the spring (Williams et al., 2015a,b).
Threats to fin whales are entanglements in fishing gear and ship strikes. For the period between 2014 through 2018, the minimum annual rate of human-caused mortality and serious injury to fin whales was 2.35 individuals per year. This value includes 1.55 fishery interaction records per year and 0.8 vessel strike records per year (NMFS, 2020a). The total human-caused mortality and serious injury is less than the calculated PBR; however, it cannot be considered insignificant due to uncertainties regarding these estimates and the current endangered status of this population which make this a strategic stock under the MMPA. There is no designated critical habitat for this stock (NMFS, 2020a).
Fin whales are LF cetaceans that produce short-duration, down sweep calls between 15 and 30 Hz, typically termed “20-Hz pulses” as well as tonal calls up to 150 Hz. The SL of the fin whale vocalizations can reach 186 dB re1 µPa m, making it one of the most powerful biological sounds in the ocean (Charif et al., 2002).
4.1.4 Sei Whale (Balaenoptera borealis)
Sei whales are a widespread species throughout the world’s temperate, subpolar, subtropical, and tropical oceans (Waring et al., 2015). They are very similar in appearance to fin and Bryde’s whales (Balaenoptera edeni). Two subspecies of sei whales are currently recognized (Committee on Taxonomy, 2018) and the Northern sei whale (B. b. borealis) is known to occur within the Project Area. The sei whales occurring in the Project Area are part of the Nova Scotia stock (formerly the Western North Atlantic stock). Sei whales are most common in deeper waters along the continental shelf edge (Hayes et al., 2017) but will forage occasionally in shallower, inshore waters. The average spring abundance estimate for surveys conducted between 2010 and 2013 is 6,292 individuals, which is considered the best available abundance estimate for the Nova Scotia stock because these surveys covered the largest portion of its range (NMFS, 2020a).

Incidental Harassment Authorization - Site Characteriztion Suveys OCS-A 0482 25
Sei whales are most abundant in Northeastern U.S. waters during the spring, with sightings concentrated along the eastern and southwestern margins of Georges Bank in the area of Hydrographer Canyon (CETAP, 1982). Less is known about the sei whale in the Mid-Atlantic region. AMAPPS data indicate this species is distributed through the Mid-Atlantic, particularly in spring when they are more widely dispersed, but they are more concentrated along the shelf edge (Palka et al., 2017). No sei whales were sighted during the NJDEP EBS. Only one sei whale was reported during the MABS surveys, and this sighting occurred during the winter survey (Williams et al., 2015a). The sei whale feeds primarily on euphausiids and copepods, but will also prey upon fish and local abundance is largely driven by prey availability. The occurrence and abundance of sei whales on feeding grounds may shift dramatically from one year to the next.
From 2014 through 2018, the minimum rate of confirmed human-caused serious injury and mortality to the Nova Scotia stock was 1.20 individual per year, which was attributed to fisheries interactions (0.4) and vessel strikes (0.8) (NMFS, 2020a). The Nova Scotia stock is strategic because the species is listed as endangered under the ESA and the average human-related mortality and serious injury exceeds the PBR. There is no designated critical habitat for this species (NMFS, 2020a).
There are limited confirmed sei whale vocalizations; however, studies indicate that this species produces several, mainly LF (<1,000 Hz) vocalizations. Several calls attributed to sei whales include pulse trains up to 3 kHz, broadband “growl” and “whoosh” sounds between 100 and 600 Hz, tonal calls and upsweeps between 200 and 600 Hz, and down sweeps between 34 and 100 Hz (Baumgartner et al., 2008; Rankin and Barlow, 2007; McDonald et al., 2005).
4.1.5 Minke Whale (Balaenoptera acutorostrata)
The minke whale is a small mysticete that is divided into two species: the common minke whale and the Antarctic minke whale. The common minke whale is further divided into three subspecies (Committee on Taxonomy, 2018). The subspecies B. a. acutorostrata occurs throughout the North Atlantic. Generally, minke whales occupy warmer waters during the winter and travel north to colder regions in the summer, with some animals migrating as far as the ice edge. Minke whales are frequently observed in coastal or shelf waters along with humpback and fin whales owing to their piscivorous feeding habitats where prey includes sand lance and herring (Hayes et al., 2019). The current best abundance estimate for the Canadian East Coast stock is 24,202 individuals (NMFS, 2020a).
Little is known about their specific movements through the Mid-Atlantic region; however, acoustic detections show that minke whales migrate south in mid-October to early November, and return from wintering grounds starting in March through early April (Risch et al., 2014). Northward migration appears to track the warmer waters of the Gulf Stream along the continental shelf, while southward migration is made farther offshore (Risch et al., 2014). The MABS surveys reported six minke whales between 2012 and 2014; one during spring surveys, two during fall surveys, and three during winter surveys. Four groups were observed during the NJDEP EBS in the winter and spring (Whitt et al., 2015).
Like other baleen whales, threats to minke whales include ship strikes and fisheries interactions. However, unlike the larger whales, minke whales are more susceptible to bycatch threats from bottom trawls, lobster trap/pot, gillnet, and purse seine fisheries. During the period from 2014 to 2018, the average annual minimum detected human-caused mortality and serious injury was 10.55 minke whales per year. This number was composed of 8.95 whales per year from unobserved U.S. fisheries bycatch, 0.2 from U.S. fisheries based on observer data, 1.20 whale per year from ship strikes, and 0.2 from other human interaction (NMFS, 2020a). Estimated rates of serious injury and mortality are less than the calculated PBR, but it cannot be considered insignificant or approaching zero (NMFS, 2020a). Vessel strikes have been documented from New York, North Carolina, New Jersey, and Virginia (Hayes et al.,

Incidental Harassment Authorization - Site Characteriztion Suveys OCS-A 0482 26
2017). Since January 2017, a UME has been declared due to minke whale mortalities occurring between Maine and South Carolina. As of 5 February 2021, a total of 104 strandings have been reported with 16 of those occurring in New York and 10 in New Jersey. Examinations for several of the whales showed evidence of human interactions such as vessel strike or entanglement, or infectious disease (NMFS, 2021d). Additionally, minke whales continue to be hunted as part of an ongoing whaling industry in the northeastern North Atlantic, the North Pacific, and Antarctic (Reeves et al., 2012).
Minke whale recordings have resulted in some of the most variable and unique vocalizations of any marine mammal. Common calls for minke whales found in the North Atlantic include repetitive, LF (100 to 500 Hz) pulse trains that may consist of either grunt-like pulses or thump-like pulses. The thumps are very short in duration (50 to 70 milliseconds) with peak energy between 100 and 200 Hz. The grunts are slightly longer in duration (165 to 320 milliseconds) with most energy between 80 and 140 Hz. In addition, minke whales will repeat a 6 to 14-minute pattern of 40 to 60 second pulse trains over several hours (Risch et al., 2014). Minke whales produce a unique sound called the “boing” which consists of a short pulse at 1.3 kHz followed by an undulating tonal call around 1.4 kHz. This call was widely recorded but remained unidentified for many years and scientists widely speculated as to its source (Rankin and Barlow, 2005). The call frequency of minke whales suggests a hearing sensitivity higher than that of other baleen whales.
4.2 ODONTOCETES
4.2.1 Sperm Whale (Physeter macrocephalus)
Sperm whales can easily be distinguished in visual surveys by their large, blunt head; narrow underslung jaw; and characteristic blow shape resulting from the S-shaped blowhole set at the front-left of the head (Jefferson et al., 2008). They can be found throughout the world’s oceans; they have been observed near the edge of the ice packs in both hemispheres and are also common along the equator. The North Atlantic stock is distributed mainly along the continental shelf edge, over the continental slope, and mid-ocean regions, where they prefer water depths of 600 m or more. Sperm whales are uncommon in waters <300 m deep (Waring et al., 2015). Sperm whales are listed as endangered under the ESA and are considered a strategic stock by NMFS (Waring et al., 2015). Data are insufficient to assess population trends and the current abundance estimate was based on only a fraction of the known stock range (Waring et al., 2015). The best recent abundance estimate for sperm whales is the sum of the estimates from 2016 surveys totaling 4,349 (Hayes et al., 2020).
In winter, sperm whales concentrate east and northeast of Cape Hatteras. In spring, distribution shifts northward to east of Delaware and Virginia, and is widespread throughout the central Mid-Atlantic Bight and the southern part of Georges Bank. In the fall, sperm whale occurrence on the continental shelf south of New England reaches peak levels, and there remains a continental shelf edge occurrence in the Mid-Atlantic Bight (Waring et al., 2015). No sperm whales were recorded during the MABS surveys or the NJDEP EBS. CETAP and NMFS Northeast Fisheries Science Center sightings in shelf-edge and off-shelf waters included many social groups with calves/juveniles (CETAP, 1982). Sperm whales were usually seen at the tops of seamounts and rises and did not generally occur over slopes. Sperm whales were recorded over depths varying from 800 to 3,500 m. Although the likelihood of occurrence within the Project Area remains very low, the sperm whale was included as an affected species due to its high seasonal densities east of the Project Area.
Historically, thousands of sperm whales were killed during the early 18th Century. Presently, no hunting is allowed for any purposes in the North Atlantic. Occasionally, sperm whales become entangled in fishing gear or struck by ships off the east coast of the U.S. However, this rate of mortality is not believed to have biologically significant impacts. The annual average human-caused mortality for 2008 to 2012

Incidental Harassment Authorization - Site Characteriztion Suveys OCS-A 0482 27
was estimated to be 0.8 individuals due to entanglement and vessel strikes. During this same period, a total of 14sperm whale strandings have been reported in the U.S.; while the reasons for stranding could not be determined for all these cases, possible causes include vessel strikes, entanglement, pollution, and changes to their environment (Waring et al., 2015). However, there were no documented reports of human-caused mortality or serious injury for the period between 2013 and 2017 (Hayes et al., 2020). This stock is considered strategic under the MMPA due to its endangered status, but since human-caused mortality and serious injury is less than PBR, it is not considered significant (Hayes et al., 2020).
Sperm whales are in the MF hearing group with an estimated auditory range of 150 Hz to 160 kHz (Southall et al., 2007). Sperm whales produce short-duration repetitive broadband clicks used for communication and echolocation. These clicks range in frequency from 0.1 to 30 kHz, with dominant frequencies between the 2 to 4 kHz and 10 to 16 kHz ranges (Department of the Navy [DoN], 2008). Echolocation clicks from adult sperm whales are highly directional and have an estimated SL of up to 236 dB re 1 µPa m.
4.2.2 Risso’s Dolphin (Grampus griseus)
Risso’s dolphins are large dolphins with a characteristic blunt head and light coloration, often with extensive scarring. They are widely distributed in tropical and temperate seas. In the Western North Atlantic they occur from Florida to eastern Newfoundland (Leatherwood et al., 1976; Baird and Stacey, 1991). Off the U.S. Northeast Coast, Risso’s dolphins are primarily distributed along the continental shelf, but can also be found swimming in shallower waters to the mid-shelf (Waring et al., 2016).
The status of the Western North Atlantic stock of the Risso’s dolphin in the U.S. Atlantic Exclusive Economic Zone is not well documented. An abundance estimate of 35,493 individuals in this stock was generated from a shipboard and aerial survey conducted between Florida and Newfoundland during 2016 (Hayes et al., 2020). Risso’s dolphins are not listed as threatened or endangered under the ESA and the Western North Atlantic stock is not considered strategic under the MMPA.
Risso’s dolphins occur along the continental shelf edge from Cape Hatteras to Georges Bank during spring, summer, and autumn. In winter, they are distributed in the Mid-Atlantic from the continental shelf edge outward (Hayes et al., 2019). The majority of sightings during the 2011 surveys occurred along the continental shelf break with generally lower sighting rates over the continental slope (Palka, 2012). Risso’s dolphins can be found in Mid-Atlantic waters year-round, and are more likely to be encountered offshore given their preference for deeper waters along the shelf edge. However, previous surveys have commonly observed this species in shallower waters, making it possible this species could be encountered in the Project Area, particularly in summer when they are more abundant in this region (Curtice et al., 2019; Williams et al., 2015a,b; Waring et al., 2016).
Entanglement and fisheries interactions are the primary threats to Risso’s dolphins in the U.S. Atlantic. Estimated annual rates of serious injury and mortality from 2013 to 2017 were 53.9 mortalities in observed fisheries and 0.4 mortalities from non-fishery-related strandings (Hayes et al., 2020). There were 38 strandings were reported during this period, three of which had confirmed evidence of human interactions (Hayes et al., 2020). Total human-related mortality does not exceed the calculated PBR but is not considered to be insignificant or approaching zero for this population (Hayes et al., 2020).
Risso’s dolphins are in the MF functional hearing group, with an estimated auditory bandwidth of 150 Hz to 160 kHz (Southall et al., 2007). Vocalizations range from 400 Hz to 65 kHz (DoN, 2008).
Incidental Harassment Authorization - Site Characteriztion Suveys OCS-A 0482 28
4.2.3 Long-finned Pilot Whale (Globicephala melas)
There are two species of pilot whale in the Western North Atlantic: long-finned (G. melas) and short-finned (G. macrorhynchus) (Section 4.2.4). The species overlap, are difficult to tell apart, and parameters that define their distributions are not well differentiated. The best distinguishing characteristic of the long-finned pilot whale are the long, slender flippers, which are typically not visible during aerial or shipboard surveys (Jefferson et al., 2011). However, it is generally accepted that pilot whale sightings above approximately 42° N are most likely long-finned pilot whales (Waring et al., 2015).
Pilot whales are distributed along the continental shelf waters off the Northeastern U.S. coast in the winter and early spring. By late spring, pilot whales migrate into more northern waters including Georges Bank and the Gulf of Maine and remain there until fall (Hayes et al., 2019). Long-finned and short-finned pilot whales overlap in the Mid-Atlantic along the shelf edge between New Jersey and the southern flank of Georges Bank, making it likely that both species of pilot whale may be found in the Project Area (Hayes et al., 2020).
Long-finned pilot whales occur over the continental slope in high densities during winter and spring, then move inshore and into shelf waters during summer and autumn following prey populations of cephalopods (i.e., squid) and mackerel (Scomber spp.) (Reeves et al., 2012). They will also readily feed on other fish, cephalopods, and crustaceans. Pilot whales are common in central and northern Georges Bank, Great South Channel, Stellwagen Bank, and in the Gulf of Maine during the summer and early fall (May and October) (Hayes et al., 2019). Long-finned pilot whales are highly social, vocal, and are typically observed in groups of 10 to 20 surface-active individuals. Long-finned pilot whales are not listed as threatened or endangered, and the Western North Atlantic stock is not considered strategic under the MMPA. The best population estimate for the Western North Atlantic stock of long-finned pilot whales is 39,215 individuals (Hayes et al., 2020).
A source of mortality and injury to long-finned pilot whales is bycatch during gillnet fishing, pelagic trawling, longline fishing, and purse seine fishing. For the period between 2013 and 2017, the observed average fishery-related mortality or serious injury was 21 long-finned pilot whales per year (Hayes et al., 2020). The highest observed bycatch rate for all pilot whales occurred in the pelagic longline fishery, with peak bycatch occurring during September and October along the Mid-Atlantic coast. However, based on biopsy data, the majority, if not all, of the bycatch whales were short-finned. Other fisheries mortalities (e.g., bottom trawls, mid-water trawls, gillnets) are more frequently observed north of 40° N; therefore, these fisheries likely have a higher proportional impact on long-finned pilot whales. Mean human-caused annual mortality and serious injury does not exceed the calculated PBR for this stock; however, it is not considered insignificant or approaching zero. There is no designated critical habitat for this species (Hayes et al., 2020).
Long-finned pilot whales also demonstrate a propensity to mass strand; however, the role that human activities play in these strandings is not known. From 2013 to 2017, 16 long-finned pilot whales stranded between Maine and Florida. Bioaccumulated toxins are also a potential source of human-caused mortality in pilot whales. Polychlorinated biphenyls and chlorinated pesticides (e.g., DDT, DDE, dieldrin) have been found in pilot whale blubber (Muir et al., 1988; Weisbrod et al., 2000) and bioaccumulation levels of these toxins were more similar in whales from the same stranding group than from animals within the same sex or age category (Weisbrod et al., 2000).
Long-finned pilot whales are part of the MF hearing group with an estimated auditory bandwidth of 150 Hz to 160 kHz (Southall et al., 2007). All pilot whales echolocate and produce tonal calls. Long-finned pilot whales produce burst-pulses which ranged from 100 to 22,000 Hz. The primary tonal calls of the long-finned pilot whale range from 1 to 8 kHz with a mean duration of about 1 second. The

Incidental Harassment Authorization - Site Characteriztion Suveys OCS-A 0482 29
calls can be varied with seven categories identified (level, falling, rising, up-down, down-up, waver, and multi-hump) and are likely associated with specific social activities (Vester et al., 2014).
4.2.4 Short-finned Pilot Whale (Globicephala macrorhynchus)
Short-finned pilot whales are similar in size to long-finned pilot whales (Section 4.2.3) (Jefferson et al., 2011). Data indicate that short-finned pilot whales inhabit primarily the Southeast Atlantic and Caribbean, however, strandings have been documented as far north as Massachusetts. Short-finned pilot whales are not listed under the ESA, and the North Atlantic stock is not considered strategic. Recent surveys conducted between central Florida and Georges Bank in the summer of 2016 provided an abundance estimate of 28,924 individuals of this species in the Western North Atlantic (Hayes et al., 2020).
There is limited information on the distribution of short-finned pilot whales; they prefer warmer or tropical waters and deeper waters offshore, and in the Northeast U.S. they are often sighted near the Gulf Stream (Hayes et al., 2019). Like the long-finned morphotype, short-finned pilot whales are social and are often observed in groups of 20 to 50 animals. They have been given the nickname “cheetahs of the deep sea” due to the high-speed dives that this species undertakes while foraging in relation to other deep-diving cetacean species (Aguilar Soto et al., 2008).
During visual surveys, it is often difficult to distinguish between long- and short-finned pilot whales so exact distributions of these species in the Mid-Atlantic are uncertain. As discussed in Section 4.2.3, these species overlap spatially offshore New Jersey, making it likely that both may be present in the Project Area (Hayes et al., 2019). Recent tagging studies have observed short-finned pilot whales as far north as Nantucket Sholes, however in the northern extent of their range, short-finned pilot whales are thought to inhabit primarily offshore waters along the shelf break, limiting the number of individuals that may be encountered during surveys (Hayes et al., 2020).
The annual rate of fisheries-related injury and mortality for short-finned pilot whales is uncertain due to the fact that bycatch rates are provided for undifferentiated pilot whales. In the Mid-Atlantic, pilot whale bycatch rates are attributed primarily to short-finned pilot whales based on genetic data collected in the region (Hayes et al., 2019). Between 2014 and 2016, more fisheries interactions were observed further north along the southern Georges Bank. Due to the higher water temperatures recorded during the surveys, they were estimated to have a 90% probability of being short-finned species (Hayes et al., 2019). Based on these observations and the expected distribution of short-finned pilot whales, the mean annual fishery-related mortality and serious injury from 2013 to 2017 was estimated to be 160 whales (Hayes et al., 2020). This does not exceed the calculated PBR for this stock, however, as with long-finned pilot whales, it is not considered insignificant or approaching zero (Hayes et al., 2020).
Like long-finned pilot whales, short-finned pilot whales are also susceptible to mass strandings, and it is estimated that between 2 and 168 pilot whales have stranded annually along the U.S. east coast since 1980. Between 2013 and 2017, there were approximately 14 reported strandings of short-finned pilot whales between Massachusetts and Florida, although the precise cause of these strandings is uncertain. Habitat contamination is also a concern for this stock, although the population effects of the observed levels of contaminants in their habitat are unknown (Hayes et al., 2020).
Short-finned pilot whales fall into the same MF auditory category as the long-finned morphotype, but recorded vocalizations for this species are slightly higher. Burst-pulse sounds had a frequency range from 1 to greater than 30 kHz (versus long-finned pilot whale burst-pulses which ranged from 100 to 22,000 Hz), and foraging clicks had a peak frequency between 8 and 39 kHz (Erbe et al., 2016).

Incidental Harassment Authorization - Site Characteriztion Suveys OCS-A 0482 30
4.2.5 Atlantic White-Sided Dolphin (Lagenorhynchus acutus)
The Atlantic white-sided (AWS) dolphin is a robust animal characterized by a strongly “keeled” tail stock and distinctive color pattern (Jefferson et al., 2008; Waring et al., 2015). The AWS dolphin occurs primarily along the 100-m depth contour within temperate and subpolar waters of the North Atlantic. Seasonally, AWS dolphins occupy northern, inshore waters during summer and southern, offshore waters in the winter. AWS dolphins that potentially occur in the Project Area are all part of the Western North Atlantic stock, which inhabit waters from central West Greenland to North Carolina (about 35° N) (Waring et al., 2015). There is some evidence supporting the division of the Western Atlantic population into three separate stocks; however, this has not been clearly established (Hayes et al, 2019). The estimated average annual human-related mortality does not exceed the PBR for this stock and the AWS dolphin is not listed as threatened or endangered; therefore, the stock is not considered strategic under the MMPA. The best abundance estimate for the Western North Atlantic AWS dolphin stock is 93,233 individuals (Hayes et al., 2020).
AWS dolphins feed on a variety of fish such as herring, hake (Merluccius spp.), smelt (Osmerus spp.), capelin, and cod (Gadus spp.) as well as cephalopods and crustaceans (i.e., squid and shrimp). Like many dolphins, this species is highly gregarious and will often travel in groups of 100 or more and are highly vocal when in these aggregations. Breeding takes place between May and August with most calves born in June and July (Rasmussen and Miller, 2002).
The Virginia and North Carolina observations appear to represent the southern extent of the species range. Prior to the 1970s, AWS dolphins in U.S. waters were found primarily offshore on the continental slope, while white-beaked dolphins (L. albirostris) were found on the continental shelf. During the 1970s, there was an apparent switch in habitat use between these two species. This shift may have been a result of the decrease in herring and increase in sand lance in the continental shelf waters (Katona et al., 1993; Kenney et al., 1996). AWS dolphins are opportunistic feeders and their diet is based on available prey (Craddock et al., 2009). MABS data indicate this species may be present around the Project Area between fall and spring, remaining primarily on the shelf edge and only occasionally traveling inshore (Williams et al., 2015a,b).
Mortality to AWS dolphins resulting from fisheries interactions averaged 26 dolphins per year between 2013 and 2017. This number was comprised of recorded mortality or serious injury from gillnets (2.8 per year), bottom trawls (21 per year), and mid-water trawls (1.9 per year) (Hayes et al., 2020). There was a total of 123 documented strandings of this species during this period; human interaction, such as pollution, was indicated for four of these cases (Hayes et al., 2020). The total human-caused annual mortality and serious injury is less than the calculated PBR but is not considered insignificant or approaching zero (Hayes et al., 2020).
AWS dolphins are in the MF hearing group with an estimated auditory bandwidth of 150 Hz to 160 kHz (Southall et al., 2007). Their vocalizations range from 6 to 15 kHz (DoN, 2008).
4.2.6 Common Dolphin (Delphinus delphis)
The common dolphin may be one of the most widely distributed species of cetaceans, as it is found worldwide in temperate, tropical, and subtropical seas (Waring et al., 2015). Two species were previously recognized: the long-beaked common dolphin (D. capensis) and the short-beaked common dolphin; however, Cunha et al. (2015) summarized the relevant data and analyses, along with additional molecular data and analysis, and recommended that the long-beaked common dolphin not be further used for the Atlantic stock. This taxonomic convention is used by the Society for Marine Mammalogy. The best

Incidental Harassment Authorization - Site Characteriztion Suveys OCS-A 0482 31
population estimate for this stock is 172,947 individuals. The species is not listed as threatened or endangered under the ESA, and the stock is not classified as a strategic or depleted stock (NMFS, 2020a).
Common dolphins are distributed in waters off the U.S. East Coast from Cape Hatteras to Georges Bank (35° N to 42° N) during mid-January to May and move as far north as the Scotian Shelf from mid-summer to autumn (CETAP, 1982; Hamazaki, 2002; Hayes et al., 2019; Selzer and Payne, 1988). Common dolphins are primarily found at the shelf and shelf break along the Gulf Stream, however, common dolphins are known to occur in both nearshore and deep offshore waters (Perrin, 2002). Common dolphins aggregate in large schools numbering in the hundreds, although the typical group size is 30 or fewer (Reeves et al., 2012).
A total of 270 common dolphin were recorded during the 2012 to 2014 MABS surveys. These recorded sightings occurred in all seasons (Williams et al., 2015a,b). During the NJDEP EBS there were 32 groups of common dolphins sighted during fall and winter. Mean water depth for these sightings was 23.2 m (Whitt et al., 2015). These sightings are consistent with known seasonal migrations of this species into Mid-Atlantic waters during colder months.
The common dolphin feeds on small schooling fish and squid; as such, common dolphins are subject to bycatch in gillnets, pelagic trawls, and longline fisheries (Reeves et al., 2012; NMFS, 2020a). During 2014 to 2018, an estimated average of 399 common dolphins were taken each year in fisheries activities, plus 0.2 individuals per year from research takes (NMFS, 2020a). During this period, 499 common dolphins were reported stranded between Maine and Florida; 35 of these cases showed signs of human interaction such as entanglement or fishery interaction. The total annual mortality and serious injury does not exceed the calculated PBR, but it cannot be considered insignificant or approaching zero for this population. There is no designated critical habitat for this species (NMFS, 2020a).
Common dolphins are in the MF hearing group with an estimated auditory bandwidth of 150 Hz to 160 kHz (Southall et al., 2007). Their vocalizations range widely from 200 Hz to 150 kHz (DoN, 2008).
4.2.7 Atlantic Spotted Dolphin (Stenella frontalis)
Atlantic spotted dolphins are widely distributed in tropical and warm temperate waters of the Western North Atlantic (Leatherwood et al., 1976). They range from southern New England south through the Gulf of Mexico, and from the Caribbean to Venezuela (Leatherwood et al., 1976; Perrin et al., 1994). Atlantic spotted dolphins are not listed as threatened or endangered under the ESA. Atlantic species of spotted dolphins were not differentiated during surveys, resulting in insufficient data to determine the population trends. The stock status is also unknown (Waring et al., 2014). The best estimate of abundance derived from 2016 surveys for the Western North Atlantic stock of Atlantic spotted dolphins is 39,921 individuals (Hayes et al., 2020).
Atlantic spotted dolphins regularly occur in the inshore waters south of Chesapeake Bay, and near the continental shelf edge and continental slope waters north of this region (Payne et al., 1984; Mullin and Fulling, 2003). Atlantic spotted dolphins north of Cape Hatteras also associate with the north wall of the Gulf Stream and warm-core rings (Waring et al., 2014). Four sightings of Atlantic spotted dolphins were recorded between 2012 and 2014 during the summer MABS surveys (Williams et al., 2015a,b).

Incidental Harassment Authorization - Site Characteriztion Suveys OCS-A 0482 32
Between 2013 and 2017, 21 Atlantic spotted dolphins were reported stranded in the U.S. Atlantic. None showed definitive signs of human interaction (Hayes et al., 2020). There have also been no recent reports of injury or mortality due to fisheries interactions; therefore, the rate of human-caused mortalities and serious injuries is considered insignificant for this population. There is no designated critical habitat for this population (Hayes et al., 2020).
Atlantic spotted dolphins are in the MF hearing group with an estimated auditory bandwidth of 150 Hz to 160 kHz (Southall et al., 2007). Vocalizations typically range from 100 Hz to 130 kHz (DoN, 2008).
4.2.8 Common Bottlenose Dolphin (Tursiops truncatus)
The common bottlenose dolphin occupies a wide variety of habitats, occurring in both peripheral seas and oceans in tropical and temperate climates (Stewart et al., 2002). They are common all along the U.S. East Coast year-round (Hayes et al., 2020; NMFS, 2020a). Within the Western North Atlantic, there are two distinct common bottlenose dolphin morphotypes: coastal and offshore. The two forms are genetically and morphologically distinct although regionally variable (Jefferson et al., 2008; Waring et al., 2015). Both inhabit waters in the Western North Atlantic Ocean (Hersh and Duffield, 1989; Mead and Potter, 1995; Curry and Smith, 1997) along the U.S. Atlantic Coast. The common bottlenose dolphin is not listed as threatened or endangered under the ESA.
The Western North Atlantic offshore stock expected to occur in the Project Area is not listed as depleted under the MMPA. The offshore stock is distributed primarily along the outer continental shelf and slope, from Georges Bank to Cape Hatteras during the spring and summer (CETAP, 1982; Kenney, 1990). Stock status within U.S. Atlantic waters is unknown and data are insufficient to determine population trends. The best available abundance estimate for the offshore morphotype of common bottlenose dolphins in the Western North Atlantic is 62,851 individuals (Hayes et al., 2020).
Spatial distribution data and genetic studies indicate the coastal morphotype comprises multiple stocks distributed throughout coastal and estuarine waters of the U.S. East Coast. One such stock, the northern migratory coastal stock, ranges from North Carolina to New York and is likely to occur in the Project Area (NMFS, 2020a). There is likely some interaction between the northern and southern migratory stocks, but the bottlenose dolphins in the Project Area are expected to be from the northern migratory stock (NMFS, 2020a). All coastal stocks are listed as depleted (Waring et al., 2010). The best abundance estimates for the northern migratory coastal stock of common bottlenose dolphin is 6,639 individuals (NMFS, 2020a).
North of Cape Hatteras, there is separation of the offshore and coastal morphotypes across bathymetric contours during summer months. Aerial surveys flown from 1979 through 1981 indicated a concentration of common bottlenose dolphins in waters <25 m deep that corresponded with the coastal morphotype, and an area of high abundance along the shelf break that corresponded with the offshore stock (Hayes et al., 2017). Torres et al. (2003) found a statistically significant break in the distribution of the morphotypes; almost all dolphins found in waters >34m depth and >34 km from shore were of the offshore morphotype. The coastal stock is best defined by its summer distribution, when it occupies coastal waters from the shoreline to the 20-m isobath between Virginia and New York (NMFS, 2020a). This stock migrates south during late summer and fall, and during colder months it occupies waters off Virginia and North Carolina (NMFS, 2020a). Therefore, during the summer, dolphins found inside the 20-m isobath in the Project Area are likely to belong to the coastal stock, while those found in deeper waters or observed during cooler months belong to the offshore stock.
Incidental Harassment Authorization - Site Characteriztion Suveys OCS-A 0482 33
Total U.S. fishery-related mortality and serious injury for coastal stocks cannot be directly estimated due to the spatial overlap of several stocks in North Carolina. Best estimates of fishery-related annual average mortality and serious injury for the northern migratory coastal stock for 2014 through 2018 range from 12.2 to 21.5 individuals per year (NMFS, 2020a). During this period, 692 common bottlenose dolphins determined to be part of the northern migratory coastal stock were reported stranded between North Carolina and New York. Evidence of human interaction was found for 80 of these cases, including 51 due to fisheries interactions and 4 due to vessel strikes (NMFS, 2020a). This stock has also been impacted by a UME from 2013 to 2015 which was attributed to a morbillivirus epidemic that caused 1,614 strandings between New York and Florida (NMFS, 2020a). Because overlap in coastal stocks makes population trends difficult, the precise impact of these strandings on this population is uncertain, but the majority of the animals found were thought to belong to the northern migratory coastal stock. PBR due to human-caused mortality and serious injury, although not the primary cause of strandings for this stock, are not considered insignificant or approaching zero (NMFS, 2020a).
For the offshore stock, annual fishery-caused mortality and serious injury for the offshore stock of common bottlenose dolphin from 2013 to 2017 was estimated to be 28 individuals due to interactions with sink gillnet and bottom trawl fisheries (Hayes et al., 2020). Total human-caused mortality and serious injury for this stock is considered insignificant, and this stock is not strategic under the MMPA. There is no designated critical habitat for this species (Hayes et al., 2020).
Coastal and offshore stocks of bottlenose dolphins are in the MF hearing group, with an estimated auditory bandwidth of 150 Hz to 160 kHz (Southall et al., 2007). Bottlenose dolphin vocalization frequencies range from 3.4 to 130 kHz (DoN, 2008).
4.2.9 Harbor Porpoise (Phocoena phocoena)
The harbor porpoise is the only porpoise species found in the Atlantic. It is a small, stocky cetacean with a blunt, short-beaked head. There are four subspecies, with P. phocoena residing in the North Atlantic (Committee on Taxonomy, 2018). The harbor porpoises that occur in the Project Area comprise the Gulf of Maine/Bay of Fundy stock. This stock is not considered strategic under the MMPA because they are not listed as threatened or endangered. In 2001, NMFS conducted a status review for the stock, mainly due to the level of bycatch in fisheries (66 FR 53195). The determination from the review was that listing the harbor porpoise under the ESA was not warranted and the species was removed from the candidate list. Population trends for this species are unknown. The best, and most recent, abundance estimate for harbor porpoise in the Gulf of Maine/Bay of Fundy stock is 95,543 individuals (NMFS, 2020a).
Harbor porpoises commonly occur throughout Massachusetts Bay from September through April. During the fall and spring, harbor porpoises are widely distributed along the U.S. East Coast from New Jersey to Maine. During the summer, the porpoises are concentrated in the Northern Gulf of Maine and Southern Bay of Fundy in water depths <150 m. In winter, densities increase in the waters off New Jersey to North Carolina and decrease in the waters from New York to New Brunswick; however, specific migratory timing or routes are not apparent. Although still considered uncommon, harbor porpoises were regularly detected offshore of Maryland during winter and spring surveys (Wingfield et al., 2017). They were the second most frequently sighted cetacean during the NJDEP EBS, with 90% of the sightings during the winter, three during the spring, and one during the summer (Whitt et al., 2015). The lack of sightings during the fall was attributed to low visibility conditions during those months, but available data indicate this species is likely present offshore New Jersey during fall and winter (Whitt et al., 2015).
Harbor porpoises feed on small schooling fish such as mackerel, herring, and cod, as well as worms, cephalopods (i.e., squid), and sand eels (Hyperoplus spp.). Their foraging habits and habitats make this species particularly susceptible to mortality in bottom-set gill nets (Waring et al., 2015). The average
Incidental Harassment Authorization - Site Characteriztion Suveys OCS-A 0482 34
estimated human-caused mortality or serious injury for this stock is 217 harbor porpoises per year, derived from U.S. fisheries observer data (NMFS, 2020a). In 2010, a final rule was published for the existing Harbor Porpoise Take Reduction Plan in the Federal Register (75 FR 7383) to address closure areas and timing based on bycatch rates. A total of 315 harbor porpoises were stranded in the U.S. between 2014 and 2018, 16 of which showed evidence for human interaction such as entanglement or fishery interaction. The total annual human-related mortality rates do not exceed the PBR but cannot be considered insignificant or approaching zero. There is no designated critical habitat for this species (NMFS, 2020a).
The harbor porpoise is the only potentially affected species in the Project Area within the HF hearing group that uses ultrasonic echolocation clicks to navigate and hunt prey. The click frequency is between 110 and 150 kHz, which is consistent with harbor porpoise hearing sensitivity centered between 100 and 120 kHz (Thompson et al., 2013). Click trains can have very short inter-click intervals when close to a prey item, which results in a “feeding buzz” due to the rapid succession of individual clicks, making them highly identifiable in acoustic surveys.
4.3 PHOCIDS
4.3.1 Harbor Seal (Phoca vitulina)
The harbor seal is found in all nearshore waters of the Atlantic Ocean and adjoining seas north of 30° N (Hayes et al., 2019). In the Western North Atlantic, they are distributed from Eastern Canada to southern New England and New York, and occasionally to the Carolinas (Payne and Selzer, 1989). Harbor seals are the most abundant seals in the Eastern U.S.; they are not listed as threatened or endangered. The harbor seals within the Project Area are part of the single Western North Atlantic stock, which is not considered strategic under the MMPA. The best population estimate of harbor seals for this stock is 75,834 (NMFS, 2020a).
Harbor seals exploit a variety of available food sources and feed both in shallow coastal habitats and offshore (Waring, 2015). Typical prey items include cephalopods (i.e., squid) and small schooling fish (i.e., herring, alewife [Alosa pseudoharengus], flounder [Paralichthys spp. and Pseudopleuronectes spp.], redfish [Sciaenops ocellatus], cod, yellowtail flounder [Pleuronectes ferruginea], sand eel, hake) and spend up to 85% of the day diving, presumably foraging.
Harbor seals can be found year-round in the coastal waters of Eastern Canada and Maine. Between September and May they undergo seasonal migrations into Southern New England and the Mid-Atlantic (Hayes et al., 2020). The NJDEP EBS reported one harbor seal offshore New Jersey in June 2008 in approximately 18 m of water (Whitt et al., 2015). Three other pinnipeds were observed during this study, however, they could not be identified to species level.
Fisheries interactions are common, and harbor seals are legally killed in Canada, Norway, and the United Kingdom to protect fish farms or local fisheries (Reeves et al., 2013). Harbor seals are also susceptible to bycatch in gillnets, trawls, and purse seines. For the period from 2014 to 2018, the average human-caused mortality and serious injury to harbor seals was 365.2 individuals per year, of which 351 occurred in fisheries interactions. Other causes of mortality for this population include human interactions such as vessel strikes, pollution, and harassment; storms; abandonment by the mother; disease; and predation (NMFS, 2020a). Since July 2018, a UME has been declared for both the harbor seal and gray seal due to mortalities throughout the Northeast U.S. Based on results of preliminary examinations, the 3,152 strandings (which include both species) are likely the result of phocine distemper virus (NMFS, 2020b). The total human-caused mortality and serious injury does not exceed the PBR but cannot be considered insignificant for this population (NMFS, 2020a).
Incidental Harassment Authorization - Site Characteriztion Suveys OCS-A 0482 35
Harbor seals are part of the PW hearing group. Male harbor seals produce underwater vocalizations during mating season to attract females and defend territories (Sabinsky et al., 2012). These calls are comprised of “growls” or “roars” with a peak energy at 1.2 kHz (Sabinsky et al., 2012). Captive studies have shown that harbor seals have good (>50%) sound detection thresholds between 0.1 and 80 kHz, with primary sound detection between 0.5 and 40 kHz (Kastelein et al., 2009).
4.3.2 Gray Seal (Halichoerus grypus)
Gray seals within the Project Area are part of the Western North Atlantic stock. They are not listed as threatened or endangered and the stock is not considered strategic under the MMPA. The best population estimate of gray seals for this stock is 27,131 individuals (NMFS, 2020a). A U.S. population estimate for this species is not available; however, the Canadian gray seal population was estimated to be 424,300 individuals in 2016 (NMFS, 2020a). Gray seals will aggregate in large numbers to breed, molt, and rest. Gray seals will exploit a variety of available food sources and will feed both in shallow coastal habitats and offshore (Waring, 2015). Typical prey items include cephalopods, sessile organisms, small schooling fish (i.e., herring, alewife, flounder, redfish, cod, yellowtail flounder, sand eel, hake), and crustaceans. Gray seals will go on extensive dives to depths of up to 475 m to capture food (Waring, 2015).
The gray seal has a year-round range from Canada to Massachusetts and may seasonally migrate further south to northern parts of New Jersey between September and May (NMFS, 2020a). Stranding records extend as far south as Cape Hatteras, North Carolina (Gilbert et al., 2005).
Gray seals are susceptible to bycatch and fisheries interactions and, like the harbor seal, are legally killed in some countries to protect fisheries resources. The gray seal is also taken commercially outside the U.S. The average estimated human-caused mortality and serious injury of gray seals between 2014 and 2018 was 4,729 seals per year for both the U.S. and Canada (NMFS, 2020a). As discussed in Section 4.3.1, there is currently a UME declared for this population likely due to viral infection (NMFS, 2020b). As with the harbor seal, the total annual human-caused mortality and serious injury does not exceed the PBR, but it cannot be considered insignificant (NMFS, 2020a).
Gray seals, like harbor seals, belong to the PW hearing group. As with all pinnipeds, they are assigned to hearing groups based on the medium (air or water) through which they are detecting the sounds, for an estimated underwater auditory bandwidth of 75 Hz to 75 kHz (Southall et al., 2007). Vocalizations range from 100 Hz to 3 kHz (DoN, 2008).

Incidental Harassment Authorization - Site Characteriztion Suveys OCS-A 0482 36
5.0 Type of Incidental Take Requested
The Applicant requests an IHA pursuant to Section 101 (a)(5)(D) of the MMPA for incidental take of small numbers of marine mammals by Level B harassment during geophysical surveys conducted as part of site characterization activities within the Project Area. Proposed activities, as outlined in Section 1.0, have the potential to impact marine mammals within the Project Area from sounds generated by survey equipment.
For impulsive and non-impulsive intermittent sources, the maximum range to a Level A threshold is <40 m and Level A take is not anticipated during HRG surveys. The calculations for Level A (and Level B) assumed that all 350 survey days will be conducted will use the source producing the largest Level B acoustic isopleths of 141 m (i.e., the Dura-sparks and GeoMarine sparkers). This assumption provides a cautious approach to predicting active survey operations and their potential impact on marine mammal species while also providing a more realistic representation of anticipated equipment-specific survey effort.
The most likely Level B take is expected to result from minor behavioral reactions such as avoidance and temporary displacement for some individuals or groups of marine mammals near the proposed activities. It is expected that the severity of behavioral effects will vary with the duration of operations, the behavior of the animal at the time of reception of the sound, and the distance and received SPL of the sound. The Level B take is unlikely to manifest as TTS (Southall et al., 2007) but has the potential in the immediate vicinity (several meters) of the sound source where the received SPL might be high enough to cause a temporary loss of hearing sensitivity (Holt, 2008). No PTS, physiological damage, or injury is expected to occur to marine mammals from the noise generated by the survey equipment or vessels during proposed surveys.
Potential impacts will be mitigated through a visual monitoring program and associated vessel activity management program, both of which are described in Section 11.0.
Incidental Harassment Authorization - Site Characteriztion Suveys OCS-A 0482 37
6.0 Take Estimates for Marine Mammals
The Applicant is seeking authorization for potential “taking” of small numbers of marine mammals under the jurisdiction of NMFS in the proposed region of activity, as described in Section 2.0. The 16 species listed below are described further in Section 4.0. Each species has a geographic distribution that encompasses the Project Area and has at least a minimal potential to be “taken” during the proposed surveys.
Authorization for Level B harassment is sought for the following 16 species:
• North Atlantic right whale; • Humpback whale; • Fin whale; • Sei whale; • Minke whale; • Sperm whale; • Risso’s dolphin; • Long-finned pilot whale; • Short-finned pilot whale; • Atlantic white-sided dolphin; • Common dolphin; • Atlantic spotted dolphin; • Common bottlenose dolphin; • Harbor porpoise; • Harbor seal; and • Gray seal.
The only anticipated impacts to marine mammals are associated with noise and are limited to the use of HRG survey equipment operating sources less than 200 kHz. The potential activities are not expected to take more than a small number of marine mammals or have more than a negligible effect on their populations based on their seasonal density and distribution and known reactions to underwater sound exposure. The source activity is described in Section 1.2, survey equipment is listed in Section 1.3, and species status and distributions in Section 4.
6.1 BASIS FOR ESTIMATING NUMBERS OF MARINE MAMMALS THAT MIGHT BE TAKEN BY HARASSMENT
Estimating exposures of marine mammal species assumes that exposure of an animal to a specified noise level within a region of ensonification will result in a take of that animal. The ensonified area is calculated based on the SL and operational mode of the equipment (Table 3). Potential Level B take exposures are estimated within the ensonified area as an SPL exceeding 160 dB re 1 µPa for non-impulsive intermittent sources (e.g., sonar, CHIRPs) and impulsive sources (e.g., sparkers, boomers) within an average day of activity. The potential number of exposed animals is estimated from the mean monthly densities (animals km-2) of a given species expected within the Project Area. These densities are then multiplied by the maximum number of survey days. These calculations result in unmitigated take estimates for each affected species over the entire survey period.

Incidental Harassment Authorization - Site Characteriztion Suveys OCS-A 0482 38
6.1.1 Zone of Influence Calculations
The ZOI is a representation of the maximum extent of the ensonified area around a sound source over a 24-hour period. The ZOI for each piece of equipment operating below 200 kHz was calculated per the following formulae:
Stationary Source: ZOI = πr2
Mobile Source: ZOI = (Distance/day × 2r) + πr2
Where r is the linear distance from the source to the isopleth for Level A or Level B thresholds and day = 1 (i.e., 24 hours).
The estimated potential daily active survey distance of 70 km was used as the estimated areal coverage over a 24-hour period. This distance accounts for the vessel traveling at roughly 4 knots and only for periods during which equipment <200 kHz is in operation. A vessel traveling 4 knots can cover approximately 110 km per day; however, based on data from 2017, 2018, and 2019 surveys, survey coverage over a 24-hour period is closer to 70 km per day. For daylight only vessels, the distance is reduced to 35 km per day; however, to maintain the potential for 24-hour surveys, the corresponding Level A and Level B ZOIs provided in Table 6 were calculated for each source based on the Level A and Level B threshold distances in Table 4 with a 24-hour (70 km) operational period.
Table 6. Calculated Zone of Influence (ZOI) encompassing Level A and Level B thresholds1 for each sound source or comparable sound source category.
Source Level A ZOI (km2)2 Level B ZOI (km2)3
Hearing Group4 LF MF HF PW All Shallow SBP (CHIRP sonars) ET 216 CHIRP 0 0 0.4 0 0.8 ET 424 CHIRP 0 0 0 0 0.6 ET 512i CHIRP 0 0 0 0 0.8 GeoPulse 5430 0 0.1 5.1 0 2.2 TB CHIRP III 0.2 0 2.4 0.1 5.0 Medium SBP (Boomers and Sparkers) AA Triple plate S-Boom (700-1,000 J) 0.1 0 0.7 0 3.5 AA, Dura-spark UHD 0.1 0 0.4 0 19.8 AA, Dura-spark UHD 400+400 0.1 0 0.4 0 19.8 GeoMarine, Geo-Source dual 400 tip Sparker 0.1 0 0.4 0 19.8
AA = Applied Acoustics; CHIRP = Compressed High-Intensity Radiated Pulse; ET = EdgeTech; HF = high-frequency; J = joules; LF = low-frequency; MF = mid-frequency; PW = phocid pinnipeds in water; SBP = sub-bottom profiler; TB = Teledyne Benthos; UHD = ultra-high definition. 1The Level A and B isopleths were calculated to comprehensively assess the potential impacts of the predicted source operations as required for this Application. However, as described in Section 5.0, Level A takes are not expected. 2Based on maximum distances in Table 4. For consistency, the metric producing the largest distance to the Level A thresholds (either cumulative sound exposure level or zero to peak sound pressure level) was used to calculate the ZOIs for each hearing group. 3Based on maximum distances in Table 4 calculated for Level B root-mean-square sound pressure level thresholds. 4As defined by the National Marine Fisheries Service.
For sources that have operating beamwidths that are less than 180°, the ZOI will be conical below the source with maximum radial propagation widths dependent upon the water depth and absorption. For these equipment cases (CHIRPs, boomers), the radial distance was calculated using interim recommendations provided from NMFS (2019b) and provided as part of the User Spreadsheet submitted with this application.

Incidental Harassment Authorization - Site Characteriztion Suveys OCS-A 0482 39
The Level A and Level B threshold isopleths were calculated to comprehensively assess the potential impacts of the predicted maximum practicable source operations as required for this Application. However, as described in Section 5.0, Level A takes are not expected. A conservative approach to estimate the Level B take distances for the survey was implemented by using the equipment that produced the greatest Level B isopleth distance from apparent or measured SL to define the impact radii of all proposed equipment within that group. The maximum estimated distance from a geophysical source to the Level B threshold (SPL of 160 dB re 1 µPa) were for the sparkers (the Dura-sparks and GeoMarine sparkers), all of which produced a 141 m threshold range (Table 4).
6.1.2 Marine Mammal Density Calculation
The density calculation methodology applied to take estimates for this application is derived from the model results produced by Roberts et al. (2016) and unpublished model results produced by Roberts (2018, 2020) for the U.S. East Coast region. To determine cetacean densities for take estimates, only those density blocks which overlapped with any portion of the Project Area were selected for this assessment (Figure 3). These files were retrieved as raster files from the website http://cetsound.noaa.gov/cda or directly from Roberts (2018) with permission for use. These estimates are considered the best information currently available for calculating marine mammal densities in the U.S. Atlantic by NMFS. Currently, no density estimates are available for the portion of the ECR area in Delaware Bay, so the marine mammal densities from Roberts et al. (2016) and Roberts (2018, 2020) were assumed to apply to this area, and the level of effort needed for site investigation surveys in this region was included in overall number of surveys days used in the take assessment (Section 6.1.3).
Due to limited data availability and difficulties identifying individuals to species level during visual surveys, individual densities are not able to be provided for all species and they are instead grouped into “guilds” (Roberts et al., 2016; Roberts, 2018). These guilds include pilot whales, common bottlenose dolphins, and seals. Long- and short-finned pilot whales are difficult to distinguish during shipboard surveys so individual habitat models were not able to be developed. Because both species have the same potential to occur in this region, densities are assumed to apply to both species.
Similarly, these models do not distinguish between common bottlenose dolphin stocks due to limited data regarding distributions of these stocks. As discussed in Section 4.2.9, both the northern migratory coastal stock and the Western North Atlantic offshore stock are expected to occur in the Project Area. To try and estimate densities for both stocks using these models, the density blocks within the Project Area were divided using the 20-m isobath (red line in Figure 3) following guidance from the NMFS draft 2020 SAR (NMFS, 2020a). Therefore, any density blocks located between the coastline and the 20-m isobath were assumed to comprise the migratory coastal stock, and density blocks beyond this isobath comprise the offshore stock.
Given their size and behavior when in the water, seals are difficult to identify during shipboard visual surveys and limited information is currently available on their distribution. Therefore, density estimates are provided for all seal species that may occur in the Western North Atlantic (i.e., harbor, gray, hooded, harp). Only the harbor seal and gray seal are reasonably expected to occur in the Project Area; therefore densities were split evenly between both species.

Incidental Harassment Authorization - Site Characteriztion Suveys OCS-A 0482 40
Figure 3. Sample density blocks (Roberts et al., 2016; Roberts, 2018, 2020) used to determine monthly
marine mammal densities within the Project Area. Depth contour used to differentiate common bottlenose dolphin stocks has been highlighted red for reference.

Incidental Harassment Authorization - Site Characteriztion Suveys OCS-A 0482 41
Given the variability in level of effort between the Lease Area and the ECR area, densities were further divided for the Lease Area (OCS-A 0482) and the ECR area. Density blocks which overlapped with both of these areas were selected for this analysis. Densities from each of the selected density blocks were averaged for each month available to provide monthly densities estimates for each species, along with the average annual density derived from the monthly densities (Tables 7 and 8).
Table 7. Estimated monthly and average annual density (animals per km2) of potentially affected marine mammals within the Lease Area OCS-A-0482 based on monthly habitat density models (Roberts et al., 2016; Roberts, 2018, 2020).
Species Jan Feb Mar Apr May Jun Jul Aug Sep Oct Nov Dec
Average Annual Density (km-2)
Low-frequency Cetaceans Fin whale 0.0011 0.0010 0.0018 0.0024 0.0022 0.0018 0.0008 0.0006 0.0015 0.0017 0.0012 0.0010 0.0014 Sei whale 0.0000 0.0000 0.0000 0.0001 0.0000 0.0000 0.0000 0.0000 0.0000 0.0000 0.0000 0.0000 0.0000 Minke whale 0.0003 0.0003 0.0003 0.0012 0.0014 0.0007 0.0001 0.0001 0.0001 0.0004 0.0001 0.0002 0.0004 Humpback whale 0.0011 0.0007 0.0005 0.0007 0.0006 0.0006 0.0002 0.0002 0.0003 0.0006 0.0005 0.0011 0.0006 North Atlantic right whale 0.0059 0.0070 0.0076 0.0051 0.0004 0.0000 0.0000 0.0000 0.0000 0.0000 0.0003 0.0030 0.0025
Mid-frequency Cetaceans Sperm whale 0.0000 0.0000 0.0000 0.0000 0.0000 0.0001 0.0002 0.0001 0.0001 0.0001 0.0001 0.0000 0.0001 Atlantic white-sided dolphin 0.0020 0.0010 0.0015 0.0036 0.0044 0.0029 0.0008 0.0004 0.0011 0.0035 0.0052 0.0044 0.0026
Atlantic spotted dolphin 0.0013 0.0013 0.0013 0.0013 0.0013 0.0013 0.0013 0.0013 0.0013 0.0013 0.0013 0.0013 0.0013
Common bottlenose dolphin (Offshore)1
0.0112 0.0068 0.0102 0.0154 0.1060 0.1003 0.1103 0.1435 0.0675 0.0635 0.0463 0.0167 0.0581
Common bottlenose dolphin (Migratory)1
0.0105 0.0075 0.0127 0.0233 0.1672 0.1437 0.1740 0.2032 0.0716 0.0695 0.0468 0.0157 0.0788
Short-finned pilot whale2 0.0004 0.0004 0.0004 0.0004 0.0004 0.0004 0.0004 0.0004 0.0004 0.0004 0.0004 0.0004 0.0004
Long-finned pilot whale2 0.0004 0.0004 0.0004 0.0004 0.0004 0.0004 0.0004 0.0004 0.0004 0.0004 0.0004 0.0004 0.0004
Risso’s dolphin 0.0000 0.0000 0.0000 0.0000 0.0000 0.0000 0.0000 0.0000 0.0000 0.0000 0.0000 0.0000 0.0000 Common dolphin 0.0127 0.0062 0.0071 0.0162 0.0302 0.0208 0.0230 0.0265 0.0202 0.0200 0.0382 0.0286 0.0208 High-frequency Cetaceans Harbor porpoise 0.0328 0.0384 0.0379 0.0145 0.0038 0.0000 0.0000 0.0001 0.0000 0.0010 0.0221 0.0392 0.0158 Pinnipeds3 Gray seal 0.0002 0.0002 0.0002 0.0002 0.0002 0.0006 0.0006 0.0006 0.0002 0.0002 0.0002 0.0002 0.0003 Harbor seal 0.0002 0.0002 0.0002 0.0002 0.0002 0.0006 0.0006 0.0006 0.0002 0.0002 0.0002 0.0002 0.0003
1Bottlenose dolphin stocks were delineated based on the 20-m isobath as identified in NMFS 2017 Stock Assessment Report; all density blocks falling inland of the 20-m depth contour were assumed to belong to the migratory coastal stock, and those beyond this depth were assumed to belong to the offshore stock. 2Roberts (2018) only provides density estimates for “generic” pilot whales, so individual densities for each species are unavailable. 3Seal densities are not given by individual months or species, instead, seasons are divided as summer (June, July, August) and Winter (September – May) and applied to “generic” seals; as a result, reported seasonal densities for spring and fall are the same and are not provided for each species (Roberts 2018).
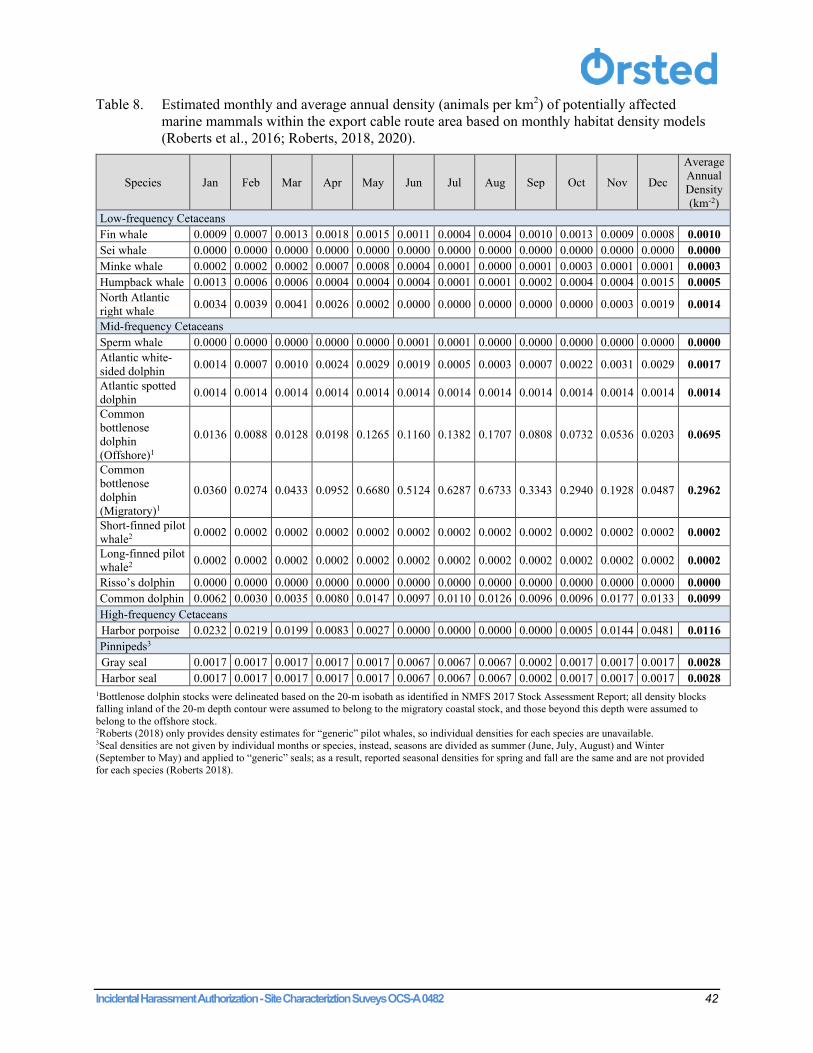
Incidental Harassment Authorization - Site Characteriztion Suveys OCS-A 0482 42
Table 8. Estimated monthly and average annual density (animals per km2) of potentially affected marine mammals within the export cable route area based on monthly habitat density models (Roberts et al., 2016; Roberts, 2018, 2020).
Species Jan Feb Mar Apr May Jun Jul Aug Sep Oct Nov Dec
Average Annual Density (km-2)
Low-frequency Cetaceans Fin whale 0.0009 0.0007 0.0013 0.0018 0.0015 0.0011 0.0004 0.0004 0.0010 0.0013 0.0009 0.0008 0.0010 Sei whale 0.0000 0.0000 0.0000 0.0000 0.0000 0.0000 0.0000 0.0000 0.0000 0.0000 0.0000 0.0000 0.0000 Minke whale 0.0002 0.0002 0.0002 0.0007 0.0008 0.0004 0.0001 0.0000 0.0001 0.0003 0.0001 0.0001 0.0003 Humpback whale 0.0013 0.0006 0.0006 0.0004 0.0004 0.0004 0.0001 0.0001 0.0002 0.0004 0.0004 0.0015 0.0005 North Atlantic right whale 0.0034 0.0039 0.0041 0.0026 0.0002 0.0000 0.0000 0.0000 0.0000 0.0000 0.0003 0.0019 0.0014
Mid-frequency Cetaceans Sperm whale 0.0000 0.0000 0.0000 0.0000 0.0000 0.0001 0.0001 0.0000 0.0000 0.0000 0.0000 0.0000 0.0000 Atlantic white-sided dolphin 0.0014 0.0007 0.0010 0.0024 0.0029 0.0019 0.0005 0.0003 0.0007 0.0022 0.0031 0.0029 0.0017
Atlantic spotted dolphin 0.0014 0.0014 0.0014 0.0014 0.0014 0.0014 0.0014 0.0014 0.0014 0.0014 0.0014 0.0014 0.0014
Common bottlenose dolphin (Offshore)1
0.0136 0.0088 0.0128 0.0198 0.1265 0.1160 0.1382 0.1707 0.0808 0.0732 0.0536 0.0203 0.0695
Common bottlenose dolphin (Migratory)1
0.0360 0.0274 0.0433 0.0952 0.6680 0.5124 0.6287 0.6733 0.3343 0.2940 0.1928 0.0487 0.2962
Short-finned pilot whale2 0.0002 0.0002 0.0002 0.0002 0.0002 0.0002 0.0002 0.0002 0.0002 0.0002 0.0002 0.0002 0.0002
Long-finned pilot whale2 0.0002 0.0002 0.0002 0.0002 0.0002 0.0002 0.0002 0.0002 0.0002 0.0002 0.0002 0.0002 0.0002
Risso’s dolphin 0.0000 0.0000 0.0000 0.0000 0.0000 0.0000 0.0000 0.0000 0.0000 0.0000 0.0000 0.0000 0.0000 Common dolphin 0.0062 0.0030 0.0035 0.0080 0.0147 0.0097 0.0110 0.0126 0.0096 0.0096 0.0177 0.0133 0.0099 High-frequency Cetaceans Harbor porpoise 0.0232 0.0219 0.0199 0.0083 0.0027 0.0000 0.0000 0.0000 0.0000 0.0005 0.0144 0.0481 0.0116 Pinnipeds3 Gray seal 0.0017 0.0017 0.0017 0.0017 0.0017 0.0067 0.0067 0.0067 0.0002 0.0017 0.0017 0.0017 0.0028 Harbor seal 0.0017 0.0017 0.0017 0.0017 0.0017 0.0067 0.0067 0.0067 0.0002 0.0017 0.0017 0.0017 0.0028
1Bottlenose dolphin stocks were delineated based on the 20-m isobath as identified in NMFS 2017 Stock Assessment Report; all density blocks falling inland of the 20-m depth contour were assumed to belong to the migratory coastal stock, and those beyond this depth were assumed to belong to the offshore stock. 2Roberts (2018) only provides density estimates for “generic” pilot whales, so individual densities for each species are unavailable. 3Seal densities are not given by individual months or species, instead, seasons are divided as summer (June, July, August) and Winter (September to May) and applied to “generic” seals; as a result, reported seasonal densities for spring and fall are the same and are not provided for each species (Roberts 2018).
Incidental Harassment Authorization - Site Characteriztion Suveys OCS-A 0482 43
6.1.3 Take Calculation
Based on the average annual densities for each species for the Lease Area and ECR area (bolded numbers in Tables 7 and 8), and the ZOIs (Table 6), the estimated number of marine mammal takes per equipment type was determined. Calculations were based on vessel-towed or mounted geophysical survey equipment operating 200 vessel days in the Lease Area and 150 days in the ECR area, with the sources producing the largest threshold distances (i.e., sparkers) operating during 100% of vessel days.
Estimates of take are calculated according to the following formula:
Estimated Take = D × ZOI × # of Survey Days
Where: D = average species density (km-2); and ZOI = maximum ensonified area that equates to NMFS thresholds for noise impact criteria. To estimate take, the density of marine mammals within the Project Area (animals km-2) was multiplied by the daily ensonified ZOI (km2). That result is then multiplied by the number of survey days (rounded to the nearest whole number) to arrive at the estimated take. This final number equals the instances of take for the entire operational period. The result is an estimate of the maximum potential number of instances that marine mammals could be exposed to sounds above the Level A or Level B harassment thresholds over the duration of survey activities. The Applicant has agreed to mitigation measures to reduce potential Level B harassment and eliminate the possibility of any Level A harassment.
6.2 ESTIMATED NUMBERS OF MARINE MAMMALS THAT MIGHT BE TAKEN BY HARASSMENT
The Applicant is requesting approval for the incidental harassment takes of marine mammals associated with geophysical surveys. Take estimates were projected based on marine mammal presence, calculated density estimates, and activity-specific noise source propagation characteristics.
6.2.1 Estimated Level A Harassment of Marine Mammals
Level A exposures are not expected to occur for any of the hearing groups during operation of geophysical impulsive sources. Estimated PK threshold distances extend to a maximum of 4.7 m from the medium SBP equipment only for HF cetaceans (i.e., harbor porpoise); the linear threshold distances (i.e., acoustic ranges) for the SEL24h metric extend to a maximum of 36.5 m, an isopleth produced by a single source, the GeoPulse 5430. All other sources produced SEL24h isopleths of less than 17 m. Also, the acoustic ranges alone do not adequately represent the actual exposure ranges for species because animal movement in and out of the sound field does not allow the accumulation of sound energy over 24 hours that is required for an animal to reach those thresholds. Although takes were calculated for some species, the Level A SEL24h threshold is not expected to be realized for any species. The PK metric is measured based on a single impulse from the impulsive medium SBP equipment, and given the short duration of this impulse and the proposed mitigation measures (Section 11.0), it is unlikely an animal will be close enough to the source during an impulse to receive Level A harassment. Therefore, Level A takes are not being requested by the Applicant and will not be discussed further. Maximum potential Level A take calculations, without mitigation applied, are provided in Table 9.
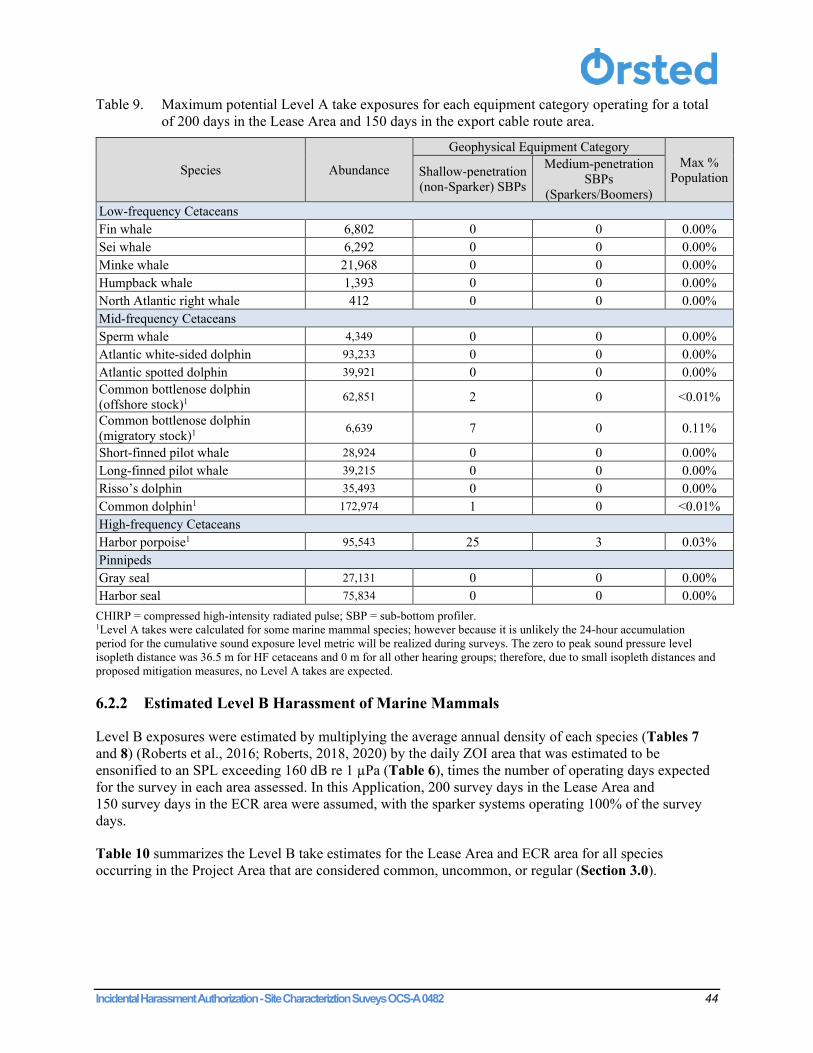
Incidental Harassment Authorization - Site Characteriztion Suveys OCS-A 0482 44
Table 9. Maximum potential Level A take exposures for each equipment category operating for a total of 200 days in the Lease Area and 150 days in the export cable route area.
Species Abundance
Geophysical Equipment Category Max %
Population Shallow-penetration (non-Sparker) SBPs
Medium-penetration SBPs
(Sparkers/Boomers) Low-frequency Cetaceans Fin whale 6,802 0 0 0.00% Sei whale 6,292 0 0 0.00% Minke whale 21,968 0 0 0.00% Humpback whale 1,393 0 0 0.00% North Atlantic right whale 412 0 0 0.00% Mid-frequency Cetaceans Sperm whale 4,349 0 0 0.00% Atlantic white-sided dolphin 93,233 0 0 0.00% Atlantic spotted dolphin 39,921 0 0 0.00% Common bottlenose dolphin (offshore stock)1 62,851 2 0 <0.01%
Common bottlenose dolphin (migratory stock)1 6,639 7 0 0.11%
Short-finned pilot whale 28,924 0 0 0.00% Long-finned pilot whale 39,215 0 0 0.00% Risso’s dolphin 35,493 0 0 0.00% Common dolphin1 172,974 1 0 <0.01% High-frequency Cetaceans Harbor porpoise1 95,543 25 3 0.03% Pinnipeds Gray seal 27,131 0 0 0.00% Harbor seal 75,834 0 0 0.00%
CHIRP = compressed high-intensity radiated pulse; SBP = sub-bottom profiler. 1Level A takes were calculated for some marine mammal species; however because it is unlikely the 24-hour accumulation period for the cumulative sound exposure level metric will be realized during surveys. The zero to peak sound pressure level isopleth distance was 36.5 m for HF cetaceans and 0 m for all other hearing groups; therefore, due to small isopleth distances and proposed mitigation measures, no Level A takes are expected.
6.2.2 Estimated Level B Harassment of Marine Mammals
Level B exposures were estimated by multiplying the average annual density of each species (Tables 7 and 8) (Roberts et al., 2016; Roberts, 2018, 2020) by the daily ZOI area that was estimated to be ensonified to an SPL exceeding 160 dB re 1 µPa (Table 6), times the number of operating days expected for the survey in each area assessed. In this Application, 200 survey days in the Lease Area and 150 survey days in the ECR area were assumed, with the sparker systems operating 100% of the survey days.
Table 10 summarizes the Level B take estimates for the Lease Area and ECR area for all species occurring in the Project Area that are considered common, uncommon, or regular (Section 3.0).

Incidental Harassment Authorization - Site Characteriztion Suveys OCS-A 0482 45
Table 10. Summary of maximum potential Level B take exposures resulting from 100% usage of the sparker systems during all 200 days of surveys in the Lease Area and 150 days of surveys in the export cable route (ECR) area.
Species Abundance
Estimated Level B
Exposures for the Lease Area
Estimated Level B
Exposures for the ECR Area
Max % Population
Low-frequency Cetaceans Fin whale 6,802 6 3 0.13% Sei whale 6,292 0 0 0.00% Minke whale 21,968 2 1 0.01% Humpback whale 1,393 2 2 0.29% North Atlantic right whale 412 10 4 3.40% Mid-frequency Cetaceans Sperm whale 4,349 0 0 0.00% Atlantic white-sided dolphin 93,233 10 5 0.02% Atlantic spotted dolphin 39,921 5 4 0.02% Common bottlenose dolphin1
Offshore Stock 62,851 230 207 0.70% Migratory Stock 6,639 312 880 17.95%
Pilot Whales2 Short-finned pilot whale 28,924 2 1 0.01% Long-finned pilot whale 39,215 2 1 0.01%
Risso’s dolphin 35,493 0 0 0.00% Common dolphin 172,974 83 29 0.06% High-frequency Cetaceans Harbor porpoise 95,543 63 35 0.10% Pinnipeds
Seals2 Gray seal 27,131 1 8 0.03% Harbor seal 75,834 1 8 0.01%
1Roberts et al. (2016) does not provide density estimates for individual stocks of common bottlenose dolphins; therefore stock densities used to calculate take were delineated using the 20-m isobath. 2Roberts (2018) only provides density estimates for “generic” pilot whales and seals; therefore, it is assumed an equal potential for takes of either species within each of those groups.
6.2.3 Requested Level B Takes
The estimated Level B exposures in Table 10 are based on the operation of the sparker sources that produced the largest threshold isopleth (141 m) during 100% of the proposed vessel days. All non-sparker sources were estimated to produce Level B isopleths less than 40 m. This method provides conservative estimates of the potential Level B exposures to any of the species stocks expected to occur within the Project Area because maximum isopleths for each of the equipment groups were used.
There are a number of other factors that reduce the overall number of takes expected to occur during this Project.
1. It is assumed that an animal will only be taken once over a 24-hour period and that the maximum number of calculated takes represents different individuals from a population. In actuality, an activity may result in multiple exposures of the same animal over a period of time and only a limited number of individuals within a single population may experience behavioral modification. Both the estimated number of takes and the percentage of the population potentially affected represent the maximum potential take numbers that do not account for species behavior or the context within which a behavioral disturbance may occur.

Incidental Harassment Authorization - Site Characteriztion Suveys OCS-A 0482 46
2. Mitigation will be effective to eliminate Level A takes and will significantly minimize the potential for Level B takes. Maximum linear distance for Level B threshold levels is 141 m, allowing for effective mitigation.
The requested number of Level B takes provided in Table 11 are based on the exposures calculated in Section 6.2.2. No takes were calculated for the sei whale, sperm whale, or Risso’s dolphin; however, based on anticipated species distributions and data from previous surveys conducted in the DE WEA, it is possible that these species could be encountered. Therefore, requested takes are based on estimated group sizes for these species (1 for sei whales, 3 for sperm whales, and 30 for Risso’s dolphins) (Kenney and Vigness-Raposa, 2010; Barkaszi and Kelly, 2019).
Table 11. Summary of requested Level B takes for this Project.
Species Abundance Requested Level B Takes1 Max % Population
Low-frequency Cetaceans Fin whale 6,802 9 0.13% Sei whale 6,292 0 (1) 0.02% Minke whale 21,968 3 0.01% Humpback whale 1,393 4 0.29% North Atlantic right whale 412 14 3.40% Mid-frequency Cetaceans Sperm whale 4,349 0 (3) 0.07% Atlantic white-sided dolphin 93,233 15 0.02% Atlantic spotted dolphin 39,921 9 0.02% Common bottlenose dolphin2
Offshore Stock 62,851 437 0.70% Migratory Stock 6,639 1,192 17.95%
Pilot Whales3 Short-finned pilot whale 28,924 3 0.01% Long-finned pilot whale 39,215 3 0.01%
Risso’s dolphin 35,493 0 (30) 0.08% Common dolphin 172,974 112 0.06% High-frequency Cetaceans Harbor porpoise 95,543 98 0.10% Pinnipeds
Seals4 Gray seal 27,131 9 0.03% Harbor seal 75,834 9 0.01%
1Parenthesis denote changes from calculated take estimates. • For species with no modeled exposures, requested takes for HRG surveys are based on mean group sizes derived from the
following references: o Sei whale: Kenney and Vigness-Raposa, 2010; o Sperm whale: Barkaszi and Kelly, 2018; and o Risso’s dolphin: Barkaszi and Kelly, 2018.
2Roberts et al. (2016) does not provide density estimates for individual stocks of common bottlenose dolphins; therefore, stock densities were delineated using the 20-m isobath. 5Roberts (2018) only provides density estimates for “generic” pilot whales; therefore, an equal potential for takes has been assumed either for species or stocks within the larger group. 4Roberts (2018) only provides density estimates for “generic” seals; therefore, densities were split evenly between the two species.

Incidental Harassment Authorization - Site Characteriztion Suveys OCS-A 0482 47
7.0 Effects on Marine Mammal Species or Stocks
Marine mammals exposed to natural or man-made sound may experience non-auditory and auditory impacts which range in severity (Southall et al., 2007; Southall et al., 2019; NMFS, 2018a; Wood et al., 2012). The potential exists for small numbers of marine mammals to be exposed to underwater sound associated with survey activities. These impacts are likely to affect individual species but have only negligible effects on the marine mammal stocks and, therefore, will not adversely affect the population of any species.
7.1 MITIGATION
Mitigation and aversion are not considered in the take estimates. The inclusion of mitigation and aversion would reduce the take estimates. Although the proposed mitigation (Section 11.0) is implemented to eliminate the potential for Level A takes, it will also serve to reduce the exposure of animals to SLs that could constitute Level B takes. NMFS determined that with the RPMs, (e.g., mitigation measures such as clearance periods, ramp ups, and shutdowns when an animal is detected within an exclusion zone [EZ]) the proposed geophysical surveys may adversely affect, but are not likely to jeopardize, the continued existence of NARW, humpback, fin, sei, or sperm whales. This suggests that geophysical survey operations would not jeopardize the sustainability of other cetaceans, particularly other LF and MF species that occupy the same acoustic habitat.
7.2 MULTIPLE EXPOSURES AND SEASONALITY
Level B exposures likely include the same individuals across multiple days and not exposures to the entire stock; therefore, they can be considered instances of exposure rather than a discrete count of individuals that have received regulatory-level sound exposures. The acoustic metric used to establish Level B isopleths (SPL) does not consider a duration of exposure (SEL24h) in its calculations. The SPL assumes that an animal within the Level B isopleth, regardless of the length of time, is taken by exposure. The take estimates assume that an animal will only be taken once over a 24-hour period; however, an activity may result in multiple takes of the same animal during this period. The multiplication of the same animals being exposed over the survey period yields inflated take numbers, indicating a conservative approach to the population-level exposure. Animals in an area of exposure may move location depending on their acoustic sensitivity, life stage, and acclimation (Wood et al., 2012), and may or may not demonstrate behavioral responses.
Additionally, estimates using the habitat density data (Roberts et al., 2016; Roberts, 2018, 2020) may not fully reflect the actual observations in the field. In the case of the NARW, seasonal, patchy densities increase the average annual densities across an entire lease area for only a short period of time, resulting in much fewer detections during the surveys when compared to the calculated exposure estimates. Population percentages represent the maximum potential take numbers, whereas in actuality, a limited number of marine mammals may realize behavioral modification.
Incidental Harassment Authorization - Site Characteriztion Suveys OCS-A 0482 48
7.3 VOLUMETRIC DENSITY CALCULATIONS
Particularly for HRG sources that have narrow bandwidths, the linear distances to impact isopleths are typically over-estimations of the actual three-dimensional sound field produced and the resultant volume of water in which species densities should be applied. Using a volumetric calculation for highly directional sources, such as those used during site characterization surveys for this Project, the sound fields for exposure densities will significantly reduce the number of Level B exposures. As increased information regarding beamwidths for individual geophysical sources is acquired, takes will be reduced accordingly.
7.4 NEGLIGIBLE IMPACTS
Animals in an area of exposure may move location depending on their acoustic sensitivity, life stage, and acclimation (Wood et al., 2012), and may or may not demonstrate behavioral responses. Therefore, while the number of takes and the affected population percentages represent the maximum potential take numbers, in actuality, a limited number of marine mammals may realize behavioral modification.
Under the requirements of 50 CFR § 216.104, NMFS has defined negligible impact as an impact that is not reasonably expected to adversely affect a species or stock through effects on annual rates of recruitment or survival. The small numbers requirement is not based on take estimates alone; rather, for NMFS to make a negligible impact determination, small numbers must denote that the portion of a marine mammal species or stock in the take estimates will have a negligible impact on that species or stock.
As discussed in Sections 9.0 and 10.0, physical auditory effects, vessel strikes, PTS or TTS, and long-term impacts to habitat or prey species are not expected to occur. Temporary masking may occur in localized areas for short periods of time when an animal is in proximity to the survey. Masking occurs when an animal’s acoustic “space” (i.e., auditory perception and discrimination) is covered up by noise of similar frequency but at higher amplitudes of biologically important sounds. However, due to movement of the sources, masking effects are expected to be negligible and will not contribute significantly to other noise sources operating in the region.
The primary potential impact on marine mammals from exposure to survey-related underwater sound is behavioral response, which will not necessarily constitute significant changes in biologically important behaviors. The National Research Council (2005) noted that an action or activity becomes biologically significant to an individual animal when it affects the ability of the animal to grow, survive, and reproduce, wherein an impact on individuals can lead to population-level consequences and affect the viability of the species. The reasonably expected impacts from the proposed activities are based on noise exposure thresholds that can potentially elicit a behavioral response and are categorized as Level B takes under the MMPA. Here, due to the variability in species reaction to sound sources, short time period of the survey operations, and use of mitigation measures, any behavioral reactions are expected to be minor, localized, short-term, and have negligible effects on individuals and stocks. It is expected that behavioral reactions will mainly comprise a temporary shift in spatial use. No long-term or population effects are expected from the behavioral reactions to the proposed surveys.

Incidental Harassment Authorization - Site Characteriztion Suveys OCS-A 0482 49
8.0 Minimization of Adverse Effects to Subsistence Uses
This section addresses NFMS’ requirement to identify methods to minimize adverse effects of the proposed activity on subsistence uses.
There are no current subsistence hunting areas in the vicinity of the proposed Project Area and there are no activities related to the proposed surveys that may affect the availability of a species or stock of marine mammals for subsistence uses. Consequently, there are no available methods to minimize potentially adverse effects to subsistence uses.

Incidental Harassment Authorization - Site Characteriztion Suveys OCS-A 0482 50
9.0 Anticipated Impacts on Habitat
This section addresses NFMS’ requirement to characterize the short- and long-term impacts of the proposed activity on marine mammals associated with the predicted loss or modification of habitat and to address available methods and likelihood of restoration of lost or modified habitat. Anticipated impacts to marine mammal habitat have been summarized in the following sections and are further discussed in Section 10.
9.1 SHORT-TERM IMPACTS
The proposed activity has the potential to affect marine mammal habitat primarily through short-term impacts from increases in ambient noise levels from survey equipment. The expected short-term impacts to the acoustic habitat are highly localized and transient during the survey and therefore, have the potential to only temporarily affect marine mammal prey availability.
9.2 LONG-TERM IMPACTS
Due to the short duration of the potential activities and the minimal acoustic disturbance expected, no long-term impacts associated with loss or modification of habitat are anticipated.
Incidental Harassment Authorization - Site Characteriztion Suveys OCS-A 0482 51
10.0 Anticipated Effects of Habitat Impacts on Marine Mammals
This section addresses the NFMS requirement to characterize the short- and long-term impacts of the proposed activity on predicted habitat loss or modification. The predicted impacts to marine mammal habitat have been summarized in Sections 10.1 and 10.2.
10.1 SHORT-TERM IMPACTS
Marine mammals use sound to navigate, communicate, find open water, avoid predators, and find food. Acoustic acuity within the habitat must be available for species to conduct these ecological processes. If noise levels within critical frequency bands preclude animals from accessing the acoustic properties of that habitat, then availability and quality of that habitat has been diminished. The sounds that marine mammals hear and generate will vary in terms of dominant frequency, bandwidth, energy, temporal pattern, and directionality. The same variables in ambient noise will, therefore, determine a marine mammal’s acoustic resource availability. In the case of marine mammals, anthropogenic noise can be viewed as a form of habitat fragmentation resulting in a loss of acoustic space that could otherwise be occupied by vocalizations or other acoustic cues (Rice et al., 2014). Primary acoustic habitat for a species will be focused within the vocal ranges for that species; therefore, habitat impact assessment should be conducted within those vocal ranges. The functional extent of the ensonified space around operations employing HRG sources will require an understanding of the distribution of SPLs by their spectral probability density and knowledge of received exposure levels with coordinated species densities. Therefore, marine mammals may experience some short-term loss of acoustic habitat, but the nature and duration of this loss is not expected to represent a significant loss of habitat.
Reduction of prey availability might indirectly affect marine mammals by altering prey abundance, behavior, and distribution. Rising sound levels could affect fish populations (McCauley et al., 2003; Popper and Hastings, 2009; Slabbekoorn et al., 2010). Marine fish are typically sensitive to the 100 to 500 Hz range, which is below the primary operating frequencies of most HRG survey sources. However, several studies have demonstrated that seismic airguns and other impulsive sources might affect the behavior of at least some species of fish. For example, field studies by Engås et al. (1996) and Whitlock and Schluter (2009) showed that the catch rate of haddock (Melanogrammus aeglefinus) and Atlantic cod (Gadus morhua) significantly declined over the five days following seismic airgun operation, after which the catch rate returned to normal. Other studies found only minor responses by fish to seismic surveys, such as a small decline in lesser sand eel (Ammodytes marinus) abundance that quickly returned to pre-seismic levels (Hassel et al., 2004) or no permanent changes in the behavior of marine reef fishes (Wardle et al., 2001). Squid (Sepioteuthis australis) are an extremely important food chain component for many higher order marine predators, including sperm whales. McCauley et al. (2000) recorded caged squid responding to airgun signals. Given the generally low SPLs produced by the HRG sources used in this activity compared to sources such as airguns, no short-term impacts to potential prey items (i.e., fishes, cephalopods, crustaceans) are expected from the proposed survey activities.
10.2 LONG-TERM IMPACTS
Due to the short duration of the potential activities and the minimal disturbance expected, no long-term impacts to marine mammals associated with loss or modification habitat are anticipated.

Incidental Harassment Authorization - Site Characteriztion Suveys OCS-A 0482 52
11.0 Mitigation Measures
This section addresses NMFS’ IHA requirement to assess the availability and feasibility (economic and technological), methods, and manner of conducting this survey activity that has the least practicable impact upon affected species or stock, its habitat, and its availability for subsistence uses, paying particular attention to rookeries, mating grounds, and areas of similar significance.
The Applicant has demonstrated a commitment to minimizing impacts to marine mammal species through a comprehensive and progressive mitigation and monitoring program, described here. The Applicant has committed to engaging in ongoing consultations with NMFS and following a comprehensive set of mitigation measures during site characterization surveys. These measures include the following components which are described in detail below:
• Vessel strike avoidance procedures; • Seasonal right whale monitoring requirements; • Establishment of EZs; • Visual monitoring, including low visibility monitoring tools; • Area clearance; • Ramp-up procedures; • Source minimization during turns; • Operational shutdowns and delays; • Communication of sightings between vessels; and • Utilization of Whale Alert as able for monitoring Dynamic Management Areas (DMAs).
The mitigation protocols have been designed to provide protection to marine mammals, both individuals and, by extension, species’ stocks where designated, by minimizing exposure to potentially disruptive noise levels during site characterization activities. The mitigation measures will also reduce the likelihood of ship strikes to large whales in the area.
Project-specific training will be conducted for all vessel crew prior to the start of a survey and during any changes in crew such that all survey personnel are fully aware and understand the mitigation, monitoring, and reporting requirements. Prior to implementation with vessel crews, the training program will be provided to NMFS for review and approval. Confirmation of the training and understanding of the requirements will be documented on a training course log sheet. Signing the log sheet will certify that the crew member understands and will comply with the necessary requirements throughout the survey activities.
11.1 VESSEL STRIKE AVOIDANCE PROCEDURES
The Applicant will ensure that vessel operators and crew maintain a vigilant watch for cetaceans, pinnipeds, and change course, slow down, or switch the engines to neutral, as safely as applicable, to avoid striking these protected species. The applicant will follow speed guidance and regulated approach requirements provided by NMFS (50 CFR § 224.103 and 224.105). Survey vessel crew members responsible for navigation duties will receive site-specific training on marine mammal detection and identification, sighting/reporting, and vessel strike avoidance measures. Vessel strike avoidance measures will include, but are not limited to, the following except under extraordinary circumstances when complying with these requirements would put the safety of the vessel or crew at risk, or if the vessel is restricted in its ability to maneuver:
• All vessel operators and crew will maintain vigilant watch for cetaceans and pinnipeds, and will change course, slow down, or switch engines to neutral to avoid striking an animal;

Incidental Harassment Authorization - Site Characteriztion Suveys OCS-A 0482 53
• All vessel operators will comply with 10 knot speed restrictions in any SMA or DMA; • All vessels 19.8 m or greater operating from November 1 through April 30 will operate at speeds
of 10 knots or less; • All vessel operators will reduce vessel speed to 10 knots or less when mother/calf pairs, pods, or
larger assemblages of non-delphinid cetaceans are observed near an underway vessel; • All survey vessels will maintain a separation distance of 500 m or greater from any sighted
NARW (50 CFR § 224.103); • If underway, vessels must steer a course away from any sighted NARW at 10 knots or less until
the 500-m minimum separation distance has been established. If a NARW is sighted in a vessel’s path, or within 100 m to an underway vessel, the underway vessel must reduce speed and/or shift the engine to neutral. Engines will not be engaged until the NARW has moved outside of the vessel’s path and beyond 100 m. If the whale is stationary, the vessel must not engage engines until the NARW has moved beyond 100 m;
• All vessels will maintain a separation distance of 100 m or greater from any sighted non-delphinid cetacean. If sighted within 100 m, the vessel underway must reduce speed and/or shift the engine to neutral and must not engage the engines until the non-delphinid cetacean has moved outside of the vessel’s path and beyond 100 m. If a survey vessel is stationary, the vessel will not engage engines until the non-delphinid cetacean has moved out of the vessel’s path and beyond 100 m;
• All vessels will maintain a separation distance of 50 m or greater from any sighted delphinid cetacean. Any vessel underway should remain parallel to a sighted delphinid cetacean’s course whenever possible and avoid excessive speed or abrupt changes in direction; and
• All vessels will maintain a separation distance of 50 m or greater from any sighted pinniped.
11.2 SEASONAL RIGHT WHALE OPERATING REQUIREMENTS
Members of the monitoring team will consult NMFS NARW reporting system and Whale Alert, as able, for the presence of NARWs throughout survey operations, and for the establishment of a DMA. If NMFS should establish a DMA in the Lease Areas during the survey, the vessels will abide by speed restrictions in the DMA per the lease conditions.
11.3 MONITORING, EXCLUSION, AND LEVEL B HARASSMENT ZONES
Three distinct zones are defined to better describe the monitoring activities and mitigation actions associated with the detection of a marine mammals during the survey. The Applicant will employ the following zones and conditions during all site characterization survey activities using HRG sources operating at frequencies below 200 kHz:
Monitoring zone: • Includes waters surrounding the sound sources and the vessel; • Encompasses all EZs; and • All marine mammals detected will be recorded.
Level B Zones for All Marine Mammals: • Includes 141 m around active sparker or boomer sound sources; and • Includes 54 m around other active non-sparker/boomer sources that are not operating in
conjunction with sparkers or boomers.

Incidental Harassment Authorization - Site Characteriztion Suveys OCS-A 0482 54
Exclusion Zones: • Includes 500 m for NARWs; • Includes 100 m for all other whales, dolphins, seals, and porpoises; and • The EZ may or may not encompass the Level B zone. A marine mammal’s entry into the EZ does
not necessarily represent a take.
11.4 VISUAL MONITORING
Visual monitoring of the established EZs and monitoring zone will be performed by the NMFS-approved PSOs (Protected Species Observers).
PSOs will be stationed on all survey vessels and will work in shifts such that observers obtain adequate rest periods between active watch periods. For all HRG survey activities with sources operating at <200 kHz, PSOs will work in shifts as stipulated above such that one PSO will be on watch during all daylight hours and two PSOs equipped with nighttime monitoring devices will be on watch during all hours of reduced visibility, including hours of darkness. On a case-by-case basis, and upon approval from NMFS, changes in the PSO numbers, schedule, or 3rd party status may be adjusted during the project. During PSO observations the following guidelines shall be followed:
• Other than brief alerts to bridge of personnel of maritime hazards and the collection of ancillary wildlife data, no additional duties may be assigned to the PSO during his/her visual observation watch.
• No PSO will be allowed more than four consecutive hours on watch before being allocated a break from visual watch.
• No PSO will be assigned a combined watch schedule of more than 12 hours in a 24-hour period.
• The PSOs will stand watch in a suitable location that will not interfere with the navigation or operation of the vessel and affords an optimal view of the sea surface.
• Position data will be recorded using hand-held or vessel GPS units for each sighting.
• The PSOs will be responsible for visually monitoring and identifying marine mammals approaching or entering the established zones during survey activities. It will be the responsibility of the Lead PSO on duty to communicate to the vessel operator the presence of marine mammals as well as to communicate and enforce the action(s) that are necessary to ensure mitigation and monitoring requirements are implemented as appropriate.
• PSOs will share sighting data between Project survey vessels, as able.
• Each PSO will be equipped with reticled binoculars that have an internal compass in order to estimate range and bearing to detected marine mammals. Digital, single-lens reflex camera equipment will be used to record sightings and assist in subsequent verification of species identification.
11.4.1 Nighttime Monitoring
During night operations, night vision equipment (night vision goggles with thermal clip-ons) and infrared/thermal imaging technology will be used. Recent studies have concluded that the use of infrared/thermal imaging technology allows for the detection of marine mammals at night (Verfuss et al.,

Incidental Harassment Authorization - Site Characteriztion Suveys OCS-A 0482 55
2018; Guazzo et al., 2019). Guazzo et al (2019) showed that the probability of detecting a large whale blow by a commercially-available infrared camera was similar at night to during the day; camera monitoring distance was 2.1 km from an elevated vantage point at night versus 3 km for daylight visual monitoring from the same location. The Applicant presents that the use of thermal camera systems for mitigation purposes warrants additional application in the field as both a standalone tool and in conjunction with other alternative monitoring methods (e.g., night vision binoculars).
11.4.2 Data Recording
PSOs will record all sightings of marine mammals while monitoring during day or night. Data on all PSO observations will be recorded based on standard PSO collection requirements. This will include dates and locations of construction operations; time of observation, location and weather; details of the sightings (e.g., species, age classification [if known], numbers, behavior); and details of any observed behavioral disturbances or injury/mortality. Visual detections will be shared between vessels in near-real time, to the extent possible via computer, radio, phone, or other methods, thus increasing situational awareness.
11.5 PRE-START CLEARANCE OF EXCLUSION ZONE
The Applicant will implement a 30-minute clearance period of the EZs prior to the initiation of ramp-up (Section 11.6). After 30 minutes of monitoring, if any marine mammal has entered their respective EZ, ramp-up will not be initiated until the animal is confirmed outside the EZ or until the following time has elapsed since the last sighting of the animal in the EZ:
• 30 minutes for whales, including the NARW; and • 15 minutes for dolphins, porpoises, and seals.
After clearance, if the EZs, Level B Zones, and/or Monitoring Zone are not fully visible to PSOs due to darkness or inclement weather, survey activities may continue, unless a marine mammal is detected within or entering the applicable EZs.
11.6 RAMP-UP PROCEDURES
A ramp-up procedure will be used, to the extent practicable, at the beginning of HRG survey activities in order to provide additional protection to marine mammals near the survey by allowing them to vacate the area prior to the commencement of survey equipment use. Where technically feasible, a ramp-up procedure will be used for HRG survey equipment capable of adjusting energy levels at the start or restart of HRG survey activities. A ramp-up would begin with powering up of the HRG equipment that has the lowest source level output and starting it at its lowest practical power appropriate for the survey. The ramp-up will proceed by either adding equipment with higher source levels, increasing the power output of the operating equipment, or a combination of both.
The ramp-up procedure will not be initiated (i.e., equipment will not be started) during periods of inclement conditions when the marine mammal EZ cannot be adequately monitored by the PSOs for a 30-minute period using the appropriate visual technology. If any marine mammal enters the EZ, ramp-up will not be initiated until the animal is confirmed outside the marine mammal EZ, or until the appropriate time (30 minutes for whales, 15 minutes for dolphins, porpoises, and seals) has elapsed since the last sighting of the animal in the EZ.

Incidental Harassment Authorization - Site Characteriztion Suveys OCS-A 0482 56
11.7 SHUTDOWN PROCEDURES
An immediate shutdown of the HRG survey equipment categories listed in Table 3 when operating at frequencies <200 kHz will be required if a whale, porpoise, or seal is sighted at or within the 100-m marine mammal EZ or if a NARW is observed within the 500-m NARW EZ. Survey equipment will not be shut down for dolphins that voluntarily approach the vessel or survey equipment. The vessel operator must comply immediately with any call for shutdown by the Lead PSO. Any disagreement between the Lead PSO and vessel operator should be discussed only after shutdown has occurred. Subsequent restart of the survey equipment can be initiated if the animal has been observed exiting its respective EZ or has not been re-sighted within their respective EZ for the appropriate time period (30 minutes for whales, 15 minutes for dolphins, porpoises, and seals). The PSOs will determine if the marine mammal is inside or outside the respective EZ.
There is no shutdown requirement for categorical sources not listed in Table 3 (i.e., Parametric SBPs [Innomar], acoustic corers, USBL, MBES, SSS).
If a marine mammal enters the respective EZ during a shutdown period, the equipment may not restart until that animal is confirmed outside the EZ as stated previously, or until the appropriate time listed below has elapsed since the last sighting of the animal in the EZ.
If the acoustic source is shut down for reasons other than mitigation (e.g., mechanical difficulty) for <20 minutes, it may be activated again without ramp-up as long as PSOs have maintained constant observation and no detections of any marine mammal have occurred within the respective EZs. If these conditions are not met, standard ramp-up conditions apply.
11.8 SURVEY COMMUNICATION AND COORDINATION FOR MARINE MAMMAL DETECTIONS
The Applicant will utilize radios and available software to communicate sightings between all vessels. This will allow all PSOs and vessel crew to maintain awareness of marine mammal observations and adjust activities accordingly. The Applicant will also utilize the Whale Alert application to report all NARW detections and monitor for DMAs. Whale Alert will be checked at least once every 4 hours by the PSOs.

Incidental Harassment Authorization - Site Characteriztion Suveys OCS-A 0482 57
12.0 Arctic Plan of Cooperation
This requirement is applicable only for activities that occur in Alaskan waters north of 60° N latitude. The proposed survey activities will not take place within the designated region and, therefore, will not have an adverse effect on the availability of marine mammals for subsistence uses. As such, there is no need to form such a plan.

Incidental Harassment Authorization - Site Characteriztion Suveys OCS-A 0482 58
13.0 Monitoring and Reporting
As required in the conditions of Lease OCS-A 0482, the Applicant will comply with the marine mammal reporting requirements for site characterization activities detailed below.
Reporting Injured or Dead Species. The Applicant will ensure that sightings of any injured or dead marine mammals are reported to the Greater Atlantic (Northeast) Region Marine Mammal and Sea Turtle Stranding & Entanglement Hotline (866-755-NOAA [6622]) within 24 hours of a sighting, regardless of whether the injury or death is caused by a vessel. In addition, if the injury or death was caused by a collision with a Project-related vessel, the Applicant will ensure that BOEM is notified of the strike within 24 hours. The notification of such a strike will include the date and location (latitude/longitude) of the strike, the name of the vessel involved, and the species identification or a description of the animal, if possible. If the Project activity is responsible for the injury or death, the Applicant will supply a vessel to assist in any salvage effort as requested by NMFS.
Reporting of Observed Impacts to Species. The observers will report any observations concerning impacts on marine mammals to BOEM and NMFS within 48 hours. Any observed takes of listed marine mammals resulting in injury or mortality must be reported within 24 hours to BOEM and NMFS.
Final Report. The Applicant will provide BOEM and NMFS with a report within 90 calendar days following the completion of survey activities, including a summary of the survey activities and an estimate of the number of marine mammals taken during these survey activities. Data on all marine mammal observations will be recorded and based on standards of observer collection data by the PSOs. This information will include dates, times, and locations of survey operations; time of observation, location, and weather; details of marine mammal sightings (e.g., species, numbers, behavior); and details of any observed taking (e.g., behavioral disturbances, injury/mortality).
Incidental Harassment Authorization - Site Characteriztion Suveys OCS-A 0482 59
14.0 Suggested Means of Coordinated Research
This section addresses the IHA requirement to suggest means of learning, encouraging, and coordinating research opportunities, plans, and activities related to reducing incidental take and evaluating its effects.
While no direct research on marine mammals or marine mammal stocks is expected from the Project, there is the opportunity for the proposed activity to contribute greatly to the noise characterization in the region and to specific sound source measurements.
Data acquired during the mitigation and monitoring may provide valuable information to direct or refine future research on marine mammal species present in the area. Sightings data (e.g., date, time, weather conditions, species identification, approximate sighting distance, direction, heading in relation to sound sources, behavioral observations) may be useful in designing the location and scope of future marine mammal survey and monitoring programs.
The applicant will immediately share all NARW sightings with NOAA.
All marine mammal data collected by the Applicant during marine characterization survey activities will be provided to NMFS and BOEM through the reporting processes. In addition, the data may be made available to educational institutions and environmental groups upon request.

Incidental Harassment Authorization - Site Characteriztion Suveys OCS-A 0482 60
15.0 List of Preparers
CSA Ocean Sciences Inc.
• Mary Jo Barkaszi, Marine Mammal Programs Manager • Kayla Hartigan, Project Scientist • Ashley Lawson, Project Scientist • Melanie Cahill, Project Scientist • Jeffrey Martin, Project Scientist • Mark Fonseca, Science Reviewer • Bo Douglas, Science Reviewer
Orsted
• Stephanie Wilson, Head of Permitting • Laura Morse, Senior Environmental and Permitting Specialist • Brita Woeck, Lead Environmental and Permitting Specialist • Thomas Bojer Kristensen, Lead Geophysicist, Geophysics and Seabed Surveys • Elizabeth Andrews, Senior Geophysicist, Geophysics and Seabed Surveys
Incidental Harassment Authorization - Site Characteriztion Suveys OCS-A 0482 61
16.0 References
59 Federal Register (FR) 28805. 1994. Designated Critical Habitat; Northern Atlantic Right Whale. June 3, 1994.
62 Federal Register (FR) 39157. 1997. Taking of Marine Mammals Incidental to Commercial Fishing Operations; Atlantic Large Whale Take Reduction Plan Regulations. July 22, 1997.
66 Federal Register (FR) 53195. 2001. Threatened Fish and Wildlife; Status Review of the Gulf of Maine/Bay of Fundy Population of Harbor Porpoise Under the Endangered Species Act (ESA). October 19, 2001.
69 Federal Register (FR) 69536. 2004. Regulations Governing the Approach to North Atlantic Right Whales. November 30, 2004.
73 Federal Register (FR) 60173. 2008. Endangered Fish and Wildlife; Final Rule to Implement Speed Restrictions to Reduce the Threat of Ship Collisions with North Atlantic Right Whales. October 10, 2008.
75 Federal Register (FR) 61690. 2010. Endangered and Threatened Wildlife and Designating Critical Habitat for the Endangered North Atlantic Right Whale. October 6, 2010.
75 Federal Register (FR) 7383. 2010. Taking of Marine Mammals Incidental to Commercial Fishing Operations; Harbor Porpoise Take Reduction Plan Regulations. February 19, 2010.
78 Federal Register (FR) 73726. 2013. Endangered Fish and Wildlife; Final Rule to Remove the Sunset Provision of the Final Rule Implementing Vessel Speed Restrictions to Reduce the Threat of Ship Collisions with North Atlantic Right Whales. December 9, 2013.
81 Federal Register (FR) 4838. 2016. Endangered and Threatened Species; Critical Habitat for Endangered North Atlantic Right Whale. January 27, 2016.
81 Federal Register (FR) 62259. 2016. Endangered and threatened species; Identification of 14 distinct population segments of the humpback whale (Megaptera novaengliae) and revision of species-wide listing. September 8, 2016.
86 Federal Register (FR) 5322. 2021. Taking and Importing Marine Mammals; Taking Marine Mammals Incidental to Geophysical Surveys Related to Oil and Gas Activities in the Gulf of Mexico. 19 January 2021.
Aguilar Soto N, Johnson MP, Madsen PT, Díaz F, Domínguez I, Brito A, Tyack P. 2008. Cheetahs of the deep sea: deep foraging sprints in short‐finned pilot whales off Tenerife (Canary Islands). Journal of Animal Ecology, 77(5):936-947.
Baird RW, Stacey PJ. 1991. Status of the Risso's dolphin, Grampus griseus, in Canada. Canadian Field-Naturalist 105:233-242.
Barco SG, McLellan WA, Allen JM, Asmutis-Silvia RA, Mallon-Day R, Meagher EM, Pabst DA, Robbins J, Seton RE, Swingle WM, Weinrich MT, Clapham PJ. 2002. Population identity of humpback whales (Megaptera novaeangliae) in the waters of the U.S. Mid-Atlantic states. Journal of Cetacean Research and Management 4(2):135-141.
Incidental Harassment Authorization - Site Characteriztion Suveys OCS-A 0482 62
Barkaszi MJ, Kelly CJ. 2019. Seismic survey mitigation measures and protected species observer reports: synthesis report. U.S. Department of the Interior, Bureau Ocean Energy Management, Gulf of Mexico OCS Region, New Orleans, LA. Contract No.: M17PD00004. OCS Study BOEM 2019-012. 220 pp.
Baumgartner MF, Van Parijs SM, Wenzel FW, Tremblay CJ, Esch HC, Warde AM. 2008. Low frequency vocalizations attributed to sei whales (Balaenoptera borealis). Journal of the Acoustical Society of America 124(2):1339-1349.
Best BD, Halpin PN, Read AJ, Fujioka E, Good CP, Labrecque EA, Schick RS, Roberts JJ, Hazen LJ, Qian SS, Palka DL, Garrison LP, McLellan WA. 2012. Online Cetacean Habitat Modeling System for the U.S. East Coast and Gulf of Mexico. Endangered Species Research 18:1-15.
Bettridge S, Baker CS, Barlow J, Clapham PJ, Ford M, Gouveia D, Mattila DK, Pace III RM, Rosel PE, Silber GK, Wade PR. 2015. Status Review of the Humpback Whale (Megaptera novaeangliae) Under the Endangered Species Act. U.S. Department of Commerce, National Oceanic and Atmospheric Administration, National Marine Fisheries Service. NOAA Technical Memorandum NMFS Southwest Fisheries Science Center-540. 263 pp.
Bort J, Van Parijs SM, Stevick PT, Summers E, Todd S. 2015. North Atlantic right whale Eubalaena glacialis vocalization patterns in the central Gulf of Maine from October 2009 through October 2010. Endangered Species Research 26:271-280.
Bureau of Ocean Energy Management (BOEM). 2012. Commercial Wind Lease Issuance and Site Assessment Activities on the Atlantic Outer Continental Shelf Offshore New Jersey, Delaware, Maryland, and Virginia. Final Environmental Assessment. U.S. Department of the Interior, BOEM Office of Renewable Energy Programs. OCS EIS/EA BOEM 2012-003. 366 pp.
Bureau of Ocean Energy Management (BOEM). 2013. Commercial Wind Lease Issuance and Site Assessment Activities on the Atlantic Outer Continental Shelf Offshore Rhode Island and Massachusetts. Revised Environmental Assessment. U.S. Department of the Interior, BOEM Office of Renewable Energy Programs. OCS EIS/EA BOEM 2013-1131. 417 pp.
Bureau of Ocean Energy Management (BOEM). 2014. Atlantic OCS Proposed Geological and Geophysical Activities: Mid-Atlantic and South Atlantic Planning Areas; Final Programmatic Environmental Impact Statement. Volume I: Chapters 1-8, Figures, Tables, and Keyword Index. Prepared by CSA Ocean Sciences Inc. for U.S. Department of the Interior, Bureau of Ocean Energy Management, Gulf of Mexico OCS Region, New Orleans, LA. OCS EIS/EA BOEM 2014-001. 788 pp.
Bureau of Ocean Energy Management (BOEM). 2017. Gulf of Mexico OCS Proposed Geological and Geophysical Activities. Final Programmatic Environmental Impact Statement. Prepared by CSA Ocean Sciences Inc. for U.S. Department of the Interior, BOEM Gulf of Mexico OCS Region. OCS EIS/EIA BOEM 2017-051. 792 pp.
Bureau of Ocean Energy Management (BOEM). 2019. Survey Guidelines for Renewable Energy Development. https://www.boem.gov/Survey-Guidelines/. Accessed 3 March 2021.
Brown MW, Hamilton PK, Kenney RD, Knowlton AR, Marx MK, Mayo CA, Slay CK, Kraus SD, Brault S. 2001. Sighting heterogeneity of right whales in the western North Atlantic: 1980-1992. Journal of Cetacean Research and Management (Special Issue) 2:245-250.

Incidental Harassment Authorization - Site Characteriztion Suveys OCS-A 0482 63
Cetacean and Turtle Assessment Program (CETAP). 1982. A Characterization of Marine Mammals and Turtles in the Mid- and North-Atlantic Areas of the U.S. Outer Continental Shelf. Kingston, Rhode Island: University of Rhode Island, Sponsored by the U.S. Department of the Interior, Bureau of Land Management. Contract #AA552-CT8-48. 576 pp.
Charif RA, Mellinger DK, Dunsmore KJ, Fristrup KM, Clark CW. 2002. Estimated source levels of fin whale (Balaenoptera physalus) vocalizations: Adjustments for surface interference. Marine Mammal Science 18(1):81-98.
Clark CW, Clapham PJ. 2004. Acoustic monitoring on a humpback whale (Megaptera novaeangliae) feeding ground shows continual singing into late spring. Proceedings of the Royal Society B: Biological Sciences 271:1051-1057.
Clark CW, Ellison WT, Southall BL, Hatch L, Van Parijs SM, Frankel AS, Ponirakis D. 2009. Acoustic masking in marine ecosystems: Intuitions, analysis, and implication. Marine Ecology Progress Series 395:201-222.
Cole TVN, Hamilton P, Henry AG, Duley P, Pace III RM, White BN, Frasier T. 2013. Evidence of a North Atlantic right whale Eubalaena glacialis mating ground. Endangered Species Research 21(1):55-64.
Committee on Taxonomy. 2018. List of marine mammal species and subspecies. Society for Marine Mammalogy. Internet website: https://www.marinemammalscience.org/species-information/list-marine-mammal-species-subspecies/. Accessed 23 August 2019.
Craddock JE, Polloni PT, Hayward B, Wenzel FW. 2009. Food habits of Atlantic white-sided dolphins (Lagenorhynchus acutus). Fisheries Bulletin 107:384-394.
Crocker SE, Fratantonio FD. 2016. Characteristics of Sounds Emitted During High-Resolution Marine Geophysical Surveys. Naval Undersea Warfare Center Division, Newport, RI. For U.S. Department of the Interior, Bureau of Ocean Energy Management, Environmental Assessment Division and U.S. Geological Survey. OCS Study BOEM 2016-044. NUWC-NPT Technical Report 12,203, 24 March 2016. 266 pp.
Cunha HA, de Castra ER, Secchi ER, Crespo EA, Lailson-Brito J, Azevedo AF, Lazoski C, Solé-Cava AM. 2015. Correction: Molecular and Morphological Differentiation of Common Dolphins (Delphinus sp.) in the Southwestern Atlantic: Testing the Two Species Hypothesis in Sympatry. PLoS One 10(11):e0140251.
Curry BE, Smith J. 1997. Phylogeographic structure of the bottlenose dolphin (Tursiops truncatus): Stock identification and implications for management. Molecular Genetics of Marine Mammals Special Publication 3:327-347.
Curtice C, Cleary J, Schumchenia E, Halpin PN. 2019. Marine-life Data and Analysis Team (MDAT) Technical Report on the Methods and Development of Marine-life Data to Support Regional Ocean Planning and Management. Prepared on behalf of the Marine-life Data and Analysis Team (MDAT). Accessed at http://seamap.env.duke.edu/models/MDAT/MDAT-Technical-Report.pdf. 81 pp.
Incidental Harassment Authorization - Site Characteriztion Suveys OCS-A 0482 64
Davis GE, Baumgartner MF, Bonnell JM, Bell J, Berchok C, Bort Thornton J, Brault S, Buchanan G, Charif RA, Cholewiak D, Clark CW, Corkeron P, Delarue J, Dudzinski K, Hatch L, Hildebrand J, Hodge L, Klinck H, Kraus S, Martin B, Mellinger DK, Moors-Murphy H, Nieukirk S, Nowacek DP, Parks S, Read AJ, Rice AN, Risch D, Sirovic A, Soldevilla M, Stafford K, Stanistreet JE, Summers E, Todd S, Warde A, Van Parijs SM. 2017. Long-term passive acoustic recordings track the changing distribution of North Atlantic right whales (Eubalaena glacialis) from 2004 to 2014. Scientific Reports 7(1):13460.
Department of the Navy (DoN). 2008. Request for Letter of Authorization for the incidental harassment of marine mammals resulting from Navy training activities conducted within the northwest training range complex. Prepared by Commander, U.S. Pacific Fleet for U.S. Department of Commerce, National Oceanic and Atmospheric Administration, National Marine Fisheries Service Office of Protected Resources. September 2008. 322 pp.
Engås A, Løkkeborg S, Ona E, Soldal AV. 1996. Effects of seismic shooting on local abundance and catch rates of cod (Gadus morhua) and haddock (Melanogrammus aeglefinus). Canadian Journal of Fisheries and Aquatic Sciences 53(10):2238-2249.
Erbe C, Reichmuth C, Cunningham K, Lucke K, Dooling R. 2016. Communication masking in marine mammals: A review and research strategy. Marine Pollution Bulletin 103(1-2):15-38.
Finneran JJ. 2016. Auditory Weighting Functions and TTS/PTS Exposure Functions for Marine Mammals Exposed to Underwater Noise. Marine Mammal Scientific and Vet Support Branch of the Biosciences Division, Space and Naval Warfare Systems Center, San Diego, CA. Technical Report 3026. 134 pp.
Gilbert JR, Waring GT, Wynne KM, Guldager N. 2005. Changes in abundance and distribution of harbor seals in Maine, 1981-2001. Marine Mammal Science 21:519-535.
Glass AH, Cole TVN, Geron M. 2009. Mortality and serious injury determinations for baleen whale stocks along the United States eastern seaboard and adjacent Canadian Maritimes, 2003–2007. U.S. Department of Commerce, National Oceanic and Atmospheric Administration, Northeast Fisheries Science Center. Document 09-04. 18 pp.
Guazzo RA, Weller DW, Europe HM, Durban JW, D’Spain GL, Hildebrand JA. 2019. Migrating eastern North Pacific gray whale call and blow rates estimated from acoustic recordings, infrared camera video, and visual sightings. Scientific Reports 9(1):12617.
Hamazaki T. 2002. Spatiotemporal prediction models of cetacean habitats in the mid-western North Atlantic Ocean (from Cape Hatteras, North Carolina, U.S.A. to Nova Scotia, Canada). Marine Mammal Science 18:920-939.
Hassel A, Knutsen T, Dalen J, Skaar K, Løkkeborg S, Misund OA, Østensen Ø, Fonn M, Haugland EK. 2004. Influence of seismic shooting on the lesser sandeel (Ammodytes marinus). ICES Journal of Marine Science 61(7):1165-1173.
Hayes SA, Josephson E, Maze-Foley K, Rosel PE, (eds.). 2017. US Atlantic and Gulf of Mexico Marine Mammal Stock Assessments -- 2016. U.S. Department of Commerce, National Oceanic and Atmospheric Administration, National Marine Fisheries Service, Northeast Fisheries Science Center, Woods Hole, MA. NOAA Technical Memorandum NMFS-NE-241. 282 pp.

Incidental Harassment Authorization - Site Characteriztion Suveys OCS-A 0482 65
Hayes SA, Josephson E, Maze-Foley K, Rosel PE (Eds). 2019. US Atlantic and Gulf of Mexico Marine Mammal Stock Assessments - 2018. U.S. Department of Commerce, National Oceanic and Atmospheric Administration, National Marine Fisheries Service, Northeast Fisheries Science Center, Woods Hole, MA. NOAA Technical Memorandum NMFS-NE-258. 306 pp.
Hayes SA, Josephson E, Maze-Foley K, Rosel PE, Byrd B, Chavez-Rosales S, Cole TVN, Garrison LP, Hatch J, Henry A, Horstman SC, Litz J, Lyssikatos MC, Mullin KD, Orphanides C, Pace RM, Palka DL, Powell J, Wenzel FW. 2020. US Atlantic and Gulf of Mexico Marine Mammal Stock Assessments - 2019 U.S. Department of Commerce, National Oceanic and Atmospheric Administration, National Marine Fisheries Service, Northeast Fisheries Science Center, Woods Hole, MA. NOAA Technical Memorandum NMFS-NE-264, July 2020. 479 pp.
Hersh SL, Duffield DA. 1989. Distinction between northwest Atlantic offshore and coastal bottlenose dolphins based on hemoglobin profile and morphometry. In: S Leatherwood, RR Reeves (Eds.), The bottlenose dolphin. San Diego, CA: Academic Press. pp. 129-140.
Hodge KB, Muirhead CA, Morano JL, Clark CW, Rice AN. 2015. North Atlantic right whale occurrence near wind energy areas along the Mid-Atlantic US coast: implications for management. Endangered Species Research 28(3):225-234.
Holt MM. 2008. Sound exposure and Southern Resident killer whales (Orcinus orca): A review of current knowledge and data gaps. National Fisheries Service. NOAA Technical Memorandum NMFS-NWFSC-89. 77 pp.
International Organization for Standardization (ISO). 2017. ISO 18405 Underwater Acoustics – Terminology. International Organization for Standardization, Geneva, Switzerland. 62 pp.
Jefferson TA, Webber MA, Pitman RL. 2008. Marine mammals of the world: A comprehensive guide to their identification. London, UK: Elsevier. 573 pp.
Jefferson TA, Webber MA, Pitman RL. 2011. Marine mammals of the world: A comprehensive guide to their identification. London, UK: Elsevier. 576 pp.
Kastelein RA, Wensveen PJ, Hoek L, Verboom WC, Terhune JM. 2009. Underwater detection of tonal signals between 0.125 and 100 kHz by harbor seals (Phoca vitulina). Journal of the Acoustical Society of America 125(2):1222-1229.
Katona SK, Rough V, Richardson DT. 1993. A Field Guide to Whales, Porpoises, and Seals from Cape Cod to Newfoundland. Washington, D.C.: Smithsonian Institution Press. 336 pp.
Kenney RD. 1990. Bottlenose dolphins off the Northeastern United States. In: S Leatherwood, RR Reeves (Eds.), The bottlenose dolphin. San Diego, CA: Academic Press. pp. 369-386.
Kenney RD, Winn HE, Macauley MC. 1995. Cetaceans in the Great South Channel, 1979-1989: right whale (Eubalaena glacialis). Continental Shelf Research 15:385-414.
Kenney RD, Payne PM, Heinemann DW, Winn HE. 1996. Shifts in Northeast Shelf cetacean distributions relative to trends in Gulf of Maine/Georges Bank finfish abundance. In: K Sherman, NA Jaworski, TJ Smayda (Eds.), The Northeast Shelf ecosystem: assessment, sustainability, and management. Cambridge, MA: Blackwell Science, Inc. pp. 169-196.
Incidental Harassment Authorization - Site Characteriztion Suveys OCS-A 0482 66
Kenney RD, Mayo CA, Winn HE. 2001. Migration and foraging strategies at varying spatial scales in Western North Atlantic right whales: a review of hypotheses. Journal of Cetacean Research and Management (Special Issue) 2:251-260.
Kraus SD, Leiter S, Stone K, Wikgren B, Mayo C, Hughes P, Kenney RD, Clark CW, Rice AN, Estabrook B, Tielens J. 2016. Northeast Large Pelagic Survey Collaborative Aerial and Acoustic Surveys for Large Whales and Sea Turtles. Sterling, Virginia: US Department of the Interior, Bureau of Ocean Energy Management. OCS Study BOEM 2016-054. 117 pp.
Leatherwood S, Caldwell DK, Winn HE, Schevill WE, Caldwell MC. 1976. Whales, dolphins, and porpoises of the western North Atlantic: a guide to their identification. U.S. Department of Commerce, National Oceanic and Atmospheric Administration, National Marine Fisheries Service. NOAA Technical Report NMFS Circular 396. 183 pp.
Marine Acoustics, Inc. (MAI). 2018. Sound Source Verification: supporting Deepwater Wind’s Skipjack Wind Farm Project off Maryland and Delaware. MAI 1046. TN 18-027.
Martin, B, J. MacDonnell, N.E. Chorney, and D. Zeddies. 2012. Sound Source Verification of Fugro Geotechnical Sources: Final Report: Boomer, Sub-Bottom Profiler, Multibeam Sonar, and the R/V Taku. Technical report by JASCO Applied Sciences for Fugro GeoServices Inc. JASCO Document 00413, Version 1.0 DRAFT. 31 pp.
Matthews LP, McCordic JA, Parks SE. 2014. Remote acoustic monitoring of North Atlantic right whales (Eubalaena glacialis) reveals seasonal and diel variations in acoustic behavior. PLoS One 9(3):e91367.
McCauley RD, Fewtrell J, Duncan AJ, Jenner C, Jenner MN, Penrose JD, Prince RIT, Adhitya A, Murdoch J, McCabe K. 2000. Marine seismic surveys—a study of environmental implications. APPEA Journal 40(1):692-708.
McCauley RD, Fewtrell J, Popper AN. 2003. High-intensity anthropogenic sound damages fish ears. Journal of the Acoustical Society of America 113:638-642.
McDonald MA, Hildebrand JA, Wiggins SM, Thiele D, Glasgow D, Moore SE. 2005. Sei whale sounds recorded in the Antarctic. Journal of the Acoustical Society of America 188(6):3941-3945.
Mead JG, Potter CW. 1995. Recognizing two populations of the bottlenose dolphin (Tursiops truncatus) of the Atlantic coast of North America-morphologic and ecologic considerations. IBI Reports 5:31-44.
Morano JL, Rice AN, Tielens JT, Estabrook BJ, Murray A, Roberts BL, Clark CW. 2012. Acoustically Detected Year‐Round Presence of Right Whales in an Urbanized Migration Corridor. Conservation Biology 26(4):698-707.
Muir DCG, Wagemann R, Grift NP, Nortstrom RJ, Simon MA, Lien J. 1988. Organochlorine chemical and heavy metal contaminants in white-beaked dolphins (Lagenorhynchus albirostris) and pilot whales (Globicephala melaena) from the coast of Newfoundland, Canada. Archives of Environmental Contamination and Toxicology 17(5):613-629.
Mullin KD, Fulling GL. 2003. Abundance of cetaceans in the southern US North Atlantic Ocean during summer 1998. Fishery Bulletin 101(3):603-613.
Incidental Harassment Authorization - Site Characteriztion Suveys OCS-A 0482 67
National Marine Fisheries Service (NMFS). 2010. Recovery plan for the fin whale (Balaenoptera physalus). U.S. Department of Commerce, National Oceanic and Atmospheric Administration, National Marine Fisheries Service, Office of Protected Resources. Silver Spring, MD. 121 pp.
National Marine Fisheries Service (NMFS). 2013a. Endangered Species Act Section 7 Consultation Biological Opinion, Commercial Wind Lease Issuance and Site Assessment Activities on the Atlantic Outer Continental Shelf in Massachusetts, Rhode Island, New York and New Jersey Wind Energy Areas. Bureau of Ocean Energy Management, Army Corps of Engineers, New England District. NER-2012-9211. 10 April 2013. 256 pp.
National Marine Fisheries Service (NMFS). 2013b. Endangered Species Act Section 7 Consultation, Biological Opinion, Programmatic Geological and Geophysical Activities in the Mid- and South Atlantic Planning Areas from 2013 to 2020. Endangered Species Act Interagency Cooperation Division of the Office of Protected Resources, National Oceanic and Atmospheric Administration, National Marine Fisheries Service, Bureau of Ocean Energy Management, Bureau of Safety and Environmental Enforcement. 19 July 2013. 370 pp.
National Marine Fisheries Service (NMFS). 2018a. 2018 Revisions to: Technical Guidance for Assessing the Effects of Anthropogenic Sound on Marine Mammal Hearing (Version 2.0): Underwater Thresholds for Onset of Permanent and Temporary Threshold Shifts. U.S. Department of Commerce, National Oceanic and Atmospheric Administration. NOAA Technical Memorandum NMFS-OPR-59. 167 pp.
National Marine Fisheries Service (NMFS). 2018b. Manual for Optional User Spreadsheet Tool (Version 2.0) for: 2018 Technical Guidance for Assessing the Effects of Anthropogenic Sound on Marine Mammal Hearing (Version 2.0): Underwater Thresholds for Onset of Permanent and Temporary Threshold Shifts. Silver Spring, MD: U.S. Department of Commerce, National Oceanic and Atmospheric Administration. Silver Spring, MD. 109 pp.
National Marine Fisheries Service (NMFS). 2019a. ESA Section 7 Consultation Tools for Marine Mammals on the West Coast. https://www.fisheries.noaa.gov/west-coast/endangered-species-conservation/esa-section-7-consultation-tools-marine-mammals-west. Accessed 19 March 2021.
National Marine Fisheries Service (NMFS). 2019b. Interim recommendations for sound source level and propagation analysis for high resolution geophysical sources. U.S. Department of Commerce, National Oceanic and Atmospheric Administration, National Marine Fisheries Service, Office of Protected Resources. 19 September 2019. 3 pp.
National Marine Fisheries Service (NMFS). 2019c. Fin Whale (Balaenoptera physalus) 5-Year Review: Summary and Evaluation. U.S. Department of Commerce, National Oceanic and Atmospheric Administration, National Marine Fisheries Service, Office of Protected Resources. February 2019. 40 pp.
National Marine Fisheries Service (NMFS). 2020a. Draft 2020 Marine Mammal Stock Assessment Report, U.S. Atlantic and Gulf of Mexico Draft Marine Mammal Stock Assessment. U.S. Department of Commerce, National Oceanic and Atmospheric Administration, National Marine Fisheries Service. Draft published on 4 December 2020, 85 FR 78307. 496 pp.
National Marine Fisheries Service (NMFS). 2020b. 2018–2020 Pinniped Unusual Mortality Event along the Northeast Coast. https://www.fisheries.noaa.gov/new-england-mid-atlantic/marine-life-distress/2018-2019-pinniped-unusual-mortality-event-along. Accessed 19 March 2021.

Incidental Harassment Authorization - Site Characteriztion Suveys OCS-A 0482 68
National Marine Fisheries Service (NMFS). 2021a. 2017-2021 North Atlantic Right Whale Unusual Mortality Event. https://www.fisheries.noaa.gov/national/marine-life-distress/2017-2019-north-atlantic-right-whale-unusual-mortality-event. Accessed 19 March 2021.
National Marine Fisheries Service (NMFS). 2021b. Reducing Ship Strikes to North Atlantic Right Whales. https://www.fisheries.noaa.gov/national/endangered-species-conservation/reducing-ship-strikes-north-atlantic-right-whales. Accessed 19 March 2021.
National Marine Fisheries Service (NMFS). 2021c. 2016-2021 Humpback whale unusual mortality event along the Atlantic coast. https://www.fisheries.noaa.gov/national/marine-life-distress/2016-2019-humpback-whale-unusual-mortality-event-along-atlantic-coast Accessed 19 March 2021.
National Marine Fisheries Service (NMFS). 2021d. 2017–2021 Minke Whale Unusual Mortality Event along the Atlantic Coast. https://www.fisheries.noaa.gov/national/marine-life-distress/2017-2019-minke-whale-unusual-mortality-event-along-atlantic-coast. Accessed 19 March 2021.
National Oceanographic and Atmospheric Administration (NOAA). 2019. NOAA Right Whale Sighting Advisory System Interactive Mapper. https://www.nefsc.noaa.gov/psb/surveys/MapperiframeWithText.html. Accessed 23August 2019.
National Research Council (NRC). 2005. Marine Mammal Populations and Ocean Noise: Determining When Noise Causes Biologically Significant Effects. Committee on Characterizing Biologically Significant Marine Mammal Behavior. Washington, D.C.: The National Academies Press. 142 pp.
New Jersey Department of Environmental Protection (NJDEP). 2010. Ocean/Wind power ecological baseline studies January 2008–December 2009. Final Report. Prepared by Geo-Marine, Inc. July 2010. 259 pp.
Palka D. 2012. Cetacean Abundance Estimates in US Northwestern Atlantic Ocean Waters from Summer 2011 Line Transect Survey. U.S. Department of Commerce, National Oceanic and Atmospheric Administration, National Marine Fisheries Service, Northeast Fisheries Science Center, Woods Hole, MA. NEFSC Reference Document 12-29. 43 pp.
Palka DL, Chavez-Rosales S, Josephson E, Cholewiak D, Haas HL, Garrison L, Jones M, Sigourney D, Waring G, Jech M, Broughton E, Soldevilla M, Davis G, DeAngelis A, Sasso CR, Winton MV, Smolowitz RJ, Fay G, LaBrecque E, Leiness JB, Dettloff, Warden M, Murray K, Orphanides C. 2017. Atlantic Marine Assessment Program for Protected Species: 2010-2014. Washington, DC: U.S. Department of the Interior, Bureau of Ocean Energy Management, Atlantic OCS Region. OCS Study BOEM 2017-071. 211 pp.
Pangeo Subsea. 2018. Acoustic corer sound source analysis and environmental impact for South Fork Wind Farm. RPT-08082-1. April 2, 2018. 56 pp.
Parks SE, Tyack PL. 2005. Sound production by North Atlantic right whales (Eubalaena glacialis) in surface active groups. Journal of the Acoustical Society of America 117(5):3297-3306.
Parks SE, Hamilton PK, Kraus SD, Tyack PL. 2005. The gunshot sound produced by male North Atlantic right whales (Eubalaena glacialis) and its potential function in reproductive advertisement. Marine Mammal Science 21(3):458-475.

Incidental Harassment Authorization - Site Characteriztion Suveys OCS-A 0482 69
Payne PM, Selzer LA. 1989. The Distribution, Abundance and Selected Prey of the Harbor Seal, Phoca Vitulina Concolor, in Southern New England. Marine Mammal Science 5:173-192.
Payne PM, Selzer LA, Knowlton AR. 1984. Distribution and density of cetaceans, marine turtles, and seabirds in the shelf waters for the northeastern United States, June 1980 - December 1983, based on shipboard observations. U.S. Department of Commerce, National Marine Fisheries Service, Northeast Fisheries Science Center, Woods Hole, MA. NOAA/NMFS Contract No. NA-81-FA-C-00023. 294 pp.
Payne PM, Nicholas JR, O'Brien L, Powers KD. 1986. The distribution of the humpback whale, Megaptera novaeangliae, on Georges Bank and in the Gulf of Maine in relation to densities of the sand eel, Ammodytes americanus. Fisheries Bulletin 84:271-277.
Payne PM, Heinemann DW, Selzer LA. 1990. A distributional assessment of cetaceans in the shelf and shelf edge waters of the northeastern United States based on aerial and shipboard surveys, 1978-1988. Report to U.S. Department of Commerce, National Oceanic and Atmospheric Administration, National Marine Fisheries Service, Northeast Fisheries Science Center, Woods Hole, MA. 253 pp.
Pendleton DE, Pershing A, Brown MW, Mayo CA, Kenney RD, Record NR, Cole TV. 2009. Regional-scale mean copepod concentration indicates relative abundance of North Atlantic right whale. Marine Ecology Progress Series 378:211.
Perrin W. 2002. Common Dolphins. In: W Perrin, B Wursig, J Thewissen (Eds.), Encyclopedia of Marine Mammals. San Diego, California: Academic Press. pp. 4.
Perrin WF, Caldwell DK, Caldwell MC. 1994. Atlantic spotted dolphin Stenella frontalis (G. Cuvier, 1829). Handbook of Marine Mammals 5:173-190.
Popper AN, Hastings MC. 2009. The effects of human‐generated sound on fish. Integrative Zoology 4(1):43-52.
Rankin S, Barlow J. 2005. Source of the North Pacific “boing” sound attributed to minke whales. Journal of the Acoustical Society of America 118(5):3346-3351.
Rankin S, Barlow J. 2007. Vocalizations of the sei whale (Balaenoptera borealis) off the Hawaiian Islands. Bioacoustics 16:137-145.
Rasmussen MH, Miller LA. 2002. Whistles and clicks from white-beaked dolphins, Lagenorhynchus albirostris, recorded in Faxaflói Bay, Iceland. Aquatic Mammals 28(1):78-89.
Reeves RR. 2001. Overview of catch history, historic abundance and distribution of right whales in the western North Atlantic and in Cintra Bay, West Africa. Journal of Cetacean Research and Management 2:187-192.
Reeves RR, Rosa C, George JC, Sheffield G, Moore M. 2012. Implications of Arctic industrial growth and strategies to mitigate future vessel and fishing gear impacts on bowhead whales. Marine Policy 36(2):454-462.
Reeves RR, McClellan K, Werner TB. 2013. Marine mammal bycatch in gillnet and other entangling net fisheries, 1990 to 2011. Endangered Species Research 20(1):71-97.

Incidental Harassment Authorization - Site Characteriztion Suveys OCS-A 0482 70
Rice AN, Tielens JT, Estabrook BJ, Muirhead CA, Rahaman A, Guerra M, Clark CW. 2014. Variation of ocean acoustic environments along the western north Atlantic coast: a case study in context of the right whale migration route. Ecological Informatics 21:89-99.
Richardson W, Greene Jr. C, Malme C, Thomson D. 1995. Marine mammals and noise. San Diego, CA: Academic Press. 575 pp.
Risch D, Castellote M, Clark CW, Davis GE, Dugan PJ, Hodge LEW, Kumar A, Lucke K, Mellinger DK, Nieukirk S, Popescu CM, Ramp C, Read AJ, Rice AN, Silva MA, Siebert U, Stafford KM, Verdaat H, Van Parijs SM. 2014. Seasonal migrations of North Atlantic minke whales: novel insights from large-scale passive acoustic monitoring networks. Movement Ecology 2(24):1-17.
Roberts JJ. 2018. Revised habitat-based marine mammal density models for the U.S. Atlantic and Gulf of Mexico. Unpublished data files received with permission to use September, 2018.
Roberts JJ. 2020. Revised habitat-based marine mammal density models for the U.S. Atlantic and Gulf of Mexico. Unpublished data files received with permission to use August, 2020.
Roberts JJ, Best BD, Mannocci L, Fujioka E, Halpin PN, Palka DL, Garrison LP, Mullin KD, Cole TVN, Khan CB, McLellan WM, Pabst DA, Lockhart GG. 2016. Habitat-based cetacean density models for the U.S. Atlantic and Gulf of Mexico. Scientific Reports 6:22615.
Sabinsky PF, Tougaard J, Wahlberg M, Larsen ON. 2012. Seasonal, diel, tidal, and geographical variation in male harbour seal (Phoca vitulina) vocalizations in southern Scandinavia. In: 26th Annual Conference of the European Cetacean Society. 26-28 March 2012, Galway, Ireland.
Salisbury DP, Clark CW, Rice AN. 2016. Right whale occurrence in the coastal waters of Virginia, USA: Endangered species presence in a rapidly developing energy market. Marine Mammal Science 32(2):508-519.
Selzer LA, Payne PM. 1988. The distribution of white-sided, Lagenorhynchus acutus and common dolphins, Delphinus delphis vs. environmental features of the continental shelf of the northeastern United States. Marine Mammal Science 4(2):141-153.
Slabbekoorn H, Bouton N, van Opzeeland I, Coers A, ten Cate C, Popper AN. 2010. A noisy spring: the impact of globally rising underwater sound levels on fish. Trends in Ecology and Evolution 25(7):419-427.
Southall BJ, Bowles AE, Ellison WT, Finneran JJ, Gentry RL, Greene Jr. CR, Kastak D, Ketten DR, Miller JH, Nachtigall PE, Richardson WJ, Thomas JA, Tyack PL. 2007. Marine mammal noise exposure criteria: Initial scientific recommendations. Aquatic Mammals 33(44):411-521.
Southall BL, Finneran JJ, Reichmuth C, Nachtigall PE, Ketten DR, Bowles AE, Ellison WT, Nowacek DP, Tyack PL. 2019. Marine Mammal Noise Exposure Criteria: Updated Scientific Recommendations for Residual Hearing Effects. Aquatic Mammals 45(2):125-232.
Stewart BS, Clapham PJ, Powell JA. 2002. Guide to marine mammals of the World. National Audubon Society. 528 pp.
Incidental Harassment Authorization - Site Characteriztion Suveys OCS-A 0482 71
Thompson PM, Hastie GD, Nedwell J, Barham R, Brookes KL, Cordes LS, Bailey H, McLean N. 2013. Framework for assessing impacts of pile-driving noise from offshore wind farm construction on a harbour seal population. Environmental Impact Assessment Review 43:73-85.
Torres LG, Rosel PE, D'Agrosa C, Read AJ. 2003. Improving management of overlapping bottlenose dolphin ecotypes through spatial analysis and genetics. Marine Mammal Science 19(3):502-514.
U.S. Fish and Wildlife Service (USFWS). 2019. West Indian manatee Trichechus manatus. https://www.fws.gov/southeast/wildlife/mammals/manatee/. Accessed 1 August 2019.
van der Hoop JM, Moore MJ, Barco SG, Cole TVN, Daoust PY, Henry AG, McAlpine DF, McLellan WA, Wimmer T, Solow AR. 2013. Assessment of management to mitigate anthropogenic effects on large whales. Conservation Biology 27(1):121-133.
Verfuss UK, Gillespie D, Gordon J, Marques TA, Miller B, Plunkett R, Theriault JA, Tollit DJ, Zitterbart DP, Hubert P, Thomas L. 2018. Comparing methods suitable for monitoring marine mammals in low visibility conditions during seismic surveys. Marine Pollution Bulletin 126:1-18.
Vester H, Hammerschmidt K, Timme M, Hallerberg S. 2014. Bag-of-calls analysis reveals group specific vocal repertoire in long-finned pilot whales. Quantitative Methods arXiv:1410.4711.
Vu E, Risch D, Clark C, Gaylord S, Hatch L, Thompson M, Wiley D, Van Parijs S. 2012. Humpback whale song occurs extensively on feeding grounds in the western North Atlantic Ocean. Aquatic Biology 14(2):175-183.
Wardle CS, Carter TJ, Urquhart GG, Johnstone ADF, Ziolkowski AM, Hampson G, Mackie D. 2001. Effects of seismic air guns on marine fish. Continental Shelf Research 21(8):1005-1027.
Waring GT, Josephson E, Maze-Foley K, Rosel PE, (eds.). 2010. U.S. Atlantic and Gulf of Mexico Marine Mammal Stock Assessments - 2010. U.S. Department of Commerce, National Oceanic and Atmospheric Administration, National Marine Fisheries Service, Northeast Fisheries Science Center, Wood Hole, MA. NOAA Technical Memorandum NMFS-NE-219. 609 pp.
Waring GT, Josephson E, Maze-Foley K, Rosel PE, (eds.). 2014. U.S. Atlantic and Gulf of Mexico Marine Mammal Stock Assessments - 2013. U.S. Department of Commerce, National Oceanic and Atmospheric Administration, National Marine Fisheries Service, Northeast Fisheries Science Center, Wood Hole, MA. NOAA Technical Memorandum NMFS-NE-228. 475 pp.
Waring GT, Josephson E, Maze-Foley K, Rosel PE, (eds.). 2015. U.S. Atlantic and Gulf of Mexico marine mammal stock assessments – 2014. U.S. Department of Commerce, National Oceanographic and Atmospheric Administration, National Marine Fisheries Service, Northeast Fisheries Science Center, Woods Hole, MA. NOAA Technical Memorandum NMFS-NE-231. 370 pp.
Waring GT, Josephson E, Maze-Foley K, Rosel PE, (eds.). 2016. U.S. Atlantic and Gulf of Mexico Marine Mammal Stock Assessments - 2015. U.S. Department of Commerce, National Oceanic and Atmospheric Administration, National Marine Fisheries Service, Northeast Fisheries Science Center, Wood Hole, MA. NOAA Technical Memorandum NMFS-NE-238. 512 pp.
Watkins WA, Daher MA, Reppucci GM, George JE, Martin DL, DiMarzio NA, Gannon DP. 2000. Seasonality and distribution of whale calls in the North Pacific. Oceanography 13:62-67.

Incidental Harassment Authorization - Site Characteriztion Suveys OCS-A 0482 72
Weisbrod AV, Shea D, Moore MJ, Stegemann JJ. 2000. Organochlorine exposure and bioaccumulation in the endangered Northwest Atlantic right whale (Eubalaena glacialis) population. Environmental Toxicology and Chemistry 19(3):654-666.
Whitlock MC, Schluter D. 2009. The analysis of biological data. Greenwood Village, Colorado: Roberts and Company Publishers. 704 pp.
Whitt AD, Dudzinski K, Laliberté JR. 2013. North Atlantic right whale distribution and seasonal occurrence in nearshore waters off New Jersey, USA, and implications for management. Endangered Species Research 20(1):59-69.
Whitt AD, Powell JA, Richardson AG, Bosyk JR. 2015. Abundance and distribution of Marine mammals in nearshore waters off New Jersey, USA. Journal of Cetacean Research and Management 15:45-59.
Wiley DN, Asmutis RA, Pitchford TD, Gannon DP. 1995. Stranding and mortality of humpback whales, Megaptera novaeangliae, in the Mid-Atlantic and southeast United States, 1985-1992. Fisheries Bulletin 93:196-205.
Williams KA, Connelly EE, Johnson SM, Stenhouse IJ, (eds.). 2015a. Wildlife Densities and Habitat Use Across Temporal and Spatial Scales on the Mid-Atlantic Outer Continental Shelf: Final Report to the Department of Energy EERE Wind and Water Power Technologies Office. Biodiversity Research Institute, Portland, ME. Report BRI 2015-11, Award Number: DE-EE0005362. 715 pp.
Williams KA, Connelly EE, Johnson SM, Stenhouse IJ, (eds.). 2015b. Baseline Wildlife Studies in Atlantic Waters Offshore of Maryland: Final Report to the Maryland Department of Natural Resources and the Maryland Energy Administration, 2015. Biodiversity Research Institute, Portland, ME. Report BRI 2015-17. 437 pp.
Wingfield JE, O'Brien M, Lyubchich V, Roberts JJ, Halpin PN, Rice AN, Bailey H. 2017. Year-round spatiotemporal distribution of harbour porpoises within and around the Maryland wind energy area. PLoS One 12(5):e0176653.
Winn HE, Price CA, Sorensen PW. 1986. The distributional ecology of the right whale Eubalaena glacialis in the western North Atlantic. Reports of the International Whaling Commission, Special Issue 10:129-138.
Wood J, Southall BL, Tollit DJ. 2012. PG&E offshore 3‐D Seismic Survey Project EIR – Marine Mammal Technical Draft Report. SMRU Ltd. SMRUL-NA0611ERM. 124 pp.