gao-21-138, oil and gas: onshore competitive and
TRANSCRIPT

OIL AND GAS
Onshore Competitive and Noncompetitive Lease Revenues
Report to Congressional Requesters
November 2020
GAO-21-138
United States Government Accountability Office

United States Government Accountability Office
Highlights of GAO-21-138, a report to congressional requesters
November 2020
OIL AND GAS Onshore Competitive and Noncompetitive Lease Revenues
What GAO Found Pursuant to federal law, the Department of the Interior’s (Interior) Bureau of Land Management (BLM) offers leases competitively through auction or noncompetitively for a fee if an adequate bid is not received. Competitive leases for oil and gas development on federal lands produced greater revenues, on average, than noncompetitive leases for fiscal years 2003 through 2019, according to GAO’s analysis of revenues reported by Interior’s Office of Natural Resources Revenue (ONRR) and leases from BLM. For this period, about 72,800 competitive leases produced about $14.3 billion in revenues—while total of 100,300 leases produced $16.1 billion. Average revenues from competitive leases over this time period were nearly 3 times greater than revenues from noncompetitive leases; about $196,000 and $66,000, respectively.
Based on GAO’s analysis of leases that started in fiscal years 2003 through 2009, competitive leases produced oil and gas more often than noncompetitive leases during the leases’ 10-year primary term. Further, competitive leases with high bonus bids (bids above $100 per acre) were more likely to produce oil and gas in their 10-year primary terms than both competitive leases with lower bonus bids and noncompetitive leases. Specifically, about 26 percent of competitive leases that sold with bonus bids above $100 per acre produced oil and gas and generated royalties in their primary term compared with about 2 percent for competitive leases that sold at the minimum bid of $2 per acre and about 1 percent for noncompetitive leases. GAO’s analysis showed that competitive leases with high bonus bids generated over 3 times the amount of cumulative, or total, royalties by the end of their primary term than all other competitive and noncompetitive leases combined (see fig.).
Cumulative Royalties from Competitive Leases, by Bonus Bid, and Noncompetitive Leases That Started in Fiscal Years 2003 through 2009
View GAO-21-138. For more information, contact Frank Rusco at (202) 512-3841 or [email protected].
Why GAO Did This Study According to BLM, federal onshore oil and gas leases generate about $3 billion annually in federal revenues, including royalties, one-time bonus bid payments, and rents. The Federal Onshore Oil and Gas Leasing Reform Act of 1987 requires that public lands available for oil and gas leasing first be offered under a competitive bidding process. BLM offers leases with 10-year primary terms competitively through auction or, if the tract of land does not receive an adequate bid, noncompetitively for a fee. The minimum bid is $2 per acre, and bids at or above the minimum are called bonus bids.
ONRR is to collect revenues from oil and gas leases in accordance with the specific terms and conditions outlined in the leases, including revenues from rents and royalties. Lessees are to pay rent annually until production begins on the leased land and then pay royalties as a percentage of oil and gas production. Lease terms may be extended beyond the primary term if, for example, the lease is producing oil or gas.
GAO was asked to review oil and gas leasing on federal lands. This report describes oil and gas revenues from competitive and noncompetitive leases for fiscal years 2003 through 2019.
GAO analyzed federal lease and revenue data and interviewed Interior officials and four experts knowledgeable about federal oil and gas leasing. To consistently compare leases over their lifecycle, GAO analyzed revenues that occurred within the leases’ primary term (first 10 years) for leases that started in fiscal years 2003 through 2009.

Page i GAO-21-138 Oil and Gas Leasing
Letter 1
Background 5 Competitive Leases Sold at High Bonus Bids Had Greater
Revenues than Other Competitive and Noncompetitive Leases 10 Agency Comments 16
Appendix I Objectives, Scope, and Methodology 18
Appendix II Additional Information on Lease Revenues for Fiscal Years 2003 through 2019 25
Appendix III GAO Contact and Staff Acknowledgments 28
Tables
Table 1: Competitive and Noncompetitive Onshore Lease Revenues for Fiscal Years 2003 through 2019 11
Table 2: Primary Term Royalties from Noncompetitive and Competitive Leases by Bonus Bid That Started in Fiscal Years 2003 through 2009 16
Figures
Figure 1: Process for Federal Oil and Gas Leases and Associated Revenues 9
Figure 2: Primary Term Revenues from Noncompetitive Leases and Competitive Leases by Bonus Bid That Started in Fiscal Years 2003 through 2009 13
Figure 3: Average Primary Term Revenues from Noncompetitive Leases and Competitive Leases Sold at the Minimum Bonus Bid That Started in Fiscal Years 2003 through 2009 15
Figure 4: Average Revenues from Competitive and Noncompetitive Leases for Fiscal Years 2003 through 2019, by Revenue Type and Decade in which the Lease Started 25
Contents

Page ii GAO-21-138 Oil and Gas Leasing
Figure 5: Revenues from Competitive and Noncompetitive Leases for Fiscal Years 2003 through 2019, by Commodity and Revenue Type 26
Figure 6: Cumulative Royalties from Competitive Leases, by Bonus Bid, and Noncompetitive Leases That Started in Fiscal Years 2003 through 2009 27
Abbreviations BLM Bureau of Land Management Interior Department of the Interior LR2000 Legacy Rehost System 2000 MRMSS Minerals Revenue Management Support System 1987 Reform Act Federal Onshore Oil and Gas Leasing Reform Act of 1987 ONRR Office of Natural Resources Revenue
This is a work of the U.S. government and is not subject to copyright protection in the United States. The published product may be reproduced and distributed in its entirety without further permission from GAO. However, because this work may contain copyrighted images or other material, permission from the copyright holder may be necessary if you wish to reproduce this material separately.

Page 1 GAO-21-138 Oil and Gas Leasing
441 G St. N.W. Washington, DC 20548
November 19, 2020
The Honorable Raúl M. Grijalva Chairman Committee on Natural Resources House of Representatives
The Honorable Alan S. Lowenthal Chairman Subcommittee on Energy and Mineral Resources Committee on Natural Resources House of Representatives
The production of oil and natural gas from leases on federal lands is a significant source of revenue for the federal government.1 According to the Department of the Interior’s (Interior) Bureau of Land Management (BLM), federal onshore oil and gas leases generate about $3 billion annually in federal revenues, including royalties, one-time bonus bid payments, and rents. As the bureau responsible for managing the federal government’s onshore oil and gas program, BLM leases federal lands through both competitive and noncompetitive processes established by the Federal Onshore Oil and Gas Leasing Reform Act of 1987 (1987 Reform Act).2 These processes include auctions that are open to the public. If BLM receives bids on parcels of land at or above the minimum acceptable bid—called bonus bids—the agency awards the lease to the highest bidder; such leases are called competitive leases.3 Tracts of land that do not receive a bid at auction are made available noncompetitively
1The federal government generally shares approximately half of this revenue with the states in which the oil and natural gas was produced.
2BLM’s current leasing processes were established under the Mineral Leasing Act of 1920, as amended. The 1987 Reform Act amended the Mineral Leasing Act of 1920. The focus of this report is on federal onshore oil and gas leasing. It does not address offshore leases. For more information on offshore leasing, see GAO, Offshore Oil and Gas: Opportunities Exist to Better Ensure a Fair Return on Federal Resources, GAO-19-531 (Washington, D.C.: Sept. 25, 2019).
3BLM is required to accept the highest bid received that exceeds the minimum bid value of $2 per acre or fraction thereof. 30 U.S.C. § 226(b)(1).
Letter

Page 2 GAO-21-138 Oil and Gas Leasing
for a period of 2 years on a first-come, first-served basis; such leases are called noncompetitive leases.4
Interior’s Office of Natural Resources Revenue (ONRR) collects revenues from oil and gas leases under the specific terms and conditions established in each lease. During the primary lease term, which is generally 10 years, operators pay annual rents until production begins on the leased land.5 Operators also pay royalties based on the amount of oil and gas produced under the lease. According to BLM, lease terms may be extended beyond the primary term when oil or gas is produced in paying quantities, among other instances.6 In general, a lease remains in effect so long as the operator continues to produce oil or gas in paying quantities.7
In February 2011, we added Interior’s management of federal oil and gas resources to our list of programs at high risk for fraud, waste, abuse, and mismanagement due to Interior’s challenges regarding royalty 430 U.S.C. § 226(b)(1)(A), (c); 43 C.F.R. §§ 3110.1(b), 3110.2.
5A lease can be terminated or cancelled before the 10-year term ends. For the purposes of this report, we refer to oil and gas companies that obtain competitive and noncompetitive leases as operators.
6According to BLM regulations, production in paying quantities means production of oil or gas of sufficient value to exceed direct operating costs and the cost of lease rentals or minimum royalties. However, these BLM regulations do not address what costs may be deducted for the purposes of royalty payment calculations. In addition, BLM issued national emergency guidance for suspending onshore oil and gas leases (i.e., placing leases on hold) and reducing required royalty payment amounts, due to the effects of Coronavirus Disease 2019 (COVID-19) on operations or production. The effect of lease suspensions and royalty rate reductions due to COVID-19 is outside the scope of this review. For more information on the effects of royalty rate reductions, see GAO, Federal Oil and Gas Revenue: Actions Needed to Improve BLM’s Royalty Relief Policy, GAO-21-169T (Washington, D.C.: Oct. 6, 2020).
730 U.S.C. § 226(e); 43 C.F.R. § 3107.2-1. BLM regulations also provide that leases shall not expire if they contain a well capable of production, unless BLM directs the operator to put those leases in production and the operator fails to do so within the period specified. 43 C.F.R. § 3107.2-3. Leases may still be in effect without producing wells, such as when a lease has wells that are not producing but can still physically and mechanically operate without additional equipment (i.e., shut-in wells). A lease may also be in effect but be suspended due to, for example, permit issues or environmental reviews. For more information on shut-in and other nonproducing wells, see GAO, Oil and Gas Wells: Bureau of Land Management Needs to Improve Its Data and Oversight of Its Potential Liabilities, GAO-18-250 (Washington, D.C.: May 16, 2018). For more information on lease suspensions, see GAO, Oil and Gas Lease Management: BLM Could Improve Oversight of Lease Suspensions with Better Data and Monitoring Procedures, GAO-18-411 (Washington, D.C.: June 4, 2018).

Page 3 GAO-21-138 Oil and Gas Leasing
determination and collection, human capital, and the restructuring of offshore oil and gas oversight.8
You asked us to review oil and gas leasing on federal lands. This report describes oil and gas revenues from competitive and noncompetitive leases on federal lands for fiscal years 2003 through 2019.
To describe oil and gas revenues from competitive and noncompetitive leases for fiscal years 2003 through 2019, we obtained lease data from BLM’s database for mineral and land use—Legacy Rehost System 2000 (LR2000)—and revenue data from ONRR’s Minerals Revenue Management Support System (MRMSS). LR2000 contains information on lease characteristics, such as lease acreage, lease effective (or start) dates, and lease case types (i.e., lease types). To identify competitive and noncompetitive leases, we used LR2000 case types to classify groups of leases sold through the 1987 Reform Act process.9 MRMSS contains information on revenue amounts, revenue types (e.g., royalties, rents, and bonus bids), commodities produced (e.g., oil and gas), and the dates operators reported revenues and sold products that generated royalties.10 We standardized information to combine revenues reported in two different data sets: the ONRR-2014 and ONRR Direct Billed data. We then aggregated the revenues to a unit of analysis defined by lease, month, revenue type, and commodity. To link information on leases characteristics to revenues, we developed a method to match leases in LR2000 and MRMSS data.11
8GAO, High Risk Series: An Update, GAO-11-278 (Washington, D.C.: Feb. 16, 2011).
9We used BLM’s Oil and Gas LR2000 Desk Reference Guide to classify leases as competitive or noncompetitive based on post-1987 Reform Act case type codes. We classified the remaining leases in BLM’s Desk Reference Guide as “other.” While competitive and noncompetitive leases existed before 1987, the 1987 Reform Act changed how BLM offered those lease types for sale. For the purposes of this report, we limit our definition of competitive and noncompetitive leases to those that were sold through the 1987 Reform Act process.
10Where possible, we relied on ONRR’s variable definitions that it uses for its publicly available data when using ONRR MRMSS revenue data. ONRR provided underlying tables for creating the variables presented in its publications. The revenue data we received from ONRR reflect the amount operators reported to ONRR MRMSS and not the amount that the federal government collected. The variable revenue type also includes a category for other revenues. The commodity category for gas includes natural gas and natural gas liquids.
11For more information on our linking process, please see app. I.

Page 4 GAO-21-138 Oil and Gas Leasing
We limited our scope to federal onshore oil and gas leases and the revenues they produced from fiscal years 2003 through 2019.12 We further restricted our analysis to competitive and noncompetitive leases.13 With this scope, we reviewed leases that started in December 1986 through September 2019, and we reviewed revenues for fiscal years 2003 through 2019. As a result, we cannot report all revenue data for all leases. To compare how leases performed in terms of revenue, we further restricted our subsequent analyses to primary-term revenues for leases that started in fiscal years 2003 through 2009.14 To describe the relationship between bonus bids and primary-term revenues, we calculated bonus bid per acre by dividing each lease’s bonus bid revenue by its acreage.15 We then grouped competitive leases into four categories based on leases that had bonus bids per acre that were equal to $2, greater than $2 to $20, greater than $20 to $100, and greater than $100.16 We compared total primary-term rents, royalties, and bonus bid amounts for each competitive lease bonus bid group and noncompetitive
12We limited our analysis to revenues reported for fiscal years 2003 through 2019 because we determined that ONRR MRMSS data were reliable for that time frame. We considered LR2000 leases with case type codes listed in BLM’s Desk Reference Guide to be federal onshore oil and gas leases. We identified ONRR revenues for federal onshore oil and gas leases based on information in MRMSS about mineral type (oil and gas leases), land class (federal), and land category (onshore). In addition, we restricted revenues to oil, gas, and natural gas liquids. We also excluded leases in Alaska, since BLM does not record these leases in LR2000.
13Our analysis included 72,746 competitive and 27,535 noncompetitive leases and excluded 209,989 leases we defined as other. The majority (about 93 percent) of leases in the category of other included leases sold through processes that predate the 1987 Reform Act. Our other lease category also included renewal and exchange leases; private leases acquired with federal land acquisition; and leases sold through Special Acts, such as rights of way, units of the National Parks System, General Service Administration surplus lands, and Naval oil shale reserves. Since we focused on leases sold through the 1987 Reform Act process, our report defines competitive and noncompetitive leases more narrowly than BLM.
14We defined the lease primary term as a 10-year period following a lease start date, calculated based on the lease effective (start) date from LR2000 and either the date products were sold (royalties) or the date revenues were recorded in MRMSS (rents and bonus bids).
15We rounded up acreage to the next-highest integer to reflect BLM lease sale bidding rules for minimum bids, and bid increments.
16To create a bonus bid distribution, we rank-ordered competitive leases that started from fiscal years 2003 through 2009 by the bonus bid per acre amount and then broke them into four roughly even groups, or quartiles. Noncompetitive leases had a similar frequency as the categories of bonus bid amounts for competitive leases.

Page 5 GAO-21-138 Oil and Gas Leasing
leases. In addition, we calculated metrics on the likelihood, timing, and amount of royalties during each lease’s primary term.
We assessed the reliability of BLM’s LR2000 data and ONRR MRMSS data by (1) performing electronic testing, (2) reviewing existing information about the data and the system that produced them, and (3) interviewing agency officials knowledgeable about the data. We determined that the data were sufficiently reliable for the purposes of this report. We also interviewed four experts who are academics and former government employees who are knowledgeable about federal oil and gas leasing. We interviewed these experts to obtain supplemental information on federal oil and gas leasing, specifically any differences between the competitive and noncompetitive leasing process and resulting revenues. We identified potential experts based on two literature searches and through recommendations from experts we initially contacted. We selected the experts based on their experience working with lease-level BLM and ONRR data, their published work related to federal onshore oil and gas leasing, and time and resource considerations. We may not have identified all experts or researchers with a view on this topic or who have done work in this area, and the views of the experts we spoke with cannot be generalized to experts we did not interview. A more detailed discussion of our scope and methodology is presented in appendix I.
We conducted this performance audit from June 2018 to November 2020, in accordance with generally accepted government auditing standards. Those standards require that we plan and perform the audit to obtain sufficient, appropriate evidence to provide a reasonable basis for our findings and conclusions based on our audit objectives. We believe that the evidence obtained provides a reasonable basis for our findings and conclusions based on our audit objectives.
BLM and ONRR each have responsibilities for managing federal oil and gas leases and the revenues generated by these leases. BLM is responsible for managing the federal government’s oil and gas program, including lease sales and collecting initial revenue from those sales. ONRR manages the collection and disbursement of remaining revenues
Background Federal Responsibilities for Oil and Gas Leasing and Associated Revenues

Page 6 GAO-21-138 Oil and Gas Leasing
associated with leased oil and gas parcels, including bonus bids, rents, and royalties.17
BLM and ONRR have responsibilities for collecting, maintaining, and reporting data on federal oil and gas leases. Specifically, BLM collects information on the administration of leases, and ONRR collects information on revenues generated by these leases, as follows:
• BLM records information in its LR2000 database on leases in effect, as well as leases that closed after 1988, according to BLM officials. LR2000 contains information on lease locations, lease start dates, lessees, and whether leases are competitive or noncompetitive, among other things. BLM also publicly reports statistics on the number of parcels of land and total acres leased each year, as well as the total number of leases and total acreage for competitive and noncompetitive leased parcels.
• ONRR collects and maintains revenue data for oil and gas leases in MRMSS. ONRR maintains all royalty and nonroyalty revenue—including bonus bids, rents, and administrative fees—in ONRR MRMSS. ONRR also publicly reports summary statistics on bonus bids, rents, royalties, and other revenues, such as fees, which ONRR officials told us were based on the data maintained in ONRR MRMSS.
The 1987 Reform Act changed BLM’s processes for issuing and administering competitive and noncompetitive leases to develop oil and gas on federal lands.18 Prior to the 1987 Reform Act, the Mineral Leasing Act of 1920, as amended, required BLM to evaluate federal lands based on their potential for producing oil and gas. When BLM determined that lands were within known geologic structures indicative of potential oil and gas resources, the Mineral Leasing Act required BLM to auction such
17In 2010, Interior created ONRR as part of a reorganization.
18In addition to the leasing process we describe, there are other processes under the Mineral Leasing Act of 1920 for specific categories of onshore leasing of federal lands and minerals, such as for oil shale. These other processes are outside the scope of our review.
BLM Processes for Issuing Leases for Oil and Gas Development on Federal Lands

Page 7 GAO-21-138 Oil and Gas Leasing
lands competitively to the highest bidder.19 BLM currently follows a process whereby industry representatives and other members of the public submit expressions of interest to nominate parcels of land they wish to be considered for competitive sale through public auctions. In auctions held by BLM state offices, BLM may offer for sale nominated parcels that meet established criteria, such as those having been deemed eligible in the process of an environmental review.20 In these auctions, federal land parcels are first offered for competitive lease. If BLM receives a bid that is at or above the statutorily established minimum acceptable bid amount of $2 an acre, BLM awards the lease to the highest bidder.21 Parcels of land that do not receive an adequate bid at auction are made available noncompetitively the next business day, for a period of 2 years, on a first-come, first-served basis.22
Operators that obtain either competitive or noncompetitive leases are granted exclusive rights to explore, develop, produce, and sell oil and gas from leased lands, and the federal government collects revenues, under specified terms and conditions for the lease. (See fig. 1.) In addition to
19Prior to the 1987 Reform Act, BLM compared the highest sealed bid for each lease to its own minimum acceptable bid, which BLM calculated for each lease based on a variety of economic variables, including the expected amount of oil and gas in the area. If the highest bid equaled or exceeded BLM’s minimum acceptable bid, BLM issued the lease; if not, BLM rejected the bid and could reoffer the lease in a subsequent competitive lease sale. For federal lands that the agency determined were not within a known geologic structure, BLM leased these lands noncompetitively. According to our prior work, before the 1987 Reform Act, more than 95 percent of onshore leases were issued noncompetitively. See GAO, Mineral Revenues: Implementation of the Federal Onshore Oil and Gas Leasing Reform Act of 1987, GAO/RCED-89-108 (Washington, D.C.: May 8, 1989).
20BLM has 12 state offices that oversee oil and gas leasing on federal onshore lands. These state offices are Alaska, Arizona, California, Colorado, Eastern States, Idaho, Montana-Dakotas, Nevada, New Mexico, Oregon-Washington, Utah, and Wyoming. For the purposes of our review, we did not include information on leasing in Alaska because, according to BLM officials, the BLM Alaska state office conducts leasing in a different manner than other BLM state offices.
21The minimum bonus bid is a floor set by statute, as are other lease terms, such as the rental rate, which BLM can increase by promulgating a regulation.
2243 C.F.R. § 3110.1(b); 43 C.F.R. § 3110.2. For parcels made available for noncompetitive leasing, the parcel must maintain parcel integrity (i.e., the exact acreage and configuration beginning the first business day following the end of an auction and continuing through the remainder of that same month). After the parcel integrity time period, operators may make a noncompetitive lease offer on all or part of the parcel or may make an offer that combines multiple parcels into a single noncompetitive lease if the lease offer meets regulatory requirements for parcel size and description.
Page 8 GAO-21-138 Oil and Gas Leasing
collecting the highest bonus bid for competitive leases sold at auction, the government also collects annual rents, royalties, and administrative fees:
• Rents. Operators pay rent annually at a fixed rate until production begins on the leased land or, if no production occurs, until the end of the period specified in the lease. For federal onshore oil and gas leases, the rental rate is generally $1.50 per acre for the first 5 years and $2 per acre each year thereafter.23
• Royalties. Once production of oil or gas in paying quantities starts on a lease, operators pay the federal government royalties of at least 12.5 percent of the net value of production removed or sold from the lease minus allowable deductions for the transportation costs of oil or gas or processing costs for gas.24 Oil and gas parcels are generally leased for a primary term of 10 years, but lease terms may be extended if, for example, the lease is producing oil or gas, among other reasons.
• Administrative fees. Operators pay a one-time administrative fee for both competitive and noncompetitive leases.
2343 C.F.R. § 3103.2-2(a).
24Until January 2017, BLM regulations generally established a fixed royalty rate of 12.5 percent. BLM, “Minerals Management; General Oil and Gas Leasing; Noncompetitive Leases: Competitive Leases: Oil and Gas Leasing—National Petroleum Reserve—Alaska: Onshore Oil and Gas Operations: Onshore Oil and Gas Unit Agreements—Unproven Areas: Geothermal Resources Leasing; General: Geothermal Resources Unit Agreements—Unproven Areas; final rule,” 53 Fed. Reg. 22814, 22838 (June 17, 1988) (revised § 3103.3-1). In November 2016, BLM issued regulations amending this section to mirror BLM’s statutory authority for competitive leases, providing BLM with the flexibility to set royalty rates at or above 12.5 percent. This rule became effective in January 2017. Department of the Interior, Bureau of Land Management, Waste Prevention, Production Subject to Royalties, and Resource Conservation, Final Rule, 81 Fed. Reg. 83008 (Nov. 18, 2016). The portion of the 2016 rule that addresses the royalty rate authority is outside the scope of the 2018 rescission or revision rule and outside the litigation over that 2018 rule. The spring 2020 BLM emergency guidance related to COVID-19 states that royalty rates may be temporarily reduced to no lower than 0.5 percent.

Page 9 GAO-21-138 Oil and Gas Leasing
Figure 1: Process for Federal Oil and Gas Leases and Associated Revenues
According to BLM data, by the end of fiscal year 2019, BLM had sold 310,270 federal oil and gas leases that totaled about 324 million acres across 40 states.25 Of the 310,270 leases, 72,746 were competitive, and 25The number of leases include all federal oil and gas leases historically in LR2000, including other leases that for purposes of this report we do not define as competitive or noncompetitive. According to BLM officials, BLM underwent an automation effort in the 1980s and entered information on all leases that were active at the time into the newly created LR2000 database. According to officials, oil and gas leases that were closed prior to 1984 were not added and are not captured in LR2000.
Page 10 GAO-21-138 Oil and Gas Leasing
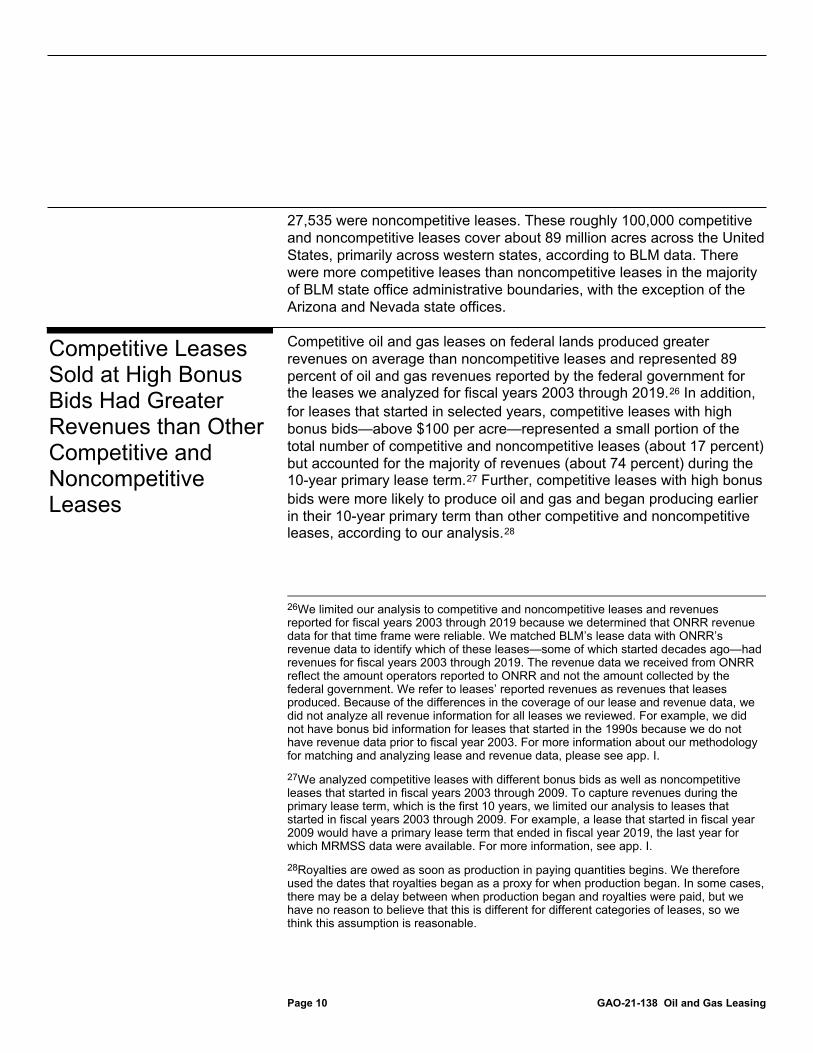
27,535 were noncompetitive leases. These roughly 100,000 competitive and noncompetitive leases cover about 89 million acres across the United States, primarily across western states, according to BLM data. There were more competitive leases than noncompetitive leases in the majority of BLM state office administrative boundaries, with the exception of the Arizona and Nevada state offices.
Competitive oil and gas leases on federal lands produced greater revenues on average than noncompetitive leases and represented 89 percent of oil and gas revenues reported by the federal government for the leases we analyzed for fiscal years 2003 through 2019.26 In addition, for leases that started in selected years, competitive leases with high bonus bids—above $100 per acre—represented a small portion of the total number of competitive and noncompetitive leases (about 17 percent) but accounted for the majority of revenues (about 74 percent) during the 10-year primary lease term.27 Further, competitive leases with high bonus bids were more likely to produce oil and gas and began producing earlier in their 10-year primary term than other competitive and noncompetitive leases, according to our analysis.28
26We limited our analysis to competitive and noncompetitive leases and revenues reported for fiscal years 2003 through 2019 because we determined that ONRR revenue data for that time frame were reliable. We matched BLM’s lease data with ONRR’s revenue data to identify which of these leases—some of which started decades ago—had revenues for fiscal years 2003 through 2019. The revenue data we received from ONRR reflect the amount operators reported to ONRR and not the amount collected by the federal government. We refer to leases’ reported revenues as revenues that leases produced. Because of the differences in the coverage of our lease and revenue data, we did not analyze all revenue information for all leases we reviewed. For example, we did not have bonus bid information for leases that started in the 1990s because we do not have revenue data prior to fiscal year 2003. For more information about our methodology for matching and analyzing lease and revenue data, please see app. I.
27We analyzed competitive leases with different bonus bids as well as noncompetitive leases that started in fiscal years 2003 through 2009. To capture revenues during the primary lease term, which is the first 10 years, we limited our analysis to leases that started in fiscal years 2003 through 2009. For example, a lease that started in fiscal year 2009 would have a primary lease term that ended in fiscal year 2019, the last year for which MRMSS data were available. For more information, see app. I.
28Royalties are owed as soon as production in paying quantities begins. We therefore used the dates that royalties began as a proxy for when production began. In some cases, there may be a delay between when production began and royalties were paid, but we have no reason to believe that this is different for different categories of leases, so we think this assumption is reasonable.
Competitive Leases Sold at High Bonus Bids Had Greater Revenues than Other Competitive and Noncompetitive Leases
Page 11 GAO-21-138 Oil and Gas Leasing
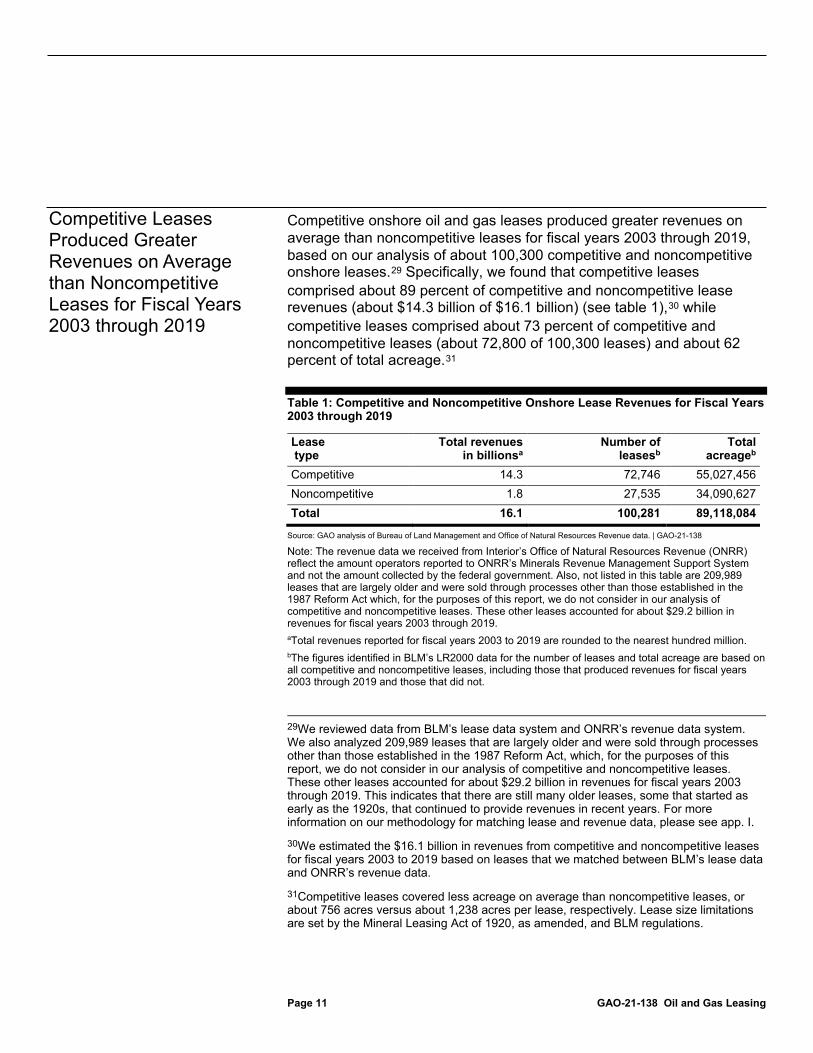
Competitive onshore oil and gas leases produced greater revenues on average than noncompetitive leases for fiscal years 2003 through 2019, based on our analysis of about 100,300 competitive and noncompetitive onshore leases.29 Specifically, we found that competitive leases comprised about 89 percent of competitive and noncompetitive lease revenues (about $14.3 billion of $16.1 billion) (see table 1),30 while competitive leases comprised about 73 percent of competitive and noncompetitive leases (about 72,800 of 100,300 leases) and about 62 percent of total acreage.31
Table 1: Competitive and Noncompetitive Onshore Lease Revenues for Fiscal Years 2003 through 2019
Lease type
Total revenues in billionsa
Number of leasesb
Total acreageb
Competitive 14.3 72,746 55,027,456 Noncompetitive 1.8 27,535 34,090,627 Total 16.1 100,281 89,118,084
Source: GAO analysis of Bureau of Land Management and Office of Natural Resources Revenue data. | GAO-21-138
Note: The revenue data we received from Interior’s Office of Natural Resources Revenue (ONRR) reflect the amount operators reported to ONRR’s Minerals Revenue Management Support System and not the amount collected by the federal government. Also, not listed in this table are 209,989 leases that are largely older and were sold through processes other than those established in the 1987 Reform Act which, for the purposes of this report, we do not consider in our analysis of competitive and noncompetitive leases. These other leases accounted for about $29.2 billion in revenues for fiscal years 2003 through 2019. aTotal revenues reported for fiscal years 2003 to 2019 are rounded to the nearest hundred million. bThe figures identified in BLM’s LR2000 data for the number of leases and total acreage are based on all competitive and noncompetitive leases, including those that produced revenues for fiscal years 2003 through 2019 and those that did not.
29We reviewed data from BLM’s lease data system and ONRR’s revenue data system. We also analyzed 209,989 leases that are largely older and were sold through processes other than those established in the 1987 Reform Act, which, for the purposes of this report, we do not consider in our analysis of competitive and noncompetitive leases. These other leases accounted for about $29.2 billion in revenues for fiscal years 2003 through 2019. This indicates that there are still many older leases, some that started as early as the 1920s, that continued to provide revenues in recent years. For more information on our methodology for matching lease and revenue data, please see app. I.
30We estimated the $16.1 billion in revenues from competitive and noncompetitive leases for fiscal years 2003 to 2019 based on leases that we matched between BLM’s lease data and ONRR’s revenue data.
31Competitive leases covered less acreage on average than noncompetitive leases, or about 756 acres versus about 1,238 acres per lease, respectively. Lease size limitations are set by the Mineral Leasing Act of 1920, as amended, and BLM regulations.
Competitive Leases Produced Greater Revenues on Average than Noncompetitive Leases for Fiscal Years 2003 through 2019
Page 12 GAO-21-138 Oil and Gas Leasing
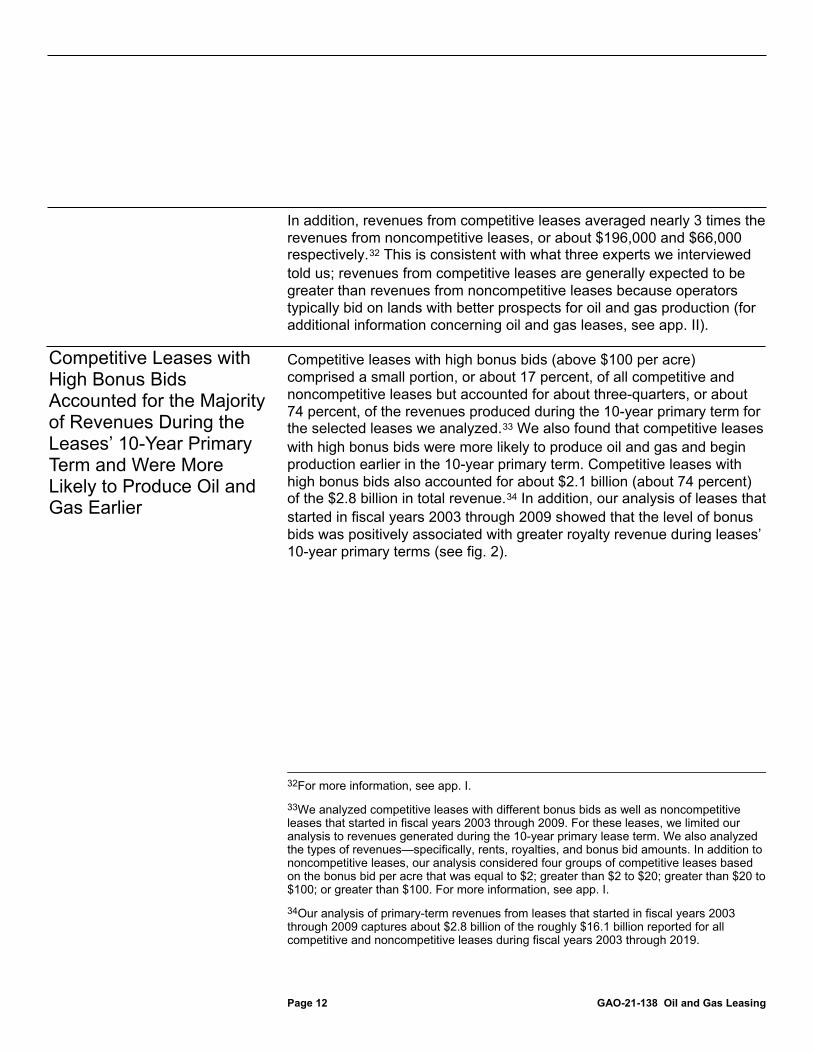
In addition, revenues from competitive leases averaged nearly 3 times the revenues from noncompetitive leases, or about $196,000 and $66,000 respectively.32 This is consistent with what three experts we interviewed told us; revenues from competitive leases are generally expected to be greater than revenues from noncompetitive leases because operators typically bid on lands with better prospects for oil and gas production (for additional information concerning oil and gas leases, see app. II).
Competitive leases with high bonus bids (above $100 per acre) comprised a small portion, or about 17 percent, of all competitive and noncompetitive leases but accounted for about three-quarters, or about 74 percent, of the revenues produced during the 10-year primary term for the selected leases we analyzed.33 We also found that competitive leases with high bonus bids were more likely to produce oil and gas and begin production earlier in the 10-year primary term. Competitive leases with high bonus bids also accounted for about $2.1 billion (about 74 percent) of the $2.8 billion in total revenue.34 In addition, our analysis of leases that started in fiscal years 2003 through 2009 showed that the level of bonus bids was positively associated with greater royalty revenue during leases’ 10-year primary terms (see fig. 2).
32For more information, see app. I.
33We analyzed competitive leases with different bonus bids as well as noncompetitive leases that started in fiscal years 2003 through 2009. For these leases, we limited our analysis to revenues generated during the 10-year primary lease term. We also analyzed the types of revenues—specifically, rents, royalties, and bonus bid amounts. In addition to noncompetitive leases, our analysis considered four groups of competitive leases based on the bonus bid per acre that was equal to $2; greater than $2 to $20; greater than $20 to $100; or greater than $100. For more information, see app. I.
34Our analysis of primary-term revenues from leases that started in fiscal years 2003 through 2009 captures about $2.8 billion of the roughly $16.1 billion reported for all competitive and noncompetitive leases during fiscal years 2003 through 2019.
Competitive Leases with High Bonus Bids Accounted for the Majority of Revenues During the Leases’ 10-Year Primary Term and Were More Likely to Produce Oil and Gas Earlier
Page 13 GAO-21-138 Oil and Gas Leasing
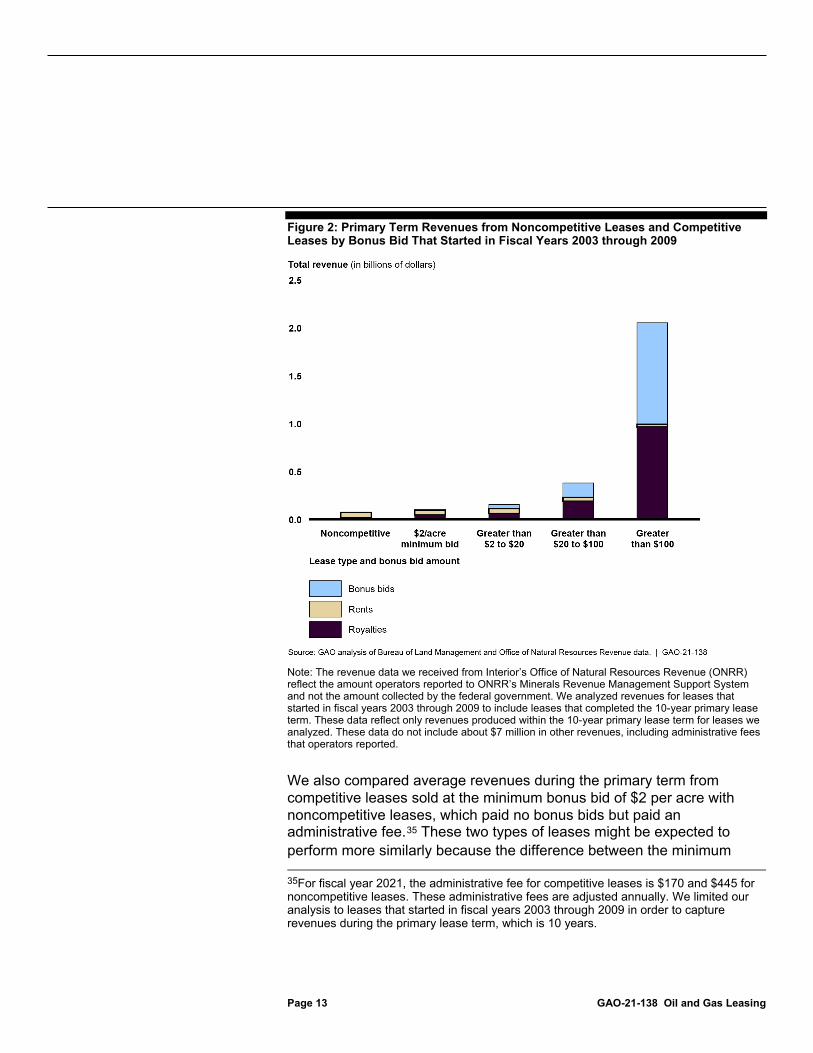
Figure 2: Primary Term Revenues from Noncompetitive Leases and Competitive Leases by Bonus Bid That Started in Fiscal Years 2003 through 2009
Note: The revenue data we received from Interior’s Office of Natural Resources Revenue (ONRR) reflect the amount operators reported to ONRR’s Minerals Revenue Management Support System and not the amount collected by the federal government. We analyzed revenues for leases that started in fiscal years 2003 through 2009 to include leases that completed the 10-year primary lease term. These data reflect only revenues produced within the 10-year primary lease term for leases we analyzed. These data do not include about $7 million in other revenues, including administrative fees that operators reported.
We also compared average revenues during the primary term from competitive leases sold at the minimum bonus bid of $2 per acre with noncompetitive leases, which paid no bonus bids but paid an administrative fee.35 These two types of leases might be expected to perform more similarly because the difference between the minimum 35For fiscal year 2021, the administrative fee for competitive leases is $170 and $445 for noncompetitive leases. These administrative fees are adjusted annually. We limited our analysis to leases that started in fiscal years 2003 through 2009 in order to capture revenues during the primary lease term, which is 10 years.
Page 14 GAO-21-138 Oil and Gas Leasing
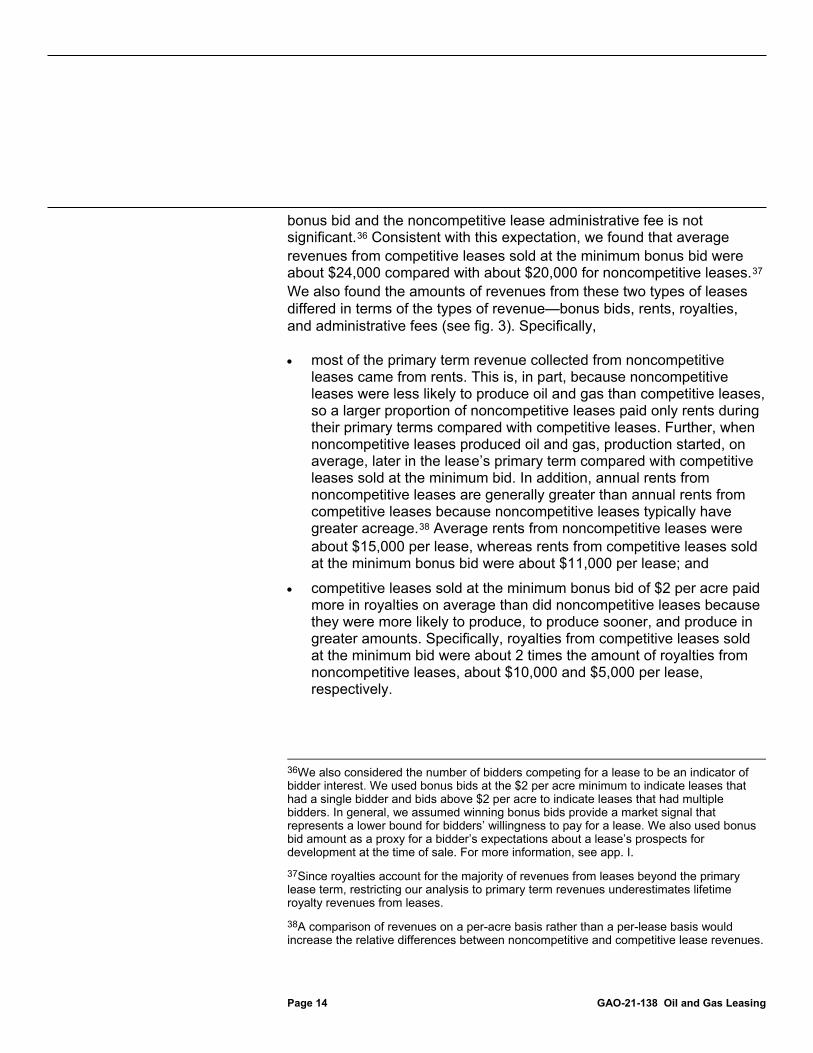
bonus bid and the noncompetitive lease administrative fee is not significant.36 Consistent with this expectation, we found that average revenues from competitive leases sold at the minimum bonus bid were about $24,000 compared with about $20,000 for noncompetitive leases.37 We also found the amounts of revenues from these two types of leases differed in terms of the types of revenue—bonus bids, rents, royalties, and administrative fees (see fig. 3). Specifically,
• most of the primary term revenue collected from noncompetitive leases came from rents. This is, in part, because noncompetitive leases were less likely to produce oil and gas than competitive leases, so a larger proportion of noncompetitive leases paid only rents during their primary terms compared with competitive leases. Further, when noncompetitive leases produced oil and gas, production started, on average, later in the lease’s primary term compared with competitive leases sold at the minimum bid. In addition, annual rents from noncompetitive leases are generally greater than annual rents from competitive leases because noncompetitive leases typically have greater acreage.38 Average rents from noncompetitive leases were about $15,000 per lease, whereas rents from competitive leases sold at the minimum bonus bid were about $11,000 per lease; and
• competitive leases sold at the minimum bonus bid of $2 per acre paid more in royalties on average than did noncompetitive leases because they were more likely to produce, to produce sooner, and produce in greater amounts. Specifically, royalties from competitive leases sold at the minimum bid were about 2 times the amount of royalties from noncompetitive leases, about $10,000 and $5,000 per lease, respectively.
36We also considered the number of bidders competing for a lease to be an indicator of bidder interest. We used bonus bids at the $2 per acre minimum to indicate leases that had a single bidder and bids above $2 per acre to indicate leases that had multiple bidders. In general, we assumed winning bonus bids provide a market signal that represents a lower bound for bidders’ willingness to pay for a lease. We also used bonus bid amount as a proxy for a bidder’s expectations about a lease’s prospects for development at the time of sale. For more information, see app. I.
37Since royalties account for the majority of revenues from leases beyond the primary lease term, restricting our analysis to primary term revenues underestimates lifetime royalty revenues from leases.
38A comparison of revenues on a per-acre basis rather than a per-lease basis would increase the relative differences between noncompetitive and competitive lease revenues.

Page 15 GAO-21-138 Oil and Gas Leasing
Figure 3: Average Primary Term Revenues from Noncompetitive Leases and Competitive Leases Sold at the Minimum Bonus Bid That Started in Fiscal Years 2003 through 2009
Note: The revenue data we received from Interior’s Office of Natural Resources Revenue (ONRR) reflect the amount operators reported to ONRR’s Minerals Revenue Management Support System and not the amount collected by the federal government. We analyzed revenues for leases that started in fiscal years 2003 through 2009 to include leases that completed the 10-year primary lease term. These data reflect only revenues produced within the 10-year primary lease term for leases we analyzed. In addition to the revenues we report here, there is a one-time administrative fee of $445 for noncompetitive leases and $170 for competitive leases for fiscal year 2021.
Overall, the vast majority of competitive and noncompetitive leases we reviewed did not produce oil and gas in their primary term. Specifically, we found that only about 7 percent of all leases we reviewed produced oil and gas in their primary terms. The likelihood of producing oil and gas in the primary term varied in terms of the size of the bonus bid, with leases with higher bonus bids being more likely to produce than leases with lower bonus bids, and all competitive leases being more likely to produce than noncompetitive leases. Similarly, competitive leases with high bonus bids (i.e., greater than $100 per acre) produced more and therefore generated more royalties earlier in their primary term than did leases with
Page 16 GAO-21-138 Oil and Gas Leasing
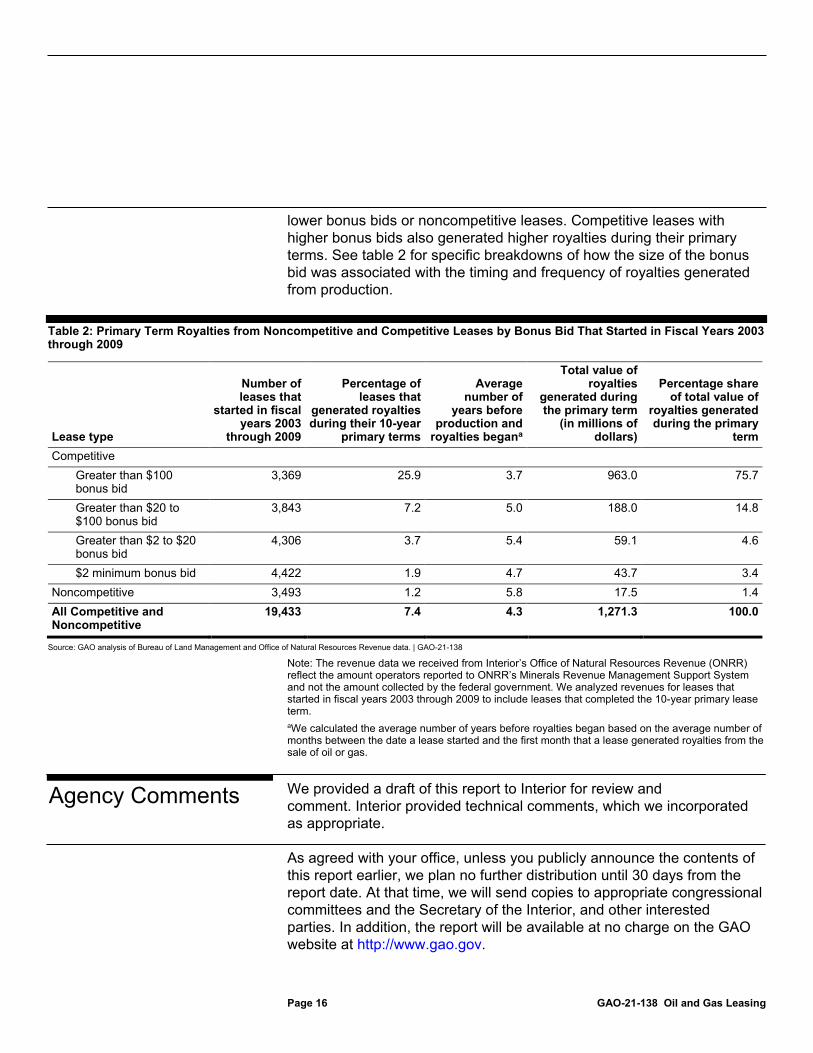
lower bonus bids or noncompetitive leases. Competitive leases with higher bonus bids also generated higher royalties during their primary terms. See table 2 for specific breakdowns of how the size of the bonus bid was associated with the timing and frequency of royalties generated from production.
Table 2: Primary Term Royalties from Noncompetitive and Competitive Leases by Bonus Bid That Started in Fiscal Years 2003 through 2009
Lease type
Number of leases that
started in fiscal years 2003
through 2009
Percentage of leases that
generated royalties during their 10-year
primary terms
Average number of
years before production and
royalties begana
Total value of royalties
generated during the primary term
(in millions of dollars)
Percentage share of total value of
royalties generated during the primary
term Competitive
Greater than $100 bonus bid
3,369 25.9 3.7 963.0 75.7
Greater than $20 to $100 bonus bid
3,843 7.2 5.0 188.0 14.8
Greater than $2 to $20 bonus bid
4,306 3.7 5.4 59.1 4.6
$2 minimum bonus bid 4,422 1.9 4.7 43.7 3.4 Noncompetitive 3,493 1.2 5.8 17.5 1.4 All Competitive and Noncompetitive
19,433 7.4 4.3 1,271.3 100.0
Source: GAO analysis of Bureau of Land Management and Office of Natural Resources Revenue data. | GAO-21-138
Note: The revenue data we received from Interior’s Office of Natural Resources Revenue (ONRR) reflect the amount operators reported to ONRR’s Minerals Revenue Management Support System and not the amount collected by the federal government. We analyzed revenues for leases that started in fiscal years 2003 through 2009 to include leases that completed the 10-year primary lease term. aWe calculated the average number of years before royalties began based on the average number of months between the date a lease started and the first month that a lease generated royalties from the sale of oil or gas.
We provided a draft of this report to Interior for review and comment. Interior provided technical comments, which we incorporated as appropriate.
As agreed with your office, unless you publicly announce the contents of this report earlier, we plan no further distribution until 30 days from the report date. At that time, we will send copies to appropriate congressional committees and the Secretary of the Interior, and other interested parties. In addition, the report will be available at no charge on the GAO website at http://www.gao.gov.
Agency Comments

Page 17 GAO-21-138 Oil and Gas Leasing
If you or your staff have any questions about this report, please contact me at (202) 512-3841 or [email protected]. Contact points for our Offices of Congressional Relations and Public Affairs may be found on the last page of this report. GAO staff who made key contributions to this report are listed in appendix III.
Frank Rusco Director, Natural Resources and Environment
Appendix I: Objectives, Scope, and Methodology
Page 18 GAO-21-138 Oil and Gas Leasing
This report describes revenues from competitive and noncompetitive leases for fiscal years 2003 through 2019. We obtained lease data from the Department of the Interior’s (Interior) Bureau of Land Management’s (BLM) database for mineral and land use—Legacy Rehost System 2000 (LR2000)—and revenue data from Interior’s Office of Natural Resources Revenue’s (ONRR) Minerals Revenue Management Support System (MRMSS). LR2000 contains information on lease characteristics, such as lease acreage, lease effective (or start) dates, and lease case types (i.e., lease types). To identify competitive and noncompetitive leases, we used LR2000 case types to classify groups of leases sold through the Federal Onshore Oil and Gas Leasing Reform Act of 1987 (1987 Reform Act) process.1 MRMSS contains information on revenue amounts, revenue types (e.g., royalties, rents, and bonus bids), commodities produced (e.g., oil and gas), and the dates operators reported revenues and sold products that generated royalties.2 To prepare MRMSS revenue data for analysis, we standardized information to combine revenues reported in two different data sets: the ONRR-2014 and ONRR Direct Billed data. We then aggregated the revenues to a unit of analysis defined by lease, month, revenue type, and commodity.
1We used BLM’s Oil and Gas LR2000 Desk Reference Guide to classify leases as competitive or noncompetitive based on post-1987 Reform Act case type codes. We classified the remaining leases in BLM’s Desk Reference Guide as “other.” While competitive and noncompetitive leases existed before 1987, the 1987 Reform Act changed how BLM offered those lease types for sale. For the purposes of this report, we limit our definition of competitive and noncompetitive leases to those that were sold through the 1987 Reform Act process.
2Where possible, we relied on ONRR’s variable definitions that it uses for its publicly available data when using ONRR MRMSS revenue data. ONRR provided underlying tables for creating the variables presented in its publications. The revenue data we received from ONRR reflect the amount operators reported to ONRR MRMSS and not the amount collected by the federal government. The variable revenue type also includes a category for other revenues. The commodity category for gas includes natural gas and natural gas liquids.
Appendix I: Objectives, Scope, and Methodology

Appendix I: Objectives, Scope, and Methodology
Page 19 GAO-21-138 Oil and Gas Leasing
To link information on lease characteristics to revenues, we developed a method to match leases in LR2000 and MRMSS data.3 Specifically, we used LR2000 data to construct a common lease number and matched about 98 percent of leases in ONRR’s revenue data to leases in BLM’s data.4 Once we combined LR2000 and MRMSS data, we used information on bonus bid revenues and lease acreage to identify competitive leases by bonus bid amounts, including leases that were sold at the minimum bonus bid of $2 per acre.
For the purposes of this report, we limited our scope to federal onshore oil and gas leases and the revenues they produced from fiscal years 2003 through 2019.5 We further restricted our analysis to competitive and
3We developed our own method to match leases in LR2000 and MRMSS data because BLM and ONRR do not comprehensively link LR2000 and MRMSS data. Linking the data was possible because ONRR MRMSS contains a version of BLM’s lease number entered with different formatting conventions than BLM’s LR2000 lease number. To develop a common lease number, we identified five LR2000 variables—geographic state, BLM state office, numeric prefix, serial number, and an alphanumeric suffix—that represented the core elements of information contained in BLM’s lease numbers. To ensure consistent formatting with MRMSS lease numbers, we deleted any blank spaces from all five LR2000 variables and removed leading zeros. Then, we combined the five adjusted LR2000 variables into a standardized lease number and merged leases in LR2000 and MRMSS using the BLM lease number from MRMSS.
4The matched leases accounted for over 99 percent of total revenues in MRMSS for federal onshore oil and gas leases. In addition, our definition of competitive and noncompetitive leases may not capture all lease types that went through the competitive leasing process. However, our matching was able to capture over 99 percent of revenues, and our conservative definition of competitive and noncompetitive leases captures most relevant leases for the purpose of our analysis.
5We limited our analysis to revenues reported for fiscal years 2003 through 2019 because we determined that ONRR MRMSS data were reliable for that time frame. We considered LR2000 leases with case type codes listed in BLM’s Desk Reference Guide to be federal onshore oil and gas leases. We identified ONRR revenues for federal onshore oil and gas leases based on information in MRMSS about mineral type (oil and gas leases), land class (federal), and land category (onshore). In addition, we restricted revenues to oil, gas, and natural gas liquids. We also excluded leases in Alaska, since BLM does not record these leases in LR2000.
Appendix I: Objectives, Scope, and Methodology
Page 20 GAO-21-138 Oil and Gas Leasing
noncompetitive leases.6 With this scope, we reviewed leases that started in December 1986 through September 2019, and we reviewed revenues for fiscal years 2003 through 2019. As a result, we cannot report all revenue data for all leases.
To describe total revenues for competitive and noncompetitive leases, we added all revenues for fiscal years 2003 through 2019 from our matched data.7 To describe the total number of leases and total acreage, we included all competitive and noncompetitive oil and gas leases in LR2000 data. To adjust competitive and noncompetitive revenues based on the number of leases, we calculated the average revenue per lease by dividing total revenues for fiscal years 2003 through 2019 in ONRR MRMSS by the total number of leases in BLM’s LR2000.8 Differences in the average revenue per lease among all competitive and noncompetitive leases do not suggest the difference in performance of leases, since we do not account for factors affecting the revenues from a lease, such as differences in geology or market conditions when leases started.
To compare how leases performed in terms of revenue, we further restricted our subsequent analyses to primary-term revenues for leases
6Our analysis included 72,746 competitive and 27,535 noncompetitive leases and excluded 209,989 leases we defined as “other.” The majority (about 93 percent) of our other lease category included leases sold through processes that predate the 1987 Reform Act. Our other lease category also included renewal and exchange leases; private leases acquired with federal land acquisition; and leases sold through Special Acts, such as rights of way, units of the National Parks System, General Service Administration surplus lands, and Naval oil shale reserves. Since we focused on leases sold through the 1987 Reform Act process, our report defines competitive and noncompetitive leases more narrowly than BLM.
7We assigned revenues to fiscal years based on the date the revenues were posted in ONRR MRMSS data to be consistent with ONRR’s public reporting of revenue data. Our analysis includes revenues from October 1, 2002, through September 30, 2019.
8ONRR MRMSS contained revenue data for fiscal years 2003 through 2019, so we were not able to report the full history of revenues for many older leases in BLM’s LR2000 that may have produced revenues in earlier years. We use average revenues per lease to compare revenues. However, another reasonable metric is average revenues per acre. Since noncompetitive leases typically have greater acreage than noncompetitive leases, a comparison of revenues on a per-acre basis would increase the relative differences between noncompetitive and competitive lease revenues.

Appendix I: Objectives, Scope, and Methodology
Page 21 GAO-21-138 Oil and Gas Leasing
that started in fiscal years 2003 through 2009.9 By using only revenues that occurred within the first 10 years, we were able to consistently compare leases over their lifecycle and capture all types of lease revenue, including rents, bonus bids, and royalties.10 Also, limiting our analysis to the first 10 years of revenue allowed us to analyze production during the primary lease term, which is an indicator that a lease may generate revenues beyond its primary term.
To describe the relationship between bonus bids and primary-term revenues, we calculated bonus bid per acre by dividing each lease’s bonus bid revenue by its acreage.11 We then grouped competitive leases into four categories based on leases that had bonus bids per acre that were equal to $2, greater than $2 to $20, greater than $20 to $100, and greater than $100.12 We compared total primary-term rents, royalties, and bonus bid amounts for each competitive lease bonus bid group and noncompetitive leases.
To address potential selection bias from lease sales, we compared the average revenue per lease for competitive leases sold at the $2 per acre minimum bid with those of noncompetitive leases. Selection bias could arise if leases with higher expectations of generating revenues generally attract more bids than those with lower expectations of generating
9We defined the lease primary term as a 10-year period following a lease start date, calculated based on the lease effective (start) date from LR2000 and either the date products were sold (royalties) or the date revenues were recorded in MRMSS (rents and bonus bids).
10Our data capture the first 10 years of revenue data posted after the lease started. Since ONRR allows operators to revise reported revenues for a 6-year period, it is possible that the revenue we report may be updated for some leases starting in later years. However, for leases starting in fiscal year 2003, we are confident that our data capture all royalties based on products sold between fiscal years 2003 through 2013, since our data include any updated royalties posted through fiscal year 2019, which captures the full 6-year revision period following the lease primary term.
11We rounded up acreage to the next-highest integer to reflect BLM lease sale bidding rules for minimum bids, and bid increments.
12To create a bonus bid distribution, we rank-ordered competitive leases that started from fiscal years 2003 through 2009 by the bonus bid per acre amount and then broke them into four roughly even groups, or quartiles. Noncompetitive leases had a similar frequency as the categories of bonus bid amounts for competitive leases.

Appendix I: Objectives, Scope, and Methodology
Page 22 GAO-21-138 Oil and Gas Leasing
revenue.13 Competitive leases sold at the $2 per acre minimum bid only received one bid, so we assumed their expectations of generating income were similar to noncompetitive leases that do not receive an adequate bid.14
Since royalties account for a majority of revenues from leases beyond the lease primary term, restricting our analysis to primary-term revenues underestimates the lifetime royalty revenue from leases. We therefore focused additional analysis on indicators of production.15 Specifically, we calculated metrics on the likelihood, timing, and amount of royalties during each lease’s primary term. For each bonus bid per acre group, we calculated the percentage of leases that produced royalties, total royalty revenues, and each group’s share of royalty revenues. Moreover, for leases that had royalties in the primary term, we calculated the average number of months until royalties began. To illustrate royalties generated over time, we graphed cumulative royalties for each bonus bid group by month from the start of the lease through the end of the primary term.
Our results should be interpreted in the context of some limitations. There are many factors that may influence bonus bids and royalties from leases, such as differences in geology, commodity prices, technological changes, and changes in other economic circumstances at the time of auction or during the lease term. We addressed some of these factors indirectly by 13For example, lands expected to have greater prospects for production may attract more bids and generate greater revenues from royalties. As we reported previously, the expected quality of the hydrocarbon resource—the likelihood of hydrocarbon presence, type, quantity, and amount recoverable— is a primary determinant in whether industry will consider pursuing a lease for a given tract. See GAO, Offshore Oil and Gas: Opportunities Exist to Better Ensure a Fair Return on Federal Resources, GAO-19-531 (Washington, D.C.: Sept. 25, 2019).
14The defining distinction between competitive and noncompetitive leases is that competitive leases received at least one bid at a lease sale auction, while noncompetitive leases do not receive bids at or above the minimum bonus bid. Noncompetitive leases are only issued if no adequate bid is received at a competitive lease sale. Those competitive leases that received only one bid are at the minimum threshold of being considered competitive, so we considered them to be more comparable to noncompetitive leases than other competitive leases with more than one bidder. In addition, according to one expert, a $2 per acre bonus bid is not a significant investment for operators. This is because other costs common to both competitive and noncompetitive leases, such as rents or development, represent significantly greater costs over the lifecycle of a lease. For example, both types of leases would accrue $17.50 per acre in rental costs over 10 years, and a roughly $10,000 fee is required to apply for a drilling permit.
15Royalties accounted for a majority of overall revenues from oil and gas leasing and provided an indicator of leases’ revenues after the primary term.

Appendix I: Objectives, Scope, and Methodology
Page 23 GAO-21-138 Oil and Gas Leasing
using bonus bid amounts as a proxy for bidder interest and the leases’ prospect for development.16 However, these measures are imperfect, and our results are descriptive statistics that cannot provide statistical associations about the relationship of bonus bids and revenues or comparisons of revenues between groups of leases.17 We present our results in the context of limitations.
In addition, leases that started in fiscal years 2003 through 2009 may not be representative of competitive and noncompetitive leases that started in other years.18 However, results from our analysis of these leases were consistent with auction theory and other empirical literature on oil and gas leasing.19 In general, we expect some findings may hold for leases that started in other years, since the federal leasing process has been largely the same since the 1987 Reform Act. By contrast, we expect our results may not be generalizable to revenues that occur after the primary term, particularly in cases where factors unknown at the time of auction, such as technological changes during the lease lifecycle, could affect royalties from production.
We assessed the reliability of BLM’s LR2000 data and ONRR MRMSS data by (1) performing electronic testing, (2) reviewing existing 16We considered the number of bidders competing for a lease to be an indicator of bidder interest. We used bonus bids at the $2 per acre minimum to indicate leases that had a single bidder and bids above $2 per acre to indicate leases that had multiple bidders. In general, we assumed winning bonus bids provide a market signal that represents a lower bound for bidders’ willingness to pay for a lease. We also used the bonus bid amount as a proxy for a bidder’s expectations about a lease’s prospects for development at the time of sale.
17Our analysis focuses on federal revenues produced by a lease and may not capture indirect benefits of oil and gas leases. For example, we do not assess the value of information generated from leases used for exploration purposes, such as to acquire geologic data or identify potentially viable fields. According to BLM, noncompetitive leases can be better suited for these purposes because they usually have more acreage.
18For example, leases may differ in terms of geology (e.g., hydrocarbon presence, type, quantity, amount recoverable) as well as drilling technology and market conditions at the time of the lease sale auction or during lease primary terms.
19Empirical economic literature suggests a correlation between the numbers of bidders on a lease during auction, bonus bid amounts, and the subsequent value of production from leases across various leasing contexts. For example, see W. Mead, “Toward an Optimal Oil and Gas Leasing System,” The Energy Journal, 15:4 (1994): 1–18. For another example, see J.P. Brown et al., “Capturing rents from natural resource abundance: Private royalties from U.S. onshore oil & gas production,” Resource and Energy Economics 46 (2016): 23–38. In addition, see T. Covert and R. Sweeney, “Relinquishing Riches: Auctions vs Informal Negotiations in Texas Oil and Gas Leasing,” NBER, Working Paper 25712 (2019).

Appendix I: Objectives, Scope, and Methodology
Page 24 GAO-21-138 Oil and Gas Leasing
information about the data and the system that produced them, and (3) interviewing agency officials knowledgeable about the data. We determined that the data were sufficiently reliable for the purposes of this report.
We also interviewed four experts who are academics and former government employees who are knowledgeable about federal oil and gas leasing. We interviewed these experts to obtain supplemental information on federal oil and gas leasing, specifically any differences between the competitive and noncompetitive leasing process and resulting revenues. We identified potential experts based on two literature searches and through recommendations from experts we initially contacted. We selected the experts based on their experience working with lease-level BLM and ONRR data, their published work that related to federal onshore oil and gas leasing, and time and resource considerations. We may not have identified all experts or researchers with a view on this topic or who have done work in this area, and the views of the experts we spoke with cannot be generalized to experts we did not interview.
Appendix II: Additional Information on Lease Revenues for Fiscal Years 2003 through 2019
Page 25 GAO-21-138 Oil and Gas Leasing
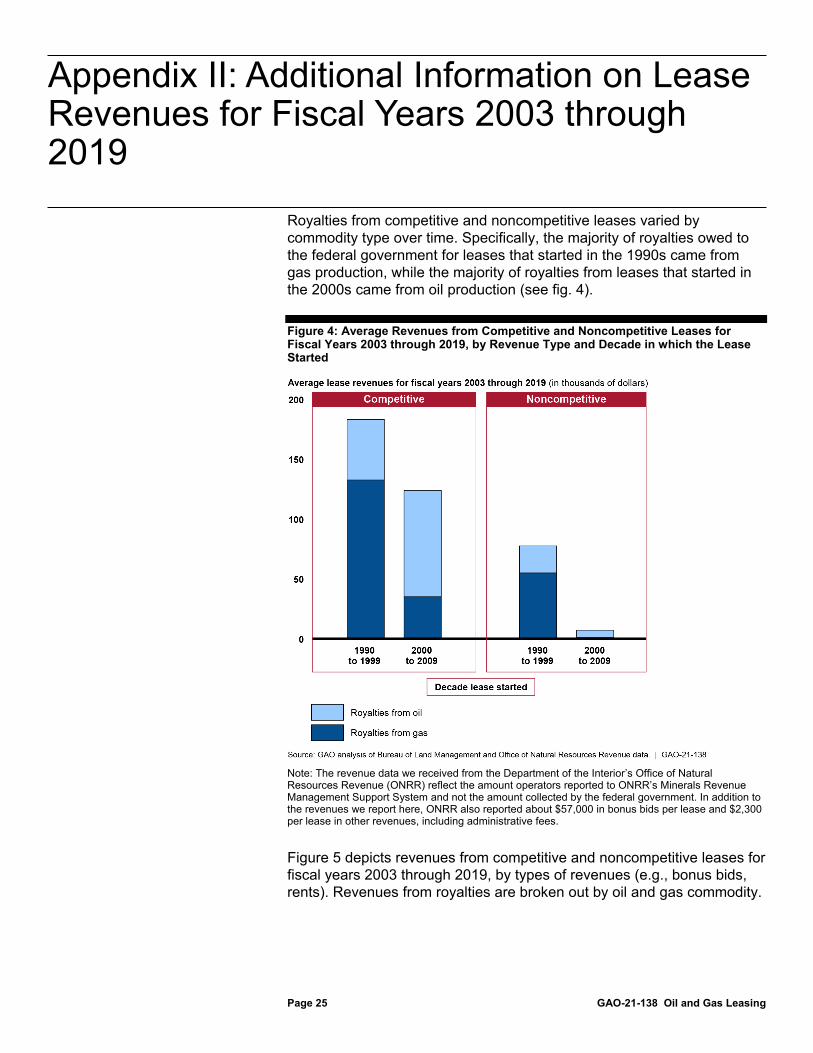
Royalties from competitive and noncompetitive leases varied by commodity type over time. Specifically, the majority of royalties owed to the federal government for leases that started in the 1990s came from gas production, while the majority of royalties from leases that started in the 2000s came from oil production (see fig. 4).
Figure 4: Average Revenues from Competitive and Noncompetitive Leases for Fiscal Years 2003 through 2019, by Revenue Type and Decade in which the Lease Started
Note: The revenue data we received from the Department of the Interior’s Office of Natural Resources Revenue (ONRR) reflect the amount operators reported to ONRR’s Minerals Revenue Management Support System and not the amount collected by the federal government. In addition to the revenues we report here, ONRR also reported about $57,000 in bonus bids per lease and $2,300 per lease in other revenues, including administrative fees.
Figure 5 depicts revenues from competitive and noncompetitive leases for fiscal years 2003 through 2019, by types of revenues (e.g., bonus bids, rents). Revenues from royalties are broken out by oil and gas commodity.
Appendix II: Additional Information on Lease Revenues for Fiscal Years 2003 through 2019
Appendix II: Additional Information on Lease Revenues for Fiscal Years 2003 through 2019
Page 26 GAO-21-138 Oil and Gas Leasing
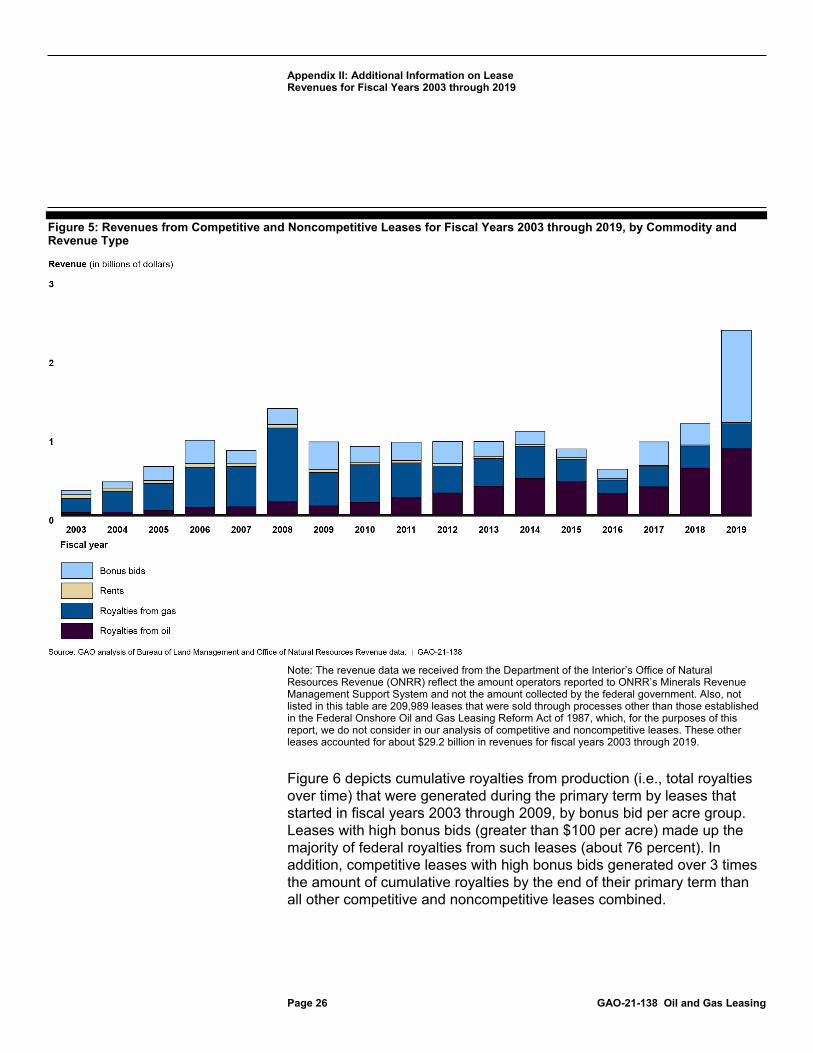
Figure 5: Revenues from Competitive and Noncompetitive Leases for Fiscal Years 2003 through 2019, by Commodity and Revenue Type
Note: The revenue data we received from the Department of the Interior’s Office of Natural Resources Revenue (ONRR) reflect the amount operators reported to ONRR’s Minerals Revenue Management Support System and not the amount collected by the federal government. Also, not listed in this table are 209,989 leases that were sold through processes other than those established in the Federal Onshore Oil and Gas Leasing Reform Act of 1987, which, for the purposes of this report, we do not consider in our analysis of competitive and noncompetitive leases. These other leases accounted for about $29.2 billion in revenues for fiscal years 2003 through 2019.
Figure 6 depicts cumulative royalties from production (i.e., total royalties over time) that were generated during the primary term by leases that started in fiscal years 2003 through 2009, by bonus bid per acre group. Leases with high bonus bids (greater than $100 per acre) made up the majority of federal royalties from such leases (about 76 percent). In addition, competitive leases with high bonus bids generated over 3 times the amount of cumulative royalties by the end of their primary term than all other competitive and noncompetitive leases combined.

Appendix II: Additional Information on Lease Revenues for Fiscal Years 2003 through 2019
Page 27 GAO-21-138 Oil and Gas Leasing
Figure 6: Cumulative Royalties from Competitive Leases, by Bonus Bid, and Noncompetitive Leases That Started in Fiscal Years 2003 through 2009
Note: The revenue data we received from the Department of the Interior’s Office of Natural Resources Revenue (ONRR) reflect the amount operators reported to ONRR’s Minerals Revenue Management Support System and not the amount collected by the federal government. We analyzed revenues for leases that started in fiscal years 2003 through 2009 to include leases that completed the 10-year primary lease term. Cumulative royalties refer to total royalties accumulated throughout the primary lease term.

Appendix III: GAO Contact and Staff Acknowledgments
Page 28 GAO-21-138 Oil and Gas Leasing
Frank Rusco, (202) 512-3841 or [email protected]
In addition to the contact named above, Christine Kehr (Assistant Director), Marie Bancroft (Analyst-in-Charge), Tara Congdon, John Delicath, Emily Gamelin, William Gerard, Cindy Gilbert, Joe Maher, Rebecca Mendelsohn, Dan Royer, and Jerry Sandau made key contributions to this report.
Appendix III: GAO Contact and Staff Acknowledgments
GAO Contact Staff Acknowledgments
(102877)

1
The Government Accountability Office, the audit, evaluation, and investigative arm of Congress, exists to support Congress in meeting its constitutional responsibilities and to help improve the performance and accountability of the federal government for the American people. GAO examines the use of public funds; evaluates federal programs and policies; and provides analyses, recommendations, and other assistance to help Congress make informed oversight, policy, and funding decisions. GAO’s commitment to good government is reflected in its core values of accountability, integrity, and reliability.
The fastest and easiest way to obtain copies of GAO documents at no cost is through our website. Each weekday afternoon, GAO posts on its website newly released reports, testimony, and correspondence. You can also subscribe to GAO’s email updates to receive notification of newly posted products.
The price of each GAO publication reflects GAO’s actual cost of production and distribution and depends on the number of pages in the publication and whether the publication is printed in color or black and white. Pricing and ordering information is posted on GAO’s website, https://www.gao.gov/ordering.htm.
Place orders by calling (202) 512-6000, toll free (866) 801-7077, or TDD (202) 512-2537.
Orders may be paid for using American Express, Discover Card, MasterCard, Visa, check, or money order. Call for additional information.
Connect with GAO on Facebook, Flickr, Twitter, and YouTube. Subscribe to our RSS Feeds or Email Updates. Listen to our Podcasts. Visit GAO on the web at https://www.gao.gov.
Contact FraudNet:
Website: https://www.gao.gov/fraudnet/fraudnet.htm
Automated answering system: (800) 424-5454 or (202) 512-7700
Orice Williams Brown, Managing Director, [email protected], (202) 512-4400, U.S. Government Accountability Office, 441 G Street NW, Room 7125, Washington, DC 20548
Chuck Young, Managing Director, [email protected], (202) 512-4800 U.S. Government Accountability Office, 441 G Street NW, Room 7149 Washington, DC 20548
Stephen J. Sanford, Acting Managing Director, [email protected], (202) 512-4707 U.S. Government Accountability Office, 441 G Street NW, Room 7814, Washington, DC 20548
GAO’s Mission
Obtaining Copies of GAO Reports and Testimony Order by Phone
Connect with GAO
To Report Fraud, Waste, and Abuse in Federal Programs
Congressional Relations
Public Affairs
Strategic Planning and External Liaison
Please Print on Recycled Paper.