gao-04-756 renewable energy: wind power's … · wind power’s contribution to electric power...
TRANSCRIPT

GAOUnited States Government Accountability Office
Report to the Ranking Democratic Member, Committee on Agriculture, Nutrition, and Forestry, U.S. Senate
September 2004 RENEWABLE ENERGY
Wind Power’s Contribution to Electric Power Generation and Impact on Farms and Rural Communities
a
GAO-04-756
www.gao.gov/cgi-bin/getrpt?GAO-04-756. To view the full product, including the scope and methodology, click on the link above. For more information, contact Lawrence J. Dyckman at (202) 512-3841 or [email protected].
Highlights of GAO-04-756, a report to the Ranking Democratic Member, Committee on Agriculture, Nutrition, and Forestry, U.S. Senate
September 2004
RENEWABLE ENERGY
Wind Power’s Contribution to Electric Power Generation and Impact on Farms and Rural Communities
Wind power provides electricity without polluting the air or depleting nonrenewable resources. Wind power relies on steady winds to turn the blades of power-generating turbines. Because these turbines generally are located on rural lands, wind power could also provide economic benefits to farmers and rural communities. The 2002 farm bill created a renewable energy program and authorized $115 million for the U.S. Department of Agriculture (USDA) to provide assistance for renewable energy projects, including wind power. GAO was asked to examine (1) the amount of electricity generated by U.S. wind power and prospects for its growth, (2) the contribution of wind power to farmers’ income and rural communities, (3) the advantages and disadvantages for farmers of owning a wind power project versus leasing land for a project, and (4) USDA’s efforts to promote wind power in rural communities.
To ensure USDA’s timely and full implementation of its renewable energy program, USDA should (1) identify ways to accelerate its development of the program regulation, (2) work with the Environmental Protection Agency (EPA) to determine what assistance that agency can provide, and (3) continue to examine ways to streamline the program application process. USDA agreed with GAO’s recommendations.
Wind power accounted for only about one-tenth of 1 percent of total U.S. electric power generation capacity in 2003, but wind power capacity quadrupled between 1990 and 2003, and the Department of Energy has projected continued growth through 2025. However, most of the nation’s wind potential remains untapped. Wind power’s growth will depend largely on the continued availability of federal and state financial incentives, including tax credits, and expected increases in prices for fossil fuels. Although wind power does not contribute significantly to total farm income in the 10 states with the highest installed wind power capacity, it has considerably benefited some farmers and rural communities. For example, a farmer who leases land for a wind project can expect to receive $2,000 to $5,000 per turbine per year in lease payments. In addition, large wind power projects in some of the nation’s poorest rural counties have added much needed tax revenues and employment opportunities. Farmers generally find leasing their land for wind power projects to be easier than owning projects. Less than 1 percent of wind power capacity installed nationwide is owned by farmers. Leasing is easier because energy companies can better address the costs, technical issues, tax advantages, and risks of wind projects. However, ownership of a turbine may double or triple the farmer’s expected income over leasing. USDA has not fully utilized all of the farm bill’s renewable energy provisions to promote wind power. In particular, although it offers grants under its renewable energy program, USDA has not issued a regulation to offer loans and loan guarantees as well. A higher program level could be achieved by using these funding mechanisms. Loans also may be a more cost-effective way to provide federal assistance than grants. USDA also is missing opportunities to obtain EPA’s assistance in implementing the program. For example, EPA’s Office of Air and Radiation has extensive contacts with utilities interested in purchasing power from renewable sources. Finally, applicants and others have raised concerns about the complexity of the application process and short time frame for completing applications. Areas with Strong Wind Resource Potential

Contents
Letter 1Results in Brief 5Background 9Wind Power Is a Small but Growing Part of the Nation’s Electric
Power Generation Capacity 13Wind Power Does Not Contribute Significantly to Total Farm
Income, but Some Individual Farmers and Communities Have Benefited 34
Leasing Land for Wind Power Projects Is Easier Than Owning, and Most Farmers Do Not Qualify for Tax Credit 38
USDA Can Do More to Promote Wind Power 45Farm Bill Provisions Promote Renewable Energy Systems, Including
Wind Power, but USDA Has Not Made Full Use of These Provisions 45
Conclusions 61Recommendations 61Agency Comments 62
AppendixesAppendix I: Objectives, Scope, and Methodology 64
Appendix II: Sources for Information on Wind Power Generation 69
Appendix III: Results of NREL Modeling on Potential Economic Impacts of
Wind Power on Rural Communities 73
Appendix IV: Summary of Visits to Wind Power Projects in Five States 84Projects in California 84Projects in Colorado 88Projects in Iowa 90Projects in Minnesota 94Projects in Texas 100
Appendix V: The Wind Project Development Process 102
Appendix VI: Comments from the U.S. Department of Agriculture 104
Appendix VII: GAO Contacts and Staff Acknowledgments 106GAO Contacts 106Staff Acknowledgments 106
Related GAO Products 107
Page i GAO-04-756 Renewable Energy

Contents
Tables Table 1: Major Steps in the Wind Power Project Development Process 39
Table 2: Four Types of Lease Payment Options 40Table 3: Minnesota Initiatives That Promote Small
Landowner-Owned Wind Projects 44Table 4: Farm Bill Provisions to Further Wind Power’s Growth 46Table 5: Status of USDA’s Implementation of Farm Bill Provisions
That Support Wind Power’s Growth 47Table 6: USDA Grant Assistance for Renewable Energy and Energy
Efficiency Projects in 2003 50Table 7: Counties Included in NREL’s Economic Analysis 74Table 8: Economic Impacts during Construction Period of 150 MW
Wind Power Project Owned by Out-of-Area Energy Company 79
Table 9: Economic Impacts during Construction Period of 40 MW Wind Power Project Owned by Out-of-Area Energy Company 80
Table 10: Economic Impacts during Operations Period of 150 MW Wind Power Project Owned by Out-of-Area Energy Company 81
Table 11: Economic Impacts during Operations Period of 40 MW Wind Power Project Owned by Out-of-Area Energy Company 82
Table 12: Economic Impacts during Operations Period of 20 Locally Owned Wind Power Projects, Each with a 2 MW Capacity 83
Figures Figure 1: Wind Farm in Lake Benton, Minnesota 2Figure 2: Horizontal and Vertical Axis Wind Turbines 10Figure 3: U.S.-Installed Wind Power Generating Capacity, 1981
through 2003, in MW 15Figure 4: Installed Wind Power Generating Capacity by State, as of
December 2003, in MW 16Figure 5: Areas with the Highest Wind Potential in the United
States 18Figure 6: Leading States’ Installed Wind Power Capacity Compared
with Wind Potential 19Figure 7: Renewable Portfolio Standards for 17 States, as of August
2004 25
Page ii GAO-04-756 Renewable Energy

Contents
Figure 8: Fluctuations in the Installation of New Wind Power Capacity Related to the Changing Availability of the Production Tax Credit (PTC) 32
Figure 9: Horizontal Axis Wind Turbines, Altamont Pass, California 84
Figure 10: Vertical Axis Wind Turbines, Altamont Pass, California 85Figure 11: Wind Turbines, Solano County, California 86Figure 12: Wind Turbines, Weld County, Colorado 88Figure 13: Wind Turbine, Dickinson County, Iowa 90Figure 14: Wind Turbines, Buena Vista County, Iowa 92Figure 15: Wind Turbines, Pipestone County, Minnesota 94Figure 16: Wind Turbine, Rock County, Minnesota 96Figure 17: Wind Turbines, Pipestone County, Minnesota 98Figure 18: Wind Turbines, Pecos County, Texas 100
Abbreviations
AWEA American Wind Energy AssociationBSE bovine spongiform encephalopathyDOE Department of EnergyEIA Energy Information AdministrationEPA Environmental Protection AgencykW kilowattkWh kilowatt hourMW MegawattMWh Megawatt hourNOFA Notice of Funds AvailabilityNREL National Renewable Energy LaboratoryOMB Office of Management and BudgetPTC production tax creditRBS Rural Business-Cooperative ServiceUSDA United States Department of Agriculture
This is a work of the U.S. government and is not subject to copyright protection in the United States. It may be reproduced and distributed in its entirety without further permission from GAO. However, because this work may contain copyrighted images or other material, permission from the copyright holder may be necessary if you wish to reproduce this material separately.
Page iii GAO-04-756 Renewable Energy

United States Government Accountability Office Washington, D.C. 20548
A
September 3, 2004 Letter
The Honorable Tom Harkin Ranking Democratic Member Committee on Agriculture, Nutrition, and Forestry United States Senate
Dear Senator Harkin:
Wind-generated electricity—wind power—has the potential to provide electricity to homes and businesses without causing air pollution or depleting nonrenewable resources, unlike electricity generated by fossil fuels (coal, natural gas, and oil). Furthermore, because wind power has no fuel costs—wind power depends on the energy of the wind—its operating costs are lower than the costs for power produced from fossil fuels,1 although its capital costs are greater. Wind power relies on frequent, strong winds to turn the blades of power-generating turbines. In the United States, a wind turbine with generating capacity of 2 megawatts (MW),2 placed on a tower situated on a farm, ranch, or other rural land, can generate enough electricity in a year—about 6 million kilowatt hours (kWh) 3—to serve the needs of 500 to 600 average U.S. households. Figure 1 shows part of a wind power project, also referred to as a wind farm, in Lake Benton, Minnesota.
1Wind power is fueled by the kinetic energy of the wind, which is continually replenished through atmospheric processes. The power available in the wind is proportional to the cube of its speed: doubling the wind speed increases the potential available power by a factor of eight.
2A watt is the basic unit used to measure electric power. A kilowatt (kW) equals 1,000 watts and an MW equals 1,000 kW or 1 million watts.
3Electricity production and consumption are measured in kilowatt-hours, while generating capacity is measured in kilowatts or megawatts. If a power plant that has 1 MW of capacity operates nonstop during all 8,760 hours in the year, it will produce 8,760,000 kWh. An average U.S. household consumes roughly 10,000 kWh a year. However, on average, wind power turbines typically operate the equivalent of less than 40 percent of the peak (full load) hours in the year due to the intermittency of wind.
Page 1 GAO-04-756 Renewable EnergyPage 1 GAO-04-756 Renewable Energy

Figure 1: Wind Farm in Lake Benton, Minnesota
Note: The farm depicted has 143 turbines producing enough electricity annually to serve about 33,000 typical U.S. homes.
In addition to environmental benefits, wind power has the potential to contribute significantly to America’s growing energy needs while providing economic benefits to farms and communities in rural America.4 In this connection, the Department of Energy’s (DOE) “Wind Powering America” program has set a goal of producing 5 percent of the nation’s electricity from wind by 2020. DOE estimates that achieving this goal would add $60 billion in capital investment in rural America, provide $1.2 billion in new
4Wind power also can contribute to the nation’s energy diversity and security. The administration’s National Energy Policy states that sound energy policy should encourage a diverse portfolio of domestic energy supplies and that renewable energy can be a reliable source of energy at a stable price. Furthermore, with regard to national energy security, while the nation’s transmission grid and central power plants remain vulnerable to terrorist attack, renewable sources are geographically dispersed and contain no volatile or radioactive fuel stocks.
Source: HDR Inc.
Page 2 GAO-04-756 Renewable Energy

income for farmers and rural landowners, and create 80,000 new jobs by that year.
About 90 percent of wind power generation now occurs in 10 predominately midwestern and western states—California, Colorado, Iowa, Minnesota, New Mexico, Oklahoma, Oregon, Texas, Washington, and Wyoming—that generally have extensive open spaces with frequent, strong winds. Areas considered favorable for wind power generation have average annual wind speeds of about 16 miles per hour or more.
The Farm Security and Rural Investment Act of 2002 (farm bill) authorized $115 million through fiscal year 2007 for farm-based renewable energy initiatives,5 part of which will go to wind power projects. The U.S. Department of Agriculture (USDA) is responsible for implementing the farm bill’s provisions in consultation with DOE. While many people could benefit indirectly from the clean air and economic growth brought about by wind power development, farmers and other rural landowners, such as ranchers (hereafter referred to as farmers) can benefit directly. They can receive lease payments from commercial developers for the turbines placed on their land or own projects outright, selling electricity to a local utility. Furthermore, even large wind turbines use only about a quarter-acre of land each, including access roads, so farmers can continue to plant crops and graze livestock up to the base of the turbines.
Wind power’s developers have relied on the federal production tax credit, which provides a credit for electricity generated by renewable energy sources such as wind turbines—about 1.8 cents per kWh during 2003. Recipients of the tax credit receive it for up to 10 years from the project’s initial operation. This credit has helped to offset the significantly higher capital costs per unit of generating capacity needed to start up wind power projects compared with projects for fossil fuel power generation, according to government and industry experts. Experts also expect that future improvements in wind power technology and forecasts for higher
5Pub. L. No. 107-171, § 9006, 116 Stat. 134, 482 (2002). Specifically, section 9006 of the farm bill provides that the Secretary of Agriculture shall make available $23 million from the funds of the Commodity Credit Corporation each fiscal year—for fiscal years 2003 through 2007—for renewable energy systems and energy efficiency projects. These funds are to be used to make loans, loan guarantees, and grants to farmers, ranchers, and rural small businesses. Grants are to be made based on demonstrated financial need. Grant amounts must not exceed 25 percent of the cost of the activity funded, and the combined amount of the grant or loan made or guaranteed must not exceed 50 percent of the activity’s cost.
Page 3 GAO-04-756 Renewable Energy

fossil fuel prices will help wind power compete with other sources of electric power generation without reliance on the tax credit.
You asked us to report on (1) the amount of wind power generation in relation to all U.S. electricity generation and the prospects for wind power’s growth, (2) the contribution of wind power generation to farmers’ income and to the economic well-being of rural communities in the 10 states with the highest wind power generation capacity, (3) the advantages and disadvantages for farmers of owning a wind power project versus leasing their land to a commercial wind power developer, and (4) the efforts of USDA to promote the development of wind power on farms and in rural communities.
To conduct this work, we interviewed officials or reviewed documentation from DOE’s Energy Information Administration (EIA), Office of Energy Efficiency and Renewable Energy, and National Renewable Energy Laboratory (NREL); USDA’s Economic Research Service, Office of Energy Policy and New Uses, Farm Service Agency, National Agricultural Statistics Service, and Rural Business-Cooperative Service; the Environmental Protection Agency (EPA); the Federal Energy Regulatory Commission; commodity groups such as the National Corn Growers Association; the Union of Concerned Scientists; the American Wind Energy Association (AWEA); the Edison Electric Institute; the Electric Power Research Institute; and Windustry (a rural-based, wind stakeholder organization). We also visited nine wind power projects in five states with substantial installed wind power generating capacity: California, Colorado, Iowa, Minnesota, and Texas. At these locations, we generally met with landowners, project investors and owners, state and local taxing authorities, community leaders, and electric utility officials. To some extent, our work was limited because we did not have access to some proprietary cost and income data. We focused on utility-scale wind power projects—projects that generate at least 1 MW of electric power annually for sale to a local utility. Utility-scale projects account for most U.S. wind power generation. In addition, we reviewed our own past work, relevant publications of the Congressional Budget Office and the Congressional Research Service, and applicable laws, regulations, and executive orders. We conducted our review from February 2003 through August 2004 in accordance with generally accepted government auditing standards. We did not independently verify the data obtained from any of these sources. However, as appropriate, we discussed with these sources the measures they take to ensure the accuracy of these data. These measures seemed reasonable. Appendix I provides additional information on our scope and
Page 4 GAO-04-756 Renewable Energy
methodology. Appendix II provides further information on the sources used in our work.
Results in Brief Nationwide, wind power accounted for only about one-tenth of 1 percent of total electric power generation capacity in 2003, and an even smaller percentage of electric power actually generated. However, U.S. wind power generating capacity quadrupled between 1990 and 2003—to 6,374 MW—and DOE has projected continued growth for this renewable power source through 2025. On a percentage basis, wind power capacity has been growing at a much higher rate than other sources of electric power generation—an average annual growth rate of 28 percent during the period 1999 through 2003. In addition, according to DOE, the U.S. Midwest theoretically has enough wind power potential to meet a significant portion of the nation’s electricity needs. However, this potential remains largely untapped: Many of the states with the greatest wind potential, such as North Dakota and South Dakota, have seen little investment in wind power projects. Several factors constrain growth in these states, such as the lack of (1) nearby significant population centers with the large electric power demand needed to justify substantial investments in wind power and (2) adequate transmission capacity to carry electricity produced from wind power in sparsely populated rural areas to distant cities.
Other factors, however, promote growth, such as state financial and tax incentives and environmental and energy security concerns. For example, state incentives have promoted wind power projects in California, Texas, and Minnesota—the leading states in installed wind power projects. In addition, wind power does not create the pollution or greenhouse gas emissions associated with fossil fuel power generation, and expanded use of renewable energy sources such as wind power can help reduce the nation’s dependence on imported fossil fuels. Still, according to DOE and industry sources, the principal factor encouraging investment in wind power projects will be the continued availability of the federal production tax credit. If this credit is available for projects initiated through 2010, DOE estimates that wind power generation capacity could increase to 48,000 MW or more by 2025, enough to power about 13 million U.S. homes, based on current usage rates; without it, this generation capacity is likely to increase to 11,000 MW. As with any federal tax credit, there are impacts on the nation’s budget. For example, the Congressional Joint Committee on Taxation estimates that if the authorization for the production tax credit were extended through 2006, its cost to the Treasury for the 10-year period ending in 2013 would be $3 billion, or about $300 million annually.
Page 5 GAO-04-756 Renewable Energy

Wind power does not currently contribute significantly to total farm income in the 10 states with the highest installed wind power capacity, but some individual farmers and rural communities have benefited considerably from this energy source. In these 10 states, net farm income was about $14 billion in 2002, but total direct income to farmers from wind power ranged from only $10 million to $45 million, representing a fraction of 1 percent of net farm income. However, wind projects located on farms have increased some individual farmers’ income by tens of thousands of dollars annually. For example, a farmer who leases land to a wind project developer can generally expect to obtain $2,000 to $5,000 per turbine per year in lease payments, depending on factors such as the size of the project, the capacity of the turbines, and the amount of electricity produced. In addition, lease arrangements generally assure farmers that they will have a relatively stable income from wind power generation for the life of the lease, which may exceed 20 years. Furthermore, large wind power projects have been established in some of the nation’s poorest rural counties. In general, these rural communities have little industry, but have benefited from the tax revenues and employment opportunities associated with these wind projects. For example, in 2002, the school districts in Pecos County, Texas, received about $5 million in property tax revenues from wind power projects. These projects also created about 30 to 35 full-time permanent jobs to operate and maintain the projects.
Farmers generally find leasing their land for wind power projects to be easier than owning projects. Wind power projects owned or partly owned by farmers account for less than 1 percent of utility-scale wind power capacity installed nationwide. Leasing is easier because, unlike farmers, energy companies have the financial resources and legal and technical expertise to address the costs, complexity, tax advantages, and risks of wind power development. However, ownership may be more profitable than leasing. For example, whereas lease payments for a single turbine may provide several thousand dollars a year to a landowner, a farmer’s ownership of the turbine may double or triple that income. On the other hand, a farmer-owner may be able to afford the installation of only one or two turbines, but leasing land to an energy company could result in the installation of a dozen or more turbines. In the latter case, although the farmer’s income per turbine would be less, the total income received by the farmer would be substantially greater. Although the federal renewable energy production tax credit is usually considered crucial for wind power development, individual farmers generally cannot use this credit because they lack sufficient tax liability. One state—Minnesota—provides a financial incentive to overcome this obstacle. Specifically, Minnesota offers
Page 6 GAO-04-756 Renewable Energy

a renewable energy cash incentive—1.5 cents per kWh of electricity produced—for wind projects up to 2 MW, regardless of income. In addition, some Minnesota farmers have entered into equity partnerships with other investors to benefit from the production tax credit indirectly. In these cases, the investor generally owns a majority interest in the project for the first 10 years, receiving most of the project income and the benefits of the credit. After this 10-year period, the majority ownership is transferred to the farmer, who will receive most of the associated income.
USDA has not fully utilized all of the farm bill’s renewable energy provisions to promote wind power development on farms and in rural communities. For the Renewable Energy Systems and Energy Efficiency Improvements Program (Renewable Energy Program)—the key program for supporting wind power and other renewable energy initiatives—USDA offered grants totaling $7.4 million for 35 wind power projects in eight states in fiscal year 2003, the program’s first year, but it has not implemented the loan and loan-guarantee components of the program. Without the latter, USDA has not fully fulfilled farm bill provisions and limits the ability of the program to promote renewable energy sources. For example, USDA budget documents indicate that the addition of loans and loan guarantees would increase the program level to about $200 million annually. Direct loans would be made from funds borrowed from the U.S. Treasury. Guaranteed loans would be made from funds loaned by banks and other private lending institutions. Loans also may be a more cost-effective way to provide federal assistance than outright grants. USDA has not offered loans and loan guarantees because it has yet to issue a regulation for the program. It had planned to issue the proposed and final regulations in the Federal Register during fiscal year 2004. However, the agency was unable to hold to this schedule and, as a result, announced only the availability of grants again in fiscal year 2004. USDA officials cited several factors as delaying the agency’s completion of the program regulation, including the notice and comment provisions of the Administrative Procedure Act, delays in hiring a contractor to help develop the regulation, and the newness and uniqueness of the program.
In addition, USDA may be missing opportunities to leverage information, resources, and expertise available from EPA to implement the Renewable Energy Program. It also may have further opportunities to simplify the application process for the program. USDA invited only one EPA office to participate in USDA’s Rural Energy Working Group. This office promotes energy generation from the anaerobic digestion of biomass. However, other EPA offices may be able to assist the program’s implementation as well,
Page 7 GAO-04-756 Renewable Energy

including providing specific assistance for wind power. For example, officials in EPA’s Office of Air and Radiation, which works with electric power utilities interested in purchasing electricity from renewable sources, said they could assist wind power applicants in locating potential buyers for the electricity to be produced. Regarding the application process, applicants and other stakeholders have expressed concerns about the complexity and time constraints of completing required feasibility studies, negotiating tentative agreements with an electricity buyer, preparing the required financial information to demonstrate need under the program, and compiling information needed for environmental assessments. Although USDA acknowledges these concerns and made changes to its implementation of the program in fiscal year 2004 based on these concerns, there may be further opportunities to simplify and streamline the application process.
In light of these issues, we are recommending that USDA identify ways to accelerate the development of the regulation for the Renewable Energy Program in order to make loans and loan guarantees available to program applicants expeditiously. In addition, we are recommending that USDA work with EPA to identify other EPA offices that may be able to assist USDA in implementing the program and that USDA continue to examine ways to simplify the application process for the program based on input from applicants and other stakeholders.
In commenting on a draft of this report, USDA agreed with the recommendations and stated the agency would take every opportunity to expedite the rule making process, increase coordination with EPA, and examine ways to simplify the grant application process. USDA’s comments are reprinted in appendix VI. USDA also provided us with suggested technical corrections, which we incorporated into this report as appropriate.
We also provided a draft of this report to DOE and EPA for review and comment. Their clarifying comments were incorporated into this report, as appropriate.
Page 8 GAO-04-756 Renewable Energy

Background
Description of Wind Power Wind power is one of several renewable energy options. Other renewable sources include sunlight (photovoltaics), heat from the sun (solar thermal), naturally occurring underground steam and heat (geothermal), plant and animal waste (biomass), and water (hydropower). Unlike fossil fuels,6 renewable energy sources are continuously replenished.
Wind turbines can be used by themselves or be connected to a utility power grid. Stand-alone turbines can be used for pumping water—for example, to irrigate fields. However, homeowners and farmers in windy areas can also use stand-alone turbines to generate electricity for their own personal or on-farm use. For utility-scale sources of wind power, a number of turbines are usually built close together to form a wind farm. Currently, more than 50 electric power utilities use wind farms to produce part of the electricity supplied to their customers.
In general, wind turbines are divided into two major categories: horizontal axis turbines, which resemble a windmill, and vertical axis turbines, which resemble an eggbeater. Figure 2 depicts each type of turbine.
6Most U.S. electricity generation is made with fossil fuel and nuclear technologies—coal (52 percent), nuclear (20 percent), natural gas (16 percent) and oil (3 percent). There are about 5,000 major power plants in the United States, with a generating capacity of about 800,000 MW.
Page 9 GAO-04-756 Renewable Energy

Figure 2: Horizontal and Vertical Axis Wind Turbines
The horizontal axis turbine is the most commonly used, constituting nearly all utility-scale turbines in the United States. To generate electricity, this type of turbine captures the wind’s energy with two or three propellerlike blades that are mounted on a rotor. These rotors sit atop towers, taking advantage of the stronger and less turbulent wind at 100 feet (30 meters) or more above ground. The turbine blades generally are constructed of fiberglass, may be up to 20 meters in length, and may weigh several thousand pounds each. A horizontal axis turbine typically has a mechanism to keep the rotor headed into the wind, while a vertical axis turbine can accept wind from any direction.
Tower
Vertical axis wind turbine Horizontal axis wind turbine
Generator
Gearbox
Rotor
Nacelle
Source: Izaak Walton League of America.
Page 10 GAO-04-756 Renewable Energy

Federal Role in Promoting the Use of Wind Power
The federal government represents the largest institutional user of energy in the world, and thus it is potentially a large market for wind and other renewable energy sources.7 Specifically, through its purchasing decisions, the federal government has the opportunity to affirm its energy and environmental policies and goals, including its goals for promoting the use of renewable sources such as wind power. In this regard, Executive Order 13123, issued in 1999, requires federal agencies to increase their use of renewable energy to a percentage determined by the Secretary of Energy. In 2000, the Secretary directed that federal agencies obtain the equivalent of 2.5 percent of their electricity from renewable sources by 2005.8 As of March 2003, federal agencies were using about 663 million kWh of renewable energy, or about 48 percent of the goal established by the Secretary. For example, according to Department of Defense officials, 15 military bases, including Edwards Air Force Base in California, Shriever Air Force Base in Colorado, and Ellsworth Air Force Base in South Dakota, use wind power to varying degrees. In addition, one of these bases, Dyess Air Force Base in Texas, bought 78 million kWh of wind power-produced energy in 2003, meeting the base’s entire electricity needs for that year. In addition, other federal agencies, including DOE, EPA, and USDA, are using wind power for part of their energy needs. For example, USDA’s Animal and Plant Health Inspection Service purchases 25 percent of the electricity used at its National Wildlife Research Center in Colorado from wind-generated sources.
The federal government is also the nation’s largest landholder, controlling nearly 700 million acres of land.9 Much of this land is in the western United States and includes some areas of the country with the highest wind potential.10 Thus, according to federal and industry officials, areas on these federal lands could be leased to wind power or other renewable energy
7With approximately 3.3 billion square feet of facility space and over 500,000 vehicles, the federal government is the largest single energy consumer in the nation.
8Solar, wind, biomass, and geothermal systems installed after 1990 qualify as renewable resources under the executive order.
9The federal government’s share of the nation’s total surface area is about 29 percent. Four agencies—the National Park Service, the Fish and Wildlife Service, and the Bureau of Land Management within the Department of the Interior, and the Forest Service within the Department of Agriculture—manage about 655 million acres, or 96 percent of all federal lands.
10Most federal lands in the 48 contiguous states are located in 11 western states.
Page 11 GAO-04-756 Renewable Energy

developers, with the federal government collecting substantial land rental payments. For example, the Department of the Interior’s Bureau of Land Management (Bureau) has rented some of the land that it manages in California and Wyoming for wind projects. Overall, these projects include more than 1,300 turbines with a total production capacity of nearly 900 MW, and the associated rental payments provide more than $800,000 in income to the Bureau annually.11 The administration’s National Energy Policy also recognizes this potential.12 For example, the policy recommends that the Secretaries of the Interior and of Energy re-evaluate access limitations to federal lands in order to increase renewable energy production, such as biomass, wind, geothermal, and solar, on these lands.13 Although the establishment of renewable energy production on federal lands would result in some environmental impacts, some federal and industry officials note these impacts would be far less than the mining, drilling, and hauling associated with fossil fuel extraction.
In addition, through various programs, the federal government has helped to promote the use of wind power by municipal electric utilities; rural electric cooperatives; state, local, and tribal governments; businesses; and consumers. For example, DOE, in conjunction with wind stakeholders across the country, launched the Wind Powering America program in 1999 to increase the use of wind energy in the United States in order to promote rural economic development, protect the environment, and increase the nation’s energy security.14 The program’s original goals included (1) providing 5 percent of the nation’s electricity from wind by 2020, with near-term goals of 5,000 MW by 2005 and 10,000 MW by 2010; (2) increasing the number of states with at least 20 MW of installed wind capacity to 16 by
11In addition, the Bureau of Land Management tentatively plans to rent other land it manages for wind power projects. Specifically, the Bureau anticipates renting land for about 3 gigawatts of wind power development between 2005 and 2025 in 11 western states. In this regard, the Bureau plans to publish an environmental impact statement in the Federal
Register in September 2004 seeking comments on this proposal.
12National Energy Policy: Report of the National Energy Policy Development Group, Office of the Vice President, May 2001.
13See Department of Energy and Department of the Interior, White House Report in
Response to National Energy Policy Recommendations to Increase Renewable Energy
Production on Federal Lands (Washington, D.C.: Aug. 20, 2002).
14See www.windpoweringamerica.gov.
Page 12 GAO-04-756 Renewable Energy

2005 and 24 states by 2010;15 and (3) increasing the federal government’s use of wind power to 5 percent of its annual consumption of electricity by 2010. The program’s work is organized under four themes: state-based activities, rural economic development, greening federal electricity consumption, and utility partnerships. Among other things, the program encourages partnerships between government and industry; educates, equips, and supports state wind working groups; and develops innovative pilot projects, such as identifying rural ownership options for small wind systems.
In another case, EPA promotes the use of wind power and other renewable sources of electricity—collectively known as green power—through its Green Power Partnership Program. Specifically, EPA provides technical assistance and public recognition to companies and organizations that make a commitment to using green power for a portion of their electricity needs. More than 200 companies, including a number of major corporations, participate in this program. In addition, the Department of Housing and Urban Development’s community development block grants have been used to assist municipal-owned utilities to purchase wind turbines. For example, in Iowa, three cities received community development block grant funds in either fiscal year 2002 or fiscal year 2003 to erect wind turbines for energy generation; these grants totaled about $1 million. Furthermore, as discussed later in this report, USDA has several programs that can be used to provide financial assistance for renewable energy projects on farms or other rural lands.
Wind Power Is a Small but Growing Part of the Nation’s Electric Power Generation Capacity
Although wind power accounted for about one-tenth of 1 percent of total U.S. electric power generation capacity in 2002, it had quadrupled in generating capacity between 1990 and 2003, and has been growing at a much higher rate than other sources of electric power generation. Nevertheless, wind power’s potential remains largely untapped. A number of factors, including limited transmission capacity and the higher capital start-up costs of wind power compared with fossil fuels in some markets, hamper wind power’s expansion, although other factors, such as federal and state financial incentives, have helped spur expansion. According to DOE estimates, the nation’s wind power generation capacity will continue
15In August 2004, DOE officials indicated that this second goal had been revised to increase the number of states with at least 20 MW of installed wind capacity to 32 by 2005 and with at least 100 MW of installed wind capacity to 30 states by 2010.
Page 13 GAO-04-756 Renewable Energy

to grow through 2025, but higher levels of production depend on the continued availability of federal and state financial incentives, particularly the federal production tax credit, expected price increases for fossil fuels, and continued research and development leading to further improvements in wind turbine technology.
Wind Power Accounts for Less Than 1 Percent of Total U.S. Capacity, but Has Quadrupled Since 1990
As of December 2003, wind power capacity accounted for about one-tenth of 1 percent of total U.S. generating capacity16—about 6,370 MW—up from 1,525 MW in 1990. This growth exceeds the goal established by DOE’s Wind Powering America program for wind energy generation of at least 5,000 MW nationwide by 2005. This rate also makes wind power the fastest growing source of electric power generation, on a percentage basis, in the United States in recent years.17 For example, from 1999 through 2003, the average annual growth rate of wind power was 28 percent, and in 2003 alone, enough new wind turbines were erected to provide electricity to 400,000 to 500,000 U.S. homes.18 Figure 3 shows the growth in U.S. wind power generating capacity from 1981 through 2003.
16While wind power’s share of total electric power generating capacity is small, its share of actual electric power generation is smaller. Wind power turbines are “on-line”—that is, they are actually generating electricity—only when wind speeds are sufficiently strong (i.e., at least 9 to 10 miles per hour) to turn the turbine blades. In contrast, power plants that use coal, natural gas, or nuclear fuel generally operate without interruption, except when idled by equipment problems or for maintenance.
17Worldwide, installed wind power capacity increased by about 500 percent between 1997 and 2003. As of December 2003, this capacity was estimated at 37,220 MW; Europe accounts for about 73 percent of this capacity. Germany (14,000 MW) has the most capacity; the United States (6,374 MW) is second. Other leading countries include Spain (5,780 MW), Denmark (3,094 MW), and India (1,900 MW).
18An average U.S. household uses about 10,000 kWh of electricity each year. One MW of wind power capacity can generate between 2.4 million and 3 million kWh annually. Therefore, one MW of wind generates about as much electricity as 240 to 300 households use each year. The level of U.S. wind power capacity as of December 31, 2003—6,374 MW—provides as much electricity as is used by 1.5 million to 1.9 million households annually.
Page 14 GAO-04-756 Renewable Energy

Figure 3: U.S.-Installed Wind Power Generating Capacity, 1981 through 2003, in MW
As of the end of 2003, about 90 percent of wind power generation occurred in 10 predominantly midwestern and western states—California, Colorado, Iowa, Minnesota, New Mexico, Oklahoma, Oregon, Texas, Washington, and Wyoming. Two of these states—California and Texas—accounted for about one-half of the nation’s 6,374 MW of installed wind generation capacity, as of the end of 2003. Figure 4 shows installed wind power generating capacity in these 10 states and other states with at least 0.1 MW of installed capacity, as of December 2003.
1983
1985
1987
1989
1991
1993
1995
1997
1999
2002
2003
Source: AWEA.
Number of megawatts
2001
1982
1984
1986
1988
1990
1992
1994
1996
1998
2000
1981
0
1,000
2,000
3,000
4,000
5,000
6,000
7,000
Year
Page 15 GAO-04-756 Renewable Energy

Figure 4: Installed Wind Power Generating Capacity by State, as of December 2003, in MW
The nation’s wind potential—particularly in areas with frequent, strong winds needed to generate electricity from wind power—remains largely
MT0.1
NE14.0
AL
TN2.0
ND66.3
OK176.3
SC
WI53.0
MN562.7
AR0.1
CO223.2
MS
IA471.2
VA
MO
IN
LA
SD44.3
KS113.7
GA
TX1,293.0
OH3.6
NV
NM206.6
MDDE
NJ
MI2.4
NC
FL
IL50.4
AZ
DC
PA129.0
VT 6.0NH 0.1WA
243.8
OR259.4
ID0.2
WY284.6
UT0.2
KY
WV66.0
AK1.1
HI8.6
NY48.5
ME0.1
MA 1.0RI
CT
CA2,042.6
Generating capacity (in megawatts)
Source: AWEA.
Negligible
0.1 to < 100
100 to < 400
400 to < 1,000
1,000 and above
Page 16 GAO-04-756 Renewable Energy
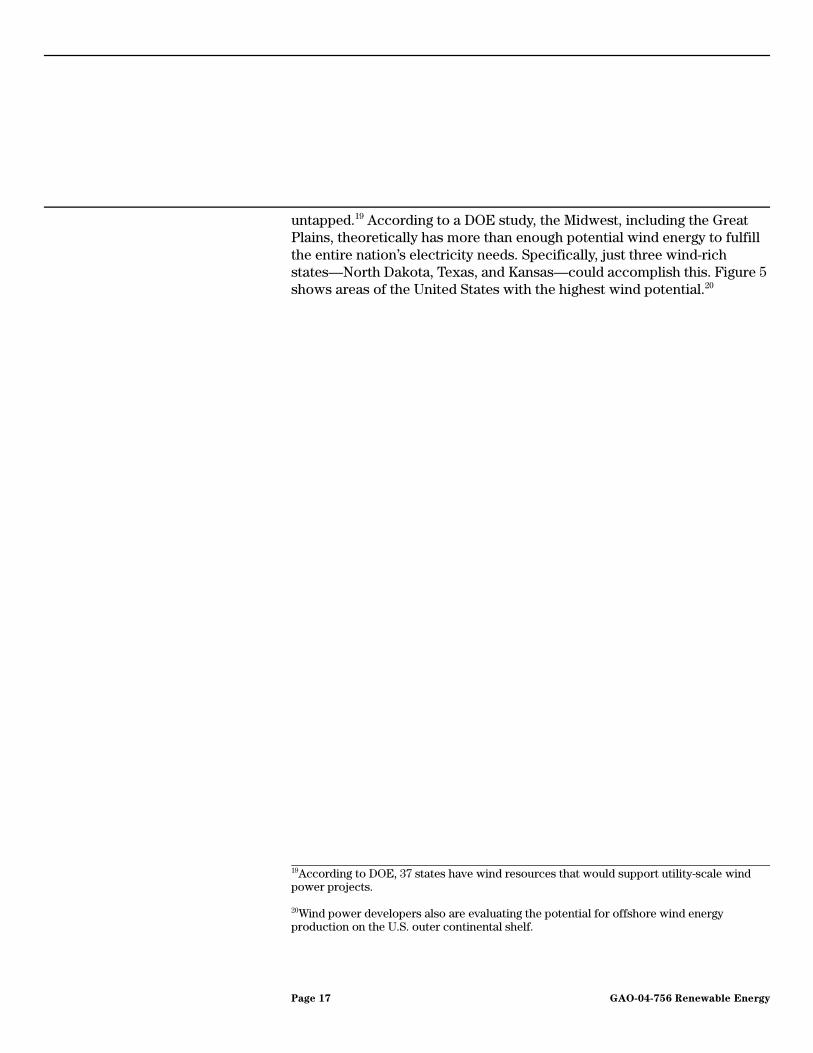
untapped.19 According to a DOE study, the Midwest, including the Great Plains, theoretically has more than enough potential wind energy to fulfill the entire nation’s electricity needs. Specifically, just three wind-rich states—North Dakota, Texas, and Kansas—could accomplish this. Figure 5 shows areas of the United States with the highest wind potential.20
19According to DOE, 37 states have wind resources that would support utility-scale wind power projects.
20Wind power developers also are evaluating the potential for offshore wind energy production on the U.S. outer continental shelf.
Page 17 GAO-04-756 Renewable Energy

Figure 5: Areas with the Highest Wind Potential in the United States
Moderate
Good
Excellent
Resource potential
Source: U.S. Department of Energy, National Renewable Energy Laboratory.
Page 18 GAO-04-756 Renewable Energy

A Number of Factors Act to Either Constrain or Promote Wind Power’s Growth
As a comparison of figures 4 and 5 shows, states with the greatest installed wind power capacity are not necessarily the states with the greatest wind potential. In addition, figure 6 shows this discrepancy for the leading states in each category.
Figure 6: Leading States’ Installed Wind Power Capacity Compared with Wind Potential
Note: The top 18 states for wind resource potential, as measured by annual energy potential in billions of kWh, factoring in environmental and land use exclusions for wind class 3 and higher.
This discrepancy occurs, in part, because of factors that constrain growth, such as access to transmission lines, as well as factors that encourage development, such as state incentives. The following factors constrain the growth of wind power:
1 2 3 4 5 6 7 8 9 10 11 12 13 14 15 16
16
17
17
18
18
North Dakota is number 1 in wind power potential and number 13 in installed capacity.
California is number 1 in installed capacity and number 17 in wind power potential.
Installed capacity
1 2 3 4 5 6 7 8 9 10 11 12 13 14 15Wind resource potential
States ranked in numerical order
States ranked in numerical order
Source: GAO analysis of AWEA information.
Texa
s
Nor
th D
akot
a
Nor
th D
akot
a
Sout
h D
akot
a
Wyo
min
g
Mon
tana
Min
neso
ta
Kans
as
Okl
ahom
a
Col
orad
o
Neb
rask
a
New
Mex
ico
Wis
cons
in
Mic
higa
n
Cal
iforn
ia
Idah
o
New
Yor
k
Iow
a
Texa
s
Sout
h D
akot
a
Wyo
min
g
Wes
t Virg
inia
Min
neso
ta
Kans
as
Okl
ahom
a
Col
orad
o
Penn
sylv
ania
New
Mex
ico
Ore
gon
Cal
iforn
ia
Was
hing
ton
Iow
a
New
Yor
k
Illin
ois
Illin
ois
Wis
cons
in
Page 19 GAO-04-756 Renewable Energy
• The cost of wind power production in relationship to fossil fuels.
According to AWEA, the cost of electricity from utility-scale wind power projects was as high as 30 cents per kWh in the 1980s, far greater than the cost of electricity from alternative technologies using fossil fuels to generate power.21 Various state and federal incentives helped overcome wind power's cost disadvantage in many locations, as did dramatic cost reductions due to improvements in wind turbine technology. At present, DOE estimates the cost of generating electricity from wind power ranges from 3 to 6 cents per kWh. Cost reductions also occurred in fossil-fuel power generation technologies, but recent increases in natural gas fuel costs may result in further market penetration by wind power. For example, if natural gas prices continue to be substantially higher than average levels in the 1990s, wind power is likely to be competitive in parts of the country with good wind resources and transmission access. However, wind power will continue to be too expensive to compete with fossil-fuel generation in parts of the country with poor wind resources. Although cost reductions due to technological improvements affect all segments of the electric industry, they tend to be particularly important for newer power generation technologies such as wind power in comparison to fossil-fuel generation technologies. Furthermore, continued federal and state actions that promote renewable energy power generation or raise the cost of emissions from fossil-fuel technologies could also play a significant role in improving the competitiveness of wind power.
• Connection to the power transmission grid. In general, frequent, strong winds tend to be found in sparsely populated areas, which may be far from transmission lines or lines with adequate capacity to bring power to consumers. For example, renewable energy generators in the wind-rich areas of the Upper Midwest, such as North Dakota, may want to transmit electricity to heavily populated areas in other states. However, as with any remotely located power source, a renewable energy generator can incur transmission pricing mechanisms that charge according to the distance covered or according to the number of utility territories crossed. In addition, transmission capacity is limited in many areas of the nation for all electric power sources. According to AWEA
21The cost of electricity from a particular power generation technology depends on the capital costs of the associated equipment, the projected lifetime of the equipment, the amount of energy produced each year, and the cost of borrowing money to construct the power generation plant. Simply stated, the cost of energy is the sum of various costs (e.g., capital and operations and maintenance) divided by the annual energy generation.
Page 20 GAO-04-756 Renewable Energy

and industry sources, transmission congestion policies generally allocate limited capacity on a “first-come, first-served” basis and discriminate against recent market entrants. Moreover, interconnection policies are often controlled by utilities that make it difficult for new entrants, such as wind power projects, to have timely interconnection at reasonable rates. The Federal Energy Regulatory Commission, which is responsible for approving rates for the transmission of electricity—and overseeing the sale of electricity—in competitive wholesale markets, is currently developing market standards for new entrants, such as wind and other renewable sources, to connect to the transmission grid. DOE is also conducting research to develop efficient, lower-speed wind turbines for deployment in less windy areas of the nation; such turbines would enhance the ability of industry to bring cost-effective wind power closer to population centers and avoid already congested long-distance transmission lines.
• Intermittency of wind power. Renewable energy sources such as wind power have unique technical characteristics that can constrain their use in an existing transmission system that was built to accommodate large central-station power plants located near population centers. This system relies on precisely predicting and controlling power plant output to avoid blackouts and other disruptions. As a result, with this system, the value of electricity is determined in part by the time of day at which the electricity is delivered to the grid and also by the probability that it will be available when needed. In general, fossil fuel and nuclear power generation plants can be run without interruption and are consistently available when called upon, except when idled by equipment problems or for maintenance. However, wind power is an intermittent source in that wind speed and availability can vary from day to day, and thus the amount of electricity produced varies. On average, wind power turbines operate the equivalent of less than 40 percent of the peak hours in a year due to the intermittency of wind. While penalties may apply whenever energy deliveries vary from scheduled amounts, the possibility of penalties is of particular concern for intermittent sources. As a result, utilities that derive part of their electricity generation from wind power may have to develop or purchase costly reserve capacity in case wind power is not available on demand. However, some federal and wind industry officials downplayed the importance of this factor, noting that if wind power constitutes less than 20 percent of a utility’s generating capacity, the remaining capacity may be sufficient to meet demand during periods of low winds. Furthermore, according to DOE, recent studies show that in cases where wind power constitutes up to 10
Page 21 GAO-04-756 Renewable Energy

percent to 20 percent of a utility’s generating capacity, the additional operating cost of integrating wind power is only up to 0.5 cents per kWh. Specifically, this amount represents the ancillary cost due to the variability of wind.22
• Barriers to marketplace entry. As emerging technologies, renewable energy sources such as wind power face market entry barriers. For example, developing new renewable facilities requires high up-front costs to build the necessary infrastructure, such as construction costs to connect power lines to the transmission grid. According to DOE, the average cost of building new power lines to connect wind turbines to the transmission grid could be $100,000 or more per mile, depending on such factors as the size of the wind project, terrain, and the transmission line rating. In addition, manufacturers produce renewable energy components on assembly lines, where mass production can reduce costs. As long as relatively few units are produced, prices will remain high. Economies of scale would likely lead to cost reductions for wind and other renewable technologies. Furthermore, small renewable energy projects have high transaction and other costs at various stages of the development cycle. For example, lending institutions charge more to evaluate the creditworthiness of many small projects than one large one. These institutions also are generally unfamiliar with new technologies and are more likely to perceive them as riskier, causing the institutions to lend money at higher interest rates. Higher financing costs are especially significant for the competitive position of renewable energy sources such as wind power because these sources generally require higher initial investments per unit of electricity produced than fossil fuel plants, even though renewable sources have lower operating costs.
• Impacts on visual landscape, bird deaths, and noise issues. Although wind power turbines do not emit pollutants, they do present some environmental issues. According to AWEA and industry sources, wind power project developers must gauge a local community’s receptivity to the placement of wind turbines in scenic areas that may have high wind potential, such as ridge lines, mountain passes, or off-shore coastal areas, or else risk expensive litigation. Regarding birds that die when they collide with turbine blades, these sources said that developers
22Ancillary costs are the costs of transmission and generation services necessary to support the transmission of capacity and energy from resources to loads.
Page 22 GAO-04-756 Renewable Energy

should study the numbers and species of birds (and bats) present at various times of the year at potential site locations. In general, if the locations are commonly used by endangered or threatened avian species or are in bird migration pathways, they may be unsuitable for wind power development. New construction techniques and technologies may help to reduce bird deaths,23 such as switching from latticework towers that entice birds to perch to smooth-sided cylindrical towers that do not offer perches. In addition, the longer blades on newer, larger turbines turn more slowly—about 21 to 23 revolutions per minute in optimum wind conditions—than earlier turbines with shorter blades, making these longer blades more visible to birds in daylight. Concerning noise, new turbine designs and engineering as well as the use of appropriate setbacks from residences have helped to decrease the importance of this issue. For example, aerodynamic noise has been reduced by adjusting the thickness of the turbine blades’ trailing edges and by orienting blades upwind of the turbine tower.
Several factors help promote wind power’s growth. First, according to federal and industry officials, direct public sector support programs have been important to increasing the demand for wind power in the United States because of wind power’s competitive disadvantages in most domestic markets. For example, the federal production tax credit, established by the Energy Policy Act of 1992, as amended, is available to tax-paying owners of wind or “closed loop” biomass energy generation systems.24 The act provides a credit of 1.5 cents per kWh for the first 10 years from initial plant operation, indexed for inflation, for electricity generated by renewable energy sources such as wind turbines; it was 1.8 cents per kWh during 2003. According to our analysis, using this incentive, a moderate-sized wind farm with 30 MW of generating capacity could receive up to $1.6 million a year in tax credits. In addition, in some cases this tax credit may be combined with the 5-year depreciation schedule allowed for renewable energy systems under the Economic Recovery Tax
23According to wind industry sources, bird deaths resulting from collisions with cars, airplanes, windowpanes, tall buildings, and transmission lines, as well as from hunting, predators, and accidental poisoning, far exceed bird deaths associated with wind turbines. However, the number of bird deaths attributable to wind power may grow as more turbines are installed.
24Pub. L. No. 102-486, 106 Stat. 2776, 3020 (1992), codified at 26 U.S.C. § 45. Closed-loop biomass refers to plants grown exclusively to provide fuel for electric power generation. Closed-loop biomass excludes forest biomass, mill waste, or urban waste.
Page 23 GAO-04-756 Renewable Energy

Act of 1981, as amended.25 In conjunction with the tax credit, this accelerated depreciation allows an even greater tax break for renewable projects facing high initial capital costs. The authority for new facilities to qualify for the production tax credit expired at the end of calendar year 2003;26 as of August 2004, legislation was pending in Congress that would reauthorize this tax credit.27
At the state level, the states with the most installed wind power capacity generally have implemented strong policies providing regulatory, financial, or tax incentives to wind power development. For example, 17 states have implemented renewable portfolio standards. Under these standards, utilities must derive a certain percentage of their overall electric generation (on a sales basis) from renewable energy sources, such as wind power. California and Texas—2 of the 17 states that have instituted these standards—also are the leading states with installed wind power capacity. California requires that 20 percent of the state’s electric generation be derived from renewable sources by 2017. In Texas, the requirement is 2.7 percent by 2009. Figure 7 shows the states that have enacted these standards, including the target amount of generation from renewable sources and the associated dates for achievement.
25Pub. L. No. 97-34, 95 Stat. 230 (1981), codified at 26 U.S.C. § 168(e)(3)(B)(vi).
26To qualify for the tax credit, the facility was required to have been placed in service before January 1, 2004.
27See H.R. 4520 and S. 1637, 108th Cong. (2004).
Page 24 GAO-04-756 Renewable Energy

Figure 7: Renewable Portfolio Standards for 17 States, as of August 2004
aMinnesota law requires utilities to make a good faith effort to generate or procure 10 percent of the electricity they generate by 2015 from eligible renewable energy technologies, including wind. Minnesota’s Public Utilities Commission required each utility to develop formal plans as to how they would meet this objective. In addition, Minnesota law requires one utility operating in the state, Xcel Energy, to develop 1,125 MW of wind power by December 31, 2010.bIn 1991, Iowa enacted legislation requiring investor-owned utilities operating in the state to purchase a combined total of 105 MW of the generation from renewable sources. According to an Iowa Public Utilities Board official, this represented about 2 percent of the total electricity generated by those utilities at that time.cIllinois enacted legislation creating the Illinois Resource Development and Energy Security Act. The legislation adopted a statewide renewable energy goal of at least 5 percent of total energy by 2010,
HI20% by 2020
Source: GAO analysis of information from the Union of Concerned Scientists, the Interstate Renewable Energy Council, and stateofficials in Iowa, Minnesota, and Texas.
TX2.7% by2009d
NM10% by2009
NV15% by 2013,solar 5%of totalannually
CA20% by2017
IA2% by1999b IL
15% by2020c
MN10% by2015a
WI2.2% by2011
ME30% by2000
MA4% by2009
CT10% by2010
RI16% by2019
NJ6.5% by2008
MD7.5% by2019
PAvaries byutility
AZ1.1% by2007,60% solar
17 states
Page 25 GAO-04-756 Renewable Energy

and at least 15 percent by 2020. However, the legislation does not include an implementation schedule, compliance verification, or credit trading provisions.dIn December 1999, the Public Utility Commission of Texas issued a renewable energy mandate rule establishing the state’s renewable portfolio standard. In addition to the 880 MW of existing renewable generation in Texas at that time, the standard called for 2,000 MW in new renewable generation to be installed by 2009. If this goal is met, an official in the Texas Office of Public Utility Counsel estimated that renewable generation will represent about 2.7 percent of total electricity demand in the state by 2009.
Multiple states have taken other, similar actions to support renewable energy sources, including wind power. Specifically, according to the Database of State Incentives for Renewable Energy compiled by the Interstate Renewable Energy Council in August 2004:
• Thirty-two states and the District of Columbia have implemented net metering laws, which allow customers with their own power generating units, such as small wind turbines, to sell power that is excess to their needs back to the power grid, enabling the flow of electricity to and from the customer through a single meter.28
• Twenty states offer property tax exemptions or special assessments for renewable energy sources, and 6 states allow localities to offer this exemption.
• Fifteen states allow sales tax exemptions for renewable energy sources.
• Twenty states offer personal or corporate income tax incentives for renewable energy sources.
• Many states have grant (20), loan (18), and rebate (12) programs to promote renewable energy sources. Utilities or private sources offer these types of financial incentives in many of these states as well.
• Fifteen states have public benefit funds for renewable energy sources. In these states, a surcharge is assessed to all customers on utility bills. The money generated goes into a public benefit fund to, among other things, support renewable energy research and development and education programs.
28Net metering laws typically include a limit on the size of the generating units, usually ranging from 1 kW to 1,000 kW. Some states that have net metering provisions do not qualify wind power for this incentive.
Page 26 GAO-04-756 Renewable Energy

Some states promote wind power creatively. For example, California has formed a collaborative—known as the California Wind Energy Collaborative—to promote wind power’s growth in the state. The collaborative includes officials from federal and state government agencies, wind energy developers, electricity suppliers, environmental groups, and the academic community. Its primary purpose is to coordinate statewide activities related to wind power and to recommend policies to support its growth. The collaborative has developed a number of recommendations, such as (1) simplifying the permitting process for establishing a wind project in California and (2) focusing research and development on, among other things, improving turbine performance and reliability, addressing transmission grid and interconnection challenges, and enhancing wind forecasting. The California State Energy Commission funds the collaborative, providing about $350,000 annually for its activities.
A second factor helping to further wind power’s expansion is environmental benefits. Wind power is considered a green technology because it has only minor impacts on the environment.29 In contrast, fossil fuel power plants are a significant source of air pollution. In general, these plants produce harmful emissions, such as carbon dioxide, nitrogen oxides, sulfur dioxide, mercury, and particulate matter, which can pose human health and environmental risks, such as acid rain and global warming.30 In some cases, these emissions may increase as electricity generated by fossil fuels increases to meet growing demand.31 For example, EIA forecasts that if this generation increases by 42 percent from 2000 through 2020—from 3.5 trillion kWh in 2000 to almost 5 trillion kWh in 2020—annual emissions of carbon dioxide and mercury from these plants will rise nationwide by
29The raw material acquisition, manufacture, transportation, and installation of wind turbines may result in minor environmental effects. For example, fossil fuel resources may be used in the production and transport of wind turbines and their components. In addition, the preparation of the foundation and construction of the turbine on site may result in some pollution due to soil erosion and engine exhaust until heavy equipment such as cranes, bulldozers, and backhoes are removed and ground cover is re-established around the base of the turbine. However, the operation of the turbine to produce electricity does not cause air or water pollution.
30EPA data for 2000—the most recent available—indicate that conventional power plants were the single greatest industrial source of certain pollutants, emitting 40 percent of the nation’s carbon dioxide, 37 percent of its mercury, 22 percent of its nitrogen oxides, 63 percent of its sulfur dioxide, and 21 percent of its particulate matter.
31GAO, Air Pollution: Meeting Future Electricity Demand Will Increase Emissions of
Some Harmful Substances, GAO-03-49 (Washington, D.C.: Oct. 30, 2002).
Page 27 GAO-04-756 Renewable Energy

about 800 million tons (or 35 percent more) and 4 tons (or 9 percent more), respectively.32 To some extent, these anticipated increases could be offset by an increasing reliance on nonpolluting, renewable sources such as wind power. For example, according to DOE, by 2020, the growth of wind power could eliminate millions of tons of atmospheric carbon that would otherwise be released by fossil fuel power plants, thereby reducing greenhouse gas emissions.
Fossil fuel power plants are also the nation’s second largest user of water resources after agriculture.33 Specifically, power plants use about 48.2 trillion gallons of fresh water from rivers, lakes, and other sources each year, primarily to produce steam to turn turbines and for cooling, according to the U.S. Geological Survey. This amount represents nearly 40 percent of the nation’s total water usage. Power plants’ water requirements will likely rise as demand for electricity grows over the next 2 decades. Although state and local authorities protect certain water uses, such as for drinking water, when approving the construction of new power plants, these plants nevertheless can affect aquatic ecosystems. For example, drawing water into a plant can kill fish, and discharging water with elevated temperatures back to its source can damage aquatic organisms or habitats. Wind power, as an alternative energy source, does not use water to generate electricity.
In addition, increasing environmental consciousness has created “green consumerism”—a segment of consumers who are willing to pay more for products, including wind-generated electricity, whose production, application, and disposal are less harmful to the environment. Thus, utilities may offer customers the option of paying a higher rate for electricity produced from renewable sources such as wind power in lieu of electricity produced from fossil resources, arrangements often referred to as green pricing programs. For example, in the program sponsored by Xcel Power in Colorado, known as Windsource®, customers pay a premium of
32Carbon dioxide emissions have been linked to global climate change, among other effects, and exposure to mercury can lead to nervous system disorders and birth defects. EIA projects slight decreases in emissions of nitrogen oxides and sulfur dioxide, sources of acid rain and smog, due to technology improvements and regulatory measures. Specifically, EIA forecasts that by 2020, power plants’ total emissions of nitrogen oxides and sulfur dioxide will decrease nationwide by about 100,000 tons (2 percent) and about 2 million tons (19 percent), respectively.
33Power plants consume only about 3 percent of the water they draw from a particular source during the process of generating electricity. In contrast, agriculture consumes about 61 percent.
Page 28 GAO-04-756 Renewable Energy

$2.50 per 100 kWh for wind-generated electricity. According to some sources, customer interest in this program was an important factor in the installation of more than 230 MW of wind power capacity in the state.34 In Texas, Austin Energy has a green pricing program, known as GreenChoice®, for wind power, which accounts for about 4 percent of its annual electricity sales. Although participating customers generally pay a premium for this wind-generated electricity, demand is such that this utility is currently negotiating to add an additional 91 MW of wind power capacity. As an added inducement, this utility offers its wind power customers the choice of locking in a rate for a period of 10 years, while regular customers are subject to possible rate increases if the costs for fossil fuels increase.
A third factor is energy security. This could help promote wind power and other renewable energy sources in order to reduce the nation’s dependence on foreign fossil resources, including oil and natural gas. For example, the United States currently imports about 65 percent of the oil and 15 percent of the natural gas it uses. Natural gas, in particular, is increasingly used to produce electricity,35 and according to DOE, the anticipated growth in demand for this fossil fuel will lead to an increasing reliance on imports. According to DOE, this dependence harms the U.S. trade balance and exposes our economy to potential supply disruptions.36 In light of these concerns, federal legislative and regulatory initiatives have encouraged a diversified energy portfolio. For example, the Public Utilities Regulatory Policies Act of 1978, as amended, was enacted in part to encourage the
34According to DOE officials, Colorado’s Public Utility Commission also deemed wind power to be a cost effective alternative under least cost planning.
35The United States used about 23.5 trillion cubic feet of natural gas in 2000 in five sectors: residential, commercial, industrial, electric generation, and transportation. DOE expects the country’s consumption of natural gas will increase to 33.8 trillion cubic feet per year by 2020. More than half of this increase is predicted to come from gas-fired electric generation.
36According to the National Energy Policy Initiative, even in peacetime, the United States pays tens of billions of dollars a year for the readiness costs of military forces whose primary mission is intervention in the Persian Gulf region. A significant portion of those costs can be attributed to protection of oil production sites and transport routes. The economic, diplomatic, and military cost of foreign oil dependence is likely to increase as low-cost reserves become increasingly concentrated in that region, further increasing the potential market power of a few Middle Eastern countries.
Page 29 GAO-04-756 Renewable Energy

development of alternative energy resources.37 More recently, the administration’s National Energy Policy, issued in May 2001, states that sound energy policy should encourage a diverse portfolio of domestic energy supplies and that renewable energy can be a reliable source of energy at a stable price because it does not depend on the availability of fossil fuels. Furthermore, while the nation’s transmission grid and central power plants remain vulnerable to terrorist attack, renewable sources, such as wind power, are geographically more dispersed and contain no volatile or radioactive fuel stocks.
Fourth, government and industry experts expect that improvements in wind power technology and forecasts for higher fossil fuel prices will continue to help wind power compete with other sources of electric power generation. For example, technology improvements in turbine design and components have dramatically increased the efficiency and cost competitiveness of wind power generation, and continuing research and development will likely lead to further improvements. Regarding forecasts for higher prices, EIA projects that 69 percent of the 235,000 MW of new generating capacity needed in the United States by 2020 will be fueled by natural gas and another 9 percent by coal.38 In recent years, prices for natural gas have, at times, spiked dramatically, and the market for natural gas remains volatile, with small shifts in the supply of or demand for gas likely to cause wide price fluctuations.39 In addition, DOE and industry sources anticipate that as domestic and international demand for natural gas increases in the electric and other industrial and commercial sectors, the prices for natural gas will rise, making alternative energy sources such as wind power more competitive.
3716 U.S.C. §§ 2601 et seq. The act requires utilities to purchase power output from nonutility facilities at prices not exceeding the utilities’ “avoided cost” of generating it or purchasing it from another source if the facilities are (1) generators that produce electricity using solar, wind, waste, or geothermal sources; or (2) co-generators that produce both electricity and heat or steam for industrial or commercial purposes.
38These percentages exclude electricity that is generated by industrial and other facilities that is then sold to electric utilities.
39GAO, Natural Gas: Analysis of Changes in Market Price, GAO-03-46 (Washington, D.C.: Dec. 18, 2002).
Page 30 GAO-04-756 Renewable Energy

Growth of Wind Power Will Depend on Continued Government Financial Incentives and Prices for Fossil Fuels
According to EIA forecasts prepared at our request, future wind power capacity could increase to 48,000 MW or more by 2025—enough to power about 13 million homes based on current usage rates—if the federal production tax credit were to remain available through 2010. On the other hand, if this credit is not available after December 31, 2003 (its authorization expired after that date and it had not been reauthorized as of August 2004), capacity will increase to only about 11,000 MW by 2025.40 According to EIA and other DOE officials, these forecasts are likely conservative estimates because the assumptions used were conservative.41 Other stakeholders have offered larger estimates. For example, AWEA estimates that wind power capacity could grow to 100,000 MW by 2020, representing about 6 percent of total U.S. production. In another case, the National Petroleum Council estimates that renewable capacity—primarily wind power—will grow to between 73,000 MW and 155,000 MW by 2025, with the larger number dependent in part on proactive public policies to promote renewable sources. Despite these varying estimates, DOE and industry sources agreed that the key to the potential future growth of the wind industry is the continued availability of the production tax credit or other subsidy support, although expected increases in fossil fuel prices, particularly for natural gas, also will be an important factor.
DOE and industry sources noted that prior periods of uncertainty about the availability of the production tax credit led to a boom-and-bust cycle in the installation of new wind power capacity. For example, in years in which the authorization for the credit expired and its renewal was delayed,42 the installation of new capacity fell dramatically compared with the years in which it was available without interruption. Figure 8 provides information on this cycle.
40In its Annual Energy Outlook 2004, EIA projects that wind capacity will increase to about 16,000 MW by 2025 without the production tax credit, primarily due to expected higher natural gas prices and an increase in known, near-term wind projects that are being planned.
41These assumptions are discussed in appendix I.
42In the past, when the authorization for the production tax credit expired and its renewal was delayed, the credit’s renewal was made retroactive to the prior date of expiration.
Page 31 GAO-04-756 Renewable Energy

Figure 8: Fluctuations in the Installation of New Wind Power Capacity Related to the Changing Availability of the Production Tax Credit (PTC)
Note: Authorization for the credit for new facilities lapsed on Dec. 31, 2003. In 2003, the administration’s proposed energy bill would have extended the authorization for 3 years, but this legislation was not enacted. As of August 2004, legislation was pending before Congress that would reauthorize this credit for 3 years.
According to DOE and wind industry sources, the expiration of the production tax credit at the end of 2003 has significantly reduced wind power expansion. Potential developers are reluctant to commit resources to the planning and construction of new capacity without the certainty that the tax credit will be reauthorized. For example, AWEA estimates that the uncertainty over the reauthorization of the tax credit has caused the loss of over 2,000 manufacturing and construction jobs related to wind power and put about 2,000 MW of new wind energy production and nearly $2 billion in economic activity on hold. Thus, industry sources expect a significant drop in the installation of new capacity in 2004 from 2003 levels—capacity expansion in 2003 was a near record 1,700 MW, attributable in large measure to the availability of the tax credit.
According to EIA, without the production tax credit, wind power will be relegated to a niche resource whose expansion will depend largely on long-
PTCauthorizedOctober 24, 1992
Wind capacity (thousands of MW)
Source: California Energy Commission.
Year
0
1
2
3
4
5
6
200320022001200019991998199719961995199419931992
1st PTC expiration,
June 30, 1999
2nd PTCexpiration,
December 31, 2001
3rd PTCexpiration,
December 31, 2003
Page 32 GAO-04-756 Renewable Energy

term trends in natural gas prices.43 Furthermore, in the view of some stakeholders, the most stable, predictable production tax credit would have a long-term or permanent authorization that would not induce market booms and busts but would facilitate steady market development for wind power and other renewable sources. Other stakeholders note, however, that to the extent this credit would be used, tax revenues would be lost to the federal government that could be used for deficit reduction or other purposes. For example, the Congressional Joint Committee on Taxation estimates that if the authorization for the production tax credit were extended through 2006, its cost to the Treasury for the 10-year period ending in 2013 would be $3 billion, or about $300 million annually. On the other hand, some stakeholders believe that renewable energy sources require subsidies such as the production tax credit to level the playing field because various subsidies for fossil fuel and nuclear technologies have made it difficult for renewable energy sources to compete, even when renewable technologies become cost competitive with these conventional technologies. In general, it is difficult to quantify all of the subsidies provided to the fossil fuel and nuclear power industries, and there is sometimes disagreement on how to define a subsidy. Nevertheless, many stakeholders maintain that these subsidies are substantial—measuring in the billions of dollars annually. For example, EIA estimates that the federal subsidies to the oil, natural gas, coal, and nuclear power industries totaled about $2.8 billion in fiscal year 1999, the most recent year for which EIA compiled these data.44
43NREL officials noted that if the states continue to expand requirements for renewable portfolio standards, then further expansion of wind power and other renewable sources may occur even in the absence of the production tax credit and regardless of fossil fuel prices.
44Stakeholders also cite additional, hidden subsidies resulting from the fact that the full environmental and health costs of the fossil fuel and nuclear industries are not accounted for. For example, according to the Department of Labor, the federal government has paid about $40 billion over the past 33 years to cover the medical expenses of coal miners who suffer from “black lung disease.” These subsidies mean that the true cost of coal is not reflected in its market price. In addition, according to the Department of Health and Human Services, air pollution is estimated to be associated with 50,000 premature deaths and an estimated $40 billion to $50 billion in health-related costs annually. Fossil fuel power plants account for much of this pollution.
Page 33 GAO-04-756 Renewable Energy

Wind Power Does Not Contribute Significantly to Total Farm Income, but Some Individual Farmers and Communities Have Benefited
Wind power does not currently contribute significantly to total farm income in the 10 states with the highest installed wind power capacity, although some individual farmers and rural communities have benefited considerably from this energy source. However, wind projects located on farmland have increased some individual farmers’ income significantly, according to our site visits and analysis. In addition, large wind power projects established in some of the poorest rural counties in the United States have generally benefited these counties through the tax revenues they produce and the employment opportunities they provide.
Wind Power Accounts for Only a Very Small Amount of Total Farm Income, but Provides Substantial Income to Some Farmers and Communities
In the 10 states we examined, total net farm income exceeded $14 billion in 2002, but total direct income to all U.S. farmers from wind power ranged from only $10 million to $45 million, representing only a fraction of 1 percent of net farm income in these states. Nevertheless, wind projects located on privately owned farmland—the majority of U.S. wind power projects, according to AWEA—have increased individual farmers’ income by as much as tens of thousand of dollars annually, according to our analysis and site visits. In most cases, the farmers do not have an ownership interest in the projects. Rather, they receive lease payments from energy development companies for the use of the land and the associated “wind rights.” According to AWEA and other sources, the compensation a farmer receives for leasing land for wind power turbines effectively amounts to between $2,000 and $5,000 per year per MW of installed capacity. However, actual compensation received varies widely, depending the following factors:
• The number of turbines. One California project includes turbines with a total generating capacity of approximately 60 MW. Based on data developed from our site visit to this project, we estimate that one of the landowners has enough turbines on his land to have generated over $200,000 in annual lease payments from the project owner. In another case, an Iowa project consisting of about 260 turbines has a total generating capacity of approximately 190 MW. However, the turbines are spread out over separate properties owned by 65 farmers. According to the project owner and one of these farmers, the average annual lease payment is about $2,000 per turbine, with each farmer’s total payments depending on the number of turbines located on that farmer’s land.
Page 34 GAO-04-756 Renewable Energy

• The value of electric power generated by the project. Land lease income is often linked to wind power project revenues. For example, land lease income may be a percentage of the gross revenues from the sale of the project’s wind power. Thus, the higher the sale price of power, the higher the lease income to the landowner. The price paid by utilities for the electricity produced from wind power projects has varied by location and over time. Nationwide, these prices currently range from $20 to $35 per MW hours (MWh). However, power purchase contracts signed in California in the early 1990s tended to be well above this range. For example, the price currently received for electricity from one California wind power project is about $70 per MWh.
• The terms of the lease payments. The lease payments may include a single lump sum payment, fixed annual fees per turbine or per unit of power generation capacity, or a percentage of the project’s gross revenues. The farmer may receive additional lease payments for other structures or considerations related to the wind project, such as substations, operations and maintenance buildings, and rights-of-way, including roads leading to and from the project and transmission poles and lines to connect the project to the local power grid. In cases in which the farmer has an ownership interest in the project, the potential financial benefits may be even greater per turbine. However, farmer-owned wind projects tend to be smaller, because farmers generally do not have the financial resources of an energy development company to establish larger projects with more turbines.
Whatever the lease arrangements, the income farmers receive from wind projects located on their land is relatively stable compared with the income they derive from crop and livestock production, according to some farmers and other sources. Although the income from wind projects may be modest, these individuals said, it serves as an important hedge against possible fluctuations in income from crop and livestock production.45 Furthermore, income from wind turbines located on a farmer’s land
45Various federal farm programs also help to protect farmers from fluctuations in commodity prices. For example, between 1999 and 2002, farmers received about $60 billion in farm program payments—averaging $15 billion annually—from USDA to help support the production of major commodities, such as corn, cotton, rice, soybeans, and wheat. According to USDA, in 2002, about 2.1 million farms produced and sold agricultural products. From these farms, aproximately 1.3 million producers received farm payments. Large farming operations get the most payments because the payments are based primarily on the amount of crop produced or the historical acres farmed.
Page 35 GAO-04-756 Renewable Energy

generally does not fluctuate significantly, although higher or lower average wind speeds from one year to another can affect the amount of royalty payments a farmer receives. Royalty payment rates—for example, 4 percent of gross revenues for electric power generated—are generally negotiated for a period of years. In addition, contracts between a landowner and a wind project owner often have a provision for minimum payment per turbine per year to protect a landowner’s income in cases of unusual low-wind periods or if a turbine is out of operation because of weather-related damage or maintenance. In some cases, a farmer said the additional income from the wind project helps keep the farm solvent and the farmer’s family on the farm.
Wind Power Benefits Rural Communities by Providing Additional Investment, Employment Opportunities, and Tax Revenues
The construction and operation of a large wind project in a rural county is likely to increase the county’s general level of economic activity and wealth. Constructing a large wind power project with several dozen turbines requires the services of multiple businesses and scores of skilled and unskilled workers, as well as the purchase of equipment and material, such as turbines, towers, asphalt, cement, concrete, and electrical cables. In these activities, wind power project developers and operators have directly benefited rural communities by hiring local people and purchasing locally some of the goods and services needed to construct and operate a project. Furthermore, according to DOE, increasing the proportion of the nation’s energy generation attributable to wind power to 5 percent by 2020 would add about $60 billion in capital investment in rural America; provide an estimated $1.2 billion in new income to farmers, Native Americans, and rural landowners; and create approximately 80,000 new jobs. (To determine the overall economic benefits of increasing wind power to farms and rural communities, any losses to the fossil fuel industry need to be counted as an offsetting factor.)
In general, a county with a larger, more diversified economic base can more likely provide these services and supplies, thereby retaining more of the project’s direct economic benefits. For example, according to the developers of a large wind project—High Winds in Solano County, California—they obtained much of the services and supplies needed to construct this project within the county, which has over 400,000 residents and a diversified business community. However, if a county cannot provide some of the services and supplies needed, other nearby counties or cities that can provide these services and supplies may benefit. In Pipestone County, Minnesota, for example, wind power developers purchased some supplies locally, such as concrete, but had to contract with a firm in Fargo,
Page 36 GAO-04-756 Renewable Energy

North Dakota, for a crane large enough to erect the turbines and with a firm in Minneapolis to do the electrical wiring. Pipestone County, located in southwestern Minnesota, has about 9,800 residents and a small business community.
Furthermore, businesses and individuals directly employed by the wind project are likely to spend part of their income at local businesses, such as restaurants, hotels, and gas stations, and hardware, clothing, and food stores. In some cases, the benefits from these activities may exceed the level of a project’s direct benefits. For example, according to the Fort Stockton Economic Development Corporation in Pecos County, Texas, the county experienced a 10 percent increase in gross sales during the construction of several wind power projects.
The property tax revenues resulting from the establishment of a wind power project in a county creates additional revenues that support schools, hospitals, fire protection, and other public services. Following are some examples:
• Lincoln County, Minnesota, with a population of about 6,200, obtained about $470,000, or 18 percent of its property tax revenues, in 2003 from local wind power projects with a combined capacity of 156 MW.
• Pipestone County, Minnesota, obtained about $660,000, or 8 percent of its property tax revenues, in 2001 from wind projects with a combined capacity of 113 MW.
• In Pecos County, Texas, with a population of about 16,000 the school districts received about $5 million in 2002 from property tax revenues directly associated with wind power projects in that county. For example, the Iraan-Sheffield School District, obtained one-third of its property tax revenues from wind power projects that year. These projects also added about 30 to 35 full-time permanent jobs to operate and maintain the projects.
For some counties, tax benefits may have to be deferred to attract wind power developers. These counties have offered generous tax abatements, forgoing part or much of the tax revenues that would have otherwise been collected for the period covered by the abatement. For example, to attract wind power developers, Texas’s Upton County offers a tax abatement of 10 years, waiving all property taxes during this period with the exception of taxes collected for schools.
Page 37 GAO-04-756 Renewable Energy

In terms of other taxes, counties that have sales taxes or that receive a share of state sales tax revenues are likely to realize income from the sale of taxable goods and services connected with the construction and operation of a wind power project. In addition, in states that have a personal or corporate income tax, the increased employment and business opportunities associated with a wind power project are likely to increase these tax revenues, which are then shared with counties in the state or used for public projects that benefit county residents.
To better gauge the significance of general increases in economic activity, we asked NREL to use its Wind Impact Model to estimate these benefits, as well as direct benefits, for the counties we visited. NREL developed a number of estimates, varying the size of the wind project but otherwise keeping key model assumptions constant. In general, the results of NREL’s analysis confirm our observations from our site visits. For example, NREL estimates that the operation of a 150 MW project located in Alameda County, California—a county with a large population and diversified economic base—would result in the creation of 65 new jobs in the county and increase total income in the county by $5.4 million. However, the same size project located in Upton County, Texas, which has a much smaller population and economic base, would result in only 47 new jobs and an increase in total county income of $2.75 million. This is because in the case of Upton County, more of the staff needed to operate the project would be hired from outside the county. Nevertheless, the impact of the local hires on employment in Upton County may be greater than in Alameda County because the population of Upton County is so much smaller. A detailed discussion of this model and NREL’s analysis is contained in appendix III.
Leasing Land for Wind Power Projects Is Easier Than Owning, and Most Farmers Do Not Qualify for Tax Credit
Ownership of a wind power project may be more profitable to a farmer than leasing, based on our fieldwork and analysis. For example, whereas lease payments per turbine may provide several thousand dollars a year to the farmer, ownership may double or triple that income per turbine as the profits are not shared with an energy company. On the other hand, a farmer may only be able to afford to construct 1 or 2 turbines, as the cost per MW of installed capacity is about $1 million. In contrast, leasing land to an energy development company could result in the installation of a dozen or more turbines. In the latter case, although the farmer’s income per turbine is less, the total income received by the farmer would be substantially greater. In addition, farmers and other small investors generally lack sufficient tax liability to take full advantage of the federal renewable energy
Page 38 GAO-04-756 Renewable Energy

production tax credit. However, some states offer incentives that help landowners develop wind power projects.
Farmers Find Leasing Is Easier Than Owning Wind Power Projects
Nationwide, farmers and other landowners own less than 1 percent of utility-scale wind power capacity. We found that farmers generally find leasing their land for wind power projects to be easier than owning projects because of the complexity of, and risk associated with, developing a wind power project. In general, development of a project may take 2 years or more from conception to completion, especially when multiple turbines are involved. Table 1 summarizes the major steps in project development. These steps are also discussed in greater detail in appendix V.
Table 1: Major Steps in the Wind Power Project Development Process
Source: GAO analysis of AWEA, NREL, and National Wind Coordinating Committee information.
Note: These steps are not necessarily sequential or mutually exclusive or inclusive.aThe cost of adding connecting lines from the project to high voltage transmission lines can be expensive, adding substantially to a project’s cost.bThe power purchase agreement guarantees that the buyer will purchase the energy from the seller at a negotiated price for a specified period of time, thereby creating a predictable long-term cash flow. This agreement is considered an asset of the project and is usually critical to obtaining financing for it.
The associated capital costs for a wind power project could also be daunting to an individual landowner—approximately $1 million per MW of
Step Conditions generally considered or required
1 Detailed wind data for the proposed project site: local wind data from airports or meteorological stations; wind data on an hourly basis at varying heights for about 1 year; a minimum annual average wind speed of 11 to 13 miles per hour.
2 As applicable, information on the potential effects on birds—particularly endangered or protected species; receptivity of neighbors and local communities; possible obstruction of air traffic by the turbines; interference with aerial crop dusting; possible need for environmental impact assessment.
3 A lease or easement agreement negotiated with the farmer that grants the developer (1) a right of access to and across the property to construct, operate, and maintain the project; (2) a right to transmit the electricity from the property; and (3) a term sufficient for financing the project, usually 25 years or more.
4 Permission to construct and operate the project from local permitting authorities, including land use and construction permits.
5 Easement rights of access to interconnect to transmission lines.a
6 A power purchase agreement between the project owner and the utility that will buy the electricity produced.b
7 Project financing from a bank or other lending institution; and federal or state assistance programs for renewable energy sources.
8 Services and supplies related to site preparation, construction of turbines, substations, and access roads, and operation and maintenance of the project.
Page 39 GAO-04-756 Renewable Energy

generating capacity installed. Thus, even purchasing just one or two utility-scale wind turbines can be a substantial investment for even a large farm or ranch.
Leasing land to a wind power developer relieves a farmer of many of the formidable challenges of developing a wind power project, but the benefits of leasing may depend on the type of the lease arrangement offered. Table 2 summarizes information on lease payment options.
Table 2: Four Types of Lease Payment Options
Source: Oklahoma Wind Power Initiative.
A landowner may need expert advice—from an attorney to ensure the lease protects the landowner’s interests and from a financial adviser to understand the income and tax implications of various lease payment options. For example, University of Texas officials indicated that legal and technical resources available to the university were critical to negotiating a favorable lease agreement for a wind project on university property.
Landowners may also face other problems in leasing land for wind power projects, as illustrated in the following examples:
• A Minnesota wind developer went bankrupt before completing the project. Unable to collect from the developer, the construction contractor that poured the concrete foundations for the turbines placed a lien on the farmer’s land. In the end, the farmer assumed responsibility for completing the project.
Option type Advantages and disadvantages to landowner
Lump sum payment A one-time payment for all turbines placed on the land, with no ongoing royalties. Advantage: provides substantial cash to pay a debt or purchase farm equipment. Disadvantages: precludes benefits from future increases in wind power value and may complicate the sale of the land because a prospective buyer stands to gain nothing from the turbines.
Fixed annual payment A fixed dollar amount per turbine per year. Advantage: minimizes risk of income fluctuation. Disadvantages: prohibits the landowner from benefiting from future increases in wind power value.
Fixed payment plus percentage of revenue
A fixed payment per turbine per year, plus a percentage of the turbines’ gross generated revenue. Advantage: The fixed payment holds even when the wind is low or the turbines do not operate.
Percentage of revenue only A larger percentage of the turbines’ gross generated revenue. Advantage: more profits if wind power values increase. Disadvantage: more risk of not receiving revenue.
Page 40 GAO-04-756 Renewable Energy

• In California, a landowner who leased land to wind developers for 200 turbines had to renegotiate leases with the tenant farmers who also use this land. These farmers charged that they were disadvantaged by the wind power project because (1) the turbines prevented them from using aerial crop dusting; (2) the project created obstacles, such as the turbines, substations, and access roads, that the farmers had to drive their equipment around, causing their fuel costs to rise; and (3) the turbines and associated structures had reduced the acreage available for cultivation (by approximately 40 to 50 acres out of a total of 1,100 acres). Although he lost some revenue from the renegotiated lease agreements with the tenant farmers, the landowner indicated he had more than recouped these losses from the income associated with the lease agreement for the wind turbines. The landowner also said the tenant farmers ultimately benefited by the adjusted (lower) rents for the land they farm.
During our fieldwork, some farmers indicated it was difficult to make informed decisions about owning a wind power project or leasing their land to a commercial wind power developer because of a lack of readily accessible information. One farmer also noted it would be helpful to have a forum in which farmers could exchange relevant information and experiences. A number of entities offer information on wind power, including the pros and cons of ownership versus leasing. These include AWEA, NREL, the Union of Concerned Scientists, Wind Powering America, and Windustry. They also include state-based groups such as the California Wind Energy Collaborative, Iowa Policy Project, Minnesota Sustainable Energy for Economic Development Coalition, Oklahoma Wind Power Initiative, and Texas Renewable Energy Industries Association. However, federal and industry officials said that while access to information is important, it is not enough. According to these officials, given the complexity of owning a wind project or leasing land to a wind power developer, farmers and other rural landowners should seek legal, financial, and technical advice, as appropriate, before making a commitment to a project.
Farmers Generally Cannot Use the Production Tax Credit
Farmers generally cannot use the federal renewable energy production tax credit, which many stakeholder groups view as crucial to making wind energy projects economically viable for project owners because of these projects’ high capital costs. According to Department of Treasury officials, for a farmer who does not materially participate in a wind power project to
Page 41 GAO-04-756 Renewable Energy

make use of the production tax credit,46 the farmer must have tax liability attributable to passive income (e.g., rental income or income from businesses in which the farmer participates only as an investor) against which to claim the production tax credit. Passive income does not include income from the farmer’s active farming business, wage income, or interest and dividend income. Unless a farmer materially participates in the production of wind power, the production tax credit cannot offset tax liability attributable to income from these sources. Since many farmers do not have passive income and do not materially participate in wind power production, this passive versus nonpassive income distinction limits the number of farmers that are able to take advantage of the renewable energy production tax credit. Furthermore, even in a case where a farmer materially participates in and operates a wind project, the value of the tax credit is usually greater than the income tax on the revenue earned by the project for wholesale electricity generation as well as from other relevant sources, such as revenue from the farming business and wage income related to off-farm employment.
Although an individual farmer may not be able to use the full amount of the production tax credit, farmers can benefit from this tax credit in other ways. For example, in Rock County, Minnesota, some farmers interested in wind power have formed two limited liability companies, pooling their individual passive incomes and associated tax liabilities in order to make use of the production tax credit. These arrangements have led to the establishment of two wind power projects, Minwind I and II. Each company has rules similar to a traditional farmer cooperative,47 although legally they are not cooperatives.48 Each company sold stock to more than 30 individuals and required that 85 percent of the shares be owned by farmers; the remaining 15 percent of the shares are available to local residents and investors. No single person can own more than 15 percent of
46Internal Revenue Service Publication 925 defines criteria for material participation in a trade or business activity. For example, an individual materially participates in a trade or business activity if the individual participates more than 500 hours during the tax year.
47In general, a cooperative is an organization formed for the purpose of producing and marketing goods or products owned collectively by members who share in the benefits.
48Rural electric cooperatives and publicly owned municipal utilities are not eligible for the federal production tax credit. However, they may qualify for the federal Renewable Energy Production Incentive that provides cash payments based on electricity production from renewable sources on a per kWh basis. See 10 C.F.R. part 451 (DOE’s regulations setting out its policies and procedures for implementing the incentive program).
Page 42 GAO-04-756 Renewable Energy

the shares. These projects started operating in late 2002, and each has a capacity of 1.9 MW. Furthermore, seven additional Minwind projects (III through IX) are under development in Rock County. When complete, these projects will have 200 local owners and a combined capacity of 12 MW.
In addition, some individual farmers in Minnesota have entered into equity partnerships with an investor in order to benefit from the production tax credit indirectly. In these cases, the investor owns nearly all of the interest in the project for the first 10 years, receiving most of the net cash from the project and the benefits of the production tax credit and accelerated depreciation. After this 10-year period, the ownership switches, or “flips,” to the farmer and the farmer receives most of the project income. For example, at one wind project we visited in Pipestone County, an equity partner owns a 99 percent interest in a 1.5 MW project (two 750 kilowatt turbines) for the first 10 years of the project’s operation. The farmer who provided the land for the project has the other 1 percent interest. The equity partner provided most of the up-front capital needed to establish the project, and the project’s assets provide the collateral for the remaining required debt. However, the equity partner also reaps most of the profits and the benefits of the federal production tax credit. During these first 10 years, the farmer receives lease payments of about $2,000 per year per turbine, plus management service payments of about $30,000 per year, based on a percentage of the revenues associated with the electricity production. After the 10th year, majority ownership of the project will be transferred to the farmer, who will start earning about $120,000 per year through the end of the project’s expected lifetime (an additional 10 years or more). Thus, beginning with the 11th year, the farmer’s annual income from the project will more than triple.
Minnesota Offers Renewable Energy Cash Payments and Other Incentives to Promote Landowner-Owned Wind Power Projects
In addition to the federal tax credit, landowners may benefit from state incentives. For example, Minnesota offers several incentives to promote farmer, rural landowner, and rural business ownership of small wind power projects. Federal and industry officials often cited Minnesota as being particularly proactive in this regard. Table 3 summarizes these incentives.
Page 43 GAO-04-756 Renewable Energy

Table 3: Minnesota Initiatives That Promote Small Landowner-Owned Wind Projects
Source: GAO analysis of information from the Database of State Incentives for Renewable Energy, the Minnesota Public Utilities Commission, and other sources.
aThe renewable energy systems eligible for incentive payments in Minnesota include wind, small hydroelectric, and biomass digester technologies.
According to Minnesota and wind industry officials, the most important of these incentives is the state’s Renewable Energy Production Incentive program. As of December 2003, this program had benefited about 170 renewable energy projects in the state, including 130 wind power projects that are collecting incentive payments and another 43 that have secured eligibility but are not yet operational. According to a Windustry official, more than one-third of the beneficiaries have been farmers and rural small businesses over the life of the program. This official also said that because of current difficult fiscal conditions, it is uncertain whether Minnesota will expand the program beyond the 200 MW cap to assist additional projects.
Incentive Description
Renewable Energy Production Incentive Begun in 1997, this incentive provides payments for 10 years of 1.5 cents per kWh of electricity generated by new renewable projects such as wind with less than 2 MW capacity.a Projects must begin generating electricity within 18 months after approval. The incentive was available only for the first 200 MW of approved projects. Planned capacity for new wind power projects reached the 200 MW goal in November 2003.
Agricultural Improvement Loan Program The state’s Rural Finance Authority provides low-interest loans to farmers for improvements or additions to permanent facilities. Beginning in 1995, the installation of wind power equipment qualifies as an improvement.
Value-Added Stock Loan Participation Program
The state’s Rural Finance Authority provides low-interest loans to farmers to assist them in buying into wind generation cooperatives—45 percent of total loan principal up to $24,000. The maximum size of an individual project is 1 MW.
Interconnection Standards Law The Minnesota Public Utilities Commission is developing uniform interconnection requirements for distributed power generation, including generation from renewable sources such as wind power, applicable to all state utilities. These standards will be available to all qualifying sources of 40 kilowatt generating capacity or less. The law specifies that uniform applications must be developed and that utilities must report annually on the number of distributed systems interconnected.
Standard Power Purchase Agreement In June 2000, Xcel Energy, as part of a state merger stipulation, agreed to work with the state and other interested parties to develop a tariff (surcharge) to benefit renewable energy systems of up to 2 MW generating capacity. In December 2000, the company proposed a wind energy tariff to encourage the development of small wind power projects within the company’s service territory. In August 2001, the commission approved the company’s proposal to purchase power from a qualifying wind power facility at a price of 3.3 cents per kWh for a term of up to 20 years.
Page 44 GAO-04-756 Renewable Energy

USDA Can Do More to Promote Wind Power
USDA has not fully utilized all of the farm bill’s renewable energy provisions to promote wind power development on farms and in rural communities, although it has provided some funding through other provisions of the farm bill. In particular, USDA had not issued a regulation for loans and loan guarantees under the farm bill’s key wind power assistance program—the Renewable Energy Systems and Energy Efficiency Improvements Program (Renewable Energy Program). As a result, although grants are available, farmers and other applicants cannot obtain loans and loan guarantees under this program, which limits the ability of the program to promote renewable energy sources. In addition, USDA may be missing opportunities to leverage information, resources, and expertise available from EPA in implementing the Renewable Energy Program and to simplify the program’s application process.
Farm Bill Provisions Promote Renewable Energy Systems, Including Wind Power, but USDA Has Not Made Full Use of These Provisions
Among other things, the 2002 farm bill promotes the use of renewable energy systems, such as wind turbines, on the nation’s approximately 900 million acres of farmland and rangeland.49 According to USDA and other sources, these farm bill provisions will create economic opportunities in rural communities, give farmers a means to earn additional income, diversify the nation’s energy production, reduce its dependence on imported fossil fuels, and help protect the environment. Table 4 summarizes information on the farm bill provisions for promoting renewable energy systems, including wind power.
49According to USDA, this farm bill was the first one to include an energy title.
Page 45 GAO-04-756 Renewable Energy

Table 4: Farm Bill Provisions to Further Wind Power’s Growth
Source: Pub. L. No. 107-171 (2002 farm bill).
During fiscal year 2003 and through August 2004, USDA has made limited progress in using the farm bill provisions to further the use of renewable energy systems. Table 5 shows the status of USDA’s efforts. As the table shows, in several cases these provisions have not been used yet. In other cases, the provisions cannot be fully used until USDA has developed relevant regulations. USDA officials told us that the newness of these provisions—the farm bill was enacted in May 2002—and the lead time needed to train its staff, disseminate information to the farm community, and develop regulations and publish them in the Federal Register for comment, as appropriate, has slowed the agency’s ability to fully use these provisions.
Pub. L. No. 107-171 Section
Section title or relevant program Provisions
2101 (a) (1) (B) Conservation Reserve Program Biomass and wind turbine installations are now allowed on lands retired in this program. Turbine installation is subject to USDA approval, taking into account the proposed site location, habitat, and purposes of the program, including protection of environmentally sensitive land. Installations do not reduce program payments.
6013 Rural Development Title Extends loans and loan guarantees under the Consolidated Farm and Rural Development Act to renewable energy systems, including wind power projects.
6017 Business and Industry Direct Loan and Loan Guarantee Program
Expands program for rural development, and includes farmer/rancher equity ownership in wind power projects. Limits range from $25 million to $40 million per project.
6401 (a) (2) Value-Added Agricultural Product Market Development Grants
Expands the definition of the term “value-added agricultural product” to include farm- and ranch-based renewable energy. Competitive grants are available to assist producers with feasibility studies, business plans, marketing strategies, and start-up capital. Maximum grant amount is $500,000 per project.
9005 Energy Audit and Renewable Energy Development Program
Competitive grants are available for organizations to assist farmers, ranchers, and rural small businesses by conducting and promoting energy efficiency audits and renewable energy assessments.
9006 Renewable Energy Systems and Energy Efficiency Improvements (Renewable Energy Program)
Offers low-interest loans, loan guarantees, and grants to farmers, ranchers, and rural small businesses to purchase and install renewable energy systems, including wind projects. Grants may fund up to 25 percent of the cost of the project. Combined grants and loans or loan guarantees may fund up to 50 percent of the cost of the project. Provides that $23 million of the funds of the Commodity Credit Corporation be made available each year—for fiscal years 2003 through 2007—for this program.
Page 46 GAO-04-756 Renewable Energy

Table 5: Status of USDA’s Implementation of Farm Bill Provisions That Support Wind Power’s Growth
Source: The 2002 farm bill and USDA information.
Many stakeholders consider the Renewable Energy Program as the key USDA program for promoting renewable energy sources, including wind power, on farms, ranches, or other rural lands. The program focuses on promoting renewable energy generation and energy efficiency improvements and was authorized a total of $115 million—$23 million
Pub. L. No. 107-171 Section
Section title or relevant program Fiscal year 2003 status
Fiscal year 2004 status, as of August 2004
2101 (a) (1) (B) Conservation Reserve Program
Farm Service Agency issued policy guidance stating that farmers with land enrolled in this program may lease this land for renewable energy purposes without affecting the program payments they receive.
Only a few farmers have contacted the agency to discuss the placement of wind turbines on land enrolled in the program.
6013 Rural Development Title Definition of “rural development” changed in draft interim final rule to include renewable energy systems, such as wind power. This rule was being reviewed by OMB as of August 2004. USDA anticipates its publication in the Federal Register by December 2004. No wind power systems financed.
No wind power systems financed.
6017 Business and Industry Direct Loan and Loan Guarantee Program
Program guidelines amended to include renewable energy systems, such as wind power. No wind power systems financed.
No wind power systems financed.
6401 (a) (2) Value-Added Agricultural Product Market Development Grants
Four wind projects received grant funds totaling about $600,000.
No awards had been made.
9005 Energy Audit and Renewable Energy Development Program
Program was not funded. Program was not funded.
9006 Renewable Energy Systems and Energy Efficiency Improvements (Renewable Energy Program)
$23 million in mandatory funds available. Of this amount, $21.7 million in grants offered, including about $7.4 million for wind power, supporting 35 projects. No loans or loan guarantees offered pending USDA’s publication of program regulation. The budget authority for the remaining $1.3 million lapsed because the remaining project applications lacked technical merit.
$23 million in discretionary funds appropriated by Pub. L. No. 108-199. However, this amount was reduced by $136,000 due to rescission under Div. H. § 168(b) of Pub. L. No. 108-199. USDA issued a Notice of Funds Availability on May 5, 2004, to solicit grant proposals. No loans or loan guarantees offered pending USDA’s publication of program regulation.
Page 47 GAO-04-756 Renewable Energy

yearly—for fiscal years 2003 through 2007 for its implementation.50 This funding can be used for loans, loan guarantees, or grants to farmers, ranchers, or rural small businesses.51 Eligible projects include those that derive energy from a wind, solar, biomass, or geothermal source.52
Since passage of the farm bill, USDA has undertaken a number of actions to begin to implement the Renewable Energy Program.
• In November 2002, USDA formed a rural energy working group—with representatives from several USDA agencies as well as DOE and EPA—to strengthen interagency relationships and to leverage information, resources, and expertise to assist in implementing the Renewable Energy Program. This group met again in December 2002 and January 2003.
• In November 2002, USDA issued a Federal Register notice announcing a public meeting to solicit comments and suggestions from stakeholder groups on how to implement the Renewable Energy Program. This meeting was held on December 3, 2002.
• In February 2003, the Under Secretary for Rural Development requested that all Rural Development State Directors designate a Rural Energy Coordinator to, among other things, coordinate the implementation of the Renewable Energy Program.
• In April 2003, USDA issued a Notice of Funds Availability (NOFA) in the Federal Register inviting applications for grant assistance under the Renewable Energy Program for fiscal year 2003. According to this notice, $23 million was available for this program. Applications were initially due by June 6, 2003. In May 2003, USDA issued another NOFA extending the application deadline to June 27, 2003, and clarifying information regarding requirements for financial information and utility interconnection agreements.
50USDA is to carry out this program from the funds of the Commodity Credit Corporation, a government-owned corporation within USDA.
51A rural small business must operate with 500 or fewer employees and $20 million or less in total annual receipts and must be headquartered in a rural area.
52Projects using energy from these sources to produce hydrogen derived from biomass or water are also eligible.
Page 48 GAO-04-756 Renewable Energy

• In August 2003, USDA signed an Interagency Acquisition Agreement with DOE to obtain its assistance in implementing the Renewable Energy Program. Among other things, this agreement calls for DOE to assist USDA in evaluating the technical aspects of proposals submitted for renewable energy projects or energy efficiency improvements. In part, this agreement also helps to fulfill the farm bill’s requirement that USDA consult with DOE in implementing the Renewable Energy Program. USDA’s Rural Development mission area made about $162,000 available for this purpose.
• In August 2003, USDA signed a contract with MACTEC Federal Programs (MACTEC), a consultant, to develop a regulation for the program, including proposed and final regulations to be published in the Federal Register. USDA’s Rural Development mission area made about $317,000 available for this purpose.
• In May 2004, USDA issued a NOFA in the Federal Register inviting applications for grant assistance under the Renewable Energy Program for fiscal year 2004. According to this notice, $22.8 million is available for this program in fiscal year 2004.53 Applications were to be postmarked by July 19, 2004. As of August 2, 2004, USDA indicated that it received a total of 56 applications for wind projects totaling about $10.8 million.54
In fiscal year 2003, wind power projects represented about one-third of the projects selected and grant funds awarded under the Renewable Energy Program, or 35 of the 114 grantees selected and $7.4 million of the $21.7 million awarded. The applicants selected for wind projects included four farmers and 31 rural small businesses located in eight states. Table 6
53USDA’s fiscal year 2004 appropriations act provided $23 million in discretionary funding for the Renewable Energy Program—Consolidated Appropriations Act of 2004, Pub. L. No. 108-199, Div. A, tit. III, 118 Stat. 24 (2004). However, an across-the-board rescission of 0.59 percent applicable to all discretionary programs reduced the amount of funds available by $136,000—Pub. L. No. 108-199, Div. H. § 168(b). Funds appropriated to the Renewable Energy Program are considered 1-year money; i.e., the budget authority for any amount not obligated by the end of the fiscal year in which the funds were appropriated lapses at the end of that year and is no longer available for obligation.
54After the agency’s initial review, including its consideration of factors such as borrower eligibility, project eligibility, and financial need, USDA was still actively considering 48 of these 56 applications as of August 2, 2004. However, these applications are subject to further review, including analysis of their environmental and technical merit.
Page 49 GAO-04-756 Renewable Energy

summarizes the grant assistance provided for renewable energy projects, including wind power, under the program in fiscal year 2003.
Table 6: USDA Grant Assistance for Renewable Energy and Energy Efficiency Projects in 2003
Sources: NREL and USDA.
Note: The distinction between large and small wind projects depends on the capacity of the turbines to be installed. Small projects include installation of a turbine with a capacity of up to and including 100 kW and a generator hub height of 120 feet or less. Any turbine above this threshold is considered large.
Notwithstanding the above actions, USDA’s implementation of the Renewable Energy Program in fiscal year 2004 remains incomplete. Although USDA has issued a NOFA, it will again offer only grants, as was done in fiscal year 2003. According to USDA officials and documents, the Rural Business-Cooperative Service (RBS)—the USDA agency responsible for implementing the program—had planned to issue proposed and final versions of the program regulation during fiscal year 2004 and to make awards of loans and loan guarantees, as well as grants, during the year based on the final regulation. However, RBS was not able to hold to this schedule. According to RBS officials, they underestimated the time that would be needed to develop and process the regulation. In this regard, they cited several factors that have contributed to the time needed.
Renewable technology
Number of awards
Agricultural producers
Rural small businesses
Total amount awarded
Biomass—anaerobic digester 30 25 5
Biomass—bioenergy 17 11 6
Total biomass 47 36 11 $11,475,535
Wind—large 24 1 23
Wind—small 11 3 8
Total wind power 35 4 31 7,412,118
Geothermal/hybridsystems 2 0 2 589,762
Solar 6 5 1 725,566
Building/industrialenergy efficiency 24 13 11 1,504,252
Hydrogen 0 0 0 0
Total 114 58 56 $21,707,233
Page 50 GAO-04-756 Renewable Energy

First, these officials said the Office of Management and Budget (OMB) designated the regulation as “significant” according to Executive Order 12866, as amended.55 A regulation designated as significant is subject to OMB review. Specifically, the executive order provides that significant regulations are subject to review by OMB’s Office of Information and Regulatory Affairs. This office may take up to 90 days for its reviews at the proposed and final regulation stages before publication of the regulation in the Federal Register.56 In addition, the executive order provides that agencies should afford the public a meaningful opportunity to comment on any proposed regulation, which in most cases should include a comment period of not less than 60 days.
Second, USDA has opted to apply the Administrative Procedure Act’s notice of proposed rule making and public comment requirements in certain instances where not required by law. This policy, promulgated by former Secretary of Agriculture Clifford Hardin, was published in the Federal Register in 1971.57 The policy is known informally as the “Hardin memo.” Specifically, this memo provides, in part, that the public participation requirements prescribed by the Administrative Procedure Act, 5 U.S.C. 553 (b) and (c), will be followed by all agencies of the department in rule making relating to public property, loans, grants, benefits, or contracts. Thus, while the act does not require notice and public comment for regulations related to these matters, USDA’s policy is to follow the public participation requirements of the act for these types of regulations as well. USDA officials noted that the Hardin memo is consistent with the recommendations of the Administrative Conference of the United States, and although the memo was promulgated more than 30 years ago, it remains in effect.
Third, delays occurred in contracting with MACTEC. This contract was signed in August 2003, about 15 months after the farm bill’s enactment (May 13, 2002). Specifically, delays occurred with GovWorks, a federal contract acquisition and administration office used by USDA to handle the
55Executive Order No. 12866, Regulatory Planning and Review, 58 Fed. Reg. 51735 (Sept. 30, 1993).
56OMB may return a proposed regulation to an agency for further consideration.
5736 Fed. Reg. 13804 (July 24, 1971).
Page 51 GAO-04-756 Renewable Energy

contract solicitation and administration.58 According to USDA officials, GovWorks took longer than expected to complete the solicitation phase—including advertising the solicitation and performing the initial evaluation of applicants—due to staffing shortages and its responsibilities for other major federal contracts. The solicitation produced a number of applicants, from which four were selected for interview by RBS staff. USDA officials indicated that it took additional time to arrange these interviews. MACTEC was selected from among the final four firms.
Fourth, USDA officials noted that the draft proposed program regulation is a very large document—over 200 pages. Thus, the time needed for review is longer. In early June 2004, USDA officials noted that the draft had been under review within USDA since February and was now in final departmental clearance. Among other offices, the Rural Development mission area, the Office of General Counsel, and the Office of Budget and Program Analysis have reviewed the draft. USDA officials noted that as much as possible, the draft was reviewed concurrently by relevant offices and that the Office of General Counsel assigned one of its attorneys virtually full time to review the regulation in order to expedite that office’s review.
Finally, USDA officials described the Renewable Energy Program as a new and unique program. These officials said that neither USDA nor DOE had a grant or loan program similar to it before its creation in the energy title of the farm bill. Thus, USDA did not have an existing program to use as a model for developing the program regulation. In addition, these officials said that RBS staff were generally not familiar with renewable energy technologies and thus needed to reach out to other agencies, such as DOE and EPA, to obtain technical assistance. They also noted that consultation with DOE is required in section 9006 of the farm bill.
Although USDA officials maintain that the agency’s development in early 2004 of an emergency pilot program for developing renewable energy systems from the use of diseased livestock as a process raw material for energy generation was not a source of delay, it may have been a contributing factor. This pilot program was announced in a NOFA
58GovWorks (GovWorks Federal Acquisition Center) is a Franchise Fund established by Congress and OMB to offer administrative services for procurement throughout the federal government. Organizationally, GovWorks is located in the Department of the Interior’s Minerals Management Service.
Page 52 GAO-04-756 Renewable Energy

published in the Federal Register on May 18, 2004. According to the NOFA, this program is a further action to support USDA’s efforts to address the risks associated with bovine spongiform encephalopathy (BSE), also known as mad cow disease. The NOFA states that RBS expects projects to be constructed that will produce energy through the destruction of diseased cattle.
Under the pilot program, USDA plans to provide guaranteed loans totaling up to $50 million for up to three project proposals. USDA estimates the cost of the pilot to be about $3.1 million, needed to fund the credit subsidy costs. According to USDA officials, these funds will come from the fiscal year 2004 appropriation for the Renewable Energy Program, reducing the funds available to make grant awards under this program by an equivalent amount. Although it will use funds from the Renewable Energy Program, these officials said the pilot program is a distinct 1-year program that will not be addressed in the regulation for the Renewable Energy Program. Instead, the NOFA indicates that the program regulation for USDA’s Business and Industry Loan Guarantee Program is being used as the basis for the delivery of the pilot program, with certain provisions of that regulation revised to accommodate the pilot’s purpose. For example, changes to the guaranteed fee and the percent of guarantee were made to provide a further incentive to lenders to participate in the pilot program.
MACTEC, the same contractor that USDA is using to develop the proposed regulation for the Renewable Energy Program, was also used to develop the NOFA for the pilot program. The original contract with MACTEC was modified for this purpose. Specifically, a contract amendment signed in February 2004 provided for additional payments of about $25,000 for this purpose, increasing the total value of the contract to about $342,000. According to the amendment, MACTEC was to begin work on the NOFA in late February 2004. USDA officials indicated that MACTEC had delivered the draft proposed program regulation for the Renewable Energy Program to USDA for review prior to beginning work on the pilot program, and thus the work on the pilot did not delay the work on the proposed program regulation. However, progress reports prepared by MACTEC in March and April 2004 indicate that there was overlap between the two efforts, although the reports do not make clear whether work on the pilot delayed progress on the program regulation.
Page 53 GAO-04-756 Renewable Energy

USDA’s Inability to Offer Loans and Loan Guarantees under the Renewable Energy Program Limits This Program’s Potential
USDA’s continuing inability to offer loans and loan guarantees under the Renewable Energy Program, as specified in the farm bill, limits the agency’s ability to achieve a much higher program level. For example, according to USDA’s fiscal year 2005 Budget Summary, the Consolidated Appropriations Act for 2004 and the administration’s budget proposal for 2005 provide sufficient funding for the Renewable Energy Program—about $23 million in 2004 and about $11 million in 2005—for $200 million in program level each year, based on a combination of loans, loan guarantees, and grants.59 This is possible because for direct loans and loan guarantees, program funds would be needed only for the credit subsidy cost.60 Otherwise, direct loans are made from funds borrowed from the U.S. Treasury, and guaranteed loans are made by private lending institutions. Thus, a greater number of renewable energy projects could be financed. In addition, providing loans or loan guarantees in conjunction with grants could provide individual recipients with a greater level of assistance. That is, while grants can be used to pay up to 25 percent of the eligible project costs, a combination of grants and loans or loan guarantees may be used to pay up to 50 percent of the eligible costs.61 In addition, loans may be a more cost-effective way to provide federal assistance than outright grants, as the funds used for loans are repaid by the recipient.
USDA’s continuing inability to offer loans and loan guarantees under the Renewable Energy Program also limits the program’s potential benefits and the agency’s ability to achieve one of its performance goals: to increase
59As discussed, the $23 million appropriated for the Renewable Energy Program in fiscal year 2004 was reduced by $136,000 per a rescission, leaving $22.864 million available. Of this amount, the emergency pilot program will use an estimated $3.1 million, reducing the funds available to make grants under the Renewable Energy Program to about $19.8 million. The administration’s budget proposal for fiscal year 2005 includes $10.77 million in discretionary funds for the Renewable Energy Program.
60The credit subsidy cost is the estimated long-term cost to the government of a direct loan or loan guarantee, excluding administrative costs. Specifically, it is the present value—over the life of the loan or guarantee—of payments by the government minus estimated payments to the government.
61In determining the amount of a grant or loan, section 9006 of the farm bill requires USDA to consider, as applicable, (1) the type of renewable energy system to be purchased; (2) the estimated quantity of energy to be generated by the system; (3) the expected environmental benefits of the system; (4) the extent to which the system will be replicable; (5) the amount of energy savings expected to be derived from the activity, as demonstrated by an energy audit; (6) the estimated length of time it would take for the energy savings generated by the activity to equal the cost of the activity; and (7) other factors, as appropriate. In addition, applicants must demonstrate financial need to receive a grant.
Page 54 GAO-04-756 Renewable Energy

economic opportunity in rural areas. For example, USDA’s fiscal year 2005 Budget Explanatory Notes indicate that the $21.7 million in grant awards made in fiscal year 2003 under the Renewable Energy Program resulted in an estimated 736 jobs created or saved and 100 million kWh of electricity generated. However, the agency estimates that the addition of loans and loan guarantees in fiscal year 2004 would result in (1) a program of about $200 million, (2) an estimated 7,169 jobs created or saved, and (3) 888 million kWh of electricity generated.62 Jobs created or saved and electricity generated are identified as key performance measures in the Budget Explanatory Notes.
USDA’s ability to offer loans and loan guarantees is also important because of uncertainty regarding the Renewable Energy Program’s future funding. Although the program was fully funded in fiscal years 2003 and 2004, the administration’s budget proposal for fiscal year 2005 provides only $10.77 million of the $23 million authorized in the farm bill. If enacted as proposed, this level of funding would represent less than 50 percent of the resources authorized for the program. Since direct loans and loan guarantees require appropriations for only the credit subsidy cost, not their full face value, they may result in making more financing available at less cost to the government than outright grants. Also, the ability to leverage greater amounts of private financing with loan guarantees would take on added importance. Many stakeholder organizations, including AWEA, the Environmental and Energy Study Institute, the American Council for an Energy-Efficient Economy, and the Environmental Law and Policy Center, have expressed concerns regarding this proposed cut.
USDA’s Ability to Offer Loans and Loan Guarantees under the Renewable Energy Program in Fiscal Year 2005 Is Uncertain and Questions Remain
In June 2004, USDA officials indicated that they anticipate publishing the final regulation for the Renewable Energy Program in late spring 2005. Specifically, documentation related to the agency’s contract with MACTEC indicates that the final regulation will be published in the Federal Register on May 31, 2005. Assuming this schedule is met, only 4 months in fiscal year 2005 would remain for (1) USDA to issue a notice in the Federal Register
announcing the availability of funds for loans, loan guarantees, and grants; (2) program applicants to prepare project proposals and applications, including obtaining professional assistance from an engineer, financial adviser, or environmental consultant; and (3) USDA to receive and analyze
62We did not independently assess the validity of these estimates.
Page 55 GAO-04-756 Renewable Energy

program applications and to consult with DOE or EPA, as appropriate, regarding the technical merit of the proposals. USDA officials acknowledged that this would be a very tight schedule, but expressed the view that they could offer loans and loan guarantees in fiscal year 2005 if this schedule is met.
However, questions remain as to when the proposed and final program regulation will be published. The proposed regulation completed final departmental clearance on June 23, 2004, and was sent to OMB for review. As noted, OMB may take up to 90 days for its review. USDA must then make revisions to the proposed regulation to address OMB’s comments before its publication in the Federal Register for public comment. USDA has already revised its target date for publishing the proposed regulation several times—from November 17, 2003, to May 24, 2004, to the fall of 2004. Similarly, it has revised its target date to publish the final regulation from June 7, 2004, to May 31, 2005.
USDA officials said that 60 days would be allowed for public comment on the proposed regulation after its publication. In addition, they said they expect a large volume of comments and that it will take time to review these comments and consider revisions to the regulation. These officials said they would consider options to speed up the agency’s review, including detailing additional staff to assist with this work. Once USDA has completed its review of the comments and revised the regulation, as appropriate, the agency will submit the final regulation to its internal clearance process and then to OMB for review. Regarding its internal clearance process, USDA officials said they would consider doing concurrent reviews to speed up this process. However, these officials noted that RBS lacks the authority or control to compel other offices in USDA to expedite their reviews of the program regulation. These officials noted that USDA’s Office of Budget and Program Analysis is responsible for overseeing the timely completion of this clearance process. Regarding OMB’s review, this agency again may take up to 90 days for its review.63
Any unanticipated problems could affect USDA’s current plan to issue the proposed regulation by the fall of 2004 and the final regulation by May 31, 2005. As noted, many delays already have been experienced in developing
63According to Executive Order 12866, as amended, if there has been no material change in the facts and circumstances upon which the regulatory action is based, OMB’s review should be completed within 45 days.
Page 56 GAO-04-756 Renewable Energy

this regulation. Further delays, possibly pushing the publication date for the final regulation beyond May 31, 2005, would likely preclude USDA from offering loans and loan guarantees in fiscal year 2005, as was the case in fiscal years 2003 and 2004. The Renewable Energy Program was authorized for 5 years—fiscal years 2003 through 2007. If USDA is unable to offer loans and loan guarantees again in fiscal year 2005, only 2 years will remain to utilize all of the financial mechanisms provided by the legislation. As noted, utilization of these mechanisms would increase the program level and benefits. In this regard, eight members of the Senate Agriculture Committee sent a letter to USDA in June 2004 noting that a third year without a final regulation in place could impede and undermine the full potential of the Renewable Energy Program. Accordingly, they urged USDA to issue the proposed and final rules as soon as possible.
Another concern is staffing. RBS’s Processing Branch has lead responsibility for implementing the Renewable Energy Program. This branch is also responsible for administering five other national grant or loan programs.64 According to USDA officials, the branch has been able to implement the Renewable Energy Program as a grant program to date without the need for additional staff. However, these officials said that once USDA starts to offer loans and loan guarantees under the Renewable Energy Program, staffing could become an issue. Currently, the branch has four program specialists in addition to the Branch Chief. According to the Chief, administering a loan program is more complicated than a grant program, and therefore a loan program requires more staff resources and time. For example, administering a direct loan program requires agency resources to handle loan origination, processing, and servicing functions.
USDA Has Taken Some Actions to Promote Wind Power through Other Programs
Aside from its actions to implement specific provisions of the 2002 farm bill to promote wind power, USDA has provided additional assistance for this purpose under several of its programs. For example:
• From May 1997 through March 2004, USDA provided about $13.3 million in grant and loan assistance to 25 rural electric cooperatives or small businesses to procure or manufacture small wind turbines for on-farm use.
64These programs are the Rural Business Enterprise Grant Program, Rural Business Opportunity Grant Program, Intermediary Relending Program, Rural Economic Development Loan Program, and Rural Economic Development Grant Program.
Page 57 GAO-04-756 Renewable Energy

• In 2001, the Animal and Plant Health Inspection Service entered into an agreement with a local utility to purchase 25 percent of the electricity used at its National Wildlife Research Center in Colorado from wind-generated sources.
• In fiscal year 2003, USDA provided a $2.5 million grant under its High Energy Cost Program to the Alaska Village Electric Cooperative to address high energy costs in Chevak, Alaska, an impoverished community of about 800 residents. Among other things, the funds will be used for a wind generation system.
• In October 2003, USDA signed a memorandum of understanding with the National Rural Electric Cooperative Association to increase the use of renewable resources to generate electricity. The agreement provides for cooperation in conducting renewable energy technology research and for conducting education and outreach to promote the use of renewable energy resources, such as biomass, solar, and wind power, in rural areas.
• The Agricultural Research Service conducts research and development to lower the costs of wind generation for isolated farms, ranches, and rural communities that lack access to affordable and reliable electrical energy. Currently, the service is conducting research with Sandia National Laboratories on lowering the costs of wind turbine blades, which account for more than 50 percent of the cost of new wind turbines.
USDA May Have Opportunities to Obtain Additional Assistance from EPA
In implementing the Renewable Energy Program, USDA may also be missing opportunities to obtain further assistance from EPA. USDA’s rural energy working group included a representative from EPA’s AgStar Program, but this program is focused solely on the production of power from the anaerobic digestion of biomass such as livestock manure.65 According to EPA officials, other EPA offices also may be able to offer information, resources, and expertise to assist USDA’s implementation of the Renewable Energy Program for other renewable sources, including wind power. For example, an official in EPA’s Office of Air and Radiation said that this office has extensive contacts with the electric power utilities
65The anaerobic digestion of biomass produces methane gas, which can be used to power a generator that produces electricity.
Page 58 GAO-04-756 Renewable Energy

through its Green Power Partnership Program, and could therefore help Renewable Energy Program applicants find buyers for the electricity they will generate and negotiate related power purchase agreements. In addition, this office could help answer applicants’ questions on project site selection and permitting for environmental impacts, where applicable.
USDA officials said they recognize that other EPA offices may be able to offer assistance and that they would welcome such assistance. However, these officials noted that the rural energy working group has not met since January 2003, having identified at that time the information, resources, and expertise available from the group’s participants to assist USDA’s implementation of the Renewable Energy Program. There are no plans for the group to meet again. More recently, USDA officials indicated that they are considering an interagency acquisition agreement with EPA to obtain technical assistance from the AgStar program in reviewing project proposals for anaerobic digestion. This agreement would be similar to the agreement USDA has with DOE regarding the review of project proposals for other renewable energy technologies. According to the Chief of RBS’s Processing Branch, he has had discussions with the lead EPA official for the AgStar program as to whether other EPA offices should be included in this agreement; as of June 2004, USDA officials said this matter was still under discussion.
Stakeholders Are Concerned about the Complexity and Short Time Frames for Submitting Applications under the Renewable Energy Program
Various stakeholders have expressed concerns about the complexity and short time frames for submitting grant applications under the Renewable Energy Program. For example, in the course of our fieldwork during 2003, we heard a number of concerns from farmers and others about the complexity of this application process and the short time frames for completing and submitting applications. The applications must include economic feasibility studies, tentative agreements with an electricity buyer, financial information demonstrating need under the program, and information for completing environmental assessments. USDA officials acknowledged some of these concerns and indicated they have been and continue to look for ways to simplify the application process. However, these officials also cautioned that renewable energy projects are, by their nature, legally, technically, and financially complicated ventures, and, consequently, it is not surprising that applicants might find the application process difficult and need the assistance of an attorney, engineer, or financial consultant.
Page 59 GAO-04-756 Renewable Energy

Regarding the complexity of the application process, USDA officials noted they have applied lessons learned from the agency’s experience under the fiscal year 2003 grant program to the fiscal year 2004 program. The NOFA for the fiscal year 2003 program invited comments from applicants and other stakeholder groups. USDA officials said they considered these comments and other subsequent comments that have been received from various stakeholders over the past year. As a result, the NOFA for the fiscal year 2004 grant program is about three times as long as the one for the previous year. Among other changes, the 2004 NOFA contains specific application guidance for each renewable energy technology covered by the program.
Regarding time frames, USDA initially gave applicants 2 months to submit their applications under the fiscal year 2003 grant program. Specifically, USDA issued a NOFA in the Federal Register on April 8, 2003, with a requirement that applications be postmarked no later than June 6, 2003. However, in part because of complaints from applicants and other stakeholders regarding the short time frame, USDA issued a subsequent notice in the Federal Register on May 19, 2003, to extend the application deadline to June 27, 2003.66 As for the fiscal year 2004 program, USDA issued the NOFA on May 5, 2004, with a requirement that the applications be postmarked no later than 75 calendar days after the date of the published notice (July 19, 2004). Although USDA’s issuance of the 2004 NOFA fell a month later in the fiscal year than the 2003 NOFA’s issuance and the time frame allowed under the 2004 NOFA is shorter than that allowed under the 2003 NOFA (including the extension), USDA officials said they believed the time allowed in 2004 is sufficient. They noted that the guidance in the 2004 NOFA is more detailed than the 2003 NOFA. They also said that the agency’s rural energy coordinators encouraged potential program applicants to begin pulling together information needed for environmental assessments even before the 2004 NOFA was published.
In June 2004, USDA officials also said they expect to receive further detailed comments on the application process and other aspects of the program when the proposed program regulation is published in the Federal
Register for comment later in 2004. These officials indicated they would use these comments to consider further refinements to the application
66USDA also issued the subsequent notice to clarify the financial requirements for agricultural producers and requirements for utility interconnection agreements and power purchase arrangements.
Page 60 GAO-04-756 Renewable Energy

process. Also in June 2004, we discussed with these officials the potential advantages of surveying program applicants, the agency’s rural energy coordinators, and other stakeholders, as appropriate, regarding their views as to how the application process could be improved and streamlined. We suggested that a survey would comprehensively document problems and related suggestions to better inform USDA as to the severity or extent of the problems cited and whether corrective actions are warranted. USDA officials indicated they did not think a survey is needed in addition to the comments already received and those expected after publication of the proposed regulation. They also noted the rural energy coordinators often provide information on problems or concerns related to the application process during monthly conference calls with USDA’s Rural Development state offices.
Conclusions USDA has yet to utilize all of the financial mechanisms of the farm bill’s Renewable Energy and Energy Efficiency Improvements Program. Among other things, USDA has not issued the final program regulation yet that would allow it to offer loans and loan guarantees, as well as grants. The addition of loans and loan guarantees would allow USDA to achieve a much higher level of program activity, potentially increasing the number of projects financed and providing benefits such as increased economic opportunities in rural areas. Loans may also be a more cost-effective way to provide federal assistance than outright grants. In addition, the provision of loans or loan guarantees in conjunction with grants would enable USDA to offer a greater level of assistance to program applicants.
While USDA has taken a number of actions to coordinate its efforts to implement the program internally and externally, it may be missing opportunities to leverage information, resources, and expertise that may be available from EPA, such as from EPA’s Office of Air and Radiation.
Finally, applicants and other stakeholders have raised concerns regarding the complexity of the application process for the program, as well as the limited time frame provided for submitting these applications. USDA’s continued collection and consideration of these concerns may identify ways to improve and streamline this process.
Recommendations To ensure USDA’s timely and effective implementation of the farm bill’s Renewable Energy Systems and Energy Efficiency Improvements Program,
Page 61 GAO-04-756 Renewable Energy
we recommend that the Secretary of Agriculture direct the Rural Business-Cooperative Service to take the following actions:
• Work with other USDA offices, such as the Office of General Counsel and the Office of Budget and Program Analysis, to identify possible ways to accelerate the development of the program regulation to ensure that all of the funding mechanisms required by the farm bill, including loans and loan guarantees, be made available as expeditiously as possible.
• Work with EPA to identify other EPA offices, such as the Office of Air and Radiation, which may be able to offer information, resources, and expertise to assist USDA in its implementation of this program.
• Continue to examine ways to simplify, improve, and streamline the application process for the program, and as part of that effort, consider the views of program applicants, the agency’s rural energy coordinators, and other interested stakeholders.
Agency Comments We provided a draft of this report to USDA for review and comment. We received written comments from USDA’s Acting Under Secretary for Rural Development, which are reprinted in appendix VI. USDA also provided us with suggested technical corrections, which we have incorporated into this report, as appropriate.
USDA agreed with our recommendations and provided information on how it planned to implement them. Specifically, the Acting Under Secretary for Rural Development stated that the agency is continuing to expedite the development of the program regulation, noting that it is in the best interests of all parties to expedite the rule making process. This official stated further that the agency would work with EPA officials to identify EPA offices that could provide USDA with information, resources, or expertise to implement the program and that a draft interagency agreement, which it planned to execute before the end of the fiscal year, would allow USDA to fund specific support activities provided by EPA. Finally, this official stated that the agency would continue to examine ways to simplify the program application process through consultation with DOE, EPA, and other interested stakeholders, including those commenting on the proposed rule making during its 60-day comment period.
Page 62 GAO-04-756 Renewable Energy

We also provided a draft of this report to DOE and EPA for review and comment. These agencies provided us with suggested technical corrections, which we incorporated into the report, as appropriate.
As agreed with your office, unless you publicly announce its contents earlier, we plan no further distribution of this report until 30 days from the date of this letter. We will then send copies to interested congressional committees; the Secretary of Agriculture; the Secretary of Energy; the Administrator, Energy Information Administration; the Director, Office of Management and Budget; and other interested parties. We will also make copies available to others on request. In addition, the report will be available at no charge on GAO’s Web site at http://www.gao.gov.
If you have any questions about this report, please contact me at (202) 512-3841. Key contributors to this report are listed in appendix VII.
Sincerely yours,
Lawrence J. Dyckman Director, Natural Resources and Environment
Page 63 GAO-04-756 Renewable Energy

Appendix I
AppendixesObjectives, Scope, and Methodology Appendix I
At the request of the Ranking Democratic Member, Senate Committee on Agriculture, Nutrition, and Forestry, we agreed to examine (1) the amount of wind power generation in relation to all U.S. electricity generation and the prospects for wind power’s growth, (2) the contribution of wind power generation to farmers’ income and to the economic well-being of rural communities in the 10 states with the highest wind power generation capacity, (3) the advantages and disadvantages for farmers and rural communities of owning a wind power project or leasing their land to a commercial wind power developer, and (4) the efforts of the U.S. Department of Agriculture (USDA) to promote the development of wind power on farms and in rural communities.
To determine the amount of wind power generation in relation to all U.S. electricity generation and the prospects for wind power’s growth, we interviewed officials or reviewed the documentation they provided at the Department of Energy’s (DOE) Energy Information Administration (EIA), Office of Energy Efficiency and Renewable Energy, National Renewable Energy Laboratory (NREL), and Wind Powering America program. We also interviewed officials or reviewed documentation from the American Wind Energy Association (AWEA), Bonneville Power Administration, Edison Electric Institute, Electric Power Research Institute, Environmental and Energy Study Institute, Interstate Renewable Energy Council, Windustry (a rural-based, wind stakeholder organization), Union of Concerned Scientists, Energy Foundation, California Wind Energy Collaborative, and National Corn Growers Association. From these sources we were able to determine the extent of wind power capacity installed in the United States, including a state-by-state breakdown, and information on the wind potential of various parts of the United States.
These sources also provided information on prospects for wind power’s growth, including factors that may either constrain or promote it. Regarding these factors, we also reviewed our own past work, relevant publications of the Congressional Budget Office and the Congressional Research Service, and applicable laws, regulations, and executive orders. Concerning one of these factors—production tax credits—we spoke with staff of the Congressional Joint Tax Committee and the Department of Treasury, as well as two tax lawyers and a certified public accountant who specialize in these tax issues. In addition, we reviewed relevant literature addressing the growth potential of wind power and discussed data related to these projections with DOE officials.
Page 64 GAO-04-756 Renewable Energy

Appendix I
Objectives, Scope, and Methodology
We also asked EIA to use its National Energy Modeling System to forecast wind power’s growth by 2025 under two scenarios. EIA uses this computer-based model to annually forecast future energy supply, demand, and prices, typically over a 20-year period.1 The model uses assumptions regarding economic growth; changes in world energy prices; technology, demographic, and other trends; and the possible changes to current laws and regulations. In short, the first scenario—EIA’s reference case—assumed that the authorization for the federal production tax credit would expire and not be available after December 2003. The second scenario assumed that authorization for the production tax credit would continue through December 2010.2 Other assumptions, including those for demographic and other trends, price increases for fossil resources, and current laws and regulations, were held constant in modeling these scenarios. In addition, EIA assumed that further design and technological improvements in turbines—known as the “learning effect”—would occur in both scenarios. However, the agency assumed that this effect would be greater in the second scenario due to the continued availability of the production tax credit. Specifically, the continued availability of this credit would lead to greater interest in wind power, spurring further design and technological improvements. These improvements would result in more efficient and productive turbines, making wind power more competitive with fossil fuels.
To determine the contribution of wind power generation to farmers’ income and to the economic well-being of rural communities in the 10 states with the highest wind power generation capacity, we started with the information collected above to identify the relevant states. In particular, we used data developed by DOE and AWEA to determine the 10 states with the largest amount of wind power generating capacity as of December 2002; these states represented about 90 percent of the nation’s wind generating capacity at that time.3 From this list of 10 states, we selected 5 states to visit: the 4 states with the largest generating capacity—California, Texas, Minnesota, and Iowa—and the state—Colorado—that had the 10th largest
1The National Energy Modeling System and EIA forecasts made with this model are discussed in Annual Energy Outlook 2004, with Projections to 2025, DOE/EIA-0383(2004), January 2004. See also www.eia.doe.gov.
2EIA assumed that the value of the production tax credit is kept at an inflation-adjusted 1.8 cents per kWh in year 2002 dollars.
3As of December 2002, these 10 states were California, Colorado, Iowa, Kansas, Minnesota, Oregon, Texas, Washington, West Virginia, and Wyoming.
Page 65 GAO-04-756 Renewable Energy

Appendix I
Objectives, Scope, and Methodology
capacity. We chose Colorado as a point of contrast—unlike the top four states, Colorado had few state programs to promote wind power. For each state, we collected information on the number of farms; the types of agriculture crops produced; total farm income; farm, ranch, and rural lands acreage; wind energy generation sources; and state policies and financial and tax incentives designed to encourage wind power development. We obtained this information from a variety of sources, including USDA’s Farm Services Agency, Economic Research Service, and National Agricultural Statistics Service, and state and local taxing authorities.
In the five states, we then visited nine wind projects in 10 counties to obtain information on specific wind power projects.4 In addition, we visited two other wind projects during the course of our work, but we did not obtain detailed information on these projects. To select the projects visited, we compared lists of wind projects for each state; we obtained these lists from AWEA, Windustry, and the states of California, Iowa, and Minnesota. From these lists we selected a mixture of leased, farmer-owned, and community-operated wind projects that also were geographically dispersed within a state. In addition to operating projects, we sought information on projects that may have failed in the past 5 years; however, federal, state, and local officials were unaware of any such failures in these states.
Our work focused on utility-scale wind power projects—projects that generate at least 1 megawatt (MW) of electric power (from one or more turbines) annually for sale to a local utility. Utility-scale wind power accounts for over 90 percent of wind power generation in the United States. In addition, we defined “community projects” as those operated by a municipal or rural utility or by a school district. At the project locations, we generally met with landowners, project owners and investors, state and local taxing authorities, community leaders, and electric utility officials. To some extent, our work was limited because we did not have access to cost and income data of a proprietary nature. In other cases, we were able to obtain this information but used it only to develop ranges.
In addition, we asked NREL to model the economic impact of wind power projects on the counties we visited. Specifically, we asked NREL to use its Wind Impact Model to assess the employment and income impacts of three hypothetical scenarios on the 10 counties included in our visits. The
4In some cases, we visited more than one project in a county. In other cases, a project straddled two counties.
Page 66 GAO-04-756 Renewable Energy

Appendix I
Objectives, Scope, and Methodology
scenarios were (1) a 150 MW project that is owned by an out-of-state firm, (2) a 40 MW project that is owned by an out-of-state firm, and (3) several small projects with total capacity of 40 MW that are owned by county residents. This modeling work, including related assumptions, is discussed in greater detail in appendix III.
To determine the advantages and disadvantages for farmers and rural communities of owning a wind power project or leasing their land to a commercial wind power developer, we interviewed officials or reviewed documentation from DOE’s NREL and Wind Powering America program; AWEA; the Environmental and Energy Study Institute; the National Wind Coordinating Committee; Windustry; the Izaak Walton League of America; and the Union of Concerned Scientists. The documentation we reviewed covered issues such as wind project economics and development, research, technology, site selection, electricity transmission, economic and legal constraints, and various federal and state incentives. We also discussed these issues with farmers, landowners, wind project investors, state and local government officials, including local taxing authorities, and others during the course of our site visits.
To determine USDA’s efforts to promote the development of wind power on farms and in rural communities, we interviewed officials or reviewed documentation from USDA’s Agricultural Research Service, Economic Research Service, Office of Energy Policy and New Uses, Natural Resources Conservation Service, Rural Business-Cooperative Service, Rural Utilities Service, and Office of General Counsel. In particular, we reviewed USDA’s efforts to implement the Renewable Energy Systems and Energy Efficiency Improvements Program (Renewable Energy Program) provided for in section 9006 of the 2002 Farm Security and Rural Investment Act (farm bill). We also spoke with USDA officials and reviewed documents they furnished to determine the extent to which USDA provided assistance under other rural development loan or grant programs for wind project research, planning, or construction. In addition, regarding USDA’s implementation of the Renewable Energy Program, we discussed USDA’s consultation with DOE and the Environmental Protection Agency (EPA) with officials from all three agencies. Furthermore, during our site visits in the selected states, we discussed with farmers, ranchers, and rural small business officials the financial or technical assistance they may have received from USDA or other federal agencies in developing their wind power projects. We also discussed with them their experiences with the application process for seeking assistance under the section 9006 program, including obtaining information on the
Page 67 GAO-04-756 Renewable Energy

Appendix I
Objectives, Scope, and Methodology
program and completing the application, as well as obtaining information and assistance from USDA or other sources on the factors—economic, technical, and legal—that need to be considered before embarking on a wind project. Finally, we reviewed written comments submitted to USDA in response to a December 2002 public meeting to solicit suggestions from interested stakeholders about USDA’s implementation of the section 9006 program.
Finally, to get a better sense of what the federal government is doing more generally to promote wind power generation and how these efforts may be coordinated with USDA’s efforts to foster its development on farms and in rural communities, we spoke with officials or reviewed documentation from DOE, USDA, the Department of Defense, the Department of the Interior, and EPA.
We conducted our review from February 2003 through August 2004 in accordance with generally accepted government auditing standards. We did not independently verify the data obtained from the sources noted above. However, as appropriate, we discussed with these sources the measures they take to ensure the accuracy of these data. These measures seemed reasonable. Appendix II provides further information on the sources used in our work.
Page 68 GAO-04-756 Renewable Energy

Appendix II
Sources for Information on Wind Power Generation Appendix II
Following are the names, addresses, and Web sites for sources of information on wind power generation used in our work.
American Wind Energy Association 122 C Street, NW, Suite 380 Washington, DC 20001 (202) 383-2504 www.awea.org
California Wind Energy Collaborative University of California, Davis One Shields Avenue Davis, CA 95616 (530) 752-7741 www.cwec.ucdavis.edu
Edison Electric Institute Alliance of Energy Suppliers 701 Pennsylvania Avenue, NW Washington, DC 20004-2696 (202) 508-5652 www.eei.org/alliance
Electric Power Research Institute 3412 Hillview Avenue P.O. Box 10412 Palo Alto, CA 94304 (800) 313-3774 www.epri.com
Energy Information Administration U.S. Department of Energy Forrestal Building 1000 Independence Avenue, SW Washington, DC 20585 (202) 586-6582 www.eia.doe.gov
Page 69 GAO-04-756 Renewable Energy

Appendix II
Sources for Information on Wind Power
Generation
Environmental and Energy Study Institute 122 C Street, NW, Suite 630 Washington, DC 20001 (202) 628-1400 www.eesi.org
Interstate Renewable Energy Council P.O. Box 1156 Latham, NY 12110-1156 (518) 458-6059 www.irecusa.org
Izaak Walton League of America Midwest Office 1619 Dayton Avenue, #202 St. Paul, MN 55104 (651) 649-1446 www.iwla.org
Minnesota Department of Commerce Energy Information Center 121 7th Place East, Suite 200 St. Paul, MN 55101 (800) 657-3710 www.commerce.state.mn.us
National Renewable Energy Laboratory National Wind Technology Center 1617 Cole Boulevard Golden, CO 80401 (303) 384-6979 www.nwtc.nrel.gov
National Rural Electric Cooperative Association 4301 Wilson Boulevard Arlington, VA 22203 (703) 907-5500 www.nreca.org
Page 70 GAO-04-756 Renewable Energy

Appendix II
Sources for Information on Wind Power
Generation
National Wind Coordinating Committee 1255 23rd Street, NW Washington, DC 20037 (888) 764-WIND www.nationalwind.org
Union of Concerned Scientists Energy Program 2 Brattle Square Cambridge, MA 02238 (617) 547-5552 [email protected]
Utility Wind Interest Group 2111 Wilson Boulevard, Suite 323 Arlington, VA 22201-3001 (703) 351-4492, ext. 121 www.uwig.org
U.S. Department of Agriculture Agricultural Research Service Conservation and Production Research Laboratory P.O. Drawer 10 2300 Experiment Station Rd. Bushland, TX 79012 (806) 356-5734 www.cprl.ars.usda.gov
U.S. Department of Agriculture Rural Business-Cooperative Service Renewable Energy and Energy Efficiency Program 1400 Independence Avenue, SW Washington, DC 20250 (202) 720-1497 www.rurdev.usda.gov/rbs/farmbill/index.html
Page 71 GAO-04-756 Renewable Energy

Appendix II
Sources for Information on Wind Power
Generation
U.S. Department of Energy Wind Energy Program Forrestal Building 1000 Independence Ave., SW Washington, DC 20585 (202) 586-5348 www.eren.doe.gov/wind
Windustry 2105 First Avenue S. Minneapolis, MN 55404 (612) 870-3461 www.windustry.org
Page 72 GAO-04-756 Renewable Energy

Appendix III
Results of NREL Modeling on Potential Economic Impacts of Wind Power on Rural Communities Appendix III
We asked NREL to model the economic impact of wind power projects on the counties we visited during our review. This appendix describes the model used for the analysis, including the key data inputs and parameters. It also describes the model results.
NREL has retained the services of MRG & Associates, a consulting firm (the firm) that specializes in energy economic analysis. The firm developed the Wind Impact Model (the model) to assess the impact of wind power investments on employment, earnings, and economic output at the state and local levels. Economic output as defined in the model is a measure of economic activity (value of production) on the state or local level that is similar to the measure of the gross domestic product on the national level. For simplicity, this appendix refers to economic output as “income.”
We asked NREL to assess the employment and income impacts of three hypothetical scenarios on 11 counties in the five states we visited. The scenarios are: (1) a 150 MW project that is owned by an out-of-state firm, (2) a 40 MW project that is owned by an out-of-state firm; and (3) several small projects totaling 40 MW of capacity that are owned by county residents. Table 7 lists the 11 counties for which the firm conducted the analysis. We selected these counties because we determined that the NREL analysis would be an appropriate complement to our visits. We also believed that our visits would give us some general sense of the economic conditions of the counties, helping us judge the differences in assumptions regarding the counties in NREL’s modeling.
Page 73 GAO-04-756 Renewable Energy
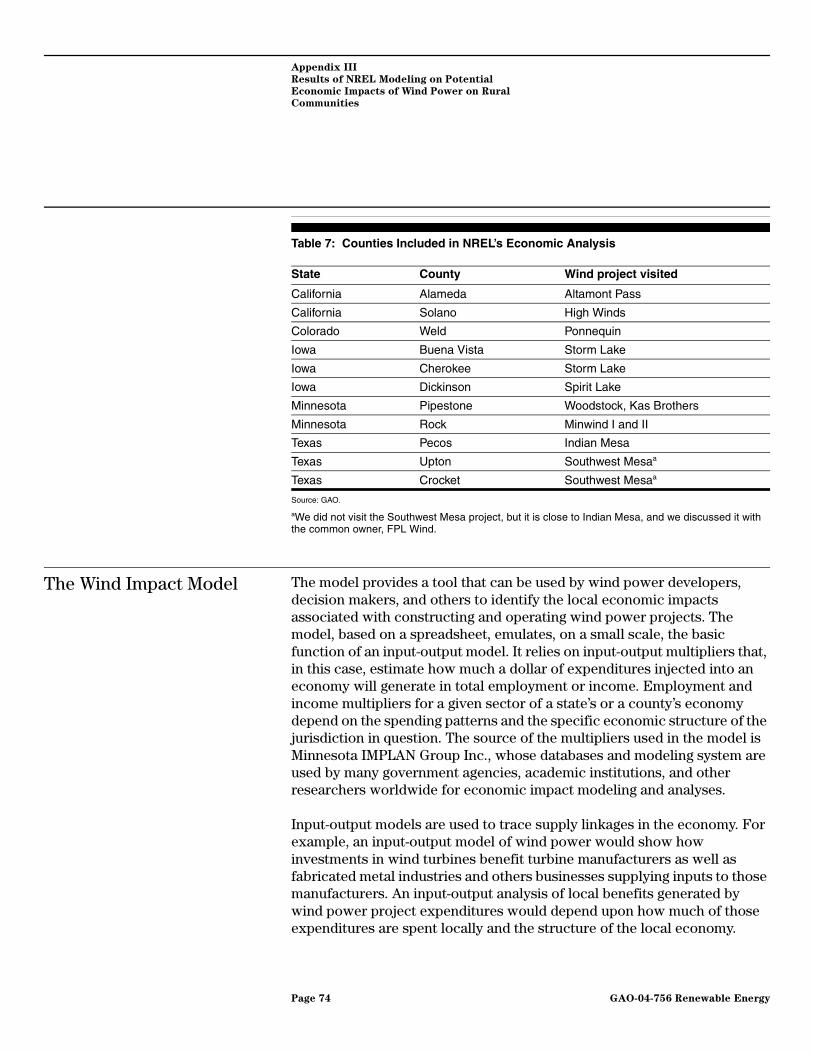
Appendix III
Results of NREL Modeling on Potential
Economic Impacts of Wind Power on Rural
Communities
Table 7: Counties Included in NREL’s Economic Analysis
Source: GAO.
aWe did not visit the Southwest Mesa project, but it is close to Indian Mesa, and we discussed it with the common owner, FPL Wind.
The Wind Impact Model The model provides a tool that can be used by wind power developers, decision makers, and others to identify the local economic impacts associated with constructing and operating wind power projects. The model, based on a spreadsheet, emulates, on a small scale, the basic function of an input-output model. It relies on input-output multipliers that, in this case, estimate how much a dollar of expenditures injected into an economy will generate in total employment or income. Employment and income multipliers for a given sector of a state’s or a county’s economy depend on the spending patterns and the specific economic structure of the jurisdiction in question. The source of the multipliers used in the model is Minnesota IMPLAN Group Inc., whose databases and modeling system are used by many government agencies, academic institutions, and other researchers worldwide for economic impact modeling and analyses.
Input-output models are used to trace supply linkages in the economy. For example, an input-output model of wind power would show how investments in wind turbines benefit turbine manufacturers as well as fabricated metal industries and others businesses supplying inputs to those manufacturers. An input-output analysis of local benefits generated by wind power project expenditures would depend upon how much of those expenditures are spent locally and the structure of the local economy.
State County Wind project visited
California Alameda Altamont Pass
California Solano High Winds
Colorado Weld Ponnequin
Iowa Buena Vista Storm Lake
Iowa Cherokee Storm Lake
Iowa Dickinson Spirit Lake
Minnesota Pipestone Woodstock, Kas Brothers
Minnesota Rock Minwind I and II
Texas Pecos Indian Mesa
Texas Upton Southwest Mesaa
Texas Crocket Southwest Mesaa
Page 74 GAO-04-756 Renewable Energy

Appendix III
Results of NREL Modeling on Potential
Economic Impacts of Wind Power on Rural
Communities
Different levels of expenditures support varying levels of employment, income, and output, consistent with the spending pattern and local economic structure.
“Inputs” into the model include cost data for a given wind power project and parameters that characterize the particular state- or county-level economy being analyzed. Multipliers are used on the input data to calculate the “outputs,” which are the estimated employment and income impacts of the project.
The model is designed to examine economic impact on the state or county levels, and it does so separately for the “construction period” and “operating years” of a wind power project. Construction phase impacts are reported as a 1-year equivalent of the incremental change to state or county employment, earnings, and income attributable to a new project. For example, if a project results in full-time employment of 200 workers for 6 months, the model will “see” this effect as 100 full-time jobs added for 1 year. On the other hand, a model output of 25 jobs for the operating years of a project means that this project is expected to employ (directly at the plant and indirectly) 25 full-time equivalent workers annually over its lifetime.
The model divides a state or county economy into 14 sectors.1 For each sector, the model has three sets of employment, earnings, and income multipliers. One set is for direct effects, another for indirect effects, and a third for induced effects. In the case of a 150 MW wind power project, for example, the construction period direct employment effect includes the on-site jobs of the contractors and crews hired to build the project and jobs at the manufacturing plants that produce the turbines. In the operating years, the direct employment effect includes all of the workers who are employed directly by the project (field technicians, administrative staff, and project managers) as well as employment directly supported by expenditures for goods and services used by the plant. The indirect employment effect includes employment that results because suppliers of goods and services to the project also procure goods and services from others. The contractor who builds the project, for example, procures goods and services from
1These sectors are agriculture; construction; electrical equipment; fabricated metals; finance, insurance, and real estate; government; machinery; mining; other manufacturing; professional services; other services; retail trade; transportation, communication and public utilities; and wholesale trade.
Page 75 GAO-04-756 Renewable Energy

Appendix III
Results of NREL Modeling on Potential
Economic Impacts of Wind Power on Rural
Communities
bankers, accountants, suppliers of construction and other materials, and others. Finally, the induced employment effects refer to the change in employment that occurs due to the spending of those persons directly and indirectly generating income associated with the project. Direct, indirect, and induced income effects follow the same logic.
Model Inputs A major portion of the required “inputs” into the model are cost data, including the following:
• construction costs—for materials and labor, for example;
• equipment costs for such things as turbines, rotors, and towers;
• other construction period costs, such as for interconnection to the electric grid, engineering services, land easements, and permitting;
• annual operating and maintenance costs, including payroll of direct employees, material, and various services; and
• financing and lease costs and taxes.
Other inputs include estimates of “local share value” for certain dollar expenditures and labor. For example, a 10 percent local share value for construction material expenditures for Pecos County, Texas, means that, for a wind project being built in this county, the model assumes that only 10 percent of the value of project expenditures on construction materials accrues to local vendors. The relatively low number means that Pecos County has a limited economy and much of the construction material needed for the project would have to be obtained from outside the county—possibly from neighboring urban centers, such as the cities of Midland-Odessa and Lubbock, or from out-of-state locations. Similarly, for Pecos County, the model assumes that only 10 percent of the labor used for laying the foundations for the project’s turbines would be hired locally. In contrast, the corresponding percentages for Alameda County, California—a county with a much larger population and larger and more diversified economic base—would be 90 percent for the local share of construction material expenditures and 100 percent for the local share of labor used for foundation work.
Page 76 GAO-04-756 Renewable Energy

Appendix III
Results of NREL Modeling on Potential
Economic Impacts of Wind Power on Rural
Communities
The Interaction between Local Share Values and Multipliers
The local share values and multipliers used in the model determine how an expenditure of a particular type translates into employment and income impacts on a county’s economy. The interaction between the model inputs may be partly illustrated by comparing Rock County, Minnesota, with Weld County, Colorado.
• For Rock County, the model assumes the local share value for construction expenditures is 4 percent. The model also uses a direct employment multiplier of 10.1 jobs for every $1 million spent on construction in the county.
• For Weld County, the model assumes the local share value for total construction expenditures is 76 percent, and the direct employment multiplier is 8.3 jobs for every $1 million spent on construction in the county.
The differences in the local share values and multipliers for these two counties are attributable to the differing population and economic characteristics of these counties. Rock County is rural, with a small population and economic base, and thus the project developer must obtain much of the construction material, equipment, and labor needed from outside the county. In contrast, Weld County has a much larger population and economic base capable of fulfilling more of the developer’s material and labor needs.
On the other hand, the direct construction employment multiplier for Rock County, at 10.1 jobs per million dollars of expenditure, is somewhat higher than the corresponding multiplier of 8.3 for Weld County, reflecting a more labor-intensive local economy in the former.
The difference in local share values and employment multipliers for Rock County, Minnesota, and Weld County, Colorado, results in bigger employment impacts of a wind power project in the latter. For example, the model assumes that the construction of a 150 MW project will cost about $15 million in each county.2 However, in the case of Rock County, only about $600,000 of this amount will be spent within the county, while the corresponding local share for Weld County will be $11.5 million. Consequently, according to the model results, the $15 million construction
2The model assumes uniform costs across the United States.
Page 77 GAO-04-756 Renewable Energy

Appendix III
Results of NREL Modeling on Potential
Economic Impacts of Wind Power on Rural
Communities
project results in direct construction phase employment for Rock County of only 16 jobs compared with 141 jobs for Weld County.
Model Results We have not summarized all model results—to do so would involve publishing 33 large tables. However, those we do include are illustrative of the results we found. Overall, the model results showed that employment and income impacts
• tend to be greater for counties that are more highly populated and have a larger economic base, and
• are considerably greater for projects that are locally owned than for projects that are owned by out-of-area firms.
As discussed, the model estimates economic impacts for the construction period separately from impacts during the years of the project’s operation. Tables 8 and 9 summarize the model’s estimates of economic impacts for the construction period, while tables 10 through 12 summarize the estimates for the years of operation. Estimates for the construction period are 1-year impacts.
Construction Period Impacts Table 8 shows the economic impacts of constructing a 150 MW wind power project owned by an out-of-area energy company (a company headquartered outside the county). Table 9 depicts the impacts of constructing a 40 MW project owned by an out-of-area company. As depicted in these tables, the economic impacts during the construction period are bigger for counties that have a larger population and economic base. For example, the impacts of constructing a 150 MW project on Weld County, Colorado, would include the creation of the equivalent of 349 full-time jobs for 1 year. Weld County has a population of over 200,000. In contrast, the construction of a 150 MW project in Pecos County, Texas, would create the equivalent of only 36 full-time jobs for 1 year in the county. Pecos County has a much smaller population—about 16,000 people—and economic base. Thus, most of the labor and professional staff resources needed to construct the project would be hired from outside the county.
Page 78 GAO-04-756 Renewable Energy

Appendix III
Results of NREL Modeling on Potential
Economic Impacts of Wind Power on Rural
Communities
Table 8: Economic Impacts during Construction Period of 150 MW Wind Power Project Owned by Out-of-Area Energy Company
Source: NREL.
Note: Totals are subject to rounding.
Model results
Direct impacts Indirect impacts Induced impacts
Total impacts (direct, indirect,
induced)
2003population
(thousands)
2003 personal
income (billions) Jobs
Income (millions) Jobs
Income (millions) Jobs
Income (millions) Jobs
Income (millions)
Alameda, Calif. 1,501 $60.52 130 $19.09 76 $10.99 108 $12.67 314 $42.75
Solano, Calif. 420 11.71 139 19.09 78 10.62 105 10.64 321 40.35
Weld, Colo. 211 4.68 141 17.47 91 12.48 117 10.82 349 40.77
Buena Vista, Iowa 20 0.52 23 1.95 11 1.44 13 1.15 47 4.54
Cherokee, Iowa 13 0.33 17 1.28 6 0.67 10 0.83 33 2.78
Dickinson, Iowa 17 0.53 23 1.95 7 0.48 10 0.65 40 3.09
Pipestone, Minn. 10 0.28 18 1.28 3 0.23 7 0.41 28 1.92
Rock, Minn. 10 0.25 16 1.28 4 0.50 6 0.52 27 2.30
Crockett, Tex. 4 0.07 14 1.28 3 0.22 4 0.27 21 1.76
Pecos, Tex. 16 0.24 24 1.95 4 0.30 8 0.53 36 2.77
Upton, Tex. 3 $0.06 18 $1.28 1 $0.13 2 $0.17 22 $1.57
Page 79 GAO-04-756 Renewable Energy
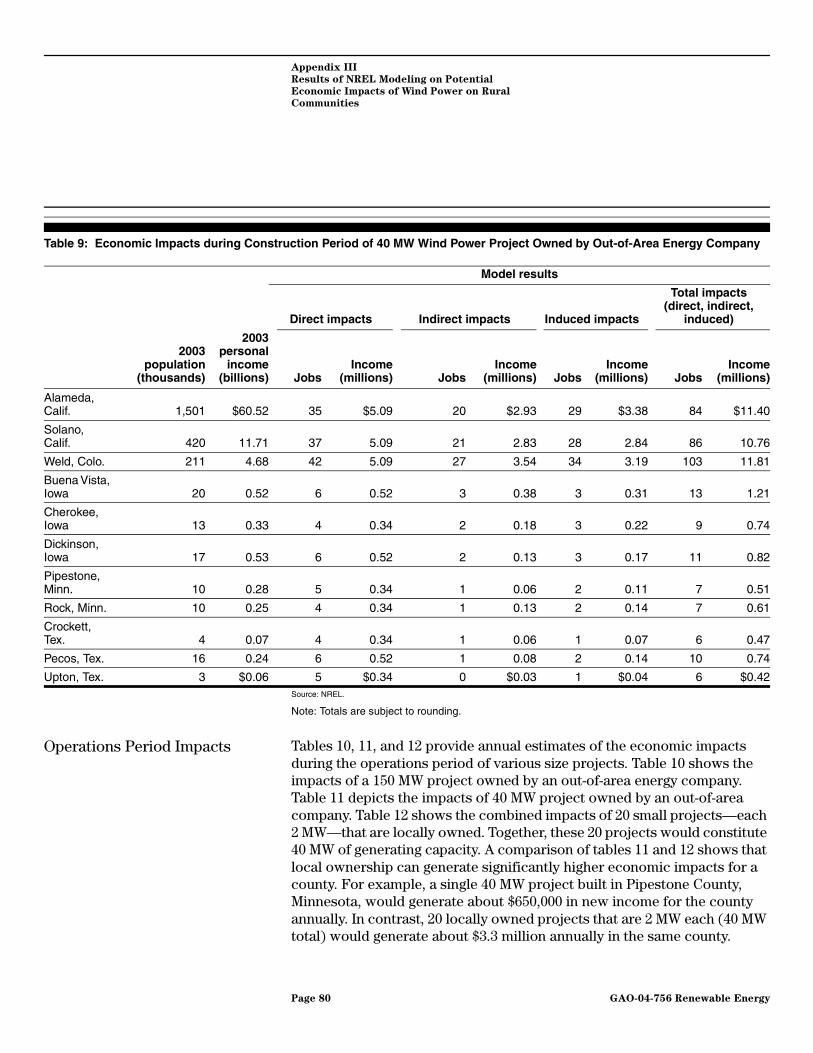
Appendix III
Results of NREL Modeling on Potential
Economic Impacts of Wind Power on Rural
Communities
Table 9: Economic Impacts during Construction Period of 40 MW Wind Power Project Owned by Out-of-Area Energy Company
Source: NREL.
Note: Totals are subject to rounding.
Operations Period Impacts Tables 10, 11, and 12 provide annual estimates of the economic impacts during the operations period of various size projects. Table 10 shows the impacts of a 150 MW project owned by an out-of-area energy company. Table 11 depicts the impacts of 40 MW project owned by an out-of-area company. Table 12 shows the combined impacts of 20 small projects—each 2 MW—that are locally owned. Together, these 20 projects would constitute 40 MW of generating capacity. A comparison of tables 11 and 12 shows that local ownership can generate significantly higher economic impacts for a county. For example, a single 40 MW project built in Pipestone County, Minnesota, would generate about $650,000 in new income for the county annually. In contrast, 20 locally owned projects that are 2 MW each (40 MW total) would generate about $3.3 million annually in the same county.
Model results
Direct impacts Indirect impacts Induced impacts
Total impacts (direct, indirect,
induced)
2003population
(thousands)
2003 personal
income (billions) Jobs
Income (millions) Jobs
Income (millions) Jobs
Income (millions) Jobs
Income (millions)
Alameda, Calif. 1,501 $60.52 35 $5.09 20 $2.93 29 $3.38 84 $11.40
Solano, Calif. 420 11.71 37 5.09 21 2.83 28 2.84 86 10.76
Weld, Colo. 211 4.68 42 5.09 27 3.54 34 3.19 103 11.81
Buena Vista, Iowa 20 0.52 6 0.52 3 0.38 3 0.31 13 1.21
Cherokee, Iowa 13 0.33 4 0.34 2 0.18 3 0.22 9 0.74
Dickinson, Iowa 17 0.53 6 0.52 2 0.13 3 0.17 11 0.82
Pipestone, Minn. 10 0.28 5 0.34 1 0.06 2 0.11 7 0.51
Rock, Minn. 10 0.25 4 0.34 1 0.13 2 0.14 7 0.61
Crockett, Tex. 4 0.07 4 0.34 1 0.06 1 0.07 6 0.47
Pecos, Tex. 16 0.24 6 0.52 1 0.08 2 0.14 10 0.74
Upton, Tex. 3 $0.06 5 $0.34 0 $0.03 1 $0.04 6 $0.42
Page 80 GAO-04-756 Renewable Energy

Appendix III
Results of NREL Modeling on Potential
Economic Impacts of Wind Power on Rural
Communities
Table 10: Economic Impacts during Operations Period of 150 MW Wind Power Project Owned by Out-of-Area Energy Company
Source: NREL.
Note: Totals are subject to rounding.
Model results
Direct impacts Indirect impacts Induced impacts
Total impacts (direct, indirect,
induced)
2003population
(thousands)
2003 personal
income (billions) Jobs
Income (millions) Jobs
Income (millions) Jobs
Income (millions) Jobs
Income (millions)
Alameda, Calif. 1,501 $60.52 37 $2.00 6 $0.94 21 $2.49 65 $5.43
Solano, Calif. 420 11.71 37 2.00 6 0.78 20 2.05 64 4.83
Weld, Colo. 211 4.68 40 2.00 8 0.99 29 2.67 76 5.66
Buena Vista, Iowa 20 0.52 33 1.67 9 1.15 44 3.91 86 6.74
Cherokee, Iowa 13 0.33 33 1.61 9 1.02 51 4.08 93 6.71
Dickinson, Iowa 17 0.53 34 1.67 9 0.77 39 2.57 81 5.01
Pipestone, Minn. 10 0.28 33 1.61 4 0.36 7 0.45 45 2.42
Rock, Minn. 10 0.25 32 1.61 5 0.57 7 0.61 45 2.79
Crockett, Tex. 4 0.07 32 1.61 8 1.00 19 1.20 60 3.82
Pecos, Tex. 16 0.24 32 1.67 4 0.47 30 1.98 67 4.12
Upton, Tex. 3 $0.06 33 $1.61 2 $0.30 12 $0.83 47 $2.75
Page 81 GAO-04-756 Renewable Energy

Appendix III
Results of NREL Modeling on Potential
Economic Impacts of Wind Power on Rural
Communities
Table 11: Economic Impacts during Operations Period of 40 MW Wind Power Project Owned by Out-of-Area Energy Company
Source: NREL.
Note: Totals are subject to rounding.
Model results
Direct impacts Indirect impacts Induced impacts
Total impacts (direct, indirect,
induced
2003population
(thousands)
2003 personal
income (billions) Jobs
Income (millions) Jobs
Income (millions) Jobs
Income (millions) Jobs
Income (millions)
Alameda, Calif. 1,501 $60.52 10 $0.53 2 $0.25 6 $0.67 17 $1.45
Solano, Calif. 420 11.71 10 0.53 2 0.21 5 0.55 17 1.29
Weld, Colo. 211 4.68 11 0.53 2 0.26 8 0.71 20 1.51
Buena Vista, Iowa 20 0.52 9 0.45 2 0.31 12 1.04 23 1.80
Cherokee, Iowa 13 0.33 9 0.43 3 0.27 13 1.09 25 1.79
Dickinson, Iowa 17 0.53 9 0.45 2 0.21 10 0.69 22 1.34
Pipestone, Minn. 10 0.28 9 0.43 1 0.10 2 0.12 12 0.65
Rock, Minn. 10 0.25 9 0.43 1 0.15 2 0.16 12 0.75
Crockett, Tex. 4 0.07 9 1.35 2 0.27 5 0.32 16 1.94
Pecos, Tex. 16 0.24 9 0.45 1 0.12 8 0.53 18 1.10
Upton, Tex. 3 $0.06 9 $0.43 1 $0.08 3 $0.22 13 $0.73
Page 82 GAO-04-756 Renewable Energy

Appendix III
Results of NREL Modeling on Potential
Economic Impacts of Wind Power on Rural
Communities
Table 12: Economic Impacts during Operations Period of 20 Locally Owned Wind Power Projects, Each with a 2 MW Capacity
Source: NREL.
Note: Totals are subject to rounding.
Caveats to and Reliability of the Modeling Effort
We did not expect a high level of accuracy in the model results because data sources on costs and expenditures are limited, in part because companies may consider these data to be proprietary. Rather, we expected the model’s analysis to illustrate the differences between counties that have different economic structures. The cost data and assumptions for local share values seemed reasonable and consistent with what we found during our visits regarding economic conditions in these counties. The model’s results also generally conform to what we found during our visits, especially for employment effects.
Model results
Direct impacts Indirect impacts Induced impacts
Total impacts (direct, indirect,
induced)
2003population
(thousands)
2003 personal
income (billions) Jobs
Income (millions) Jobs
Income (millions) Jobs
Income (millions) Jobs
Income (millions)
Alameda, Calif. 1,501 $60.52 21 $2.47 6 $0.86 11 $1.34 38 $4.68
Solano, Calif. 420 11.71 18 2.47 6 0.74 10 1.03 34 4.23
Weld, Colo. 211 4.68 23 2.47 7 0.94 15 1.42 46 4.83
Buena Vista, Iowa 20 0.52 22 2.34 8 0.94 18 1.61 48 4.88
Cherokee, Iowa 13 0.33 23 2.34 8 0.89 20 1.63 52 4.85
Dickinson, Iowa 17 0.53 24 2.34 8 0.72 16 1.06 48 4.12
Pipestone, Minn. 10 0.28 24 2.34 6 0.54 7 0.42 36 3.29
Rock, Minn. 10 0.25 23 2.34 7 0.73 8 0.65 38 3.71
Crockett, Tex. 4 0.07 23 2.34 5 0.58 9 0.55 37 3.47
Pecos, Tex. 16 0.24 22 2.34 5 0.49 12 0.80 39 3.63
Upton, Tex. 3 $0.06 25 $2.34 3 $0.28 5 $0.34 32 $2.96
Page 83 GAO-04-756 Renewable Energy

Appendix IV
Summary of Visits to Wind Power Projects in Five States Appendix IV
This appendix summarizes key information for the nine wind power projects we visited in 10 counties in five states (California, Colorado, Iowa, Minnesota, and Texas). At each site, we discussed the planning, development, construction, and operation of the project with landowners, project developers and owners, and local government officials.
Projects in California
Altamont Pass
Figure 9: Horizontal Axis Wind Turbines, Altamont Pass, California
Source: GAO.
Page 84 GAO-04-756 Renewable Energy

Appendix IV
Summary of Visits to Wind Power Projects in
Five States
Figure 10: Vertical Axis Wind Turbines, Altamont Pass, California
Source: GAO.
Project location: Alameda and Contra Costa Counties, California
Project owners and locations: FPL Energy (Florida), Global Renewable Energy Partners (Denmark), and several other partners
Year operations started: 1983 through 1990
Number of turbines:2,526
Total installed generation capacity:268.7 MW
Annual generation estimate:392.2 million kWh
Power purchaser:Pacific Gas & Electric (PG&E)
Number of landowners:43
Six wind power projects are located in Altamont Pass, near Livermore, California. Collectively, these projects are among the oldest and largest utility-scale wind power projects worldwide (based on installed generating capacity). The projects have been controversial because of associated bird deaths, particularly for golden eagles. Eagles present in Altamont Pass may be attracted to the perches offered by the latticework towers used for older turbines. This project was also among the last in the United States to use vertical axis turbines. This technology has largely fallen into disuse in favor of modern, horizontal-axis turbines mounted on towers to access better winds available at heights of 100 feet or more. In June 2004, an FPL Energy official said that the vertical axis turbines have been decommissioned and are being removed. (These turbines were operative at the time of our site visit in August 2003.)
The projects are located on about 100 square miles of mostly agricultural land used for cattle grazing.
The projects pay a total of about $280,000 in property taxes annually to Alameda and Contra Costa Counties. Although important, these property taxes are not a significant source of revenue for these counties. For example, Alameda County reported about $215 million in property tax revenues for the tax year ending 2002. Furthermore, the property taxes assessed for these projects have fallen considerably as the value of the projects has declined with depreciation.
In general, the Altamont projects were not eligible for the federal production tax credit because they began operation before this tax credit was initially authorized in legislation. However, because the power purchase contracts for the projects were negotiated under favorable conditions in the 1980s, the projects sell power to the local utility at rates higher than the range of 2 to 3.5 cents per kWh that has been common for wind power projects in recent years.
Overall, the projects employ 53.7 full-time equivalent employees.
Page 85 GAO-04-756 Renewable Energy

Appendix IV
Summary of Visits to Wind Power Projects in
Five States
High Winds Energy Center, Solano County
Figure 11: Wind Turbines, Solano County, California
Source: GAO.
Project location: Solano County, California
Project owners and locations: FPL Energy (Florida)
Year started operating: Phase I: August 2003Phase II: December 2003
Number of turbines:Phase I: 81Phase II: 9
Total installed generation capacity:162 MW
The High Winds Energy Center project is located in the Montezuma Hills region of Solano County. This region has average annual wind speed of between 18 and 20 miles per hour. The project is the largest single wind farm in California.
The project extends over approximately 6,500 acres of agricultural land. However, project facilities, such as the turbines, substations, and access roads, occupy only about 60 acres of the total leased. The project has no effect on the primary uses of the land; crops are grown and cattle are grazed right up to the base of the turbines. The project owner estimates that it will pay about $21.5 million in lease payments to the landowners over the life of the project (25 years).
Because the project only began operating in late 2003, actual data on property taxes paid are unavailable. However, the project owner estimates that the project will pay approximately $1.8 million in direct property taxes to Solano County in 2004. It will also
Page 86 GAO-04-756 Renewable Energy

Appendix IV
Summary of Visits to Wind Power Projects in
Five States
Annual generation estimate:480 million kWh
Power Purchaser:PPM Energy Inc.
Number of landowners:8
pay approximately $70,000 in property taxes for the landowners in 2004. Furthermore, the project owner estimates that the project will pay about $24 million in property taxes over the life of the project.
The project will employ 6 to 8 full-time equivalent employees. During its construction, the project generated about 250 construction-related jobs.
Page 87 GAO-04-756 Renewable Energy

Appendix IV
Summary of Visits to Wind Power Projects in
Five States
Projects in Colorado
Ponnequin Wind Farm
Figure 12: Wind Turbines, Weld County, Colorado
Source: GAO.
Project location: Weld County, Colorado
Project owners and locations:Xcel Energy (Colorado) and Energy Unlimited/Ponnequin Acquisitions (Pennsylvania)
Year started operating: Phase I: 1998Phases II-IV: 1999Phases V-VI: 2001
The Ponnequin wind farm is the first utility-scale wind power project in Colorado. A key factor in the development of wind power in Colorado, including the Ponnequin wind farm, is the Windsource® program offered by Xcel Energy, the state’s largest electric utility. This program offers customers the option of signing up for 100 kWh blocks of electric power produced by wind power or other renewable sources at a premium of $2.50 per block over regular rates.
About half—23 of 44—of the Ponnequin turbines are located on 942 acres of land belonging to the state of Colorado. According to the state land board, Colorado received $40,763 from this project for the use of the land in 2003.a The remaining turbines are located on 420 acres of a privately owned cattle ranch. According to the ranch owner, the lease income from the turbines is significant and constitutes a much larger share of the ranch’s total income than the earnings from cattle production. Xcel Energy, which owns 37 of the 44 turbines, indicated that it paid about $100,000 for the two land leases and related rights-of-way in 2001.
Page 88 GAO-04-756 Renewable Energy
Appendix IV
Summary of Visits to Wind Power Projects in
Five States
aThe state receives $1.50 per acre for the 942 acres leased to the project. The lease is for a period of 52 years. The state also receives an annual payment per MW of installed capacity. Per the lease agreement, every 5 years the state has the option to adjust the latter payment for inflation, based on the producer price index for commercial electric power. For example, in 2003—5 years after phase I of the project began operations—the state increased the payment to $2,475 per MW, about 13 percent higher than the year before.
Number of turbines: 44
Total installed generation capacity:31.65 MW
Annual generation estimate:71 million kWh
Power purchaser:Xcel Energy
Number of landowners: 2
Weld County officials told us that the property taxes paid by the Ponnequin project do not constitute a significant share of the county’s total property taxes. For 2003, the project’s property taxes were about $53,000; the county’s total property taxes collected in 2002 were almost $200 million.
The project employs 2.33 full-time equivalent employees for maintenance and operations.
Page 89 GAO-04-756 Renewable Energy

Appendix IV
Summary of Visits to Wind Power Projects in
Five States
Projects in Iowa
Spirit Lake Community School District
Figure 13: Wind Turbine, Dickinson County, Iowa
Source: GAO.
Project location: Spirit Lake, Dickinson County, Iowa
Project owners and locations:Spirit Lake Community School District (Iowa)
Year started operating: Phase I: July 1993Phase II: October 2001
The Spirit Lake Community School District was one of the first school districts in the nation to own a wind power project. The project consists of two turbines, a 250 kW turbine constructed in 1993 and a 750 kW turbine constructed in 2001. The school district justified the project based on its estimated savings in electricity costs.
The turbines supply most of the electricity needed for school facilities in the district, including school buildings, a maintenance facility, and the lights for baseball and football fields. A local utility purchases electricity generated by the turbines that exceeds the school district’s needs. Although the turbines generate more electricity than the district uses in some months, the school district is a net user of the utility-provided electricity on an annual basis.
Page 90 GAO-04-756 Renewable Energy

Appendix IV
Summary of Visits to Wind Power Projects in
Five States
Number of turbines:2
Total installed capacity:1 MW
Annual generation estimate:2.1 million kWh
Power Purchaser:Alliant Energy
Number of landowners:1
A DOE grant and a low-interest loan from the Iowa Department of Natural Resources financed the first turbine. A combination of low-interest and no-interest loans obtained through the Iowa Department of Natural Resources and the Iowa Energy Center, respectively, financed construction of the second turbine. School district funds normally budgeted for electrical fees are used to pay the principal and interest on the loans.
The turbines are located on school district property; thus no lease payments are involved. In addition, because the turbines are owned by a local government entity, no property taxes are levied or collected. The school district also does not qualify for the federal production tax credit.
Page 91 GAO-04-756 Renewable Energy
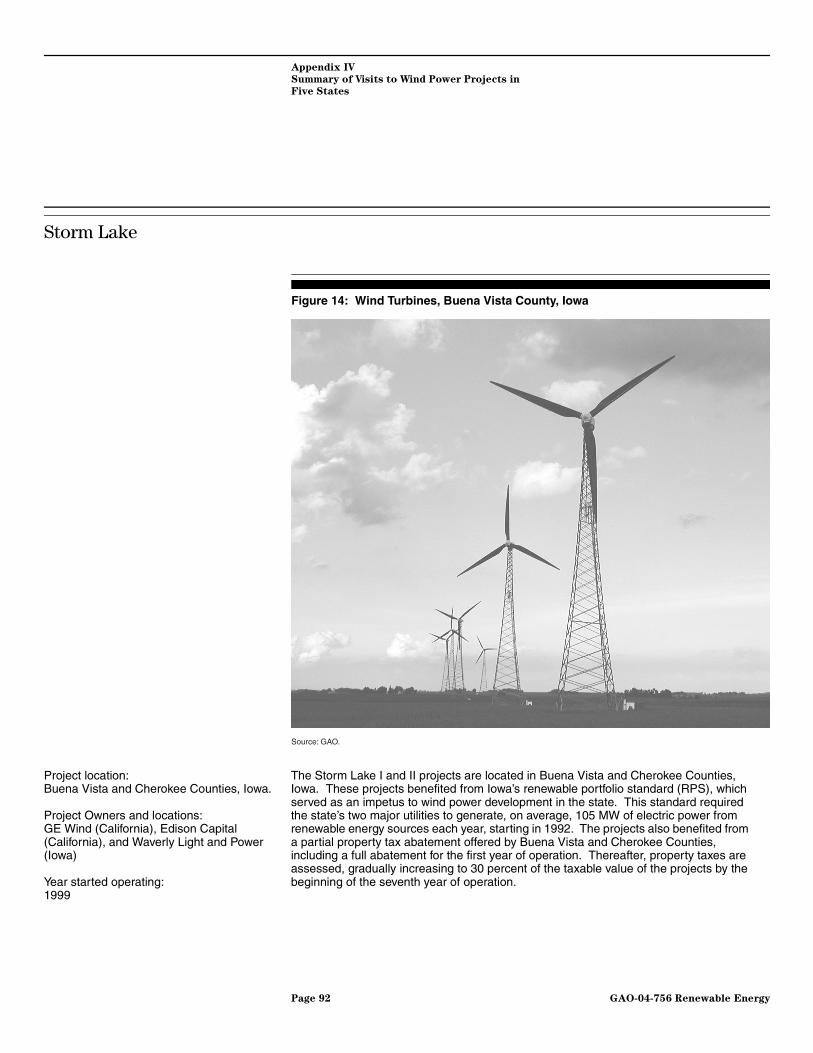
Appendix IV
Summary of Visits to Wind Power Projects in
Five States
Storm Lake
Figure 14: Wind Turbines, Buena Vista County, Iowa
Source: GAO.
Project location: Buena Vista and Cherokee Counties, Iowa.
Project Owners and locations:GE Wind (California), Edison Capital (California), and Waverly Light and Power (Iowa)
Year started operating: 1999
The Storm Lake I and II projects are located in Buena Vista and Cherokee Counties, Iowa. These projects benefited from Iowa’s renewable portfolio standard (RPS), which served as an impetus to wind power development in the state. This standard required the state’s two major utilities to generate, on average, 105 MW of electric power from renewable energy sources each year, starting in 1992. The projects also benefited from a partial property tax abatement offered by Buena Vista and Cherokee Counties, including a full abatement for the first year of operation. Thereafter, property taxes are assessed, gradually increasing to 30 percent of the taxable value of the projects by the beginning of the seventh year of operation.
Page 92 GAO-04-756 Renewable Energy

Appendix IV
Summary of Visits to Wind Power Projects in
Five States
Number of turbines:259
Total installed generation capacity:194.25 MW
Annual generation estimate:490 million kWh
Power purchaser:Alliant Energy and MidAmerican Energy
Number of landowners:65
The Storm Lake projects paid a total of about $500,000 in property taxes to Buena Vista and Cherokee Counties and associated local jurisdictions in the tax year ending 2004. Buena Vista collected the majority of these taxes ($451,000) because most of the Storm Lake turbines (232 of 259) are located in that county. According to Buena Vista officials, this tax income is particularly important for the school district in the town of Alta, located near the projects, providing about 16 percent of the school district’s property tax revenues.
The Storm Lake projects employ about 23 people for operations and maintenance.
Page 93 GAO-04-756 Renewable Energy

Appendix IV
Summary of Visits to Wind Power Projects in
Five States
Projects in Minnesota
Kas Farms, Minnesota
Figure 15: Wind Turbines, Pipestone County, Minnesota
Source: GAO.
Project location:Pipestone County, Minnesota
Project owners and location:Richard and Roger Kas (Minnesota)
Year started operating:December 2001
Number of turbines:2
The Kas brothers wind project was the first farmer-owned, commercial-scale wind power project in the United States. The turbines are located on agricultural land used for crop production. The brothers did much of the construction work themselves, reducing their construction costs below the national average of $1 million per MW of installed capacity. A local bank financed the project.
In order to take full advantage of the federal production tax credit, the Kas brothers—who did not qualify for full use of the credit—found an equity investor who could use the credit. Under this arrangement, the investor owns most of the equity interest in the project for the period of time (10 years) that the production tax credit is available. After this period, the Kas brothers will have majority ownership. Because the project has less than 2 MW of capacity, it also qualified for Minnesota’s renewable production incentive payment of 1.5 cents for each kWh of electricity it produces for the first 10 years of the project’s operations.
Page 94 GAO-04-756 Renewable Energy

Appendix IV
Summary of Visits to Wind Power Projects in
Five States
Total installed generation capacity:1.5 MW
Annual generation estimate:4.5 million kWh
Power purchaser: Xcel Energy
Number of landowners:1
Page 95 GAO-04-756 Renewable Energy

Appendix IV
Summary of Visits to Wind Power Projects in
Five States
Minwind I and II, Minnesota
Figure 16: Wind Turbine, Rock County, Minnesota
Source: GAO.
Project location:Rock County, Minnesota
Project owners and locations:Minwind I and II (Minnesota)
Year started operating:October 2002
Minwind I and II are limited liability companies that function in a manner similar to farmer cooperatives.a Minwind I has 32 shareholders and Minwind II has 34. Farmers must own 85 percent of the company shares; the remaining 15 percent of the shares are available to local residents and investors. Each share gives the owner one vote in the company, and no single person can own more than 15 percent of the shares.
Page 96 GAO-04-756 Renewable Energy

Appendix IV
Summary of Visits to Wind Power Projects in
Five States
aIn general, a cooperative is an organization formed for the purpose of producing and marketing goods or products owned collectively by members who share in the benefits.
Number of turbines:Minwind I: 2 turbinesMinwind II: 2 turbines
Total installed generation capacity:3.8 MW
Annual generation estimate:11.1 million kWh
Power purchaser:Alliant Energy
Number of landowners:1
Through Minwind I and II, the shareholders are able to pool their incomes and tax liabilities to take advantage of the federal production tax credit. This tax provision provides a credit for electricity generated by renewable energy sources such as wind turbines—about 1.8 cents per kWh during 2003. In addition, the projects benefit fromMinnesota’s renewable production incentive. This incentive is available to renewable energy projects up to 2 MW of capacity, offering a payment of 1.5 cents per kWh of power produced for the first 10 years of a project’s operation.
According to Minwind I and II officials, the impetus behind the projects was to bring economic development to Rock County by emphasizing local ownership, providing farmers with a return on their investment, and using local businesses and contractors to construct and operate the projects. As of April 2004, seven additional Minwind projects are being constructed in Rock County. In total, these projects will have 200 local owners and have a combined capacity of nearly 12 MW.
Page 97 GAO-04-756 Renewable Energy

Appendix IV
Summary of Visits to Wind Power Projects in
Five States
Woodstock Wind Energy Project
Figure 17: Wind Turbines, Pipestone County, Minnesota
Source: GAO.
Project location: Woodstock, Pipestone County, Minnesota
Project owners and locations: DanMar Associates (Minnesota) and Edison International (California)
Year operations started: 1999
Number of turbines:17
Total installed generation capacity:10.2 MW
The Woodstock Project employs an innovative funding arrangement. DanMar Associates partnered with a large corporate investor, Edison International, so that this company could take advantage of the federal production tax credit. Specifically, Edison International provided the majority of the equity capital for the project in return for being able to take advantage of the tax credit during the project’s first 10 years of operation. At the end of this period, Edison International will transfer majority ownership of the project to DanMar Associates. With the assistance of DanMar Associates, other wind power projects in Minnesota have used a similar funding arrangement, also known as the “equity flip.”
The Woodstock project turbines are located on a soybean and cattle farm. The landowners receive an annual cash payment per turbine. According to the landowners, this payment is a significant supplement to their farm income.
Page 98 GAO-04-756 Renewable Energy

Appendix IV
Summary of Visits to Wind Power Projects in
Five States
Annual generation estimate:29 million kWh Power purchaser:Xcel Energy
Number of landowners:1
In 2001, Woodstock paid about $15,000 in property taxes to Pipestone County. DanMar Associates has 4 employees, but its work supports other business interests as well as the management and operation of the Woodstock Project.
Page 99 GAO-04-756 Renewable Energy

Appendix IV
Summary of Visits to Wind Power Projects in
Five States
Projects in Texas
Indian Mesa Wind Energy Project
Figure 18: Wind Turbines, Pecos County, Texas
Source: GAO.
Project location: Pecos County, Texas
Project owners and locations: FPL Energy (Florida)
Year started operating: May 2001
Number of turbines:125
The Indian Mesa wind farm is located in West Texas, an area with strong, sustained wind resources.
The project is located on 34,000 acres situated on a mesa. One of the four landowners of this acreage is the University of Texas. About 7,000 of these acres are leased for the project. The uses of the land include grazing livestock—primarily sheep—and hunting. The project does not limit these uses.
Page 100 GAO-04-756 Renewable Energy
Appendix IV
Summary of Visits to Wind Power Projects in
Five States
aBecause one of the four landowners was a county commissioner, property taxes were assessed for this landowner’s parcel to avoid the appearance of a conflict of interest.
Total installed capacity:82.5 MW
Annual generation estimate:250 million kWh
Power Purchaser:Lower Colorado River Authority and Texas Utilities Company
Number of landowners:4
As an incentive for locating the project in Pecos County, the county provided the project with a full property tax abatement for 5 years.a In return, the project owner (at that time) agreed to donate funds in an amount equivalent to about 10 percent of the abated taxes to a regional technical training center. The owner also agreed to hire and use local companies and labor for the construction of the project, to the extent possible. In addition, the project paid about $930,000 in local school district taxes in 2003.
The project owner currently employs 43 people to operate and maintain the four wind projects the company owns in the area, including the Indian Mesa project. In the future, the owner plans to hire 4 additional people after the warranty and maintenance agreement with the turbine manufacturer expires.
Page 101 GAO-04-756 Renewable Energy

Appendix V
The Wind Project Development Process Appendix V
A
The wind project development process
Site selection Land agreements Wind assessment Environmental review
Evidence of significant wind
Preferably privately owned remote land
Economic modeling
Reasonable road access
Receptive community
Few environmental concerns
Proximity to transmission lines
Term:expected life of the turbine
Compensation:percentage of revenues
Rights: wind rights ingress/ egress rights, transmission rights
Assignablefinancing requirement
Indemnification
Reclamation provision
Corollary data:military installations, commercial airports
Collect hourly wind speed and direction data
Install meteorological tower
Cursory review for endangered species
Avian studies
Minimum one year of data
Quality report by recognized meteorologist
Output projections for several turbine designs
Obtain key data
Turbines, blades, electronics, and tower costs
Output projections
Balance of plant costs
Finance assumption
Raptors
Migratory birds
Review with interested parties
Local Audubon
Federal authorities
Local stakeholders
State authorities
Prepare, conduct, and report studies as required
Foundation
CollectionsystemErection
Padmount transformer
Cables
Substation
Communication and control system
Taxes
Operations and maintenance estimates
SalesIncomes
Visual studies
Photo simulation:Multiple views and distances
Review with local authorities
Historical and archaeological review
Prepare, conduct, and report studies as required
Wetlands review
Review with interested parties
Depreciation schedule
Property
Tax credits
Equity rate of return
Debt rate and term
Debt/equity ratio
Coverage ratios
Page 102 GAO-04-756 Renewable Energy

Appendix V
The Wind Project Development Process
A
Capacity limitation
Load flow analysis
System protection
Voltage controls
Power curveoutput projections
Capital cost:turbine, tower, blades, and electronics
Construction financing
Warranties:equipment and maintenance
Turn-key construction cost: padmounts, interconnection and erection
Fixed cost per turbine per year
Fixed price per kWh produced
Penalties for nonperformance
Availability warranties
Turn-key contract
Excavation
Tower assembly and erection
Interconnection to utility
Trenching
Concrete
Cabling
Commissioning
Local, state, federal
Private land
Public land
Land use permit
Building permit
Source of equity:rate of return 16-18%
Term of debt
Source of debt:market rates
Assignable documents
Third party due diligence
Power purchase agreement
Term
Kilowatt price:real or nominal levalized
Facility sales agreement
Turn-key pricecomplete wind power facility
Permitting Sales agreements FinancingTurbine
procurementOperations and maintenance
Construction contracting
Interconnection studies
Credit worthy buyer
Foundation assembly
Turbine installation
Source: Distributed Generation Systems Inc.
Page 103 GAO-04-756 Renewable Energy
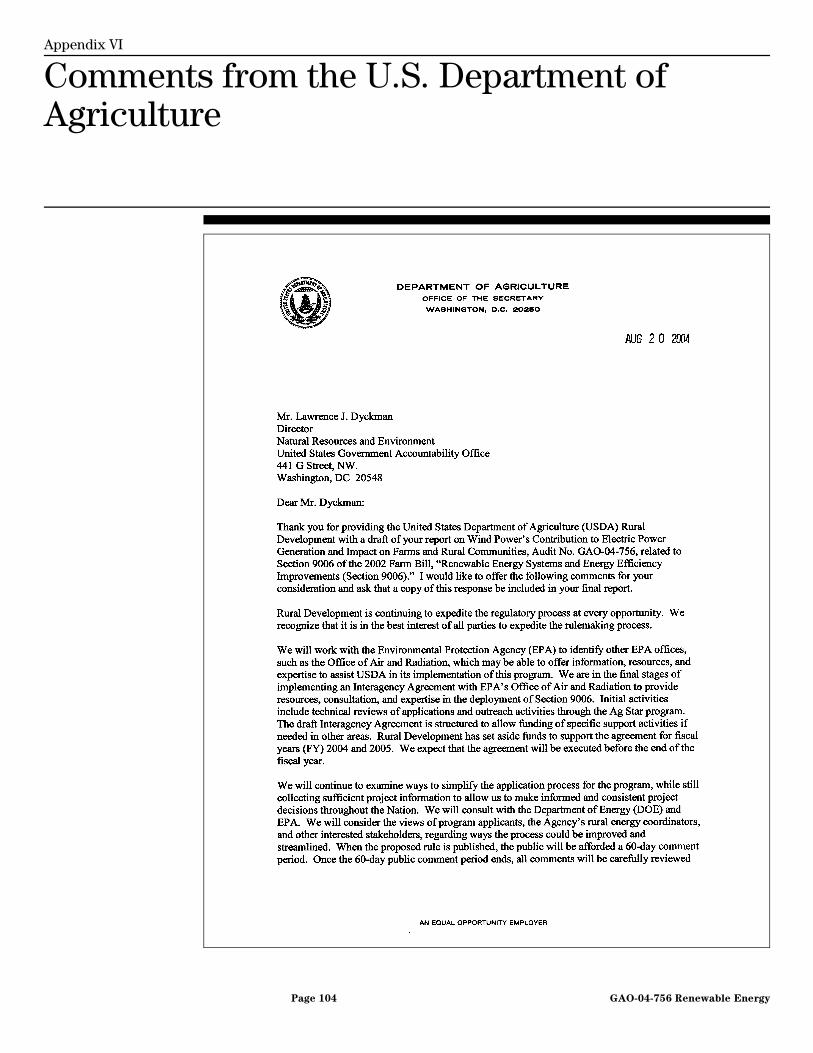
Appendix VI
Comments from the U.S. Department of Agriculture Appendix VI
Page 104 GAO-04-756 Renewable Energy
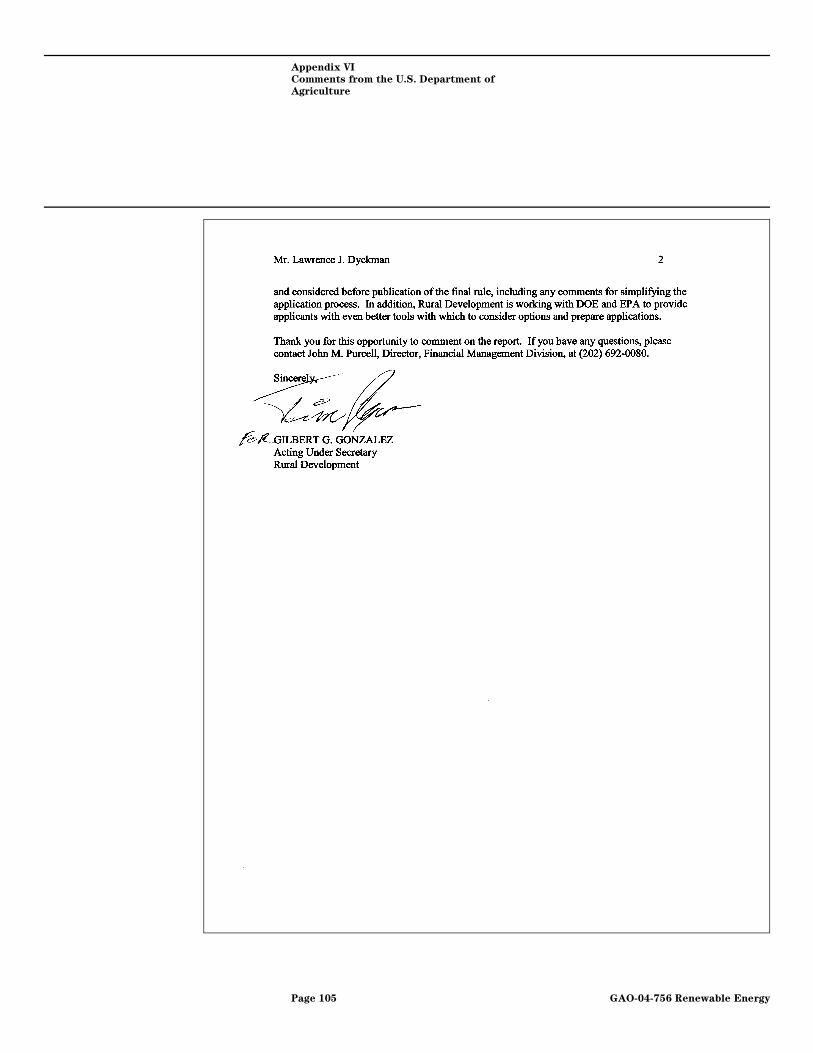
Appendix VI
Comments from the U.S. Department of
Agriculture
Page 105 GAO-04-756 Renewable Energy
Appendix VII
GAO Contacts and Staff Acknowledgments Appendix VII
GAO Contacts Lawrence J. Dyckman, (202) 512-3841 James R. Jones Jr., (202) 512-9839
Staff Acknowledgments
In addition to the individuals named above, Jacqueline Cook, Philip Farah, William Roach, and Carol Herrnstadt Shulman made key contributions to this report. Important contributions were also made by Carol Bray, Oliver Easterwood, Richard Kasdan, and Lynn Musser.
We also wish to give special recognition to our dear friend and colleague, Patricia Gleason, who passed away during the course of our work. Pat’s distinguished career with GAO was characterized by her strong desire to make government programs more effective and efficient. Furthermore, her courage, humor, and determination to keep working even as her health declined were an inspiration to her co-workers who held her in the highest esteem and miss her greatly.
Page 106 GAO-04-756 Renewable Energy
Related GAO Products
Federal Energy Management: Facility and Vehicle Energy Efficiency
Issues. GAO-03-545T. Washington, D.C.: March 12, 2003.
Air Pollution: Meeting Future Electricity Demand Will Increase
Emissions of Some Harmful Substances. GAO-03-49. Washington, D.C.: October 30, 2002.
Natural Gas: Analysis of Changes in Market Price. GAO-03-46. Washington, D.C.: December 18, 2002.
Restructured Electricity Markets: Three States’ Experiences in Adding
Generating Capacity. GAO-02-427. Washington, D.C.: May 24, 2002.
Renewable Energy: DOE’s Funding and Markets for Wind Energy and
Solar Cell Technologies. GAO/RCED-99-130. Washington, D.C.: May 14, 1999.
Department of Energy: Solar and Renewable Resources Technologies
Program. GAO/RCED-97-188. Washington, D.C.: July 11, 1997.
Energy Security: Evaluating U.S. Vulnerability to Oil Supply
Disruptions and Options for Mitigating Their Effects. GAO/RCED-97-6. Washington, D.C.: December 12, 1996.
Federal Research: Changes in Electricity-Related R&D Funding. GAO/RCED-96-203. Washington, D.C.: August 16, 1996.
Energy Research: Opportunities Exist to Recover Federal Investment in
Technology Development Projects. GAO/RCED-96-141. Washington, D.C.: June 26, 1996.
Electricity Supply: Consideration of Environmental Costs in Selecting
Fuel Sources. GAO/RCED-95-187. Washington, D.C.: May 19, 1995.
Electricity Supply: Efforts Under Way to Develop Solar and Wind Energy. GAO/RCED-93-118. Washington, D.C.: April 16, 1993.
Page 107 GAO-04-756 Renewable Energy
(360307)
GAO’s Mission The Government Accountability Office, the audit, evaluation and investigative arm of Congress, exists to support Congress in meeting its constitutional responsibilities and to help improve the performance and accountability of the federal government for the American people. GAO examines the use of public funds; evaluates federal programs and policies; and provides analyses, recommendations, and other assistance to help Congress make informed oversight, policy, and funding decisions. GAO’s commitment to good government is reflected in its core values of accountability, integrity, and reliability.
Obtaining Copies of GAO Reports and Testimony
The fastest and easiest way to obtain copies of GAO documents at no cost is through GAO’s Web site (www.gao.gov). Each weekday, GAO posts newly released reports, testimony, and correspondence on its Web site. To have GAO e-mail you a list of newly posted products every afternoon, go to www.gao.gov and select “Subscribe to Updates.”
Order by Mail or Phone The first copy of each printed report is free. Additional copies are $2 each. A check or money order should be made out to the Superintendent of Documents. GAO also accepts VISA and Mastercard. Orders for 100 or more copies mailed to a single address are discounted 25 percent. Orders should be sent to:
U.S. Government Accountability Office 441 G Street NW, Room LM Washington, D.C. 20548
To order by Phone: Voice: (202) 512-6000 TDD: (202) 512-2537 Fax: (202) 512-6061
To Report Fraud, Waste, and Abuse in Federal Programs
Contact:
Web site: www.gao.gov/fraudnet/fraudnet.htm E-mail: [email protected] Automated answering system: (800) 424-5454 or (202) 512-7470
Congressional Relations
Gloria Jarmon, Managing Director, [email protected] (202) 512-4400 U.S. Government Accountability Office, 441 G Street NW, Room 7125 Washington, D.C. 20548
Public Affairs Jeff Nelligan, Managing Director, [email protected] (202) 512-4800 U.S. Government Accountability Office, 441 G Street NW, Room 7149 Washington, D.C. 20548

United States Government Accountability Office Washington, D.C. 20548-0001
Official Business Penalty for Private Use $300
Address Service Requested
Presorted StandardPostage & Fees Paid
GAOPermit No. GI00