galvinoxyl monolayers on au(111) studied by stm, … · galvinoxyl monolayers on au(111) studied by...
TRANSCRIPT

Galvinoxyl monolayers on Au(111) studied by STM, EPR, and cyclic voltammetry
Natascha Niermann,1,2 Tesfaye Hailu Degefa,3 Lorenz Walder,3 Vitali Zielke,4 Heinz-Jürgen Steinhoff,4
Jens Onsgaard,5 and Sylvia Speller1,*1Institute for Molecules and Materials, Radboud Universiteit Nijmegen, 6525ED Nijmegen, The Netherlands
2Fachbereich Physik, Universität Osnabrück, 49069 Osnabrück, Germany3Organische Chemie und Molekulare Elektrochemie, Institut für Chemie, Universität Osnabrück, 49069 Osnabrück, Germany
4Makromolekülstruktur, Fachbereich Physik, Universität Osnabrück, 49069 Osnabrück, Germany5Department of Physics and Nanotechnology, Aalborg University, Pontoppidanstræde 103, DK-9220, Aalborg East, Denmark
�Received 22 September 2005; revised manuscript received 10 June 2006; published 14 December 2006�
Galvinoxyl layers on Au�111� have been studied by scanning tunnelling microscopy �STM�, electron para-magnetic resonance �EPR�, and cyclic voltammetry �CV�. We observe two phases: configuration I having amolecular density of 1.57±0.16�10−10 mol/cm2 and a rectangular lattice �15 Å by 7 Å� observed at roomtemperature and down to 140 K; configuration II with a slightly smaller molecular density of 1.37±0.14�10−10 mol/cm2 and oblique cells �22.5 Å by 5.4 Å� arranged alternatingly in stacks yielding a molecularlayer with lower symmetry and comparatively large crystallographic unit cell. The latter is only observed uponcooling down to 40 K and subsequent annealing to room temperature. For both assemblies typical domain sizesin the range of 100 nm have been found. The EPR results confirm that the radical character is preserved uponadsorption and that the intermolecular distance is smaller than 11 Å. The interaction between the overlappingsingly occupied spin orbitals is high, indicating no participation of the unpaired electron in the binding to thesurface or laterally between neighboring radicals. The average surface concentration deduced from CV mea-surements is in excellent agreement with the surface coverages deduced from STM topographies. In aqueouselectrolyte the adsorbate undergoes a one-electron oxidation with concomitant loss of a proton as determinedfrom oxidation potential vs pH curves in a similar fashion as known for the free radical in solution. Thisindicates no dramatic change of the electronic properties of the radical upon adsorption. Structure models areproposed with molecules standing upright like “bicycles in rows.”
DOI: 10.1103/PhysRevB.74.235424 PACS number�s�: 68.43.�h, 68.37.�d, 75.70.�i, 82.45.�h
I. INTRODUCTION
Interestingly, purely organic ferromagnets show longrange magnetic order in the crystalline phase. Organic mo-lecular magnets are in many respects superior to conven-tional magnets because they are comparably small and light,and chemically easy to control.1 Galvinoxyl is one of themost promising radicals because it is a persistent and stableradical exhibiting a ferromagnetic phase at roomtemperature.2,3 Ferromagnetic nanostructures are expected toform an increasingly important class of materials in futuretechnologies and the study of ferromagnetic layers of radi-cals is therefore intriguing. We investigate the structure andthe electronic properties of galvinoxyl adsorbed on Au�111�.
In principle every atom or molecule with an unpairedelectron is predefined as a radical. But only few of them arestable and persistent at ambient conditions and upon adsorp-tion. For stable radicals, to the best of our knowledge onlynine studies of nine different radical assemblies, respectively,aggregate structures on surfaces investigated by STM arepublished.4–12 Combined EPR and STM was used to detectspin specific signals through the tip by applying a magneticfield and a microwave to get STM-EPR spectra ofg-bisdiphenylene- b-phenylallyl �BDPA� clusters containingfree radicals.4 The high spatial resolution of STM togetherwith the electronic spin sensitivity of electron-spin resonanceshowed the presence of localized spins in BDPA on a HOPG�highly oriented pyrolitic graphite� surface. Three otherstudies describe the adsorption of TEMPO �2,2,6,6-tetramethylpiperidin-1-oxy� on Si�100� and Si�111�. The
stable and free radical is reduced and connected by danglingbonds to the surface and investigated by scanning tunnellingmicroscopy with varying tunnelling currents.5,6 The most re-cent study combines STM measurements and computationalmodelling of TEMPO on Si�100�.7 A strong bias dependencein the topography of isolated molecules was observed in therange of −2 to +2.5 V. The computational method couldconfirm the binding mechanism to the surface. STM andLEED study indicate that methoxy, ethoxy, phenoxy and1-propoxy adsorb into p�2�2�-S vacancies on a sulfur-covered Ni�100� surface.8 It has been shown by STM thatmethyl radicals adsorb as two-dimensional �2D� islands onCu�111� up to a coverage as a saturation monolayer.9 For twoimportant radical species, i.e., methyl �CH3� and methylni-trene �NCH3� on Cu�111� and Cu�110� high-resoluted STMimages have been obtained and plausible adsorption modelshave been derived.10 By using the reduced thermal mobilityof molecular radicals on surfaces, it was demonstrated thatthe cyclopentadienyl radical can be readily manipulated lat-eral to the STM tip motion and associatively desorbed with aSTM tip at room temperature.11,12 Some of the radicals de-scribed were reduced by binding to the surface.
In the wide field of radical research based on STM inves-tigations we refer to several representative examples. One ofthe best examples is pure nitrogen, which is adsorbed on aSi�100� surface in UHV. Linear defects perpendicular todimer rows found with STM and scanning tunnelling spec-troscopy �STS� revealed that the initial nitridation reactionoccurs preferentially at the backbonds of surface Siatoms.13,14 Another chemically very simple radical which is
PHYSICAL REVIEW B 74, 235424 �2006�
1098-0121/2006/74�23�/235424�13� ©2006 The American Physical Society235424-1

nitric oxide �NO� was adsorbed to a Cu�110� surface. Themolecule splits off and N- and O-induced islands aredetected.15 In the case of NO two different adsorption struc-tures on Pt�111� observed by STM have been reported.16 Ad-ditionally the chemisorption of NO on a flat steppedRu�0001� surface was calculated using density functionaltheory.17
For organic molecules deposited on surfaces we refer tothe review papers of Blundell et al.,18 Schreiber,1 andKinoshita.19
The study of the magnetic behavior of organic radicalshas started already in 1957 with the interest on galvinoxyl�2,6-di-tert-butyl-4-�3,5-di-tert-butyl-4-oxycyclohexa-2,5-di-enyliden-emethyl�-phenoxy.20 The molecule was first namedafter its discoverer “Coppinger-radical,” obviously his firstname Galvin provided the contemporary name. Galvinoxyl isconsidered most interesting as the compound in the solidphase passes a first order magnetic phase transition at 85 Kfrom ferromagnetic above, to antiferromagnetic below thistemperature.3,18
Several studies have been presented on crystalline galvi-noxyl. The EPR spectra of the polycrystalline specimenshows a flat-topped single peak due to the anisotropy ofpacking of the individual crystallites.21 The nature of the spinexchange interaction between the unpaired electrons hasbeen described using the band model.22 In order to under-stand the mechanism of the magnetic interactions, ferromag-netic properties like spin population, spin arrangement andthe spontaneous magnetic moment per molecule have beencalculated by ab initio studies.23 It was found that the totalDOS below the Fermi level exhibits sharp peaks, i.e., energybands below the Fermi level are narrow and flat. The mag-netic properties of a mixed crystal of the galvinoxyl radicaland its precursory closed shell compound have beenstudied.24 From these measurements it was concluded thatthe ferromagnetic order, which passes a transition at 85 K inpure galvinoxyl, is maintained down to 2 K in mixed crys-tals. Though, there is no clear statement for the Curie tem-perature of galvinoxyl. Many of the conditions necessary tobe an organic ferromagnet above the 85 K transition tem-perature are fulfilled.
Inside the galvinoxyl crystal the almost planar radicalmolecules are arranged in different forms of alternatingstacks.25 Different configurations were assumed and all ofthem have similar smallest intermolecular distances. The ox-yphenyl residues are twisted relative to each other by about12 degrees. Therefore, in all our models we presume a planarstructure for the molecule as an approximation. The stacks ofthe molecular crystals are found to be �13.9 Å wide with anintermolecular distance inside these stacks along the c axis ofroughly 0.65 nm3. Furthermore, the distance of about 3.71 Åbetween the carbon atoms of two adjacent molecules22 isrelatively high compared to distances found in stacks ofother radicals. Nevertheless, the typical �-� interaction ispresumed.
Attempts to obtain the crystal structure of pure galvinoxyl�purity �90%� below 85 K failed due to disintegration of thecrystals while the samples were cooled through the transitiontemperature.26 The coupling between the single electronspins exhibits a large intramolecular exchange which leads toa high spin polarization.
Experimental studies of crystalline galvinoxyl showedthat the magnetic properties do vary with temperature. Thehigh temperature susceptibility is well reproduced by theone-dimensional ferromagnetic Heisenberg model and fol-lows the Curie-Weiss law with a positive Weiss constant of19 K above 85 K.18 Therefore this radical is considered tohave ferromagnetic intermolecular interaction, while most ofthe organic radicals rather have antiferromagnetic interac-tion. Galvinoxyl received additional attention due to thephase transition at 85 K. Slightly different behavior has beenreported around 85 K and the paramagnetic susceptibility issupposed to be weaker below the transition temperature of85 K down to 2 K.24 Antiferromagnetic interactions havebeen suggested with a negative Weiss constant in this tem-perature regime.18 Small impurities seem to suppress thisphase.24
Galvinoxyl is a promising candidate to stay stable on anmetallic surface as two dimensional array, the free radical isnot changing its oxidation state easily by exposure to oxygenor light. Stability of radicals is generally related to a combi-nation of odd electron delocalization and steric hindrancepreventing dimerization, referring to the ortho tert-butylgroups in the case of galvinoxyl. Galvinoxyl is known to bea very reliable radical scavenger.27,28
II. EXPERIMENT
A. Methods
The STM experiments were carried out in an ultrahighvacuum �UHV� system with separate analysis and prepara-tion chamber. Most of the STM measurements were donewith an Omicron VT �variable temperature� Micro-SPM�scanning probe microscope� and an STM I using tungstentips. Both systems were very well calibrated and perma-nently checked for drift control during the measurements.Calibration was done using atomically resolved Au�111� sur-faces and steps. As the lateral calibration factor depends onframe size and history, calibration was refined using theAu�111� herringbone reconstruction. This indicates that formidsize frames ��100 nm� the x and y scale should be con-tracted by 10%. We show the original data.
Deposition of the molecules was done from solution usinga commercial pulse valve built by Parker Instruments Inc.29
It was operated with closure times of 0.5 �s up to 25 �s. Forthis purpose a home-built supply was used. Further detailswill be presented in a more technical presentation that willfollow later on.30 The spray valve was mounted at the inletchamber. After every pulse we waited to allow the pressureto recover to the 10−7 mbar region. On top of the valve asmall crucible was filled with the molecule solution and wascovered by a ceramic cap.
The EPR measurements were performed with a VarianCW Multifrequency X-band �9.5 GHz� Spectrometer �VarianE109� equipped with a standard rectangular TE102 resonator�Varian model� described in the technical manual.31 The goldsamples with the galvinoxyl layer were oriented parallel withrespect to the magnetic field lines. A defined amount of thesolution in the range of 1014 molecules was released onto theAu�111� substrate. Alternatively the gold surface was im-
NIERMANN et al. PHYSICAL REVIEW B 74, 235424 �2006�
235424-2

mersed inside the molecule solution. The instrument settingswere as follows: microwave power 5 mW, time constant�Lock-In integration� 300 ms, modulation amplitude 1 G, 10repeats.
All electrochemical measurements were performed in athree-electrode system under Ar, using a potentiostat PG-STAT 20 from AUTOLAB interfaced with a personal com-puter running under GPES for Windows, Version 4.9 �ECOChemie�.32 Beside the galvinoxyl coated gold electrode�working electrode�, a Ag/AgCl reference electrode �Meth-rom, 6.0724.140, separated by a salt bridge containing theelectrolyte of the measuring compartment�, and a platinumwire as the counter electrode were used. As supporting elec-trolyte we used 0.1 M Na2HPO4. The pH of the solution wasadjusted to the desired values with 0.1 M NaOH or HCl.Unless otherwise indicated, the CV was performed at100 mV/s. The surface concentration was calculated fromCV using the surface beyond the voltammogram correctedfor the capacitive contribution. The E0 was calculated fromeach CV using E0= �Epa+Epc� /2.
B. Sample preparation
Au�111� layers with 100 nm to 200 nm thickness wereprepared by Au evaporation from a crucible onto a clean andannealed mica film of 0.49 cm2. The evaporation took placeat a pressure of 10−7 mbar in a separate high vacuum setup.The samples have been locked into the UHV setup. StandardAr+, respectively, Ne+ sputter �1 keV, 2–5 �A, 10 min� andannealing cycles �550 K, 10 min�, have been applied to cleanand flatten the surface. The free radical galvinoxyl has beensolved in pure ethanol. The mm-molar solution was sprayeddirectly into the vacuum chamber onto the atomically flatAu�111� surface. Parameters were optimized by subsequentvariation depending on the conditions of evaporation, i.e.,pumping speed in UHV. The evaporation speed plays a de-cisive role during deposition because vapor distribution ofsolvent and radical differ and the molecular layer is affectedin the following way: during the deposition procedure thesolution cools down, the evaporation profile of the solventethanol is different in comparison to the molecule galvi-noxyl. Consequently the evaporation speed influences the ra-tio of galvinoxyl to ethanol adsorbing on the surface. Addi-tionally with lower pumping speed the solution cone opens.After spraying the solution onto the surface the sample wasannealed in the UHV to 50 °C to eliminate the depositedsolvent from the surface. This procedure was controlled by amass spectrometer.
For the experiments with EPR and cyclic voltammetry adifferent preparation method had to to be used. Under ambi-ent conditions the substrate has been immersed into a mMsolution containing the galvinoxyl molecules solved in etha-nol at 323 K, afterwards taken out and dried with pure nitro-gen. The compound was bought from Aldrich with a purityof 98%. The concentration inside ethanol solution was variedfrom 0.2 mM to 1 mM.
For the EPR measurements the radical layers were pre-pared depositing a defined amount of the galvinoxyl solutiononto the Au�111� surfaces using pure ethanol as solvent. If
not otherwise stated 2 �l were administered, taken from a0.2 mM galvinoxyl solution in ethanol. The sample wasplaced inside the resonator as shown in Fig. 1 with a self-constructed plastic holder.
The sample for electrochemical measurements was pre-pared by exposing freshly cleaned gold disk electrodes�Metrohm, 6.1204.140, 3 mm diameter� to 1 mM galvinoxylin ethanol for 24 h. Prior to the sample preparation, the elec-trodes were polished to a mirror-finish with a wet Al2O3slurry on a flat pad �Metrohm, 6.2802.000, grain size 0.3 m�,rinsed thoroughly with distilled water, cleaned for 2 minwith freshly prepared piranha solution �2:3 mixture of 30%H2O2 and concentrated H2SO4.�, rinsed with ethanol fol-lowed by distilled water. The coated electrode is then readyfor characterization after rinsing with ethanol to remove anyphysically adsorbed molecules.
C. Galvinoxyl: structure and spin density of the free molecule
In Fig. 2 the chemical structure of the molecule is shown.In order to understand the pattern of closely packed galvi-
noxyl radicals observed by STM on Au�111�, we start froman isolated molecule modelled using a semiempirical AM1calculation.33 Figure 3 shows a quasi-three-dimensional �3D�view of the molecule. The grids in green �positive� and violet�negative� represent the spin density from the UnrestrictedHartree-Fock �UHF� AM1 calculation. The optimized struc-ture will serve to extract the orientation of the moleculeswithin the stacks on Au�111� observed in STM topographies.
The spin densities of the galvinoxyl radical optimized instructure demonstrates the large extent of spin density distri-bution over the entire � system. This fact, in combinationwith the shielding effect of the tert-butyl groups, is the mainreason for the stability of the radical.
FIG. 1. �Color online� Drawing of the sample position inside theresonator.
GALVINOXYL MONOLAYERS ON Au�111� STUDIED BY… PHYSICAL REVIEW B 74, 235424 �2006�
235424-3

Figure 4 shows the molecular orbital close to the Fermilevel, i.e., at −1.555 eV indicating the regions, which areimportant for the highest tunnelling probability during STMmeasurements.
III. RESULTS AND DISCUSSION
In this study we investigate experimentally the structural,electronic, magnetic, and chemical characteristics of the self-assembled monolayer.
A. Topography: STM results
We obtained topographies with submolecular resolutionof the monolayer assemblies of galvinoxyl on the Au�111�surface. Two types of patterns were observed. Both configu-rations show arrays of stacks, built from galvinoxyl mol-ecules. The orientation of the molecule stacks is along the sixlow-index directions of the Au�111� surface due to the six-fold symmetry of the well-known 22��3 reconstruction ofAu�111�.34,35 The combination of theoretical results on thecrystalline phase, the observed corrugation in STM topogra-phies, and the voltammetry results allowed us to estimate themolecular density on the surface. We consider two structuremodels: one with rectangular lattice, consisting of stackedmolecules, in parallel aligned and a second more complex
structure with oblique angles. In both cases the double-ringmolecule is standing upright on the surface. The two domi-nating interactions, overlap of � orbitals, especially in-between the carbon rings, and hydrogen bonding, favor themolecules to stand upright like bicycles in a row, and anordered array is formed. Stacking of aromatic parts of mol-ecules is very common, e.g., shown for porpherins.36 Thetwo configurations differ in the angle between the moleculesof adjacent stacks. Both configurations of the monolayer as-sembly have been observed by STM. To check for spin-ordering in the domains we used antiferromagnetic MnNitips.37 Antiferromagnetic tips have no stray field that influ-ences the sample magnetism. However, down to 140 K wefound no appreciable difference in topography using thesetips. Either the sensitivity, i.e., the spin-polarization of the tipis too low38 or spin-ordering in the aggregate is not suffi-ciently strong or absent.
The energy scale of the molecular orbital and the tunnel-ling bias scale must not necessarily coincide. On the onehand, the absolute energies depend on the reference chosenin the theoretical description, and on the other hand, molecu-lar orbitals shift substantially in energy upon physisorption.It is however likely that the singly occupied molecular or-bital �SOMO� gets close to the Fermi level and that at lowbiases, no matter positive or negative, the current passes theSOMO. The topography remains largely unchanged withvarying bias in the interval −2.0 V– +2.0 V.
The EPR data confirmed the free radical remaining stableon the surface, i.e., not being reduced. This allows us toconclude that the dominating interaction in the self-assemblycan be attributed to the intermolecular forces, and not to thebonding between galvinoxyl molecules and the gold atoms.A dimerization energy of −51 kJ/mol is reported.39 It isprobable that intermolecular forces lead to dimerization ef-fects already in solution. This is consistent with results ongavinoxyl crystals,25 where all structures rely mainly on theinteraction between the carbon rings.3 Also it has been cal-culated, that radicals will have preferred adsorption positionson metal surfaces.40 The binding to the surface is mainly dueto the comparably weak van der Waals forces.
FIG. 3. �Color online� Result of the semiempirical AM1-structure calculation, geometry optimization done by Polak-Ribiere�conjugate gradient� �Ref. 33� of the free galvinoxyl radical; violet�negative�-green �positive� lobes illustrate the spin density �contourvalue, 0.001�.
FIG. 4. �Color online� AM1-optimized, geometry optimizationby Polak-Ribiere �conjugate gradient� �Ref. 33�; molecule withlobes indicating squared coefficients of the orbital close to theFermi level, at −1.555 eV with a contour value of 0.0005 �left-handside�; energy levels of the orbitals in the frontier orbital region�right-hand side�.
FIG. 2. �Color online� Chemical structure of galvinoxyl with theatoms labelled.
NIERMANN et al. PHYSICAL REVIEW B 74, 235424 �2006�
235424-4

1. Configuration I
The first configuration has been imaged by STM at roomtemperature and at 140 K. The deposition took place at roomtemperature.
Figure 5 shows the topography of galvinoxyl deposited atroom temperature. On the terrace characteristic corrugationwith an amplitude of 0.8 Å is observed. Straight step edgesare as likely as not due to steps on the Au�111� substrateunderneath. Other types of meandered step edges are present.Most significant, a line pattern is observed, that is attributed
to the molecular aggregate on the surface. The periodicity ofthis line pattern is �15 Å. Along the ridges no corrugation isobserved, which can, however, be due to insufficient resolu-tion. A few etching holes can be seen clearly and the lineprofile shows that the same arrangement of the molecules ispresent inside the hole like on the rest of the surface, see Fig.5�b�. At room temperature the holes are mobile until thesystem is stabilized, wandering with speeds of about 5 nmper frame scan, a frame scan lasts about 2 minutes at thisframe size. The height difference between hole and terrace is2.38 Å and can be attributed to the step height of Au�111� of2.35 Å, within the experimental error.
The STM topography of the galvinoxyl layer on Au�111�observed at 140 K is presented in Fig. 6. Qualitatively thestructure does not change regarding the room temperaturestructure. The same characteristic line patterns with distancesbetween the molecules of 15 Å as at room temperature areobserved. In contrast to the room temperature measurementthe etching holes appear more sharp. While keeping thesample at low temperature we observed even less etchingholes than at room temperature. The comparison of imagestaken at different times after deposition reveal that the mono-layer becomes increasingly more stable inside UHV. This isalso true for room temperature but at low temperature thiseffect is much stronger. The aggregate appeared inert againstimpurities, it stays nearly at the same condition for severalweeks in UHV at a pressure below 1�10−10 mbar. Moststriking is the enhanced contrast of the self-assembly com-pared to room temperature. The pattern can be imaged athigher tunnelling current without moving around moleculeson the surface, this was not possible at room temperature.The different contrast in the middle of the image arises froma change in the tip state, which allows one to resolve a sub-structure within the lines with a period of 30 Å, which isdifficult to resolve with the other tip state. The 30 Å are onlyobserved exceptionally upon tip changes, probably a mol-ecule or part of a molecule is picked up. Thus, the samestructure is present in both areas, the 15 Å period being iden-tical, but the sensitivity of the tip changed.
A high-resolution STM topography of galvinoxyl layer onAu�111� is presented in Fig. 7. This image shows a typicalzoom into the stripe pattern, that we attribute to molecularstacks. This frame includes two contiguous domains, thatenclose an angle of 60 degrees. We concluded that these do-mains follow the low index directions of the Au�111� surface.The transition from one domain to the other shows disor-dered patches of molecules, sometimes forming clusters. Thedisordered regions shrink upon heating the sample to 333 K.Annealing leads to ordering of the molecular layer whileexcess molecules desorb. The green bar has a length of 75 Åspanning 5 lines 15 Å wide.
The correlation filtered STM topography of the galvi-noxyl layer on Au�111� is presented in Fig. 8. The filteringallows one to enhance substantially the contrast and therebyto recognize more details of the assembly and the molecules.
A closer view to the filtered data provides intramoleculardetails that allow us to derive a model. Figure 8�b� shows arectangular pattern with a basis with twofold rotation sym-metry. Intramolecular details become visible. This can how-ever reflect the symmetry of the tip. Taking line profiles in
FIG. 5. �Color online� STM topography of galvinoxyl onAu�111� taken at room temperature, sample preparation at roomtemperature, frame size 100 nm.
GALVINOXYL MONOLAYERS ON Au�111� STUDIED BY… PHYSICAL REVIEW B 74, 235424 �2006�
235424-5

both directions we determine the dimensions for the unit cell:15 ű1.5 Å by 7 ű0.7 Å. The distance known from �-�bonding in the range of 3.5 Å–3.8 Å is comparable to thedistances between the bordering tert-butyl groups of the mol-ecules. The distance we observe along the c axis for thestacks of galvinoxyl is thus quite high, although it is prob-able that these intermolecular forces originate mainly from�-� bonding between the carbon rings. Both hydrogen bond-ing and the weak van der Waals forces are also known to beresponsible for the dominating intermolecular interactionscompared to the forces occurring between substrate and sur-face.
Taking into account the most reasonable possibilities forthe orientation of the molecule on the surface only onemodel matches well with the pattern and density observed,depicted in Fig. 8�b�. The molecule is “standing” on theAu�111� with the two tert-butyl groups on position 3 and 4�carbon atoms, see Fig. 2� at the surface. Of course a reversesymmetry is also thinkable. In our opinion it is impossible todecide from our data which model applies. The small shad-ows with a lower height visible in Fig. 8�b� could stem froma tilt of the molecule regarding the rectangular axis to thesurface. This could be between 5 and 10 degrees. This isdiscussed in the context of the second configuration in Sec.III A 2.
2. Configuration II
Additionally to the first stable structure we observed asecond one which occurred only after the sample had beencooled down to 40 K before. The configuration seems to beless influenced by the substrate structure than the first one.
Thus, the binding to the surface being probably weaker. Usu-ally, the 22�±1�� �3 reconstruction is observed to disappear,if a self-assembled layer is formed on Au�111�. Only fewopposite cases have been reported.35
FIG. 7. �Color online� STM topography of galvinoxyl onAu�111� with more detailed resolution, acquired at 140 K, samplepreparation at room temperature, cooled down afterwards for themeasurement, frame size 40 nm.
FIG. 6. �Color online� STM topography of galvinoxyl on Au�111�, acquired at 140 K, sample preparation at room temperature, subse-quently cooled down afterwards, frame size 70 nm.
NIERMANN et al. PHYSICAL REVIEW B 74, 235424 �2006�
235424-6

In the following we present an overview of the secondstructure observed with galvinoxyl on Au�111�, depositionfrom ambient into UHV, using the same procedure as for thefirst configuration. We did not obtain a good resolution ofthis structure at 40 K. This could be related, e.g., to a moreunstable aggregate related to the phase transition as men-tioned before �see Sec. I�. It is known from the crystal struc-ture that the properties change significantly below 85 K.Consequently the properties like spin density, localization,and chemical bonding could be changed and can lead todifficulties in getting a good resolution in STM imaging.Also other authors describe surprising observations: As bulkand beyond the phase transition galvinoxyl appears to be aferromagnet with an extrapolated Curie temperature of 19 K.The nature of the transition at 85 K seems to be quite drasticin many respects. Probably it is not only magnetic, but ac-companied with severe structural and electronic rearrange-ments. The heat capacity grows by a factor of 3 at this
transition,42 and analysis of the crystal structure below 85 Kfailed due to disintegration of the crystals.26 The reason forthe lowered distance from configuration I at 7 Å to 5.4 Å inconfiguration II could be different expansion coefficients ofAu�111� and galvinoxyl. For gold it is 7.1�10−5 K and fororganic molecules roughly 7�10−4 K. The factor of about10 could explain that at low temperature the molecules aremore “concentrated” resulting in a lower stacking distanceregarding the c axis of the aggregate on the Au�111�. If thesample is warmed up to room temperature the denser stackedarrays persist over time periods of at least days. Interestingly,so-called charge transfer configurations in neighboring pairsof galvinoxyl are considered as stable.19 Charge is then trans-ferred from one to the other molecule and the moleculesbecome partly ionic. It is tempting to attribute the brightspots in the topography of configuration II presented inFig. 9 to such regions. However we must leave this unde-cided.
The second configuration is shown in Fig. 9. The averagecorrugation is slightly higher than before �1.2 Å compared to0.8 Å� and a more complex pattern is observed. The anglebetween rows of molecules repeats every second pattern. Anangle of 60 degrees is included by the stacks of molecules.In Fig. 9�b� the distance of 10.8 ű1 Å between the brightspots inside the stacks is shown. As we can see in the secondprofile only every second molecule has a bright spot in onerow, the molecules are separated by a distance of 5.4 ű1 Åalong the c direction. The distance is slightly bigger than thedistance of 3.785 Å found for the crystalline phase3 alongthe c axis, and slightly smaller than the distance of 7 Åfound in the first configuration. This might be due to the tiltangle of the standing molecule off the vertical axis beingsmaller or zero with this structure. Consequently, the posi-tions of the galvinoxyl molecules deviate only very slightlyfrom standing exactly 90 degrees upright on the Au�111� sur-face.
The reconstruction can be viewed with a better contrastfor the diagonal lines in Fig. 10. The period we observe forthe Au reconstruction is 63±0.5 Å, compatible with the22�±1�� �3 herringbone reconstruction.34,35,43 Surprisingly,this reconstruction is preserved with the molecular assemblyon top.44
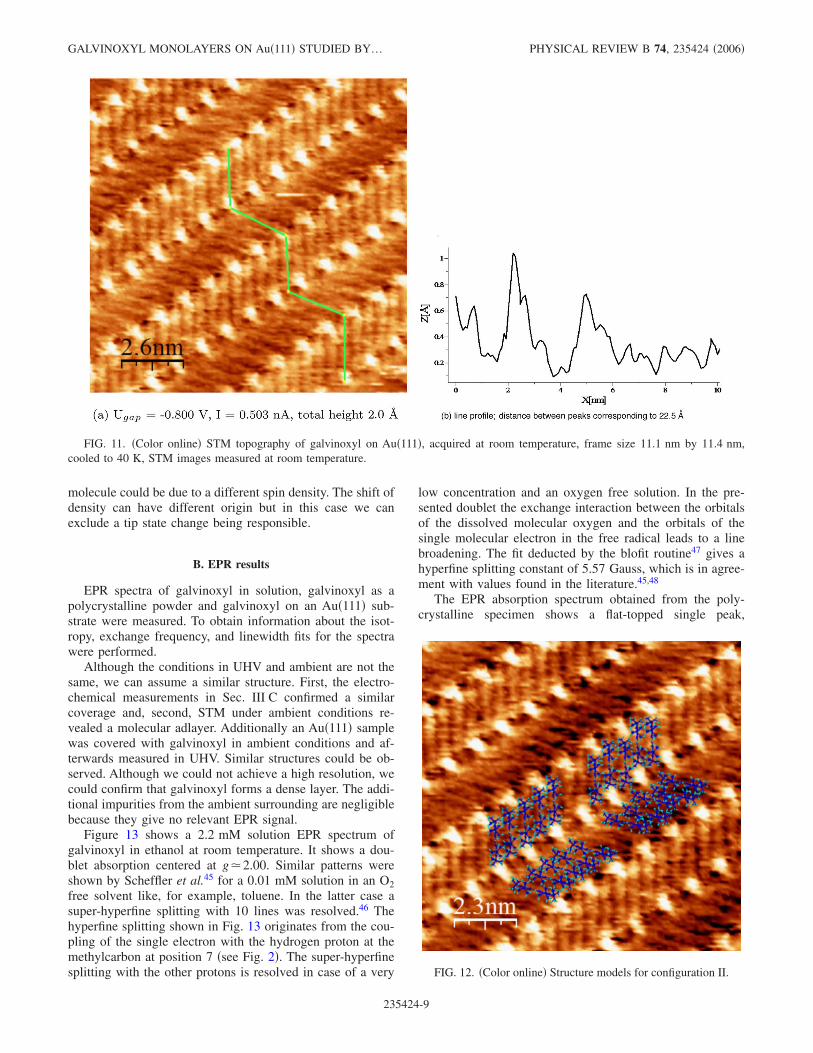
The zoom allows to see submolecular contrast of the con-figuration. The Fig. 11�a� with a frame size of about 11 nmshows rows with a pattern according to the herringbonestructure including a 60 degree angle. The molecules are sur-rounded by alternating more and less bright spots at the end-points. The apparent height of these bordering regions of themolecule is modulated inside the stacks.
The observed length of 1.53 nm in-between the brightspots fits well with the measured length of �13.9 Å insideone of the crystal configurations.25 The corrugation of thebright spots appears large, however this height modulation of1.2 Å within individual molecules is substantially smallercompared to the interlayer spacing of �5 Å in the molecularcrystal. The analysis of Fig. 11�b� reveals that in the profilealways two high protrusions follow two low ones and so on.Always two very bright spots follow two weaker ones, sothat every second molecule has either two weaker or twostronger bright spots. The molecules in-between have one
FIG. 8. �Color online� Galvinoxyl layer deposited at room tem-perature onto Au�111�, measurement performed at 140 K, prepara-tion at room temperature, subsequently cooled down for the STMmeasurement. The area with reduced noise is correlation filtered�Ref. 41�.
GALVINOXYL MONOLAYERS ON Au�111� STUDIED BY… PHYSICAL REVIEW B 74, 235424 �2006�
235424-7

bright and one less bright spot. The tert-butyl parts of adja-cent galvinoxyl molecules inside the stacks seem to be over-lapping.
Figure 12 exhibits the same section with improved in-tramolecular resolution. The model pattern superimposed onthe STM image indicates the orientation of the molecules
inside the assembly. Two slightly different variations of themolecule structures are shown, one with absolute parallelmolecules inside the stacks and one with alternating shiftsalong the lateral axis of the molecule. This model allows usto estimate the shift between the individual molecules alongthe lateral axis to about 2 Å. The highlighted side of each
FIG. 9. �Color online� STM topography galvinoxyl on Au�111�, second configuration, molecules deposited at room temperature, samplecooled to 40 K, STM measured at room temperature, frame size 35 nm.
FIG. 10. �Color online� STM topography of galvinoxyl on the Au�111� surface showing the Au reconstruction below the adlayer, cooledto 40 K, STM measurement acquired at room temperature, frame size 35 nm.
NIERMANN et al. PHYSICAL REVIEW B 74, 235424 �2006�
235424-8
molecule could be due to a different spin density. The shift ofdensity can have different origin but in this case we canexclude a tip state change being responsible.
B. EPR results
EPR spectra of galvinoxyl in solution, galvinoxyl as apolycrystalline powder and galvinoxyl on an Au�111� sub-strate were measured. To obtain information about the isot-ropy, exchange frequency, and linewidth fits for the spectrawere performed.
Although the conditions in UHV and ambient are not thesame, we can assume a similar structure. First, the electro-chemical measurements in Sec. III C confirmed a similarcoverage and, second, STM under ambient conditions re-vealed a molecular adlayer. Additionally an Au�111� samplewas covered with galvinoxyl in ambient conditions and af-terwards measured in UHV. Similar structures could be ob-served. Although we could not achieve a high resolution, wecould confirm that galvinoxyl forms a dense layer. The addi-tional impurities from the ambient surrounding are negligiblebecause they give no relevant EPR signal.
Figure 13 shows a 2.2 mM solution EPR spectrum ofgalvinoxyl in ethanol at room temperature. It shows a dou-blet absorption centered at g�2.00. Similar patterns wereshown by Scheffler et al.45 for a 0.01 mM solution in an O2free solvent like, for example, toluene. In the latter case asuper-hyperfine splitting with 10 lines was resolved.46 Thehyperfine splitting shown in Fig. 13 originates from the cou-pling of the single electron with the hydrogen proton at themethylcarbon at position 7 �see Fig. 2�. The super-hyperfinesplitting with the other protons is resolved in case of a very
low concentration and an oxygen free solution. In the pre-sented doublet the exchange interaction between the orbitalsof the dissolved molecular oxygen and the orbitals of thesingle molecular electron in the free radical leads to a linebroadening. The fit deducted by the blofit routine47 gives ahyperfine splitting constant of 5.57 Gauss, which is in agree-ment with values found in the literature.45,48
The EPR absorption spectrum obtained from the poly-crystalline specimen shows a flat-topped single peak,
FIG. 11. �Color online� STM topography of galvinoxyl on Au�111�, acquired at room temperature, frame size 11.1 nm by 11.4 nm,cooled to 40 K, STM images measured at room temperature.
FIG. 12. �Color online� Structure models for configuration II.
GALVINOXYL MONOLAYERS ON Au�111� STUDIED BY… PHYSICAL REVIEW B 74, 235424 �2006�
235424-9

Lorentz-type adsorption with a width of 5.91 Gauss betweenpoints of maximum slope �derivative shown in Fig. 14�, cen-tered at g�2.00. The anisotropy characteristic and linewidthis comparable to the data of Mukai et al.48 The high spinexchange interaction between the singly occupied molecularorbitals �SOMO� leads to overlap of the super-hyperfine linesand narrowing of the spectral linewidth.
To measure EPR spectra of galvinoxyl on the Au�111�surface, the substrate was placed parallel to the magneticfield and the electric field as shown in the experimental sec-tion �Sec. II B�. The spectrum shows a singlet with a line-width of 8.1 Gauss, which exceeds the linewidth of the pow-der spectrum in accordance with the higher intermoleculardistance inside the layer compared to the crystal.
The EPR measurements confirm that the radical galvi-noxyl is not reduced upon binding to the surface but is stableand persistent as a free radical. Comparison of the solutionand powder spectra with the spectrum of the single layer
reveals that the exchange frequency �ex, which leads to anexchange narrowing of the absorption line, decreases in theorder �ex��ex�surface layer���ex�solution�. An estimationof the exchange frequency using modified Bloch equationsyields approximately �ex�surface layer��1 GHz. If we as-sume an exchange through directly overlapping of the singleelectron orbitals, an upper limit of 11 Šfor the distancebetween the centers of highest spin density can beestimated.49
The same number of molecules on both the Au�111� layerand a glass substrate of the same size differ in their doubleintegrated spectra: The signal of galvinoxyl on Au�111� isenhanced by a factor of 4.
C. Electrochemical measurements
Additionally to the structural studies we studied the galvi-noxyl bound to the Au�111� surface with cyclic voltammetry.For this purpose we used the cyclic voltammetry method in asetup described in the experimental section.
Cyclic voltammograms of the galvinoxyl coated goldelectrode show well-defined cathodic and anodic peak cur-rents. The linear variation of the peak currents with scan rateand the small peak-to-peak separation are typical character-istics of electroactive surface confined species �Figs. 15�a�and 15�b��.50 The surface coverage �=1.0�10−10 mol cm2
obtained from integration of the area under the voltammetriccurve is less than �=1.4�10−10 mol cm2 and 2.0�10−10 mol cm2 reported for galvinoxyl anchored on a goldsurface via a molecular spacer and spacer diluted with othermolecules, respectively.51–53 In aqueous solution the oxida-tion of the surface bound galvinoxyl is coupled to the loss ofa proton as indicated by the linear dependence of E0 from pHwith a slope of −54 mV/ pH �see Fig. 15�c��. Proton coupledelectron transfer is important in many processes between sur-face and the adsorbed molecules, in this case the galvinoxyl.According to the voltammetric response one could find alinear plot regarding I versus V in both directions. Appropri-ately to the Nernst equation, a plot of E versus pH shouldgive a straight line as we observed in Fig. 15�b�. This sug-gests a one-proton one-electron process while reducing andoxidizing the molecule. The plot of E0 as a function of pHshows a slope of −54 mV/ pH �Fig. 15, III�. This value isclose to the slope of E0 vs pH plot, i.e., −59 mV/ pH, for theone-electron one-proton process showing a Nernstiandependence.50 The same dependence with a slope of−60 mV/ pH was reported for galvinoxyl anchored on a goldsurface via spacer.54
We used the herein obtained results to recalculate thecoverage. Compared to the 1.0�10−10 mol cm2 derived bycyclic voltammetry we found with STM a slightly highercoverage of 1.57±0.16�10−10 mol/cm2, respectively,9.46±0.94�1013 molecules per square cm for configurationI. This corresponds to 0.068 molecules per Au atom com-pared to 0.059 molecules per Au atom calculated for thesecond configuration with a coverage of 1.37±0.16�10−10 mol/cm2, respectively, 8.23±0.82�1013 moleculesper square cm as determined from our STM measurements.
The electrochemical data indicate that the galvinoxylis organized in a dense layer and suggest that a monolayer
FIG. 13. �Color online� EPR measurement of galvinoxyl in eth-anol solution �continuous black line� compared with the fitting ob-tained from blofit �dashed red line�.
FIG. 14. �Color online� EPR measurement of galvinoxyl on theAu�111� �continuous black line� surface compared with the galvi-noxyl powder spectrum �dashed red line�.
NIERMANN et al. PHYSICAL REVIEW B 74, 235424 �2006�
235424-10

is formed like in UHV, possibly with additional clustersaggregated preferentially at the step edges of the surface.
D. Summary
The galvinoxyl molecule forms at least two differenttypes of molecule assemblies on the Au�111� surface. Thefirst configuration is more similar to the structure in galvi-noxyl crystals. The second configuration occurs with cooling
down the sample to 40 K, which suggests relative size ofunit cells playing a role. In both cases a correlation betweenthe sixfold symmetry of the Au�111� top layer and the ar-rangement of the galvinoxyl molecules is present. Conse-quently the substrate structure is relevant for the assembling,although the binding to the surface is estimated to be quiteweak. Probably the whole assembly is only connectedthrough hydrogen bonds or through the weak van der Waalsinteraction. In contrast to configuration II, with configurationI no herringbone reconstruction is observed. It is howevernot clear that the Au�111� reconstruction is lifted with con-figuration I. The reconstruction could remain invisible in theSTM topographies. Note, such sublayer contrasts are difficultto achieve and depend delicately on tip state and tunnellingparameters.
The second structure observed after cooling down to 40 Kgives a density of 8.23�1013 molecules per cm2. The dis-tance between the molecules along the c axis decreases afterthe sample had been cooled down. The reason could be thefactor of 10 between the expansion coefficients of theAu�111� surface and the galvinoxyl molecules. This energyconfiguration change is strong enough to persist uponachieving room temperature and time.
The protruding dots in the topography shown in Fig. 11with two high peaks in a row could be explained by alternateswapping of the galvinoxyl within the stacks. It is assumablethat always two molecules in a row shown in the line sectionstand on the surface like in configuration I and the next twoare flipped. Additionally a localization of the single spin or-bitals could occur related to an eventual ferromagnetic inter-action. Exchange integral and overlap integral depend deci-sively on the intermolecular distance and orientation, i.e., thelattice parameters of the aggregate. Small lattice constants,associated with large SOMO-SOMO overlap, would favorantiferromagnetic coupling or even formation of a molecularbond, while larger lattice constants with small but appre-ciable overlap rather favor ferromagnetic interaction.19
We tried to estimate the signal intensity of the galvinoxylon the Au�111� surface compared to the number of spins. Thesignal intensity for the molecular layer on Au�111� is 4 timeshigher than expected. This may point towards the galvinoxyllayer on the Au�111� surface being ferromagnetic.
The CV results show a slightly lower concentration �about20%� than inferred for the first configuration. This can bedue to a higher density of impurities expected for the goldelectrode surface, which leads to an effectively smaller sur-face area for adsorption.
IV. CONCLUSION
We have found galvinoxyl self-assembles as monolayeron Au�111�. Two different configurations occur, one with aunit cell of 15 Å by 7 Å and the other one with 22.5 Å by5.4 Å. The configurations correspond to coverages of 0.068and 0.059 galvinoxyl molecules per Au atom, respectively,and we suggested structure models for both configurations.
EPR measurements confirmed the galvinoxyl not beingreduced on the Au�111� surface and remaining stable asradical. An estimation of the exchange frequency of
FIG. 15. Voltammetry measurements.
GALVINOXYL MONOLAYERS ON Au�111� STUDIED BY… PHYSICAL REVIEW B 74, 235424 �2006�
235424-11

�1000 MHz yields a more dense packing on the surfacethan in the crystal, involving orbitals from the missing thirddimension into the exchange interaction. The distance be-tween the single spin orbitals could be estimated to besmaller than 11 Å along the c axis.
The electrochemical results suggest the formation of anelectroactive monolayer upon exposure of the gold electrodeto galvinoxyl solution. The monolayer shows the one-electron one-proton transfer Nernstian behavior and the mol-ecule density on the surface ��=6.022�1013
molecule cm2� is compatible with the STM topographies.
ACKNOWLEDGMENTS
This work was supported by Ministry of Sciences andCulture of Lower Saxony through the Ph.D. programSynthesis and Characterisation of Surfaces. Further supportwas provided by NanoNed, the Dutch nanotechnologyprogramme of the Ministry of Economic Affairs, and bythe EU project ASPRINT. The authors wish to acknowledgestimulating discussion with Leroy Cronin, Peter Jaitner,Gilles de Wijs, Rob A. de Groot, Jisk J. Attema, andEmiliano Feresin.
*URL: http://www.evsf2.science.ru.nl/sylvia/; Electronic address:[email protected]
1 F. Schreiber, Prog. Surf. Sci. 65, 151 �2000�.2 K. Mukai, Bull. Chem. Soc. Jpn. 42, 40 �1969�.3 D. E. Williams, Mol. Phys. 16, 145 �1969�.4 C. Durkan and M. E. Welland, Appl. Phys. Lett. 80, 458 �2001�.5 J. L. Pitters, P. G. Piva, X. Tong, and R. A. Wolkow, Nano Lett.
3, 1431 �2003�.6 N. P. Guisinger, R. Basu, and A. S. B. M. C. Hersam, Ann. N.Y.
Acad. Sci. 1006, 227 �2003�.7 M. E. Greene, N. P. Guisinger, R. Basu, A. S. Baluch, and M. C.
Hersam, Surf. Sci. 559, 16 �2004�.8 A. R. Alemozafar and R. J. Madix, J. Phys. Chem. B 109, 11307
�2005�.9 Y. L. Chan, W. W. Pai, and T. J. Chuang, J. Phys. Chem. B 108,
815 �2004�.10 W. W. Pai, Y. L. Chan, and T. J. Chuang, Chin. J. Phys. �Taipei�
43, 212 �2005�.11 W. W. Pai, Z. Zhang, J. Zhang, and J. F. Wendelken, Surf. Sci.
393, L106 �1997�.12 N. Pertaya, Ph.D. thesis, Department of Physics of the Free Uni-
versity Berlin, 2004, Chap. 3.13 D. Matsushitaa, H. Ikedaa, A. Sakaia, S. Zaimab, and Y. Yasuda,
Thin Solid Films 369, 293 �2000�.14 D. Matsushita, H. Ikeda, A. Sakai, S. Zamai, and Y. Yasuda, Jpn.
J. Appl. Phys., Part 1 40, 2827 �2001�.15 N. Takehiro, F. Besenbacher, E. Laegsgaard, K. Tanaka, and I.
Stensgaard, Surf. Sci. 397, 145 �1998�.16 M. Matsumoto, K. Fukutani, T. Okano, K. Miyake, H.
Shigekawa, H. Kato, H. Okuyama, and M. Kawai, Surf. Sci.454-456, 101 �2000�.
17 B. Hammer, Surf. Sci. 459, 323 �2000�.18 S. J. Blundell and F. L. Pratt, J. Phys.: Condens. Matter 16, R771
�2004�.19 M. Kinushita, Jpn. J. Appl. Phys., Part 1 33, 5718 �1994�.20 G. M. Coppinger, J. Am. Chem. Soc. 79, 501 �1957�.21 J. J. Windle and W. H. Thurston, J. Chem. Phys. 27, 1429 �1957�.22 F. Dietz, N. Tyutyulkov, and M. Baumgarten, J. Phys. Chem. B
102, 3912 �1998�.23 S. Luo and K. Yaoa, J. Magn. Magn. Mater. 257, 11 �2003�.24 K. Awaga, T. Sugano, and M. Kinoshita, J. Chem. Phys. 85, 2211
�1986�.25 K. Mukai and A. Sogabe, J. Chem. Phys. 72, 598 �1980�.26 K. Chi, J. Calabrese, J. Miller, and S. Khan, Mol. Cryst. Liq.
Cryst. 176, 185 �1989�.27 P. D. Bartlett and T. Funahashi, J. Am. Chem. Soc. 84, 2596
�1962�.28 Q. Guo, G. Rimbach, H. Moini, S. Weber, and L. Packer, Toxi-
cology 179, 171 �2002�.29 Parcom, Parker Instruments Inc., available at http://
www.parcom.com �2001�.30 N. Niermann et al. �unpublished�.31 E-LINE EPR spectrometer system, technical manual, Varian Re-
port No. 87-125-102, d473 ed., 1971.32 T. H. Degefa, P. Schön, D. Bongard, and L. Walder, J. Electroa-
nal. Chem. 574, 49 �2004�.33 H. by Hyperchem, Hyperchem, available at http://
www.hyper.com �2003�.34 N. Takeuchi, C. T. Chan, and K. M. Ho, Phys. Rev. B 43, 13899
�1991�.35 B. Hulsken, J. W. Gerritsen, and S. Speller, Surf. Sci. 580, 95
�1987�.36 J. A. A. W. Elemans, M. C. Lensen, J. W. Gerritsen, H.
van Kempen, S. Speller, R. J. M. Nolte, and A. E. Rowan, Adv.Mater. �Weinheim, Ger.� 15, 2070 �2004�.
37 S. Ceballos, G. Mariotto, S. Murphy, and I. Shvets, Surf. Sci.523, 131 �2003�.
38 T. K. Yamada, Ph.D. thesis, Radboud University of Nijmegen,2005.
39 G. Grampp, S. Landgraf, K. Rasmussen, and S. Strauss, Spectro-chim. Acta, Part A 58, 1219 �2001�.
40 J. Gomes and J. Gomes, J. Mol. Struct.: THEOCHEM 503, 189�2000�.
41 B. Hulsken, J. Gerritssen, and S. Speller �unpublished�.42 K. Awaga, T. Sugano, and M. Kinoshita, J. Chem. Phys. 87, 3062
�1987�.43 C. Wöll, S. Chiang, R. J. Wilson, and P. H. Lippel, Phys. Rev. B
39, 7988 �1989�.44 In contrast to configuration II, with configuration I no herring-
bone reconstruction is observed. It is however not clear whetherthe Au�111� reconstruction is lifted with configuration I. Thereconstruction could be invisible in the STM topographies. Note,such sublayer contrasts are difficult to achieve and depend deli-cately on tip state and tunnelling parameters.
45 K. Scheffler and H. B. Stegmann, Elektronenspinresonanz, Orga-nische Chemie in Einzeldarstellungen, Band 12 �Springer-Verlag, Berlin, 1976�.
46 E. Müller, K. Ley, K. Scheffler, and R. Mayer, Chem. Ber. 91,
NIERMANN et al. PHYSICAL REVIEW B 74, 235424 �2006�
235424-12

2682 �1958�.47 H.-J. Steinhoff �unpublished�.48 K. Mukai, K. Ueda, K. Ishizu, and Y. Deguchi, J. Chem. Phys.
77, 1606 �1982�.49 G. Jeschke, Rapid Commun. Mass Spectrom. 23, 227 �2002�.50 A. J. Bard and L. R. Faulkner, Electrochemical Methods; Funda-
mentals and Application �Wiley, New York, 1980�.
51 H. O. Finklea and R. M. Haddox, Phys. Chem. Chem. Phys. 3,3431 �2001�.
52 D. A. Shultz and G. N. Tewt, J. Org. Chem. 59, 6159 �1994�.53 T. Sagara and T. Midorikawa, Langmuir 14, 3682 �1998�.54 R. M. Haddox and H. O. Finklea, J. Electroanal. Chem. 550-551,
351 �2003�.
GALVINOXYL MONOLAYERS ON Au�111� STUDIED BY… PHYSICAL REVIEW B 74, 235424 �2006�
235424-13