g.25 traffic modelling report - nzta
TRANSCRIPT

Traffic Modelling Report

Waterview ConnectionWaterview ConnectionWaterview ConnectionWaterview Connection
Status Final July 2010
Document Reference No 20.1.11-R-C-903 G25. Traffic Modelling Report
This report has been prepared for the benefit of the NZ Transport Agency (NZTA). No liability is accepted by
this company or any employee or sub-consultant of this company with respect to its use by any other person.
This disclaimer shall apply notwithstanding that the report may be made available to other persons for an
application for permission or approval or to fulfil a legal requirement.
Quality Assurance StatementQuality Assurance StatementQuality Assurance StatementQuality Assurance Statement
Prepared by: Catherine Rochford, Senior Transportation Planner (Beca)
Reviewed by: Andrew Murray , Technical Director – Transportation (Beca)
Approved for Release : Amelia Linzey , Technical Director – Planning (Beca)

Waterview ConnectionWaterview ConnectionWaterview ConnectionWaterview Connection
Status Final July 2010
Document Reference No 20.1.11-R-C-903 G25. Traffic Modelling Report
NZ Transport AgencyNZ Transport AgencyNZ Transport AgencyNZ Transport Agency
ContentsContentsContentsContents
1. Introduction .......................................................................................................................................... 3
1.1 Background ............................................................................................................................ 3
1.2 Report Purpose ....................................................................................................................... 3
1.3 Project Description ................................................................................................................. 4
1.4 Other Reports ......................................................................................................................... 5
1.5 Report Structure ..................................................................................................................... 5
2. Model Structure ..................................................................................................................................... 7
2.1 Model Structure ...................................................................................................................... 7
2.2 ART3 Demand Model .............................................................................................................. 8
2.3 Project Assignment Model....................................................................................................... 9
2.4 Operational Model ................................................................................................................ 10
3. Project................................................................................................................................................. 11
3.1 Project Description ............................................................................................................... 11
3.2 SH20 Waterview Connection.................................................................................................. 11
3.3 SH16 Upgrade ...................................................................................................................... 11
4. Model Inputs and Assumptions ............................................................................................................ 13
4.1 Forecast Years ...................................................................................................................... 13
4.2 Time Periods......................................................................................................................... 13
4.3 ART3 Assumptions ............................................................................................................... 14
4.4 Project Assignment Model Assumptions ................................................................................ 19
4.5 Operational Model Assumptions............................................................................................ 21
5. Demands............................................................................................................................................. 23
5.1 ART3 Demands..................................................................................................................... 23

Waterview ConnectionWaterview ConnectionWaterview ConnectionWaterview Connection
Status Final July 2010
Document Reference No 20.1.11-R-C-903 G25. Traffic Modelling Report
5.2 Project Assignment Model Demands...................................................................................... 26
5.3 Operational Model Demands ................................................................................................. 29
6. Wider Network Results......................................................................................................................... 32
6.1 Network Wide Effects ............................................................................................................ 32
6.2 Effects on SH16 .................................................................................................................... 34
6.3 Impacts on the Wider State Highway Network ........................................................................ 38
6.4 Impacts on District and Arterial Roads................................................................................... 40
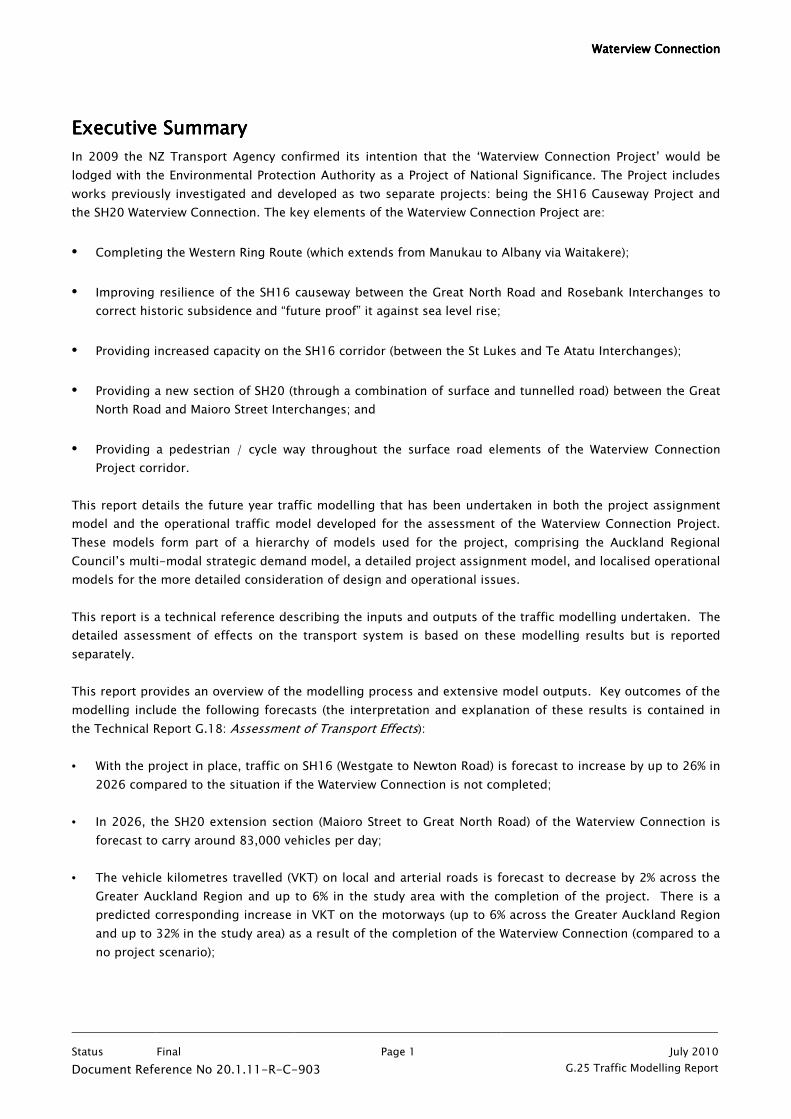
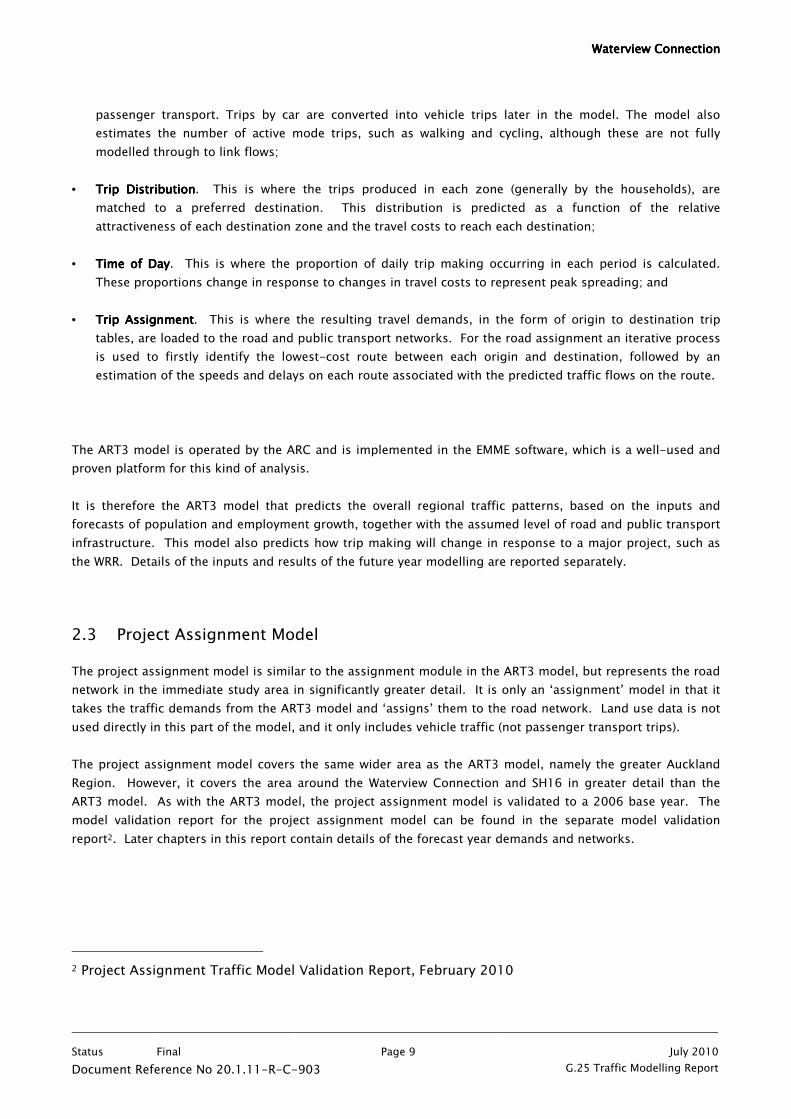
6.5 Users of the SH20 Waterview Connection............................................................................... 43
6.6 Impacts on Travel Times ....................................................................................................... 50
6.7 Impact on HCVs .................................................................................................................... 57
6.8 Impacts on Total Vehicle Kilometres Travelled....................................................................... 59
6.9 Induced Traffic ..................................................................................................................... 61
7. Operational Results ............................................................................................................................. 63
7.1 Background .......................................................................................................................... 63
7.2 Travel Time Results............................................................................................................... 63
7.3 Model Stability ...................................................................................................................... 77
7.4 SIDRA Analysis...................................................................................................................... 79
8. Sensitivity Analysis .............................................................................................................................. 81
8.1 ART3 demand Analysis ......................................................................................................... 81
8.2 Regional Network Assumptions............................................................................................. 85
9. Summary............................................................................................................................................. 91
AppendicesAppendicesAppendicesAppendices
Appendix A - SH16 Interchange Plans
Appendix B – Disaggregation Factors
Appendix C – Application of Matrix Estimation Factors
Appendix D – Daily Factors
Appendix E – Origin/Destination Travel Time Information
Appendix F – Travel Time Route Information

Waterview ConnectionWaterview ConnectionWaterview ConnectionWaterview Connection
Status Final July 2010
Document Reference No 20.1.11-R-C-903 G25. Traffic Modelling Report
Appendix G – Operational Model Stability Analysis – 2006/2016 Five Run Comparison
Appendix H – Operational Model Stability Analysis – 5 Runs vs 10 Runs
Appendix I – Sensitivity Analysis - Traffic Demand Management
Appendix J – Sensitivity Analysis – Fuel Price
Appendix K – Sensitivity Analysis – Additional Waitemata Harbour Crossing
Appendix L – Sensitivity Analysis – CBD Rail Loop
Waterview ConnectionWaterview ConnectionWaterview ConnectionWaterview Connection
Status Final Page 1 July 2010
Document Reference No 20.1.11-R-C-903 G.25 Traffic Modelling Report
Executive SummaryExecutive SummaryExecutive SummaryExecutive Summary
In 2009 the NZ Transport Agency confirmed its intention that the ‘Waterview Connection Project’ would be
lodged with the Environmental Protection Authority as a Project of National Significance. The Project includes
works previously investigated and developed as two separate projects: being the SH16 Causeway Project and
the SH20 Waterview Connection. The key elements of the Waterview Connection Project are:
• Completing the Western Ring Route (which extends from Manukau to Albany via Waitakere);
• Improving resilience of the SH16 causeway between the Great North Road and Rosebank Interchanges to
correct historic subsidence and “future proof” it against sea level rise;
• Providing increased capacity on the SH16 corridor (between the St Lukes and Te Atatu Interchanges);
• Providing a new section of SH20 (through a combination of surface and tunnelled road) between the Great
North Road and Maioro Street Interchanges; and
• Providing a pedestrian / cycle way throughout the surface road elements of the Waterview Connection
Project corridor.
This report details the future year traffic modelling that has been undertaken in both the project assignment
model and the operational traffic model developed for the assessment of the Waterview Connection Project.
These models form part of a hierarchy of models used for the project, comprising the Auckland Regional
Council’s multi-modal strategic demand model, a detailed project assignment model, and localised operational
models for the more detailed consideration of design and operational issues.
This report is a technical reference describing the inputs and outputs of the traffic modelling undertaken. The
detailed assessment of effects on the transport system is based on these modelling results but is reported
separately.
This report provides an overview of the modelling process and extensive model outputs. Key outcomes of the
modelling include the following forecasts (the interpretation and explanation of these results is contained in
the Technical Report G.18: Assessment of Transport Effects):
• With the project in place, traffic on SH16 (Westgate to Newton Road) is forecast to increase by up to 26% in
2026 compared to the situation if the Waterview Connection is not completed;
• In 2026, the SH20 extension section (Maioro Street to Great North Road) of the Waterview Connection is
forecast to carry around 83,000 vehicles per day;
• The vehicle kilometres travelled (VKT) on local and arterial roads is forecast to decrease by 2% across the
Greater Auckland Region and up to 6% in the study area with the completion of the project. There is a
predicted corresponding increase in VKT on the motorways (up to 6% across the Greater Auckland Region
and up to 32% in the study area) as a result of the completion of the Waterview Connection (compared to a
no project scenario);

Waterview ConnectionWaterview ConnectionWaterview ConnectionWaterview Connection
Status Final Page 2 July 2010
Document Reference No 20.1.11-R-C-903 G.25 Traffic Modelling Report
• Similarly the amount of heavy vehicle traffic on local and arterial roads is expected to decrease by 5-8%;
• There is a projected decrease in flow on many of the arterial roads around the project. Travel times on
district and regional arterial roads are either lower or largely unchanged as a result of completing the
Waterview Connection; and
• With the extra traffic attracted to the Waterview Connection, there are some localised movements or
locations with a predicted increase in delay, however; in general, travel conditions on SH16 are expected to
be improved over current conditions, even with the significant increase in traffic that the scheme is
forecast to accommodate.

Waterview ConnectionWaterview ConnectionWaterview ConnectionWaterview Connection
Status Final Page 3 July 2010
Document Reference No 20.1.11-R-C-903 G.25 Traffic Modelling Report
1. Introduction
1.1 Background
In 2009 the NZ Transport Agency confirmed its intention that the ‘Waterview Connection Project’ would be
lodged with the Environmental Protection Authority as a Proposal of National Significance. The Project includes
works previously investigated and developed as two separate projects: being the SH16 Causeway Project and
the SH20 Waterview Connection. The key elements of the Waterview Connection Project are:
• Completing the Western Ring Route (which extends from Manukau to Albany via Waitakere);
• Improving resilience of the SH16 causeway between the Great North Road and Rosebank Interchanges to
correct historic subsidence and “future proof” it against sea level rise;
• Providing increased capacity on the SH16 corridor (between the St Lukes and Te Atatu Interchanges);
• Providing a new section of SH20 (through a combination of surface and tunnelled road) between the Great
North Road and Maioro Street Interchanges; and
• Providing a pedestrian / cycle way throughout the surface road elements of the Waterview Connection
Project corridor.
Beca Infrastructure Ltd, (Beca), has been commissioned by NZTA to undertake transport modelling to assess
the effects of the completion of the Waterview Connection Project.
By completing the alternative strategic route to the Central Motorway Junction (CMJ), the Southern motorway
and the Auckland Harbour Bridge, the Waterview Connection is expected to provide significant relief to both
the city arterials and parts of the wider network.
1.2 Report Purpose
Beca has been working on behalf of NZTA to undertake traffic modelling to forecast the effect of the
completion of the Waterview Connection both during construction and operation, and to inform other aspects
of the assessment of environmental effects being undertaken such as air quality and noise.
The purpose of this report is to detail the findings of the forecast year traffic modelling that has been
undertaken to assess the effects of this project. This report also details the assumptions and inputs to the
traffic modelling that has been undertaken at a regional, project assignment and operational level.

Waterview ConnectionWaterview ConnectionWaterview ConnectionWaterview Connection
Status Final Page 4 July 2010
Document Reference No 20.1.11-R-C-903 G.25 Traffic Modelling Report
1.3 Project Description
The Project includes key works proposed by the NZTA to progress completion of the Waterview Connection.
This project includes works on both SH16 and SH20. Figure 1.1 Figure 1.1 Figure 1.1 Figure 1.1 shows the location of the proposed work.
Figure 1.1 Figure 1.1 Figure 1.1 Figure 1.1 –––– Location of the Project Location of the Project Location of the Project Location of the Project
In summary, the project works includes the following:
• Improving the resilience of the WRR (by raising the causeway on SH16 between Great North Road and
Rosebank Interchanges to correct historic subsidence and “future proof” it against sea level rise);
• Providing increased capacity on the SH16 corridor (between St Lukes and eventually to Westgate
Interchanges); and
• Providing a new section of SH20 between the Great North Road and Maioro Street Interchanges.

Waterview ConnectionWaterview ConnectionWaterview ConnectionWaterview Connection
Status Final Page 5 July 2010
Document Reference No 20.1.11-R-C-903 G.25 Traffic Modelling Report
On SH20 the Project will extend SH20 from its current termination at the Maioro Street Interchange, and
connect it with SH16 at Waterview and Point Chevalier (at the Great North Road Interchange). The new section
of SH20 is approximately 5.5km in length and passes through or beneath the suburbs of Owairaka, Avondale
and Point Chevalier. Further details of the project can be found in Chapter Chapter Chapter Chapter 3333 of this report of this report of this report of this report.
1.4 Other Reports
The main transport assessment is documented in the Technical Report G.18: Assessment of Transport Effects.
There are a number of technical reports which support the full transport assessment which has been
undertaken for this project. These are as follows:
• Traffic Model Scoping Report, May 2009;
• Project Assignment Traffic Model Validation Report, February 2010;
• Technical Report G.26: Operational Traffic Model Validation Report, July 2010;
• Technical Report G.25: Traffic Modelling Report, July 2010; and
• Technical Report G.16: Assessment of Temporary Traffic Effects, July 2010.
This report forms the Technical Report G.2Technical Report G.2Technical Report G.2Technical Report G.25: 5: 5: 5: Traffic Modelling ReportTraffic Modelling ReportTraffic Modelling ReportTraffic Modelling Report, Ju, Ju, Ju, July 2010ly 2010ly 2010ly 2010. It is intended as a technical
model reference report, with the interpretation and analysis being included in the Technical Report G.18:
Assessment of Transport Effects.
1.5 Report Structure
The remainder of this report is structured as follows:
• Chapter 2: Discusses the structure of the modelling system used to undertake the assessments;
• Chapter 3: Contains the project description;
• Chapter 4: Details the assumptions used in the modelling;
• Chapter 5: Details the demands used and processes for disaggregation and application of factors;
• Chapter 6: Contains an assessment of the wider network results;
• Chapter 7: Contains an assessment of the operational traffic assessments;
• Chapter 8: Details the results of the sensitivity analysis undertaken; and

Waterview ConnectionWaterview ConnectionWaterview ConnectionWaterview Connection
Status Final Page 6 July 2010
Document Reference No 20.1.11-R-C-903 G.25 Traffic Modelling Report
• Chapter 9: Contains the conclusions of this report.

Waterview ConnectionWaterview ConnectionWaterview ConnectionWaterview Connection
Status Final Page 7 July 2010
Document Reference No 20.1.11-R-C-903 G.25 Traffic Modelling Report
2. Model Structure
This chapter summarises the structure of the traffic models used for the assessment of environmental effects
of the project. The development and validation of each of these models is described in more detail in separate
validation reports as follows:
• Strategic Demand Model - Auckland Transport Models Project (ATM2) ART3 Model Testing and Validation
Report, August 20081;
• Project Assignment Model – Project Assignment Traffic Model Validation Report, February 2010; and
• Operational Model – Technical Report G.26: Operational Model Validation Report, July 2010.
2.1 Model Structure
The WRR project follows the hierarchical modelling structure used successfully on other major projects across
the Auckland region since the early 1990’s such as SH1-SH20 link in Manukau, SH20 Manukau Harbour
Crossing and SH18 Hobsonville Deviation. This involves the following three components:
• A strategic DemandDemandDemandDemand model that relates land use (such as population and employment), to person travel
patterns at a strategic, region-wide level;
• A Project AssignmentProject AssignmentProject AssignmentProject Assignment model, which is similar in area to the demand model, but has a more refined
network in the project area. This model loads the vehicle trip patterns predicted by the demand model
onto the road network to test various options and investigate the traffic effects at a more detailed level;
and
• An Operational Operational Operational Operational model, which uses micro-simulation to look at specific intersections and connections in
even greater detail.
It is the project assignmentproject assignmentproject assignmentproject assignment and operationaloperationaloperationaloperational models which are the subject of this traffic modelling report.
Details are also included with respect to the assumptions used in the strategic demanddemanddemanddemand model. The hierarchy of
models is required as it is not practical to develop a system in a single model to cover both the strategic
demand issues across the whole region and the detailed local operational effects. This hierarchical system has
been used successfully on most major projects in the Auckland region (and elsewhere) and is a common
modelling approach.
1 Please contact the Auckland Regional Council (ARC) for this report

Waterview ConnectionWaterview ConnectionWaterview ConnectionWaterview Connection
Status Final Page 8 July 2010
Document Reference No 20.1.11-R-C-903 G.25 Traffic Modelling Report
Figure 2.1Figure 2.1Figure 2.1Figure 2.1 details the model structure, and the DemandDemandDemandDemand, Project AssignmentProject AssignmentProject AssignmentProject Assignment and Operational Operational Operational Operational models
components are described following.
Figure 2.1 Figure 2.1 Figure 2.1 Figure 2.1 –––– Model Structure Model Structure Model Structure Model Structure
2.2 ART3 Demand Model
The ART3 model is a 4-step multi-modal model. This model has recently been developed based on extensive
data collected in 2006 (the ‘ART3’ model). It has a base year of 2006 which was developed using Census data,
and a full model validation exercise was undertaken. The ART3 model produces demands for five periods of
the day, and separate assignment models exist for the morning and evening peak and weekday inter-peak
periods.
The model itself comprises of the following key modules:
• Trip GenerationTrip GenerationTrip GenerationTrip Generation. This is where the number of person-trips are estimated as a function of the land use data
(population, employment, school roll etc);
• Mode ChoiceMode ChoiceMode ChoiceMode Choice. This is where the choice of preferred travel mode is determined, based on the relative costs
of the various modes. The ART3 modes for mode choice are car (driver and passengers combined) and
Waterview ConnectionWaterview ConnectionWaterview ConnectionWaterview Connection
Status Final Page 9 July 2010
Document Reference No 20.1.11-R-C-903 G.25 Traffic Modelling Report
passenger transport. Trips by car are converted into vehicle trips later in the model. The model also
estimates the number of active mode trips, such as walking and cycling, although these are not fully
modelled through to link flows;
• Trip DistributionTrip DistributionTrip DistributionTrip Distribution. This is where the trips produced in each zone (generally by the households), are
matched to a preferred destination. This distribution is predicted as a function of the relative
attractiveness of each destination zone and the travel costs to reach each destination;
• Time of DayTime of DayTime of DayTime of Day. This is where the proportion of daily trip making occurring in each period is calculated.
These proportions change in response to changes in travel costs to represent peak spreading; and
• Trip AssignmentTrip AssignmentTrip AssignmentTrip Assignment. This is where the resulting travel demands, in the form of origin to destination trip
tables, are loaded to the road and public transport networks. For the road assignment an iterative process
is used to firstly identify the lowest-cost route between each origin and destination, followed by an
estimation of the speeds and delays on each route associated with the predicted traffic flows on the route.
The ART3 model is operated by the ARC and is implemented in the EMME software, which is a well-used and
proven platform for this kind of analysis.
It is therefore the ART3 model that predicts the overall regional traffic patterns, based on the inputs and
forecasts of population and employment growth, together with the assumed level of road and public transport
infrastructure. This model also predicts how trip making will change in response to a major project, such as
the WRR. Details of the inputs and results of the future year modelling are reported separately.
2.3 Project Assignment Model
The project assignment model is similar to the assignment module in the ART3 model, but represents the road
network in the immediate study area in significantly greater detail. It is only an ‘assignment’ model in that it
takes the traffic demands from the ART3 model and ‘assigns’ them to the road network. Land use data is not
used directly in this part of the model, and it only includes vehicle traffic (not passenger transport trips).
The project assignment model covers the same wider area as the ART3 model, namely the greater Auckland
Region. However, it covers the area around the Waterview Connection and SH16 in greater detail than the
ART3 model. As with the ART3 model, the project assignment model is validated to a 2006 base year. The
model validation report for the project assignment model can be found in the separate model validation
report2. Later chapters in this report contain details of the forecast year demands and networks.
2 Project Assignment Traffic Model Validation Report, February 2010

Waterview ConnectionWaterview ConnectionWaterview ConnectionWaterview Connection
Status Final Page 10 July 2010
Document Reference No 20.1.11-R-C-903 G.25 Traffic Modelling Report
2.4 Operational Model
Operational models are used to assess localised issues in more detail than is possible in the project
assignment model. They are primarily to investigate specific design issues such as length of intersection turn
lanes, likely length of queues and performance of motorway merge and weave areas. The operational model
developed to assess the Waterview Connection project is a simulation model developed in the S-Paramics
software covering SH20 between the Maioro Street interchange and SH16 as well as the length of SH16
between the Newton Road interchange and the Westgate interchange. This model obtains travel demands, in
the form of origin-destination trip tables, from the project assignment model. These trip tables are then
loaded as flow rates into the simulation models, along with assumed flow profiles to represent the build-up
and dissipation of peak traffic flows.
Again, the simulation model has been calibrated and validated to a 2006 base year, details of which are
included in the separate validation report3. Later chapters in this report contain details of the forecast year
demands and networks.
3 Technical Report G.26: Operational Model Validation Report, July 2010

Waterview ConnectionWaterview ConnectionWaterview ConnectionWaterview Connection
Status Final Page 11 July 2010
Document Reference No 20.1.11-R-C-903 G.25 Traffic Modelling Report
3. Project
This chapter describes the project that has been tested and reported in this document.
3.1 Project Description
Two scenarios have been developed for the assessment of effects, a ‘Do-Minimum’ and an ‘Option’. The Do-
Minimum does not contain the Waterview Connection, with the Option including the Waterview Connection (the
level of widening assumed on SH16 is dependant on the forecast year).
All other network assumptions remain the same between the two scenarios. Descriptions of the Waterview
Connection are contained in the following sections.
3.2 SH20 Waterview Connection
In both 2016 and 2026, for the purposes of the transport modelling and assessment, the proposed SH20
extension is assumed to be a 6-lane motorway, with north facing ramps at the Maioro Street interchange (the
south facing ramps and bridge are assumed to have been constructed before 2016), and joining to SH16 at the
Great North Road interchange with east and west facing ramps.
Chapter 4Chapter 4Chapter 4Chapter 4 contains discussion of why the years 2016 and 2026 have been chosen for the analysis years.
3.3 SH16 Upgrade
Table 3.1Table 3.1Table 3.1Table 3.1 details the assumed widening on SH16 and in which forecast year this has been included. In the
Option for 2016 and 2026, interchange upgrades are assumed at Lincoln Road and Te Atatu Road
interchanges. Plan of the upgrades is shown in Appendix Appendix Appendix Appendix AAAA and also can be seen in the Plan set F.2 Drawing
No. 20.1.11-3-D-C-910-102.

Waterview ConnectionWaterview ConnectionWaterview ConnectionWaterview Connection
Status Final Page 12 July 2010
Document Reference No 20.1.11-R-C-903 G.25 Traffic Modelling Report
Table 3.1 Table 3.1 Table 3.1 Table 3.1 –––– SH16 Widening SH16 Widening SH16 Widening SH16 Widening
Number of LanesNumber of LanesNumber of LanesNumber of Lanes SectionSectionSectionSection
2006200620062006 2016/2026 Do 2016/2026 Do 2016/2026 Do 2016/2026 Do
MinimumMinimumMinimumMinimum
2016 Option2016 Option2016 Option2016 Option 2026 Option2026 Option2026 Option2026 Option
WestboundWestboundWestboundWestbound
St Lukes to Great North Road 3 3 4 4
Through Great North Road
Interchange 3 3 3 3
Great North Road to Rosebank 3 3 5 5
Rosebank to Patiki 3 3 4 4
Patiki to Te Atatu Road 3 3 4 4
Te Atatu Road to Lincoln Road 2 2 3 3
Lincoln Road to Royal Road 2 2 2 3
Royal Road to Westgate 2 2/3 3 3
EastboundEastboundEastboundEastbound
Westgate to Royal Road 2 2/3 3 3
Royal Road to Lincoln Road 2 2 2 3
Lincoln Road to Te Atatu Road 2 2 3 3
Te Atatu Road to Patiki 3 3 4 4
Patiki to Rosebank 3 3 4 4
Rosebank to Great North Road 3 3 4 4
Through Great North Road
interchange 3 3 3 3
Great North Road to St Lukes 3 3 4 4

Waterview ConnectionWaterview ConnectionWaterview ConnectionWaterview Connection
Status Final Page 13 July 2010
Document Reference No 20.1.11-R-C-903 G.25 Traffic Modelling Report
4. Model Inputs and Assumptions
This chapter describes the key inputs and assumptions made to create the future forecasts in the ART3 model,
the project assignment model and the operational modelling.
4.1 Forecast Years
Two forecast years have been used, 2016 (to represent the opening year for the project) and 2026 (to
represent 10 years post opening). These forecast years are consistent with the requirements of other
environmental assessments such as noise and air quality.
4.2 Time Periods
Based on the ART3 demands, the project assignment model covers the following three time periods:
• AM Peak (07:00 to 09:00);
• Inter-peak (a 2-hour average of the 09:00 – 16:00 period)4; and
• PM Peak (16:00 to 18:00).
Three separate models for these time periods exist in the project assignment model. Factors are applied to
each of the three peaks to create daily flows (see Chapter 6Chapter 6Chapter 6Chapter 6).
4 The ART3 Inter-peak model covers average of the 09:00 – 15:00 period; however the average was
within 1% in difference of the 09:00-16:00 period.

Waterview ConnectionWaterview ConnectionWaterview ConnectionWaterview Connection
Status Final Page 14 July 2010
Document Reference No 20.1.11-R-C-903 G.25 Traffic Modelling Report
Waterview: Combined Flow Profile
0
2000
4000
6000
8000
10000
12000
14000
16000
18000
20000
0000
-0100
0200
-0300
0400
-0500
0600
-0700
0800
-0900
1000
-1100
1200
-1300
1400
-1500
1600
-1700
1800
-1900
2000
-2100
2200
-230
0
Time
Flo
w (v
ph
)
5-DAY
W'end
Figure 4.1 Figure 4.1 Figure 4.1 Figure 4.1 –––– Combined Flow Profile Combined Flow Profile Combined Flow Profile Combined Flow Profile
The typical hourly flow profile of traffic in the study area is shown in Figure 4.1Figure 4.1Figure 4.1Figure 4.1. The 5-day and weekend
profiles are both averaged over a number of count sites, within the study area. The SH16 traffic flows are tidal
in nature where higher proportion of traffic travels to the city in the AM peak while during the PM period
majority of the traffic travels in the westbound direction.
The operational model has two, four-hour long time periods, as follows:
• AM Peak (06:00 to 10:00); and
• PM Peak (15:45 – 18:45).
4.3 ART3 Assumptions
The following sub-sections detail the specific ART3 inputs and assumptions that have been used in terms of
networks, land use and policy. The assumptions related to future projects were agreed with NZTA specifically
for this project, however, the other inputs and assumptions were based on adopting those developed by the
ARC for the purpose of modelling for the update to the Auckland Regional Transport Strategy (RLTS).
4.3.1 Do –Minimum Networks
The Do-Minimum scenario represents the minimum investment needed in the study corridor to maintain
operations and hence represents the ‘no project’ case. It is however assumed to include new projects and
upgrades outside the study corridor, and these assumptions are common to the ‘no project’ and ‘project’
scenarios.

Waterview ConnectionWaterview ConnectionWaterview ConnectionWaterview Connection
Status Final Page 15 July 2010
Document Reference No 20.1.11-R-C-903 G.25 Traffic Modelling Report
The following Table Table Table Table 4444.1.1.1.1 details the roading, rail and bus network assumptions in the ART3 model for the Do-
Minimum scenario for 2016 and 2026. The ‘�‘ indicates the modelled years(s) in which the scheme was
included.
TableTableTableTable 4 4 4 4.1 .1 .1 .1 –––– ART3 Model Assumptions ART3 Model Assumptions ART3 Model Assumptions ART3 Model Assumptions (Do (Do (Do (Do----minimum)minimum)minimum)minimum)
ProjectProjectProjectProject 2016201620162016 2026202620262026
Roading ProjectsRoading ProjectsRoading ProjectsRoading Projects
Regional Arterial Road plan (RARP) � �
SH1 Wainui Interchange � �
SH1 Alpurt � �
Central Motorway Junction Stage 2 � �
SH18 Greenhithe � �
SH18 Hobsonville � �
SH1 Esmonde Interchange � �
SH1 Onewa Interchange � �
SH1 Victoria Park Tunnel � �
SH1 Newmarket Viaduct � �
SH1 Highbrook Interchange � �
SH1 Papakura Interchange � �
SH20 Mt Roskill � �
SH20 Maukau Harbour Crossing � �
SH20 – SH1 Manukau � �
SH20A � �
SH1 Widening (various) � �
AMETI stage 1 � �
PENLINK � �
Tiverton/Wolverton � �
South West to East Tamaki Stage 1 � �
Redoubt Road � �
Glenfield Road �
Massey North �
SH16 Grafton Gulley Stage 3 �

Waterview ConnectionWaterview ConnectionWaterview ConnectionWaterview Connection
Status Final Page 16 July 2010
Document Reference No 20.1.11-R-C-903 G.25 Traffic Modelling Report
AMETI Stage 2 �
South West to East Tamaki Stage 2 �
SH20 B �
Mill Road Corridor Stage 1 �
Pukekohe Eastern Corridor �
Rail ProjectsRail ProjectsRail ProjectsRail Projects
Electrification � �
Onehunga Branch � �
Manukau Spur � �
CBD Rail Loop �
Bus ProjectsBus ProjectsBus ProjectsBus Projects
Central Transit Corridor � �
Northern Busway � �
Bus Lanes (various) � �
Northern Busway extension to Silverdale �
In addition to the above, the ART3 model assumes increases in rail and bus services in line with the Auckland
Regional Transport Authorities (ARTA) Passenger Transport Network Plan (PTNP). The growth in rail, bus and
also ferry services can be seen in the assumed changes in service-km as shown in Table 4.2Table 4.2Table 4.2Table 4.2.
Table 4.Table 4.Table 4.Table 4.2222 –––– ART3 ART3 ART3 ART3 PublicPublicPublicPublic Transport Services Improvements Transport Services Improvements Transport Services Improvements Transport Services Improvements
PeriodPeriodPeriodPeriod ModeModeModeMode 2006 Service km2006 Service km2006 Service km2006 Service km Growth to 2016Growth to 2016Growth to 2016Growth to 2016 Growth to 2026Growth to 2026Growth to 2026Growth to 2026
Bus 25,304 36% 56%
Rail 1,049 120% 378% AM
Ferry 552 94% 133%
Bus 16,543 85% 111%
Rail 803 113% 236% IP
Ferry 231 187% 244%
PM Bus 27,120 27% 44%

Waterview ConnectionWaterview ConnectionWaterview ConnectionWaterview Connection
Status Final Page 17 July 2010
Document Reference No 20.1.11-R-C-903 G.25 Traffic Modelling Report
Rail 1,128 108% 345%
Ferry 593 73% 108%
Table 4.Table 4.Table 4.Table 4.2222 shows very substantial increases in services across all modes, and especially in the inter-peak
periods. The bus services show the lowest proportional increase, but due to the higher current quantity of bus
services they have the largest actual increase.
The ferry network/services are assumed to grow in accordance with the PTNP to 2016, with a further 20%
increase in services by 2026. Ferry-km, which are a reflection of the services and frequencies provided, are
modelled to grow by over 100% in the peaks and more than 240% in the off peaks.
The ART3 model also assumes that integrated ticketing and integrated fares are in place in 2016 and 2026.
No increases in public transport fares were included (in real terms), and no specific allowance for differential
increases in willingness to pay.
4.3.2 Option Networks
The following was assumed for the Option networks:
• 2016 – Do Minimum plus the Waterview Connection (with widening assumed on SH16 between St Lukes to
Lincoln interchanges); and
• 2026 - Do Minimum plus the Waterview Connection (with widening assumed on SH16 between the St
Lukes interchange and Westgate).
4.3.3 Land use
Table Table Table Table 4444....3333 displays the population and employment assumed in the ART3 model. The zone-by-zone forecasts
are those used in the modelling undertaken by the ARC for the Regional Land Transport Strategy (RLTS), dated
15/09/2009.

Waterview ConnectionWaterview ConnectionWaterview ConnectionWaterview Connection
Status Final Page 18 July 2010
Document Reference No 20.1.11-R-C-903 G.25 Traffic Modelling Report
Table Table Table Table 4444....3333 –––– Population and Employment Assumed in the ART3 model Population and Employment Assumed in the ART3 model Population and Employment Assumed in the ART3 model Population and Employment Assumed in the ART3 model
2006200620062006 2016201620162016 2026202620262026
Population 1,347,377 1,580,525 1,796,111
Employment 520,251 625,684 729,840
Table Table Table Table 4444....3333 shows that between 2006 and 2016 there will be an increase in population of 17% with a further 14%
increase between 2016 and 2026 (giving a total increase of 33% between 2006 and 2026). In terms of
employment, there is a projected 20% increase in jobs between 2006 and 2016, with a further increase of 17%
between 2016 and 2026 (a total of 40% between 2006 and 2026).
4.3.4 Fuel price
The ART3 model contains assumptions relating to fuel price. Fuel price in this case means the pump price for
fuel. The following pump prices have been included (all in $2006):
• 2006 - $1.55 per litre;
• 2016 - $2.38 per litre; and
• 2026 - $2.75 per litre.
These values were as adopted by the RLTS and were applied to the vehicle costs. As per the RLTS, these fuel
prices were applied to the 2006 average consumption of 10 litres per 100km.
4.3.5 Travel Demand Management
The ART3 model does not explicitly respond to changes to non-price Travel Demand Management (TDM)-type
measures, and instead the RLTS modelling asserts behaviour change in the models. Table 4.3 details the ART3
model assumptions relating to travel demand management (TDM). The values represent the percent of a
particular modelled trip purpose that is assumed to change from private to public or active mode travel e.g.
Workplace travel plan is targeted towards Home Based Work trips, Community travel plans targeted at Home
Based Shopping and Home Based Other trips, with School/Tertiary travel plans being targeted towards Home
Based Education trips.

Waterview ConnectionWaterview ConnectionWaterview ConnectionWaterview Connection
Status Final Page 19 July 2010
Document Reference No 20.1.11-R-C-903 G.25 Traffic Modelling Report
Table Table Table Table 4444....4444 –––– Traffic Demand Management Assumed in the ART3 model Traffic Demand Management Assumed in the ART3 model Traffic Demand Management Assumed in the ART3 model Traffic Demand Management Assumed in the ART3 model
TDM initiativeTDM initiativeTDM initiativeTDM initiative 2006200620062006 2016201620162016 2026202620262026
Non Price TDM initiative:
Workplace travel plans
to non-RGS5 areas
0% 1.25% 2.5%
Non Price TDM initiative:
Workplace travel plans
to RGS areas including
the CBD
0% 15% 15%
Non Price TDM initiative:
School and Tertiary
travel plans
0% 5% 9%
Non Price TDM initiative:
Community travel plans 0% 3% 6%
Work at home 17% 20% 23%
4.4 Project Assignment Model Assumptions
4.4.1 Do-Minimum Networks
Although the project assignment model uses broadly the same network assumptions as the ART3 model, it
also assumes some additional local small scale projects. Table Table Table Table 4444....5555 details the network assumptions in the
project assignment Do-Minimum model. Those projects highlighted are additional to those included in the
ART3 model assumptions.
Table Table Table Table 4444....5555 –––– Project Assignment Model Network Assumptions Project Assignment Model Network Assumptions Project Assignment Model Network Assumptions Project Assignment Model Network Assumptions
ProjectProjectProjectProject 2016201620162016 2026202620262026
Regional Arterial Road plan (RARP) � �
SH1 Alpurt � �
Central Motorway Junction Stage 2 � �
SH18 Greenhithe Deviation � �
Central Transit Corridor � �
SH1 Esmonde Interchange � �
5 RGS zones are areas defined in the model to have high-density, mixed land use.

Waterview ConnectionWaterview ConnectionWaterview ConnectionWaterview Connection
Status Final Page 20 July 2010
Document Reference No 20.1.11-R-C-903 G.25 Traffic Modelling Report
SH1 East Tamaki Interchange � �
SH1 Papakura Interchange improvements � �
Northern Busway Stage 1 � �
SH1 Onewa � �
SH1 to SH20 Manukau � �
SH1 Newmarket Viaduct � �
SH1 Victoria Park Tunnel � �
SH1 Widening (Ellerslie to Greenlane, Northcote to Sunnynook) � �
SH1 Redoubt Road � �
SH20A � �
AMETI Stage 1 � �
AMETI Stage 2 �
Northern Busway Stage 2 � �
SH1 Wainui interchange � �
PENLINK � �
South-West to East Tamaki Stage 1 � �
South-West to East Tamaki Stage 2 �
SH16 Brigham Creek Extension � �
SH18 Hobsonville Deviation � �
SH18 Upper Harbour Bridge Duplication � �
SH20 Mt Roskill 4-laning �
SH20 Mt Roskill 6-laning �
SH20 Manukau Harbour Crossing � �
SH20 Maioro Street Half Diamond Interchange � �
Universal Drive extension � �
Central Park Drive Extension � �
Massey North/NORSGA internal network � �
New Lynn Transit Orientated Design Improvements � �
Tiverton/Wolverton Stage 1 � �
Tiverton/Wolverton Stage 2 � �
SH16 3rd Westbound Lane through Great North Road interchange � �

Waterview ConnectionWaterview ConnectionWaterview ConnectionWaterview Connection
Status Final Page 21 July 2010
Document Reference No 20.1.11-R-C-903 G.25 Traffic Modelling Report
Mill Road Corridor Stage 1 �
Glenfield Road �
SH16 Grafton Gully Stage 3 �
SH1 Widening (Hill Road to Hingia) �
SH20B Widening �
Pukekohe Eastern Corridor �
Ramp Signalling (SH1, SH16, SH18 and SH20) � �
4.4.2 Option Networks
The following was assumed for the Option networks:
• 2016 – Do Minimum plus SH20 Waterview Connection, SH16 Widening (St Lukes to Lincoln) and
interchange upgrades at Te Atatu Road and Lincoln Road; and
• 2026 - Do Minimum plus SH20 Waterview Connection, SH16 Widening (St Lukes to Westgate) and
interchange upgrades at Te Atatu Road and Lincoln Road.
4.5 Operational Model Assumptions
As the function of the operational model is to assess the operation of the project, a do-minimum model has
not been developed for future years.
4.5.1 Option Networks
Table 4.Table 4.Table 4.Table 4.6666 details the network assumptions in operational Option model.
Table Table Table Table 4.4.4.4.6666 –––– Network Assumptions in Operational Option ModelNetwork Assumptions in Operational Option ModelNetwork Assumptions in Operational Option ModelNetwork Assumptions in Operational Option Model
ProjectProjectProjectProject 2016201620162016 2026202620262026
SH16 3rd Westbound Lane through Great North Road interchange � �
Ramp Signalling (SH16) � �
Westbound Great North Road Interchange priority lanes � �
SH20 Maioro Street Interchange � �

Waterview ConnectionWaterview ConnectionWaterview ConnectionWaterview Connection
Status Final Page 22 July 2010
Document Reference No 20.1.11-R-C-903 G.25 Traffic Modelling Report
SH20 Waterview Connection � �
SH16 Widening St Lukes to Lincoln � �
Te Atatu interchange upgrade � �
Lincoln Road Interchange Upgrade � �
Sh16 Widening Lincoln to Westgate �
It should be noted that the configuration for the Te Atatu and Lincoln interchanges included in the Operational
model is slightly different to that in the project assignment model, due to advancements in the design of the
interchanges which have taken place between the developments of the two models (the project assignment
model uses designs from September 2009, the operational model includes ones from April 2010). However, it
is not considered that this will materially affect the results in the project assignment model.

Waterview ConnectionWaterview ConnectionWaterview ConnectionWaterview Connection
Status Final Page 23 July 2010
Document Reference No 20.1.11-R-C-903 G.25 Traffic Modelling Report
5. Demands
This chapter discusses the demands originating from the ART3 model, and how they are used in the project
assignment and operational models.
5.1 ART3 Demands
The forecast year vehicle demands for the project model area were obtained from the ART3 model for the do–
minimum and the option and using the inputs and assumptions described earlier. Based on the ART3
demands, the project assignment model covers the following three time periods:
• AM Peak (07:00 to 09:00);
• Inter-peak (a 2-hour average of the 09:00 – 15:00 period); and
• PM Peak (16:00 to 18:00).
Matrices were received by period for the following purposes:
• Home Based Work trips;
• Home Based Education trips;
• Home Based Shopping trips;
• Home Based Other trips;
• Non-Home Based Other trips;
• Employers Business trips; and
• Medium/Heavy Commercial Vehicle trips.
Table 5.Table 5.Table 5.Table 5.1111 displays the ART3 trip totals by purpose as received from the ARC for 2006, with Tables 5.2 and 5.3
displaying the same for 2016 and 2026 respectively.

Waterview ConnectionWaterview ConnectionWaterview ConnectionWaterview Connection
Status Final Page 24 July 2010
Document Reference No 20.1.11-R-C-903 G.25 Traffic Modelling Report
Table 5.1 Table 5.1 Table 5.1 Table 5.1 –––– 2006 2006 2006 2006 ART3 Total Vehicle Demand Totals (per 2ART3 Total Vehicle Demand Totals (per 2ART3 Total Vehicle Demand Totals (per 2ART3 Total Vehicle Demand Totals (per 2----hour period)hour period)hour period)hour period)
Total TripsTotal TripsTotal TripsTotal Trips PurposePurposePurposePurpose
AM IP PM
Home Based Work 176,513 44,830 167,359
Home Based Education 34,797 14,430 12,368
Home Based Shopping 17,853 64,396 41,838
Home Based Other 116,398 143,387 148,330
Non-Home Based Other 52,483 126,356 71,878
Employers Business 67,690 41,271 67,297
Medium/Heavy Commercial
Vehicles
23,059 25,141 18,870
Total 488,793 459,811 527,940
Table 5.Table 5.Table 5.Table 5.2222 –––– 2016 2016 2016 2016 ART3 ART3 ART3 ART3 Total Vehicle Total Vehicle Total Vehicle Total Vehicle Demand Totals (per 2Demand Totals (per 2Demand Totals (per 2Demand Totals (per 2----hour period)hour period)hour period)hour period)
Total TripsTotal TripsTotal TripsTotal Trips
AMAMAMAM IPIPIPIP PMPMPMPM
PurposePurposePurposePurpose
DoDoDoDo----
MinimumMinimumMinimumMinimum OptionOptionOptionOption DoDoDoDo----
MinimumMinimumMinimumMinimum OptionOptionOptionOption
DoDoDoDo----
MinimumMinimumMinimumMinimum OptionOptionOptionOption
Home Based Work 194,122 194,554 49,400 49,351 183,858 183,994
Home Based Education 31,333 31,459 12,809 12,794 11,053 11,048
Home Based Shopping 21,766 21,827 78,000 78,017 49,920 49,962
Home Based Other 139,951 140,218 171,457 171,436 177,201 177,211
Non-Home Based Other 59,132 59,285 140,288 140,359 80,217 80,284
Employers Business 72,339 72,706 44,696 44,661 72,139 72,165
Medium/Heavy
Commercial Vehicles 35,222 35,222 38,423 38,423 28,783 28,783
Total 553,865 555,271 535,073 535,041 603,171 603,447

Waterview ConnectionWaterview ConnectionWaterview ConnectionWaterview Connection
Status Final Page 25 July 2010
Document Reference No 20.1.11-R-C-903 G.25 Traffic Modelling Report
Table 5.Table 5.Table 5.Table 5.3333 –––– 2026 ART3 2026 ART3 2026 ART3 2026 ART3 Total Vehicle Total Vehicle Total Vehicle Total Vehicle Demand Totals (per 2 Demand Totals (per 2 Demand Totals (per 2 Demand Totals (per 2----hour period)hour period)hour period)hour period)
Total TripsTotal TripsTotal TripsTotal Trips
AMAMAMAM IPIPIPIP PMPMPMPM
PurposePurposePurposePurpose
DoDoDoDo----
MinMinMinMinimumimumimumimum OptionOptionOptionOption DoDoDoDo----
MinimumMinimumMinimumMinimum OptionOptionOptionOption
DoDoDoDo----
MinimumMinimumMinimumMinimum OptionOptionOptionOption
Home Based Work 201,938 202,554 52,233 52,206 192,380 192,715
Home Based Education 34,177 34,314 13,906 13,899 12,046 12,047
Home Based Shopping 23,413 23,487 83,311 83,352 53,633 53,731
Home Based Other 157,174 157,458 192,027 192,028 198,585 198,685
Non-Home Based Other 63,757 63,911 149,956 150,016 86,347 86,445
Employers Business 75,194 75,626 46,783 46,760 74,552 74,662
Medium/Heavy
Commercial Vehicles 52,784 52,785 57,589 57,589 43,187 43,187
Total 608,437 610,135 595,805 595,850 660,730 661,472
From Tables 5.1Tables 5.1Tables 5.1Tables 5.1 – 5.35.35.35.3 the following can be determined:
• Between 2006 and 2016 (Do-Minimum) there is a growth in vehicle trips of 13% in the AM peak, 16% in the
inter-peak, and 14% in the PM peak;
• Overall traffic growth between 2006 and 2026 is 24% which compares to population growth of 33% and
employment growth of 40%, implying a significant switch to other modes;
• Between 2016 (Do-Minimum) and 2026 (Do-Minimum), there is a further growth of 10% in the AM and PM
peaks, and 11% in the inter-peak;
• Between 2006 and 2016, in all three peaks, there is a decrease in Home Based Education trips of 10 – 11%,
but there is growth in all other trips;
• There is growth in all trip purposes between 2016 and 2026;
• The growth in medium/heavy commercial vehicles is over 50% in all peaks, between 2006 and 2016 and
between 2016 and 2026 (this is further discussed in Section 5.5Section 5.5Section 5.5Section 5.5);
• Between the Do-Minimum and the option, in both 2016 and 2026, there is only a very small difference in
total trips (less than 1%). This is because these totals are at a regional level, and the project does not add
many trips at a regional level, but does alter patterns at the local level (this is discussed further in Section Section Section Section
6.96.96.96.9); and

Waterview ConnectionWaterview ConnectionWaterview ConnectionWaterview Connection
Status Final Page 26 July 2010
Document Reference No 20.1.11-R-C-903 G.25 Traffic Modelling Report
• The number of HCVs remains the same between the Do-Minimum and the Option. This is because in the
ART3 model, HCV trips are not linked directly to generalised costs and hence do not change between
schemes.
• The predicted change between the do-minimum and option scenarios include the effects of changes in
distribution (destination choice), mode choice and time of travel (peak spreading). Whilst it is not feasible
to isolate the effects of these elements individually, the change in mode can be seen by the small increase
in private vehicle demands. Peak spreading can be seen in the change in proportion of total vehicle
demands, in the peak periods. For example, in the do-minimum scenario the total vehicle demands in the
AM peak is 2.12% higher than the inter-peak whilst in the option scenario this difference increases to
2.40%.
5.2 Project Assignment Model Demands
The future year project assignment model demands were taken from the ART3 model for the Do-minimum and
the Option, for the three time periods discussed in Section 5.1Section 5.1Section 5.1Section 5.1.
5.2.1 Disaggregation
The disaggregation process used to convert the ART3 model zones to the project assignment model zones is
documented in the validation report6.
Disaggregation factors were developed for the 2006 model to convert the ART3 demand into the project model
zoning system. It was necessary to revise some of these factors for the future year models to reflect greater
growth in some sub-zones than others. Candidate zones for the revision of the factors were selected where
there was significant growth forecast and where the split to sub zones in 2006 was very uneven.7 For the
candidate zones, the potential growth in the parent zones was manually allocated to the sub-zones, by looking
at aerial photos and considering the likely growth area and then the factors were re-calculated.
Appendix Appendix Appendix Appendix BBBB details the future year zones which have different disaggregation factors to the 2006 model.
5.2.2 Application of Matrix Estimation Factors
Following the development of the base year model, a set of matrix estimation factors were derived to calibrate
the model to existing conditions. These factors were then applied to the future year model.
6 Project Assignment Traffic Model Validation Report, February 2010
7 The actual factor was 0.1 different to the equal share factor, for any zone in the parent ART3 zone AND where the growth in trips was greater than 40%.
For example: Zone 242 has 2 sub-zones, meaning equal share factor will be 0.50. One of the zones has a disaggregation factor of 0.73 and the other has
0.27 in 2006. This was selected because the disaggregation factor was more than 0.1 from the equal share factor and because the growth factor of 1.5
exceeded 1.4.

Waterview ConnectionWaterview ConnectionWaterview ConnectionWaterview Connection
Status Final Page 27 July 2010
Document Reference No 20.1.11-R-C-903 G.25 Traffic Modelling Report
A number of differing methodologies for applying these factors were evaluated based around ‘additive’ and
‘multiplicative’ methodologies. The following were analysed:
• 100% additive (where the absolute change in trip numbers in 2006 are applied to the future year);
• 100% multiplicative (where the ratio of the 2006 changes are applied); and
• 70:30 (where a weighted average of additive (70%) and multiplicative (30%) is used.
The effect of each of these methodologies was compared to the raw ART3 matrices to assess their effect. The
results of these comparisons are presented at a sector level in Appendix Appendix Appendix Appendix CCCC.
The comparison showed little overall difference in the methods, so the 70:30 methodology was adopted. It
was applied using the following formula:
7.0*)0606(3.0*)06
06*(F
1 PFTP
FTT FF −++=
Where:
T1F = Final Future Year Trips
TF = Raw ART3 Future Year Trips
F06 = Final 2006 Matrix
P06 = Prior 2006 Matrix (raw ART3)
5.2.3 HCV assumptions
As shown in Section 5.1Section 5.1Section 5.1Section 5.1 the growth in HCVs forecast by ART3 is higher than the forecast employment growth.
HCV growth is forecast to be over 129% between 2006 and 2026, with employment growth only forecast to be
40%. The growth in HCVs is shown in Table 5.4Table 5.4Table 5.4Table 5.4.
Table 5.4 Table 5.4 Table 5.4 Table 5.4 –––– ART3 HCV Growth ART3 HCV Growth ART3 HCV Growth ART3 HCV Growth
2006 2006 2006 2006 ---- 2016 2016 2016 2016 2016 2016 2016 2016 –––– 2026 2026 2026 2026 2006 2006 2006 2006 ---- 2026 2026 2026 2026
AM Peak 53% 50% 129%
Inter-Peak 53% 50% 129%
PM Peak 53% 50% 129%
This level of growth was considered to be too high, and possibly due to double counting of growth related
directly to employment and additive growth factor related to Gross Domestic Product (GDP) growth. Following

Waterview ConnectionWaterview ConnectionWaterview ConnectionWaterview Connection
Status Final Page 28 July 2010
Document Reference No 20.1.11-R-C-903 G.25 Traffic Modelling Report
discussions with the peer reviewers the future growth was taken as 45% of that forecast by ART3. This value
was chosen to be slightly greater than the employment growth of 40% between 2006 and 2026.
The 45% was chosen to include 40% employment related growth, but only a small additional growth due to GDP
related growth. This approach reduced the potential double-counting of growth and brought the proportion
of HCV traffic back to expected levels.
5.2.4 Resulting Growth
As a result of applying the matrix estimation factors and also the adjustment made to the HCVs, the trip totals
used in the modelling, for the light and heavy vehicle trips are shown in Table 5.5Table 5.5Table 5.5Table 5.5 (2016 and 2026 Do-
Minimum shown). The induced traffic effects are discussed later in Section 6.9Section 6.9Section 6.9Section 6.9.

Waterview ConnectionWaterview ConnectionWaterview ConnectionWaterview Connection
Status Final Page 29 July 2010
Document Reference No 20.1.11-R-C-903 G.25 Traffic Modelling Report
Table 5.Table 5.Table 5.Table 5.5555 –––– Resultant Trip TotalsResultant Trip TotalsResultant Trip TotalsResultant Trip Totals (2 (2 (2 (2----hour total trips)hour total trips)hour total trips)hour total trips)
2006200620062006 2016201620162016 2026202620262026
LightsLightsLightsLights HCVsHCVsHCVsHCVs LightsLightsLightsLights HCVsHCVsHCVsHCVs LightsLightsLightsLights HCVsHCVsHCVsHCVs
AM Peak 483,737 24,552 537,255 28,692 575,437 36,598
Inter-Peak 453,106 27,118 518,844 31,309 562,110 39,937
PM Peak 540,444 20,411 606,259 23,468 650,620 29,952
Overall it can be seen from Table 5.5 Table 5.5 Table 5.5 Table 5.5 that there is between 11% and 15% growth between 2006 and 2016, with
a further 8% - 9% occurring between 2016 and 2026. Due to the application of matrix estimation and HCV
factors this is slightly lower than the growth shown in the raw ART3 matrices.
5.3 Operational Model Demands
The future year operational model demands were taken from the Project Assignment model for the Option, for
the three time periods discussed in Section 5.1Section 5.1Section 5.1Section 5.1.
5.3.1 Disaggregation
The disaggregation process used to convert the project assignment model zones to the operational model
zones is documented in Chapter 4Chapter 4Chapter 4Chapter 4 of the operational model validation report8. The same methodology
outlined in that report was applied to the future year Project Assignment model matrices.
5.3.2 Application of Matrix Estimation Factors
Following the development of the base year model, a set of factors were derived, which were then applied to
the future year model. These factors are essentially factors applied to improve the local calibration of the
model, and were derived from the adjustments made in converting the prior matrices to the final validated
base matrices. The methodology chosen to apply these factors was 100% additive (where the absolute change
in trip numbers in 2006 are applied to the future year). The resultant formula to apply these changes was as
follows:
)0606(F1 PFTT F −+=
Where:
T1F = Final Future Year Trips
TF = Project Assignment Model Future Year Trips
8 Operational Traffic Model Validation Report, May 2010

Waterview ConnectionWaterview ConnectionWaterview ConnectionWaterview Connection
Status Final Page 30 July 2010
Document Reference No 20.1.11-R-C-903 G.25 Traffic Modelling Report
F06 = Final Operational model 2006 Matrix
P06 = Prior Operational 2006 Matrix (from Project Assignment Model)
5.3.3 HCV assumptions
As with the 2006 operational model, the split between light and heavy vehicles is that resulting from the
project assignment model.
5.3.4 High Occupancy Vehicle Assumptions
Since 2006, high occupancy vehicle (HOV) lanes have been constructed at Te Atatu Road, Lincoln Road and
Great North Road (westbound only) interchanges. These lanes are also included as part of the proposed
Waterview Connection project. In order to assess the operational impact of these at the interchanges in was
necessary to include a representation of HOV lanes within the future year operational model.
In 2008/09 work was undertaken by Beca, TDG and Aurecon to assess the impact of priority (or HOV) lanes on
SH16. This work adopted a process from that developed for the Eastern Transport Corridor Study (ETC)
modelling, whereby classified count and vehicle occupancy survey data from circa 2001 was used to determine
typical proportions of vehicle types in the total traffic streams. This methodology was applied to the
operational assessment of the Waterview Connection, to allow the operation of the HOV lanes at the Te Atatu
and Lincoln Road interchanges.
The basis for the occupancy disaggregation was data from occupancy surveys carried out for the ARC (2001)
on ART model screenlines and from extra surveys undertaken for the ETC study. The occupancies at each site
were considered by direction and time period, and from this it was determined that there was little difference
in occupancy by direction and time period and insufficient data to make any conclusions about the difference
in vehicle occupancy by geographical location.
As discussed, the operational model receives its demands form the project assignment model, split into two
user classes, light and heavy vehicles. As with the previous modelling work, the split into vehicle occupancy
was only undertaken for light vehicles. It was assumed that, as at present, the HOV lanes would be available to
those light vehicles with 2 or more occupants, and therefore the light vehicle matrix was split according to the
proportions shown in Table 5.6Table 5.6Table 5.6Table 5.6.
TableTableTableTable 5.6 5.6 5.6 5.6 –––– Car/LCV Occupants Car/LCV Occupants Car/LCV Occupants Car/LCV Occupants
1 Occupant1 Occupant1 Occupant1 Occupant 2+ Occupants2+ Occupants2+ Occupants2+ Occupants
AM Peak 83.0% 17%
PM Peak 78.0% 22%

Waterview ConnectionWaterview ConnectionWaterview ConnectionWaterview Connection
Status Final Page 31 July 2010
Document Reference No 20.1.11-R-C-903 G.25 Traffic Modelling Report
It should be noted that these occupancies were validated against occupancy data collected on SH16 in 2005 as
part of the ‘Northwestern Motorway Traffic Demand management Survey’ project undertaken by Beca on behalf
of NZTA.
5.3.5 Resulting Growth
As a result of applying the matrix estimation factors , the trip totals were used in the operational modelling,
for the light and heavy vehicle trips are shown in Table 5.Table 5.Table 5.Table 5.7777 (2016 and 2026 option shown).
Table 5.Table 5.Table 5.Table 5.7 7 7 7 –––– Resultant Trip Totals (4 Resultant Trip Totals (4 Resultant Trip Totals (4 Resultant Trip Totals (4----hour total trips)hour total trips)hour total trips)hour total trips)
2006200620062006 2016201620162016 2026202620262026
LightsLightsLightsLights HCVsHCVsHCVsHCVs LightsLightsLightsLights HCVsHCVsHCVsHCVs LightsLightsLightsLights HCVsHCVsHCVsHCVs
AM Peak 79,891 3,684 104,962 6,559 110,803 9,761
PM Peak 88193 3,778 117,205 7,119 124,502 9,355
Overall it can be seen from Table 5.Table 5.Table 5.Table 5.7777 that there is between 33% and 35% growth between 2006 and 2016, with
a further 7% - 8% occurring between 2016 and 2026. The growth in the Greater Auckland Region (Table 5.5Table 5.5Table 5.5Table 5.5) is
shown to be 11% – 15% between 2006 and 2016, with a further 8% - 9% occurring between 2016 and 2026.
This shows that the growth in the study area for the project is forecast to be higher than that of the Greater
Auckland Region.
It should be noted that the operational model covers a different area to the other models, meaning growth
rates cannot be directly compared.

Waterview ConnectionWaterview ConnectionWaterview ConnectionWaterview Connection
Status Final Page 32 July 2010
Document Reference No 20.1.11-R-C-903 G.25 Traffic Modelling Report
6. Wider Network Results
This chapter describes the effect of the project on the wider Auckland region, as well as the local network
effects. It is based on comparisons of the Do-minimum and Option scenarios (as described in Chapter 4Chapter 4Chapter 4Chapter 4).
The following abbreviations are used in this section of the report for the scenarios assessed:
• DM = Do minimum; and
• OPT = Option.
This chapter concentrates on the effect of traffic flows on both the wider state highway network and also the
local road network. This chapter also reports on the effect of the scheme on the vehicle kilometres travelled,
and also the effect of induced traffic.
Daily flows have been calculated from the project assignment model by factoring the AM, inter and PM peak 2-
hour flows and combining them to derive the daily flows. This calculation is done by applying the following
factors:
• AM Peak = 1.25;
• Inter-peak = 4.99; and
• PM Peak = 1.25.
Due to the higher factor in the inter-peak, changes in flows at this time have a greater influence on the
changes at a daily level. These factors were derived from a detailed analysis of the 2006 counts across the
network. Details on this analysis can be found in Appendix Appendix Appendix Appendix DDDD.... These factors have been found to be fairly
stable over the last 10 years, so the same expansion factors were adopted for the future years.
6.1 Network Wide Effects
Figure 6.1Figure 6.1Figure 6.1Figure 6.1 shows the changes in daily traffic between the Do minimum and Option in 2026 across the
Auckland Region. These changes are discussed in greater detail in the following sections. Positive (red) show
where the traffic is predicted to increase compared to the Do-Minimum, with negative (light green) indicating
where traffic is expected to decrease.

Waterview ConnectionWaterview ConnectionWaterview ConnectionWaterview Connection
Status Final Page 33 July 2010
Document Reference No 20.1.11-R-C-903 G.25 Traffic Modelling Report
Figure 6.1 Figure 6.1 Figure 6.1 Figure 6.1 –––– Predicted Predicted Predicted Predicted Changes iChanges iChanges iChanges in Daily Flow between Do Minimum and Option 2026n Daily Flow between Do Minimum and Option 2026n Daily Flow between Do Minimum and Option 2026n Daily Flow between Do Minimum and Option 2026

Waterview ConnectionWaterview ConnectionWaterview ConnectionWaterview Connection
Status Final Page 34 July 2010
Document Reference No 20.1.11-R-C-903 G.25 Traffic Modelling Report
6.2 Effects on SH16
Table 6.1Table 6.1Table 6.1Table 6.1 details the effects of the project on SH16 at a daily level.
Table 6.Table 6.Table 6.Table 6.1111 –––– Daily Traffic Flows on SH16 (2 directional) Daily Traffic Flows on SH16 (2 directional) Daily Traffic Flows on SH16 (2 directional) Daily Traffic Flows on SH16 (2 directional)
ScenarioScenarioScenarioScenario LocationLocationLocationLocation
2006200620062006 2016 DM2016 DM2016 DM2016 DM 2016 OPT2016 OPT2016 OPT2016 OPT ChangeChangeChangeChange 2026 DM2026 DM2026 DM2026 DM 2026 O2026 O2026 O2026 OPTPTPTPT ChangeChangeChangeChange
Newton
Road to St
Lukes Road
126,900 135,100 148,400 13,300
(10%) 137,900 156,000
18,100
(13%)
St Lukes to
Great North
Road
116,700 113,700 138,800 25,100
(22%) 117,000 147,700
30,700
(26%)
Great North
Road to
Rosebank
104,000 105,300 120,200 14,900
(14%) 115,500 133,000
17,500
(15%)
Rosebank
to Patiki 88,400 89,000 101,500
12,500
(14%) 97,600 113,200
15,600
(16%)
Patiki to Te
Atatu Toad 105,400 106,200 118,600
12,400
(12%) 116,500 132,200
15,700
(13%)
Te Atatu
Road to
Lincoln
Road
76,600 82,600 93,500 10,900
(13%) 91,300 109,700
18,400
(20%)
Lincoln
Road to
Royal Road
61,100 75,500 77,400 1,900
(3%) 86,200 96,100
9,900
(11%)
Royal Road
to Westgate 42,800 54,600 55,900
1,300
(2%) 69,000 75,300
6,300
(9%)
The following can be observed from Table 6.Table 6.Table 6.Table 6.1111:
• There is an increase in flows on all sections of SH16 (apart from St Lukes to Great North Road) between
2006 and 2016 due to growth in the corridor, and between 2016 and 2026. This growth is minor on the
eastern sections of SH16, but is observed to be substantial (over 20%) on the western sections of SH16.
The minor reduction in traffic flows, in the section of SH16 between St Lukes and Great North Road, is
indicated in the model to be greatly due to the changes in the road network including completion of
Manukau Harbour Bridge, Tiverton/Wolverton widening and the extension of SH20 Mt Roskill. For

Waterview ConnectionWaterview ConnectionWaterview ConnectionWaterview Connection
Status Final Page 35 July 2010
Document Reference No 20.1.11-R-C-903 G.25 Traffic Modelling Report
example, traffic on SH16 from the west which previously continued to SH1 at the Central Motorway
Junction (CMJ), divert down Great North Road or Carrington Road to use SH20. Additionally, the model
showed traffic from the New Lynn area previously travelled via Great North Road, SH16 and CMJ to the
east/Auckland City. In the future the model predicts that this traffic is likely to be attracted to alternative
routes, such as Tiverton Road, Wolverton Street and New Windsor Road. This traffic diversion effect hence
is likely to reduce a small percentage of traffic volumes along SH16, between the Waterview and St Lukes
interchanges. Other factors that may contribute to this reduction include changes in demand patterns due
to effects such as assumed increases in rail and bus services, increased fuel price, increase in parking
costs in the CBD, and travel demand management initiatives.
• As may be expected, a further increase in flow can be observed when SH16 is widened as part of the
option (up to 22% between St Lukes and Great North road interchanges). In 2016, the greatest increase is
seen in the sections to the east of Lincoln Road of SH16, as the western end has not been widened. In
2026, there is a large increase in traffic seen along the whole length of SH16 as the whole motorway is
widened, thereby attracting more traffic (up to 20% in the section between Te Atatu and Lincoln Road
Interchanges); and
• The extension of the project to the Westgate interchange in 2026 further increases the volume of traffic on
SH16. This is due to more traffic being attracted to SH16, as a result of the widening being completed
between Henderson Creek and Westgate; and
• It should be noted that the differences in flows may not necessarily be due to rerouting alone, but also
due to distribution and mode shift effects as a result of changes in the ART3 model between the do-
minimum and the option runs (the only difference between the two scenarios is the introduction of the
project).
TablesTablesTablesTables 6.6.6.6.2222 and 6.6.6.6.3333 detail the 2-hour peak flows (AM and PM peaks) by direction along the sections of SH16.
Table 6.Table 6.Table 6.Table 6.2222 –––– AM Peak flows on SH16 (2 hour) AM Peak flows on SH16 (2 hour) AM Peak flows on SH16 (2 hour) AM Peak flows on SH16 (2 hour)
ScenarioScenarioScenarioScenario
LocationLocationLocationLocation DirDirDirDir 2006200620062006 2016 DM2016 DM2016 DM2016 DM 2016 OPT2016 OPT2016 OPT2016 OPT ChChChChangeangeangeange 2026 DM2026 DM2026 DM2026 DM 2026 2026 2026 2026
OPTOPTOPTOPT
ChangeChangeChangeChange
EB 11,600 12,000 11,900 -100
(1%) 11,900 11,900
0
(0%) Newton to St
Lukes WB 5,200 6,400 7,000
600
(9%) 6,700 7,600
900
(13%)
EB 10,500 10,100 12,900 2,800
(28%) 10,100 13,000
2,900
(29%) St Lukes Road
to Great North
Road WB 5,300 5,300 6,500 1,200
(23%) 5,600 7,000
1,400
(25%)
EB 10,200 10,200 12,500 2,300
(23%) 10,500 13,000
2,500
(24%) Great North
Road to
Rosebank WB 5,100 5,600 6,400 800 6,200 6,900 700

Waterview ConnectionWaterview ConnectionWaterview ConnectionWaterview Connection
Status Final Page 36 July 2010
Document Reference No 20.1.11-R-C-903 G.25 Traffic Modelling Report
ScenarioScenarioScenarioScenario
LocationLocationLocationLocation DirDirDirDir 2006200620062006 2016 DM2016 DM2016 DM2016 DM 2016 OPT2016 OPT2016 OPT2016 OPT ChChChChangeangeangeange 2026 DM2026 DM2026 DM2026 DM 2026 2026 2026 2026
OPTOPTOPTOPT
ChangeChangeChangeChange
(14%) (11%)
EB 9,200 9,100 11,200 2,100
(23%) 9,300 11,900
2,600
(28%) Rosebank To
Patiki WB 3,800 4,000 4,600
600
(15%) 4,500 5,100
600
(13%)
EB 10,900 10,900 12,900 2,000
(18%) 11,100 13,800
2,700
(24%) Patiki to Te
Atatu WB 4,500 4,600 5,200
600
(13%) 5,200 5,800
600
(12%)
EB 6,500 6,900 8,600 1,700
(25%) 6,800 9,900
3,100
(46%) Te Atatu Road
to Lincoln Road WB 3,600 4,000 4,800
800
(20%) 4,500 5,700
1,200
(27%)
EB 6,000 6,400 6,600 200
(3%) 6,900 8,600
1,700
(25%) Lincoln Road to
Royal Road WB 2,600 4,100 4,300
200
(5%) 4,700 5,300
600
(13%)
EB 3,400 3,700 4,100 400
(11%) 4,900 6,100
1,200
(24%) Royal Road to
Westgate WB 2,000 3,600 3,600
0
(0%) 4,200 4,600
400
(10%)

Waterview ConnectionWaterview ConnectionWaterview ConnectionWaterview Connection
Status Final Page 37 July 2010
Document Reference No 20.1.11-R-C-903 G.25 Traffic Modelling Report
Table 6.Table 6.Table 6.Table 6.3333 –––– P P P PM Peak flows on SH16 (2M Peak flows on SH16 (2M Peak flows on SH16 (2M Peak flows on SH16 (2----hour)hour)hour)hour)
ScenarioScenarioScenarioScenario
LocationLocationLocationLocation DirDirDirDir 2006200620062006 2016 DM2016 DM2016 DM2016 DM 2016 2016 2016 2016
OPTOPTOPTOPT
ChangeChangeChangeChange 2026 DM2026 DM2026 DM2026 DM 2026 2026 2026 2026
OPTOPTOPTOPT
ChangeChangeChangeChange
EB 6,400 7,400 8,300 900
(12%) 7,700 9,100
1,400
(18%) Newton to St
Lukes WB 11,300 13,600 14,000
400
(3%) 13,400 13,900
500
(4%)
EB 6,100 5,800 7,500 1,700
(29%) 6,100 8,300
2,200
(36%) St Lukes Road
to Great North
Road WB 10,800 11,100 13,100 2,000
(18%) 11,100 13,200
2,100
(19%)
EB 6,100 6,200 6,800 600
(10%) 6,800 7,500
700
(10%) Great North
Road to
Rosebank WB 9,500 9,200 12,100 2,900
(32%) 9,400 12,800
3,400
(36%)
EB 4,600 4,600 5,200 600
(13%) 5,100 5,800
700
(10%) Rosebank To
Patiki WB 8,800 8,400 11,100
2,700
(32%) 8,500 11,800
3,300
(39%)
EB 5,300 5,200 5,900 700
(13%) 5,800 6,500
700
(14%) Patiki to Te
Atatu WB 10,500 10,300 13,000
2,700
(26%) 10,500 13,800
3,300
(39%)
EB 4,500 5,500 6,200 700
(13%) 6,100 7,000
900
(15%) Te Atatu Road
to Lincoln Road WB 7,600 7,400 9,300
1,900
(26%) 7,300 10,400
3,100
(42%)
EB 3,600 5,200 5,200 0
(0%) 5,900 6,100
200
(3%) Lincoln Road to
Royal Road WB 6,700 7,100 7,500
400
(6%) 7,200 9,000
1,800
(25%)
EB 2,700 4,200 4,100 -100
(-2%) 5,000 5,300
300
(6%) Royal Road to
Westgate WB 4,600 5,100 5,400
300
(6%) 5,600 6,700
1,100
(20%)
TablesTablesTablesTables 6.26.26.26.2 – 6.36.36.36.3 show the following:
• As was seen in Table 6Table 6Table 6Table 6----1111, there is an increase in traffic observed on SH16 in the 10 year period between
2006 and 2016, with a further increase in the ten years to 2026;
• The completion of the Waterview Connection project further increases the flow on the motorway;

Waterview ConnectionWaterview ConnectionWaterview ConnectionWaterview Connection
Status Final Page 38 July 2010
Document Reference No 20.1.11-R-C-903 G.25 Traffic Modelling Report
• It is apparent that SH16 has a ‘peak direction bias’ that is eastbound (city bound) in the AM peak, and
westbound in the PM peak, but this bias reduces over time with higher growth in the non-peak direction;
and
• In both the AM and PM peaks, the non-peak direction experiences a small increase in flow due to the
project.
6.3 Impacts on the Wider State Highway Network
Table 6.Table 6.Table 6.Table 6.4444 shows the daily flow on selected key state highway links around Auckland.
Table 6.Table 6.Table 6.Table 6.4444 – Daily Flows on Key State Highway LinksDaily Flows on Key State Highway LinksDaily Flows on Key State Highway LinksDaily Flows on Key State Highway Links
ScenarioScenarioScenarioScenario
LocationLocationLocationLocation
2006200620062006 2016 DM2016 DM2016 DM2016 DM 2016 OPT2016 OPT2016 OPT2016 OPT ChangeChangeChangeChange 2026 DM2026 DM2026 DM2026 DM 2026 OPT2026 OPT2026 OPT2026 OPT ChangeChangeChangeChange
SH1 Auckland
Harbour
Bridge
184,100 191,600 191,800 200 (0%) 193,400 194,000 600
(0%)
SH18 Upper
Harbour
Bridge
26,500 57,100 58,000 900 (2%) 66,800 68,000 1,200
(2%)
SH20 Mt
Roskill
Extension
- 49,400 84,300 34,900
(71%) 51,400 98,800
47,400
(92%)
SH20
Manukau
Harbour
Crossing
- 126,100 133,100 7,000
(6%) 133,100 141,800
8,700
(7%)
SH1 Greenlane
East to Market
Road
180,500 186,600 183,400 -3,200
(-2%) 188,900 184,400
-4,500
(-2%)
SH1 CMJ
(south of
SH16)
159,600 194,000 182,100 -11,900
(-6%) 201,300 186,100
-15,200
(-8%)
The following can be determined from Table 6.4:Table 6.4:Table 6.4:Table 6.4:
• Between 2006 and 2016, there is a growth on the key State Highway Links. The large increase in growth
between 2006 and 2016 on the SH18 Upper Harbour Bridge is due to the completion of the SH18
improvement projects (Greenhithe, Hobsonville and Upper Harbour Bridge), in the intervening years;

Waterview ConnectionWaterview ConnectionWaterview ConnectionWaterview Connection
Status Final Page 39 July 2010
Document Reference No 20.1.11-R-C-903 G.25 Traffic Modelling Report
• Between 2016 and 2026, 1% growth is forecast on Auckland Harbour Bridge and SH1, with a further 17%
growth being forecast for SH18;
• In 2026, the increase in flow on SH18 Upper Harbour Bridge is around 1,000 vehicles per day with the
project in place, whereas on SH16 (Royal to Westgate) is around 6,000 vehicles per day. This suggests that
the project is not increasing trips to/from the North Shore much compared with growth on SH16;
• With the project in place in both 2016 and 2026 a decrease (albeit small) in flows on SH1 is forecast. This
a result of vehicles choosing to use the completed WRR rather than SH1;
• With the Waterview Connection is in place, there is an increase (6% – 7%) in flow expected on SH20
Manukau Harbour Crossing. This is because the widening on SH16 and the SH20 Waterview Connection
means that the WRR is complete, which provides an alternative to SH1 to get to the North and West and
attracts traffic from the local road network. The increase on flow on SH20 Mt Roskill is 71% in 2016 and
92% in 2026; and
• As previously discussed, it should be noted that the differences in flows may not necessarily be due to
rerouting alone, but also due to distribution and mode shift effects as a result of changes in the ART3
model between the do-minimum and the option runs (the only difference between the two scenarios is the
introduction of the project).
6.3.1 Impacts on SH1 (Central Motorway Junction)
One of the objectives of the WRR is to relieve congestion that currently occurs on SH1 and to provide an
alternative rute north across the Auckland Isthmus. The provision of the Waterview Connection is expected to
result in traffic diverting from SH1 and CMJ to the WRR.
The modelling has indicated that there will be a shift in longer distance trips from Sh1 to SH20 (WRR),
consistent with the objectives of the WRR.
The analysis indicates that in 2026 there is a net reduction in the daily flow through CMJ in 2026 with the
Waterview Connection in place. CMJ is defined here as all traffic passing through the central junction between
the Symonds Street southbound on-ramp and the Symonds Street northbound off-ramp. This reduction is
11,500 vehicles per day (vpd) (7%). This net reduction is a result of 28,500 vpd diverting out of CMJ, but these
have been replaced by 17,000 vpd of new local trips who take advantage of the reduced congestion. Of the
28,500 vpd who divert out of CMJ, 94% divert to the Waterview Connection (SH20), with the other 6% diverting
to other routes.
The diversion of 28,500 vpd who divert out of CMJ will improve the traffic flow through CMJ. Travel Demand
Management (TDM) techniques, such as ramp signalling, could then be used to minimise the predicted
inducement of local trips, thereby sustaining the network benefits.

Waterview ConnectionWaterview ConnectionWaterview ConnectionWaterview Connection
Status Final Page 40 July 2010
Document Reference No 20.1.11-R-C-903 G.25 Traffic Modelling Report
6.4 Impacts on District and Arterial Roads
Table 6.Table 6.Table 6.Table 6.5555 shows the changes in daily flow on a number of arterial routes, and Figure 6.Figure 6.Figure 6.Figure 6.2222 shows the location of
these flows.
Figure 6.2 LocationFigure 6.2 LocationFigure 6.2 LocationFigure 6.2 Location of of of of Reported Reported Reported Reported Daily Flows Daily Flows Daily Flows Daily Flows
Flow Location

Waterview ConnectionWaterview ConnectionWaterview ConnectionWaterview Connection
Status Final Page 41 July 2010
Document Reference No 20.1.11-R-C-903 G.25 Traffic Modelling Report
Table 6.Table 6.Table 6.Table 6.5555 –––– Predicted Daily Flows on Predicted Daily Flows on Predicted Daily Flows on Predicted Daily Flows on Arterial Arterial Arterial Arterial RoutesRoutesRoutesRoutes
ScenariosScenariosScenariosScenarios LocationLocationLocationLocation
2006200620062006 2016 DM2016 DM2016 DM2016 DM 2016 2016 2016 2016
OPTOPTOPTOPT ChangeChangeChangeChange 2026 DM2026 DM2026 DM2026 DM
2026 2026 2026 2026
OPTOPTOPTOPT ChangeChangeChangeChange
Manukau Road (south
of Greenlane) 31,400 30,900 28,900 -2,000
(-6%) 30,900 28,500
-2,400
(-8%)
Gilies Avenue 16,200 17,900 12,100
-5,800
(-32%) 20,100 10,700
-9,400
(-47%)
Mt Eden Road 22,300 22,100 19,900
-2,200
(-10%) 21,700 19,000
-2,700
(-12%)
New North Road 29,800 28,600 29,600
1,000
(3%) 28,200 29,200
1,000
(4%)
Dominion Road 16,900 21,600 16,900
-4,700
(-22%) 21,600 16,800
-4,800
(-22%)
Sandringham Road 14,700 15,600 13,200
-2,400
(-15%) 15,400 12,900
-2,500
(-16%)
Tiverton/Wolverton 17,800 27,300 23,700
-3,600
(-13%) 28,400 24,300
-4,100
(-14%)
Mt Albert Road 18,600 16,600 14,300
-2,300
(-14%) 16,400 13,000
-3,400
(-21%)
Carrington Road 28,100 30,800 23,000
-7,800
(-25%) 32,400 23,000
-9,400
(-29%)
Great North Road (West
of New Lynn) 37,000 35,800 33,100 -2,700
(-8%) 37,800 34,700
-3,100
(-8%)
Great North Road
(north of Blockhouse
Bay Road) 48,200 46,700 42,700
-4,000
(-9%) 46,300 42,200
-4,100
(-9%)
Rosebank Road 25,000 25,700 25,800
100
(0%) 27,200 27,400
200
(1%)
Blockhouse Bay Road 13,600 15,100 10,300
-4,800
(-32%) 15,200 10,300
-4,900
(-32%)
St Lukes Road 30,600 34,400 27,700
-6,700
(-19%) 34,600 26,500
-8,100
(-23%)
Te Atatu Road 42,800 43,300 46,200
2,900
(7%) 44,100 48,400
4,300
(10%)
Lincoln Road 44,800 44,400 44,200
-200
(0%) 48,800 49,900
1,100
(2%)
The average reduction across these radial routes is over 12% in 2016 and 14% in 2026 when the project is in
place.

Waterview ConnectionWaterview ConnectionWaterview ConnectionWaterview Connection
Status Final Page 42 July 2010
Document Reference No 20.1.11-R-C-903 G.25 Traffic Modelling Report
Table 6.Table 6.Table 6.Table 6.6666 shows the peak period flows for the roads in Table 6.Table 6.Table 6.Table 6.5555 with and without the project for 2026. These
show substantial reductions in peak-period flows, which may reduce congestion and other traffic impacts on
these roads. Also, Tables 6.5Tables 6.5Tables 6.5Tables 6.5 and 6.66.66.66.6 show that increases are however predicated on certain arterial routes,
as a result of vehicles now accessing the WRR via SH16.
TaTaTaTable 6.ble 6.ble 6.ble 6.6666 –––– Peak Flows on Selected Peak Flows on Selected Peak Flows on Selected Peak Flows on Selected ArterialArterialArterialArterial Routes in 2026 (TwoRoutes in 2026 (TwoRoutes in 2026 (TwoRoutes in 2026 (Two----way, 2 hours)way, 2 hours)way, 2 hours)way, 2 hours)
AMAMAMAM IPIPIPIP PMPMPMPM LocationLocationLocationLocation
DMDMDMDM OPTOPTOPTOPT ChangeChangeChangeChange DMDMDMDM OPTOPTOPTOPT ChangeChangeChangeChange DMDMDMDM OPTOPTOPTOPT ChangeChangeChangeChange
Manukau Road 4,600 4,100
-500
(-11%) 4,000 3,700
-300
(-8%) 4,100 3,900
-200
(-5%)
Gilies Avenue 2,500 1,600
-900
(-36%) 2,700 1,400
-1,300
(-48%) 2,800 1,400
-1,400
(-50%)
Mt Eden Road 3,100 2,500
-600
(-19%) 2,700 2,400
-300
(-11%) 3,500 3,100
-400
(-11%)
New North Road 4,500 4,600
100
(2%) 3,500 3,700
200
(6%) 4,100 4,000
-100
(-2%)
Dominion Road 3,000 2,200
-800
(-27%) 2,700 2,200
-500
(-19%) 3,500 2,500
-1,000
(-29%)
Sandringham Road 2,400 1,800
-600
(-25%) 2,000 1,600
-400
(-20%) 1,900 2,100
200
(11%)
Tiverton/Wolverton 3,800 3,300
-500
(-13%) 3,400 2,900
-500
(-15%) 5,400 4,600
-800
(-15%)
Mt Albert Road 2,800 2,300
-500
(-18%) 2,000 1,600
-400
(-20%) 2,300 1,700
-600
(-26%)
Carrington Road 4,400 3,400
-1,000
(-23%) 4,200 2,900
-1,300
(-31%) 4,700 3,400
-1,300
(-28%)
Great North Road
(West of New Lynn) 5,700 5,400 -300
(-5%) 4,600 4,300
-300
(-7%) 6,200 5,200
-1,000
(-16%)
Great North Road
(north of
Blockhouse Bay
Road)
6,900 6,400 -500
(-7%) 5,600 4,900
-700
(-13%) 7,800 7,800 0 (0%)
Rosebank Road 3,800 3,900
100
(3%) 3,600 3,600 0 (0%) 3,600 3,700
100
(3%)
Blockhouse Bay
Road 2,000 1,400 -600
(-30%) 2,000 1,300
-700
(-35%) 2,200 1,700
-500
(-23%)

Waterview ConnectionWaterview ConnectionWaterview ConnectionWaterview Connection
Status Final Page 43 July 2010
Document Reference No 20.1.11-R-C-903 G.25 Traffic Modelling Report
AMAMAMAM IPIPIPIP PMPMPMPM LocationLocationLocationLocation
DMDMDMDM OPTOPTOPTOPT ChangeChangeChangeChange DMDMDMDM OPTOPTOPTOPT ChangeChangeChangeChange DMDMDMDM OPTOPTOPTOPT ChangeChangeChangeChange
St Lukes Road 4,900 3,600
-1,300
(-27%) 4,400 3,400
-1,000
(-23%) 5,200 4,000
-1,200
(-23%)
Te Atatu Road 5,700 6,500
800
(14%) 5,700 6,200
500
(9%) 6,800 7,500
700
(10%)
Lincoln Road 5,800 6,100
300
(5%) 6,500 6,500 0 (0%) 7,300 7,900
600
(8%)
Both Lincoln Road and Te Atatu Road are four-lane arterial roads but much of the current congestion on these
roads is due to the SH16 interchanges. As the modelling has assumed that the Te Atatu and Lincoln Road
Interchanges would be upgraded as part of the SH16 widening project, those interchanges would be better
able to accommodate the increase in traffic created by the Waterview Connection, than the current
configurations. It should also be noted that these roads will be operating at or close to their capacity in 2026,
and that the predicted increases in traffic would add marginally to the congestion. It is noted that Waitakere
City Council is investigating improvements to these two corridors. These options include improving access to
buses and high occupancy vehicle lanes.
6.5 Users of the SH20 Waterview Connection
In 2016 (proposed year of opening), the SH20 Waterview Connection is forecast to attract 70,000 vehicles per
day (vpd), and by 2026, this number is expect to rise to 83,000 vpd. Table 6.7Table 6.7Table 6.7Table 6.7 details the daily users of the
ramps and mainline in 2016 and 2026, with Table 6.8Table 6.8Table 6.8Table 6.8 showing the number of users in the 2-hour peak
periods.. Figures 6.Figures 6.Figures 6.Figures 6.3333 – 6.6.6.6.6666 show the direction of the users of the SH20 Waterview Connection for the daily
traffic and also the three modelled periods in 2026.
Table 6.7 Table 6.7 Table 6.7 Table 6.7 –––– Daily Users of SH20 Waterview Connection Daily Users of SH20 Waterview Connection Daily Users of SH20 Waterview Connection Daily Users of SH20 Waterview Connection
LocationLocationLocationLocation DirectioDirectioDirectioDirectionnnn 2016201620162016 2026202620262026
N/B 36,000 41,700 SH20 Waterview Connection mainline
S/B 33,900 40,600
To city 19,100 21,800 East Facing Ramps
From SH16 16,300 19,300
To West 18,900 19,900 West Facing Ramps
From SH16 17,600 21,300

Waterview ConnectionWaterview ConnectionWaterview ConnectionWaterview Connection
Status Final Page 44 July 2010
Document Reference No 20.1.11-R-C-903 G.25 Traffic Modelling Report
Table 6.Table 6.Table 6.Table 6.8888 –––– Peak Period (2 hour)Peak Period (2 hour)Peak Period (2 hour)Peak Period (2 hour) Users of SH20 Waterview ConnectionUsers of SH20 Waterview ConnectionUsers of SH20 Waterview ConnectionUsers of SH20 Waterview Connection
2016201620162016 2026202620262026
LocationLocationLocationLocation DirDirDirDir
AM IP PM AM IP PM
N/B 4,700 4,600 5800 5,000 5,400 6,900 SH20 Waterview
Connection mainline S/B 5,500 4,500 3,800 6,500 5,500 4,100
To city 2,700 2,500 2,500 2,800 2,900 3,000
East Facing Ramps
From SH16 1,800 2,400 1,800 2,200 2,800 2,000
To West 2,000 2,000 3,300 2,200 2,500 3,800
West Facing Ramps
From SH16 3,600 2,100 2,000 4,400 2,600 2,200
Figure 6.Figure 6.Figure 6.Figure 6.3 3 3 3 –––– 2026 AM Peak traffic distributions on the 2026 AM Peak traffic distributions on the 2026 AM Peak traffic distributions on the 2026 AM Peak traffic distributions on the SH20 ExtensionSH20 ExtensionSH20 ExtensionSH20 Extension
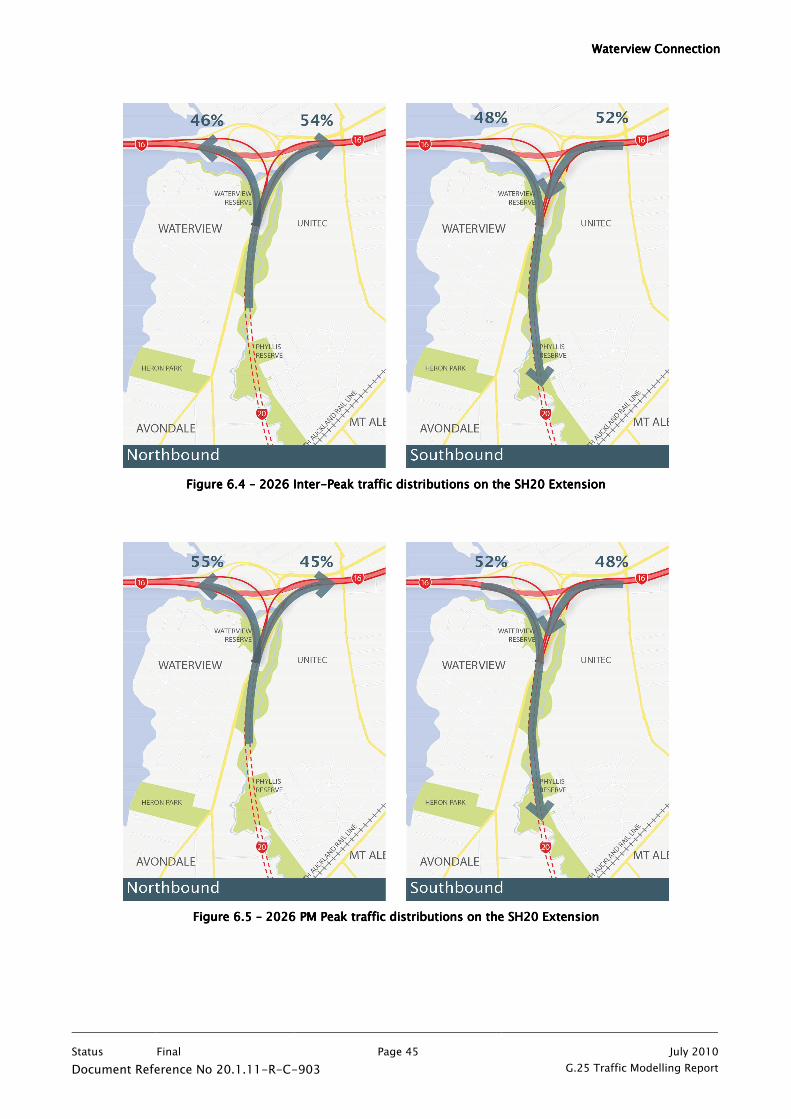
Waterview ConnectionWaterview ConnectionWaterview ConnectionWaterview Connection
Status Final Page 45 July 2010
Document Reference No 20.1.11-R-C-903 G.25 Traffic Modelling Report
Figure 6.Figure 6.Figure 6.Figure 6.4 4 4 4 –––– 202 202 202 2026 Inter6 Inter6 Inter6 Inter----Peak traffic distributions on the Peak traffic distributions on the Peak traffic distributions on the Peak traffic distributions on the SH20 ExtensionSH20 ExtensionSH20 ExtensionSH20 Extension
Figure 6.Figure 6.Figure 6.Figure 6.5 5 5 5 –––– 2026 PM Peak traffic distributions on the 2026 PM Peak traffic distributions on the 2026 PM Peak traffic distributions on the 2026 PM Peak traffic distributions on the SH20 ExtensionSH20 ExtensionSH20 ExtensionSH20 Extension

Waterview ConnectionWaterview ConnectionWaterview ConnectionWaterview Connection
Status Final Page 46 July 2010
Document Reference No 20.1.11-R-C-903 G.25 Traffic Modelling Report
Figure 6.6 Figure 6.6 Figure 6.6 Figure 6.6 –––– 2026 Daily traffic distributions on the SH20 Extension 2026 Daily traffic distributions on the SH20 Extension 2026 Daily traffic distributions on the SH20 Extension 2026 Daily traffic distributions on the SH20 Extension
From Figures 6.3Figures 6.3Figures 6.3Figures 6.3 – 6.66.66.66.6, the following can be observed:
• At a daily level, the slightly higher movement of traffic using the SH20 section of the Waterview Connection
is those going to/from the city (although this is only 4% higher than movements to the west);
• Other than in the southbound direction in the AM peak, there is a fairly even split between east and west
users of the SH20 section of the Waterview Connection;
• In the AM peak there are more southbound users of the SH20 section of the Waterview Connection are
from the west, having used SH16 in the peak direction;
• In the PM peak, the dominant movement of users is to/from the west, which may be expected as this is
primary role of the WRR; and
• The AM southbound (67%/33%) and PM northbound (55%/45%) splits are not more similar due to due a
different mix of traffic (journey purposes) in the AM and PM peaks. For example, the AM peaks users are
mainly commuters and education traffic, with the PM peak being a wider variety of trips, such as
commuters, leisure and personal trips. Education trips are expected have been completed before the PM
peak period commences.
Further analysis was undertaken to understand where traffic using the facility come from in the wider network.
The origins and destinations of vehicles using the Waterview Connection at a daily level are shown in terms of

Waterview ConnectionWaterview ConnectionWaterview ConnectionWaterview Connection
Status Final Page 47 July 2010
Document Reference No 20.1.11-R-C-903 G.25 Traffic Modelling Report
sector-sector movements in Table 6.Table 6.Table 6.Table 6.9999, using the following sectors (shown in Figure 6.Figure 6.Figure 6.Figure 6.6666), % shown is based on
the table total (82,400 vehicles)
• Sector One Sector One Sector One Sector One –––– North Shore
• Sector Two Sector Two Sector Two Sector Two –––– West Waitakere
• Sector Three Sector Three Sector Three Sector Three –––– Central Waitakere
• Sector FoSector FoSector FoSector Four ur ur ur ---- Titirangi
• Sector Five Sector Five Sector Five Sector Five ---- Avondale
• Sector Six Sector Six Sector Six Sector Six ---- Auckland CBD
• Sector Seven Sector Seven Sector Seven Sector Seven –––– Herne Bay/Mt Eden
• Sector Eight Sector Eight Sector Eight Sector Eight –––– Hillsborough/Mt Roskill
• Sector Nine Sector Nine Sector Nine Sector Nine –––– Eastern Suburbs
• Sector Ten Sector Ten Sector Ten Sector Ten –––– South Auckland

Waterview ConnectionWaterview ConnectionWaterview ConnectionWaterview Connection
Status Final Page 48 July 2010
Document Reference No 20.1.11-R-C-903 G.25 Traffic Modelling Report
2222
1
2
3
4
5
6
78
9
10
––––Figure 6.Figure 6.Figure 6.Figure 6.6666 –––– Sector System Sector System Sector System Sector System

Waterview ConnectionWaterview ConnectionWaterview ConnectionWaterview Connection
Status Final Page 49 July 2010
Document Reference No 20.1.11-R-C-903 G.25 Traffic Modelling Report
Table 6.Table 6.Table 6.Table 6.9999 –––– Daily Users of Daily Users of Daily Users of Daily Users of the the the the SH20 SH20 SH20 SH20 Waterview ConnectionWaterview ConnectionWaterview ConnectionWaterview Connection Extension Extension Extension Extension in 2026 in 2026 in 2026 in 2026
DestinationDestinationDestinationDestination
North Shore
West
Waitakere
Central
Waitakere
Titirangi
Avondale
Auckland
CBD
Herne
Bay/Mt Eden
Hillsborough
/Mt Roskill
Eastern
Suburbs
South
Auckland
Total
North Shore 0 (0%) 0 (0%) 0 (0%) 0 (0%) 300 (0%) 0 (0%) 0 (0%) 1,600 (2%) 0 (0%)
7,200
(9%)
9,200
(11%)
West Waitakere 0 (0%) 0 (0%) 0 (0%) 0 (0%) 300 (0%) 0 (0%) 0 (0%) 1,600 (2%)
300
(0%)
3,600
(4%)
5,800
(7%)
Central
Waitakere 0 (0%) 0 (0%) 0 (0%) 0 (0%) 400 (0%) 0 (0%) 0 (0%) 3,300 (4%)
600
(1%)
6,500
(8%)
11,000
(13%)
Titirangi 200
(0%) 0 (0%) 0 (0%) 0 (0%) 0 (0%) 300 (0%) 300 (0%) 0 (0%)
100
(0%) 0 (0%)
1,000
(1%)
Avondale 500
(1%) 300 (0%) 500 (1%) 0 (0%) 500 (1%)
1,400
(2%)
1,000
(1%) 1,200 (1%)
300
(0%)
1,600
(2%)
7,300
(9%)
Auckland CBD 0 (0%) 0 (0%) 0 (0%) 0 (0%) 900 (1%) 0 (0%) 0 (0%) 2,600 (3%) 0 (0%)
3,800
(5%)
7,300
(9%)
Herne Bay/Mt
Eden 0 (0%) 0 (0%) 0 (0%) 0 (0%) 700 (1%) 0 (0%) 0 (0%) 1,400 (2%) 0 (0%)
1,900
(2%)
4,000
(5%)
Hillsborough/M
t Roskill
1,400
(2%)
1,700
(2%)
3,400
(4%)
100
(0%)
1,400
(2%)
2,500
(3%)
1,400
(2%) 0 (0%)
100
(0%) 0 (0%)
12,000
(15%)
Eastern
Suburbs 0 (0%) 200 (0%) 300 (0%) 0 (0%) 200 (0%) 0 (0%) 0 (0%) 100 (0%) 0 (0%) 100 (0%)
900
(1%)
South Auckland 7,300
(9%)
3,600
(4%)
5,400
(7%)
100
(0%)
1,500
(2%)
3,900
(5%)
2,200
(3%) 0 (0%) 0 (0%) 0 (0%)
24,100
(29%)
Origin
Origin
Origin
Origin
Total 9,400
(11%)
5,700
(7%)
9,700
(12%)
300
(0%)
6,300
(8%)
8,100
(10%)
5,000
(6%) 11,800 (14%)
1,400
(2%)
24,700
(30%) 82,400

Waterview ConnectionWaterview ConnectionWaterview ConnectionWaterview Connection
Status Final Page 50 July 2010
Document Reference No 20.1.11-R-C-903 G.25 Traffic Modelling Report
When interpreting this data, care should be taken when estimating the proportion of users associated with
each sector. Because each movement involves an origin and a destination, the sector totals will involve double-
counting. This double-counting is avoided by considering the total origins and destinations (165,000). On
this basis, the following can be noted from Table 6.Table 6.Table 6.Table 6.9999::::
• 11% to/from the North Shore;
• 30% to/from Manukau and the south (including the airport);
• 9% to/from Auckland CBD;
• 20% to/from Waitakere; and
• 30% Auckland City including the study area but excluding the CBD.
Of additional note is that while the immediate study area would receive significant benefits from reduced
traffic flows on local roads, less than 9% of traffic using the project would be associated with the immediate
study area itself (the Avondale sector).
6.6 Impacts on Travel Times
The introduction of the project has an impact on travel times across the network. The effect on travel times
between a number of origins and destinations were calculated. The origins and destinations used are shown in
Figure 6.Figure 6.Figure 6.Figure 6.7777.

Waterview ConnectionWaterview ConnectionWaterview ConnectionWaterview Connection
Status Final Page 51 July 2010
Document Reference No 20.1.11-R-C-903 G.25 Traffic Modelling Report
Westlake Westgate
Rosebank
Henderson
New Lynn
CBD
Lynfield
Airport
Manukau
Avondale
Figure 6.Figure 6.Figure 6.Figure 6.7777 OriginOriginOriginOrigin----Destination Travel Time LocationsDestination Travel Time LocationsDestination Travel Time LocationsDestination Travel Time Locations
Table 6.Table 6.Table 6.Table 6.10101010 details the change in average travel time between the selected origin and destinations when the
project is in place, as compared to the Do Minimum. The actual travel times for both the Do Minimum and the
Option can be found in Appendix Appendix Appendix Appendix EEEE.... Decreases in travel times are highlighted....
It should be noted that these are changes for the average 2-hour modelled periods, and may differ from those
in the height of the peak.

Waterview ConnectionWaterview ConnectionWaterview ConnectionWaterview Connection
Status Final Page 52 July 2010
Document Reference No 20.1.11-R-C-903 G.25 Traffic Modelling Report
Table 6.Table 6.Table 6.Table 6.10101010 ---- Change in 2026 AM Peak OriginChange in 2026 AM Peak OriginChange in 2026 AM Peak OriginChange in 2026 AM Peak Origin----Destination Travel Times compared to the Do Minimum Destination Travel Times compared to the Do Minimum Destination Travel Times compared to the Do Minimum Destination Travel Times compared to the Do Minimum
(minutes)(minutes)(minutes)(minutes)
DestinationDestinationDestinationDestination
Westlake
Auckland CBD
Penrose
Manukau
Airport
Westgate
Henderson
New Lynn
Avondale
College
Rosebank
Lynfield
Westlake 0.0 -1.1 -2.1 -2.4 -2.4 0.2 0.3 -0.8 -0.8 -0.7 -4.5
Auckland
CBD 0.1 0.0 -1.0 -1.2 -1.2 0.2 0.6 0.0 0.0 0.0 -3.4
Penrose -0.3 -0.3 0.0 -0.1 -0.1 0.0 0.3 -0.3 -0.3 -0.2 0.1
Manukau -0.8 -0.8 -0.4 0.0 0.0 -5.3 -4.9 0.8 -0.5 -5.4 0.2
Airport -0.7 -0.8 -0.4 0.0 0.0 -5.4 -5.0 0.8 -0.4 -5.6 0.2
Westgate -0.4 -1.8 -2.7 -6.2 -5.4 0.0 0.2 -1.9 -1.9 -3.1 -6.5
Henderson -0.4 0.3 -0.6 -4.2 -3.3 0.2 0.0 -0.4 0.2 -1.0 -3.4
New Lynn -0.6 -0.4 -1.3 0.4 0.4 -0.4 0.3 0.0 -0.2 -0.8 -0.6
Avondale
College 0.0 0.2 -0.7 0.6 0.5 -0.4 0.0 0.0 0.0 -0.6 -0.4
Rosebank 1.6 1.3 0.4 -3.1 -2.3 0.2 0.6 1.1 1.2 0.0 -3.7
Origin
Lynfield -3.8 -1.2 -0.6 1.8 1.7 -6.3 -6.0 0.0 -1.2 -6.5 0.0
Table 6.Table 6.Table 6.Table 6.10101010 shows the following:
• AM peak Travel times between most origin/destination pairs decrease when the project is in place and the
WRR is complete;
• The largest decreases in travel time can be seen from Westgate to the south, and destinations along the
WRR such as Henderson and Avondale;
• Decreases in travel time can be seen in trips from the airport and Manukau – especially to Rosebank,
Westgate and Westlake;
• People travelling from Westlake to and from the airport experience a reduction in travel time as they can
use the completed SH20;
• There are a number of increases in travel time observed – this is due to increases in delay on SH16 or SH20
rather than delays on the Waterview Connection itself; and

Waterview ConnectionWaterview ConnectionWaterview ConnectionWaterview Connection
Status Final Page 53 July 2010
Document Reference No 20.1.11-R-C-903 G.25 Traffic Modelling Report
• As previously discussed, it should be noted that the differences in travel times may not necessarily be due
to rerouting alone, but also due to distribution and mode shift effects as a result of changes in the ART3
model between the do-minimum and the option runs (the only difference between the two scenarios is the
introduction of the project).
It can be seen that the increases are relatively minor, especially when compared to the larger savings to most
other movements. When weighted by the traffic flows, the net result is a significant overall reduction in travel
time.
Similarly, Table 6.Table 6.Table 6.Table 6.11111111 details the change in average travel time in the PM peak 2026. The actual travel times
can be found in Appendix Appendix Appendix Appendix GGGG.
Table 6.Table 6.Table 6.Table 6.11111111 ---- Change in 2026 PM Peak OriginChange in 2026 PM Peak OriginChange in 2026 PM Peak OriginChange in 2026 PM Peak Origin----Destination Travel Times compared to the Do Minimum Destination Travel Times compared to the Do Minimum Destination Travel Times compared to the Do Minimum Destination Travel Times compared to the Do Minimum
(minutes)(minutes)(minutes)(minutes)
DestinationDestinationDestinationDestination
Westlake
Auckland
CBD
Penrose
Manukau
Airport
Westgate
Henderson
New Lynn
Avondale
College
Rosebank
Lynfield
Westlake 0.0 0.1 -0.1 -0.3 -0.4 -0.8 -0.9 0.1 0.5 0.3 -1.9
Auckland
CBD 0.3 0.0 -0.3 -0.5 -0.6 -6.5 -4.3 0.1 0.4 0.2 -1.5
Penrose -1.4 -1.0 0.0 -0.3 -0.3 -8.4 -6.2 -1.1 -1.5 -1.7 -0.5
Manukau -2.1 -1.8 -0.5 0.0 -0.1 -13.5 -11.3 0.8 -0.6 -6.8 1.3
Airport -1.9 -1.6 -0.3 0.0 0.0 -12.6 -10.4 0.8 -0.7 -5.9 1.3
Westgate 0.1 0.1 -0.1 -5.3 -4.3 0.0 -0.1 -0.2 -0.1 0.0 -3.8
Henderson 1.3 1.0 0.9 -4.3 -3.3 0.8 0.0 1.3 0.9 1.0 -2.8
New Lynn 0.0 -0.3 -0.4 -1.2 -1.2 -6.9 -1.4 0.0 0.0 0.7 -0.9
Avondale
College 0.2 -0.1 -0.2 -1.4 -1.4 -5.9 -3.7 -0.1 0.0 0.8 -1.1
Rosebank 0.3 0.1 -0.1 -5.3 -4.2 -6.7 -4.5 -0.3 -0.1 0.0 -3.8
Origin
Lynfield -5.2 -4.9 -0.8 -0.1 -0.2 -12.9 -10.7 -0.7 -0.9 -6.2 0.0
Table 6.Table 6.Table 6.Table 6.11111111 shows the same trend as in the AM peak, but with the savings to some movements now as high as
13 minutes.
The origin-destination savings do not directly indicate the changes in speeds on specific routes, only the
average of all routes used. The predicted travel time along a number of specified routes was calculated for the
Do Minimum and when the project is in place. The routes that were chosen were as follows, and are shown in
Figure 6.Figure 6.Figure 6.Figure 6.8888:

Waterview ConnectionWaterview ConnectionWaterview ConnectionWaterview Connection
Status Final Page 54 July 2010
Document Reference No 20.1.11-R-C-903 G.25 Traffic Modelling Report
• SH16 (Royal Road to St Lukes);
• Rosebank Road (Rosebank Road/Patiki Road roundabout to Blockhouse Bay Road);
• Tiverton/Wolverton;
• Great North Road/New North Road (Clark Street to St Lukes Road);
• Great North Road;
• Carrington Road;
• Dominion Road;
• Te Atatu Road (Great North Road to SH16); and
• Lincoln Road (Swanson Road to SH16).
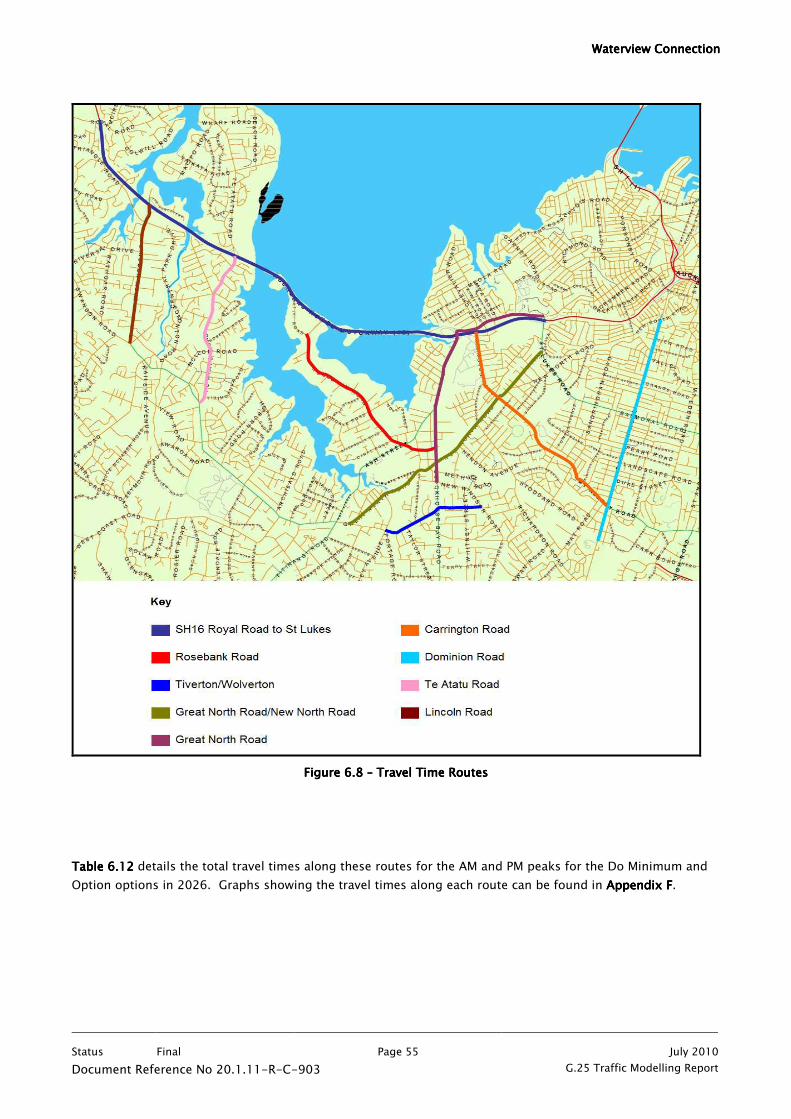
Waterview ConnectionWaterview ConnectionWaterview ConnectionWaterview Connection
Status Final Page 55 July 2010
Document Reference No 20.1.11-R-C-903 G.25 Traffic Modelling Report
FiguFiguFiguFigure 6.re 6.re 6.re 6.8888 –––– Travel Time Routes Travel Time Routes Travel Time Routes Travel Time Routes
Table 6.Table 6.Table 6.Table 6.11112222 details the total travel times along these routes for the AM and PM peaks for the Do Minimum and
Option options in 2026. Graphs showing the travel times along each route can be found in Appendix Appendix Appendix Appendix FFFF.

Waterview ConnectionWaterview ConnectionWaterview ConnectionWaterview Connection
Status Final Page 56 July 2010
Document Reference No 20.1.11-R-C-903 G.25 Traffic Modelling Report
Table 6.Table 6.Table 6.Table 6.11112222 –––– 2 2 2 2026 Total Travel Times along Selected Routes026 Total Travel Times along Selected Routes026 Total Travel Times along Selected Routes026 Total Travel Times along Selected Routes
Travel Times (minutes)Travel Times (minutes)Travel Times (minutes)Travel Times (minutes) RouteRouteRouteRoute DirDirDirDir Length Length Length Length
(km)(km)(km)(km)
DM AMDM AMDM AMDM AM OPT AMOPT AMOPT AMOPT AM ChangeChangeChangeChange DM PMDM PMDM PMDM PM OPT OPT OPT OPT
PMPMPMPM
ChangeChangeChangeChange
E/B 11.5 12.1 9.3 -2.8 (-23%) 7.3 7.2 -0.1 (-1%) SH16 (Royal Road
to St Lukes) W/B 11.0 6.9 6.9 0 (0%) 16.5 8.3 -8.2 (-50%)
E/B 4.1 7.3 8.4 1.1 (15%) 9.3 9.0 -0.3 (-3%) Rosebank Road
W/B 4.1 10.3 9.6 -0.7 (-7%) 8.2 8.8 0.6 (7%)
E/B 3.5 8.5 7.4 -1.1 (-13%) 6.2 6.1 -0.1 (-2%) Tiverton/Wolverton
W/B 3.5 6.1 6.2 0.1 (2%) 6.9 6.1 -0.8 (-12%)
N/B 6.1 13.9 13.2 -0.7 (-5%) 13.5 12.3 -1.2 (-9%) Great North
Road/New North
Road S/B 6.1 12.9 12.1 -0.8 (-6%) 13.8 12.3 -1.5 (-11%)
N/B 3.4 5.7 5.6 -0.1 (-2%) 5.7 5.5 -0.2 (-4%) Great North Road
S/B 3.4 5.9 5.6 -0.3 (-5%) 6.8 6.1 -0.7 (-10%)
N/B 5.0 7.8 7.2 -0.6 (-8%) 7.6 7.1 -0.5 (-7%) Carrington Road
S/B 5.0 8.3 7.0 -1.3 (-16%) 7.2 7.0 -0.2 (-3%)
N/B 4.4 9.0 8.2 -0.8 (-9%) 8.6 8.3 -0.3 (-3%) Dominion Road
S/B 4.4 8.0 7.8 -0.2 (-3%) 8.9 8.5 -0.4 (-4%)
N/B 3.3 6.6 7.4 0.8 (12%) 6.6 6.5 -0.1 (-2%) Te Atatu Road
S/B 3.3 5.5 6.1 0.6 (11%) 6.4 7.7 1.3 (20%)
N/B 2.9 7.7 8.0 0.3 (4%) 7.8 6.5 -1.3 (-17%) Lincoln Road
S/B 2.9 5.9 5.8 -0.1 (-2%) 6.3 7.7 1.4 (22%)
Table Table Table Table 6.126.126.126.12 shows that travel times along the district and regional arterials are either lower or largely
unchanged, in particular:-
• Peak direction travel times along SH16 are much improved with the project in place. Eastbound in the AM
peak is 23% (3 minutes) faster, with the PM peak becoming over 8 minutes (50%) faster;
• Travel times along the Tiverton/Wolverton corridor are up to 13% faster when the project is in place – this
is because a large amount of traffic is diverted from this corridor to the Waterview Connection when it is in
place;

Waterview ConnectionWaterview ConnectionWaterview ConnectionWaterview Connection
Status Final Page 57 July 2010
Document Reference No 20.1.11-R-C-903 G.25 Traffic Modelling Report
• Great North Road/New North Road are up to 9% faster;
• Travel Times along Great North Road are up to 8 minutes faster when the Waterview Connection is in place
– this is due to a reduction in traffic on Great North Road and the roads accessing Great North Road when
the tunnel is in place;
• Carrington Road is up to 9% faster;
• Dominion Road has improved travel times by more than 9% faster when the Waterview Connection is in
place – again, this may be due to the traffic diverting from Dominion Road to use the completed WRR; and
• Travel times along Te Atatu and Lincoln Road are increased in the peak direction due to extra traffic
accessing the completed Western Ring Route; and
• As previously discussed, it should be noted that the differences in travel times may not necessarily be due
to rerouting alone, but also due to distribution and mode shift effects as a result of changes in the ART3
model between the do-minimum and the option runs (the only difference between the two scenarios is the
introduction of the project).
6.7 Impact on HCVs
An indicative assessment was undertaken to assess the potential effect of the routes taken by HCVs when the
Waterview Connection is completed.
The assessment showed that when the Waterview Connection is in place, reductions in the number of HCVs are
observed on the regional/arterial roads, these are demonstrated in Table 6.13Table 6.13Table 6.13Table 6.13, which shows the change in
HCVs on those roads highlighted in Figure 6.2Figure 6.2Figure 6.2Figure 6.2.
Table 6.Table 6.Table 6.Table 6.13131313 –––– Predicted Daily Predicted Daily Predicted Daily Predicted Daily HCV HCV HCV HCV Flows on Radial RoutesFlows on Radial RoutesFlows on Radial RoutesFlows on Radial Routes
ScenariosScenariosScenariosScenarios LocationLocationLocationLocation
2006200620062006 2016 2016 2016 2016
DMDMDMDM
2016 2016 2016 2016
OPTOPTOPTOPT ChangeChangeChangeChange
2026 2026 2026 2026
DMDMDMDM
2026 2026 2026 2026
OPTOPTOPTOPT ChangeChangeChangeChange
Manukau Road (south of
Greenlane) 1,850 1,740 1,310 -430 (-
25%) 2,140 1,600
-540 (-
25%)
Gilies Avenue 360 450 380 -70 (-16%) 530 500 -30 (-6%)
Mt Eden Road 860 1,190 1,020
-170 (-
14%) 1,520 1,280
-240 (-
16%)
New North Road 930 530 560 30 (6%) 660 710 50 (8%)

Waterview ConnectionWaterview ConnectionWaterview ConnectionWaterview Connection
Status Final Page 58 July 2010
Document Reference No 20.1.11-R-C-903 G.25 Traffic Modelling Report
ScenariosScenariosScenariosScenarios LocationLocationLocationLocation
2006200620062006 2016 2016 2016 2016
DMDMDMDM
2016 2016 2016 2016
OPTOPTOPTOPT ChangeChangeChangeChange
2026 2026 2026 2026
DMDMDMDM
2026 2026 2026 2026
OPTOPTOPTOPT ChangeChangeChangeChange
Dominion Road 610 1,070 710
-360 (-
34%) 1,210 920 -290 -13%)
Sandringham Road 600 720 480
-240 (-
33%) 940 600
-340 (-
36%)
Tiverton/Wolverton 1,110 1,860 1,590
-270 (-
15%) 2,290 2,000
-290 (-
13%)
Mt Albert Road 570 490 300
-190 (-
39%) 530 310
-220 (-
42%)
Carrington Road 730 1,110 480
-630 (-
57%) 1,410 540
-870 (-
62%)
Great North Road (West of
New Lynn) 2,020 1,960 1,720 -240 (-
12%) 2,440 2,150
-290 (-
12%)
Great North Road (north of
Blockhouse Bay Road) 1,690 2,510 2,360 -150 (-6%) 3,030 2,800 -230 (-8%)
Rosebank Road 2,450 2,620 2,510 -110 (-4%) 3,320 3,220 -100 (-3%)
Blockhouse Bay Road 410 580 400
-180 (-
31%) 710 530
-180 (-
25%)
St Lukes Road 1,090 1,730 1,270
-460 (-
27%) 2,200 1,530
-670 (-
30%)
Te Atatu Road 3,110 3,970 4,230 260 (7%) 4,940 5,270 330 (7%)
Lincoln Road 2,810 2,820 2,740 -80 (-3%) 4,000 3,950 -50 (-1%)
From Table 6.13Table 6.13Table 6.13Table 6.13 it can be determined that across a number of arterial roads, there is a reduction in the volume
of HCVs using these road when the Waterview Connection is in place. There is an average decrease across
these roads of 19% in 2016 and 18% in 2026.
There is a small increase in HCV flow observed on Te Atatu Road and New North Road. This is matched by the
increase it total overall daily flow on these links, as demonstrated in Table 6.5Table 6.5Table 6.5Table 6.5.
The overall decrease in flows on arterial toads is also demonstrated in an assessment of the vehicle kilometres
travelled (VKT), both across the Auckland region and the study area, in Tables 6.Tables 6.Tables 6.Tables 6.11114444 and 6.6.6.6.11115555 (defined as the
refined area of model coding, as discussed in ChapChapChapChapter 3ter 3ter 3ter 3 of the Project Assignment Model Validation Report,
which is broadly the Waitakere City area plus the western area of the Auckland Isthmus).

Waterview ConnectionWaterview ConnectionWaterview ConnectionWaterview Connection
Status Final Page 59 July 2010
Document Reference No 20.1.11-R-C-903 G.25 Traffic Modelling Report
Table 6.Table 6.Table 6.Table 6.11114444 –––– HCV HCV HCV HCV VKT by Road Type (2026)VKT by Road Type (2026)VKT by Road Type (2026)VKT by Road Type (2026) –––– Auckland Region Auckland Region Auckland Region Auckland Region
AMAMAMAM IPIPIPIP PMPMPMPM
DMDMDMDM OPTOPTOPTOPT ChangChangChangChang
eeee
DMDMDMDM OPTOPTOPTOPT ChangeChangeChangeChange DMDMDMDM OPTOPTOPTOPT ChaChaChaChangengengenge
All Roads 334,500 336,000 1,500 (0%) 365,800 367,500
1,700 (0%) 273,300 274,400
1,100 (0%)
Local 30,900 30,100 -800 (-3%) 32,000 31,400
-600 (-2%) 25,100 24,600
-500 (-2%)
Arterial 112,400 110,100 -2,300 (-2%) 121,200 118,300
-2,900 (-2%) 92,600 90,800
-1,800 (-2%)
Motorway 159,500 164,000 4,500 (3%) 177,700 183,000
5,300 (3%) 129,000 132,500
3,500 (3%)
Rural 31,900 31,900 0 (0%) 34,800 34,900 100 (0%) 26,600 26,600 0 (0%)
Table 6.Table 6.Table 6.Table 6.11115555 –––– HCV HCV HCV HCV VKT by Road Type (2026)VKT by Road Type (2026)VKT by Road Type (2026)VKT by Road Type (2026) –––– Study Area Study Area Study Area Study Area
AMAMAMAM IPIPIPIP PMPMPMPM
DMDMDMDM OPTOPTOPTOPT ChangeChangeChangeChange DMDMDMDM OPTOPTOPTOPT ChangeChangeChangeChange DMDMDMDM OPTOPTOPTOPT ChangeChangeChangeChange
All Roads 68,200 71,500 3,300 (5%)
74,400 77,900 3,500 (5%) 55,600 58,100 2,500 (4%)
Local 7,000 6,600 -400 (-6%)
7,200 6,800 -400 (-6%) 5,700 5,400 -300 (-5%)
Arterial 25,200 23,400 -1,800 (-7%)
27,300 25,200 -2,100 (-8%) 20,600 19,200 -1,400 (-7%)
Motorway 30,500 36,100 5,600 (18%)
34,000 40,000 6,000 (18%) 24,700 28,900 4,200 (17%)
Rural 5,500 5,500 0 (0%) 5,900 5,900 0 (0%) 4,600 4,500 -100 (-2%)
TableTableTableTablessss 6.14 6.14 6.14 6.14 and 6.156.156.156.15 demonstrate that across the greater Auckland region the change in HCV VKT is very
small. However, in the study area, this change is more noticeable, with a marked decrease in trucks on the
local and arterial roads, and a significant increase on the motorways.
6.8 Impacts on Total Vehicle Kilometres Travelled
Table 6.Table 6.Table 6.Table 6.11116666 shows the daily vehicle kilometres travelled (VKT) by varying road type in 2026. These VKT
statistics are aggregated across the whole network but reported by different road types.

Waterview ConnectionWaterview ConnectionWaterview ConnectionWaterview Connection
Status Final Page 60 July 2010
Document Reference No 20.1.11-R-C-903 G.25 Traffic Modelling Report
Table 6.Table 6.Table 6.Table 6.11116666 –––– VKT by Road VKT by Road VKT by Road VKT by Road Type (2026)Type (2026)Type (2026)Type (2026)
AMAMAMAM IPIPIPIP PMPMPMPM
DMDMDMDM OPTOPTOPTOPT ChangChangChangChang
eeee
DMDMDMDM OPTOPTOPTOPT ChangeChangeChangeChange DMDMDMDM OPTOPTOPTOPT ChangChangChangChang
eeee
All Roads 5,595,00
0
5,682,00
0
87,000
(2%)
5,057,00
0
5,107,00
0
49,000
(1%)
6,136,00
0 6,204,000
68,000
(1%)
Local 1,224,00
0
1,215,00
0
-9,000
(-1%)
1,110,00
0
1,100,00
0
-10,000
(-1%)
1,355,00
0 1,343,000
-
12,000
(-1%)
Arterial 1,696,00
0
1,670,00
0
-
25,000
(-1%)
1,441,00
0
1,408,00
0
-33,000
(-2%)
1,809,00
0 1,777,000
-
32,000
(-2%)
Motorway 1,944,00
0
2,062,00
0
118,00
0
(6%)
1,845,00
0
1,936,00
0
91,000
(5%)
2,094,00
0 2,205,000
111,00
0 (5%)
Rural 732,000 735,000 3,000
(0.4%) 662,000 663,000
1,000
(0.2%) 877,000 879,000
2,000
(0.2%)
From Table 6.Table 6.Table 6.Table 6.11116666 it can be seen that when the project is in place, there is an increase in VKT across the
Auckland region in all three peak periods. This is partially due to the expected traffic induced by the
completion of the WRR, but also because some vehicles are attracted to the longer, faster motorway route.
This is supported by the fact the increase in average trip length across the whole model, as shown in TableTableTableTable
6.6.6.6.11117777.
Table 6.Table 6.Table 6.Table 6.11117777 –––– Average Trip Length Average Trip Length Average Trip Length Average Trip Length acrossacrossacrossacross the Auckland Region the Auckland Region the Auckland Region the Auckland Region (2026) (2026) (2026) (2026)
2026 Time Period
DM OPT Change
AM 9.18 km 9.26 km 0.08 km (1%)
IP 8.43 km 8.48 km 0.05 km (1%)
PM 9.05 km 9.12 km 0.07 km (1%)
Table 6.Table 6.Table 6.Table 6.11116666 also indicates that with the introduction of the project the travel on motorways increases, but there
is a consequential decrease in travel on local and arterial roads.
The increase on motorways and decrease on other roads is due to construction of a new length of motorway,
and due to the completion of the WRR. The completion of the WRR means that vehicles can travel from the

Waterview ConnectionWaterview ConnectionWaterview ConnectionWaterview Connection
Status Final Page 61 July 2010
Document Reference No 20.1.11-R-C-903 G.25 Traffic Modelling Report
Manukau and airport areas to West Auckland on motorways whereas before the Waterview Connection is built,
vehicles must travel on arterial and local roads or on SH1, through CMJ to SH16.
Table 6.Table 6.Table 6.Table 6.11118888 displays the changes in VKT in the study area. For the purposes of Table 6.Table 6.Table 6.Table 6.11118888, the study area is
defined as the refined area of model coding, as discussed in Chapter Chapter Chapter Chapter 3333 of the Project Assignment Model
Validation Report, which is broadly the Waitakere City area plus the western area of the Auckland Isthmus..
Table 6.Table 6.Table 6.Table 6.11118888 –––– Study Area VKT by Road Type (2026) Study Area VKT by Road Type (2026) Study Area VKT by Road Type (2026) Study Area VKT by Road Type (2026)
AMAMAMAM IPIPIPIP PMPMPMPM
DMDMDMDM OPTOPTOPTOPT ChangChangChangChang
eeee
DMDMDMDM OPTOPTOPTOPT ChangeChangeChangeChange DMDMDMDM OPTOPTOPTOPT ChangeChangeChangeChange
All Roads 1,082,700 1,173,900 91,200 (8%)
946,600 1,016,400 69,800 (7%)
1,182,900 1,264,200 81,300 (7%)
Local 165,300 157,100 -8,200 (-5%)
140,700 134,700 -6,000 (-4%)
185,500 175,500 -10,000 (-5%)
Arterial 448,200 425,800 -22,400 (-5%) 385,500 361,600 -23,900
(-6%) 479,600 457,400 -22,200 (-5%)
Motorwa
y 385,600 507,300 121,700
(32%) 349,400 449,100 99,700
(29%) 423,400 536,000 112,600
(27%)
Rural 83,500 83,600 100 (0%)
70,900 70,900 0 (0%) 94,400 95,300 900 (1%)
Table 6.Table 6.Table 6.Table 6.11118888 displays the same trends as Table 6.Table 6.Table 6.Table 6.11116666 that is when the Waterview Connection is in place the travel
on motorways is seen to increase, with traffic on local and arterial roads reducing as a consequence. The
greatest impact in the study area is seen on the motorways, with VKT increasing by between 27% and 32%.
6.9 Induced Traffic
The construction of the Waterview Connection reduces travel times and congestion across much of the
network, which is expected to induce some additional travel onto the road network. These induced trips
include newly created trips, as well as trips that change destinations, change travel modes or change their time
of travel. The models estimate that some 6,000 vpd of the 82,400vpd using the Waterview Connection are due
to induced traffic.
The ART3 model does not generate purely 'new' trips. The 6,000 induced trips come from redistribution of
trips (i.e. traffic changing trip destinations that require use of this corridor), modal-shift (from PT to cars, from
walking/cycling to cars etc), and from time-shifting (i.e. trips that were made in the inter peak may be taken in
the AM peak as a result of the project and vice versa). The ART3 model retains the total number of person-
trips when different transport options are tested, but the amount of car trips changes. These additional car
trips are not included as 'new' trips, because they will just be person trips changing the place, time, mode or
route of their trip. It is estimated that about 93% of the trips on the SH20 Waterview Connection are due to re-
routing, and 7% are due to 'induced' trips (redistributed, mode change, time change).

Waterview ConnectionWaterview ConnectionWaterview ConnectionWaterview Connection
Status Final Page 62 July 2010
Document Reference No 20.1.11-R-C-903 G.25 Traffic Modelling Report
Table 6.Table 6.Table 6.Table 6.11119999 displays the change in trip totals between the Do-Minimum and the Option in 2016, with Table Table Table Table
6.6.6.6.20202020 showing the same for 2026.
Table Table Table Table 6.6.6.6.19191919 –––– 2016 Trip Totals (2 2016 Trip Totals (2 2016 Trip Totals (2 2016 Trip Totals (2----hour total trips)hour total trips)hour total trips)hour total trips)
2016 Lights2016 Lights2016 Lights2016 Lights 2016 HCVs2016 HCVs2016 HCVs2016 HCVs
DMDMDMDM OptOptOptOpt ChangeChangeChangeChange DMDMDMDM OptOptOptOpt ChangeChangeChangeChange
AM Peak 537,255 538,518 1,263 (0.2%) 28,692 28,692 0 (0.0%)
Inter-
Peak
518,844 518,777 -67 (0.0%) 31,309 31,309 0 (0.0%)
PM Peak 606,259 606,365 106 (0.0%) 23,468 23,468 0 (0.0%)
Table 6.Table 6.Table 6.Table 6.20202020 –––– 2026 Trip Totals (2 2026 Trip Totals (2 2026 Trip Totals (2 2026 Trip Totals (2----hour total trips)hour total trips)hour total trips)hour total trips)
2026 L2026 L2026 L2026 Lightsightsightsights 2026 HCVs2026 HCVs2026 HCVs2026 HCVs
DMDMDMDM OptOptOptOpt ChangeChangeChangeChange DMDMDMDM OptOptOptOpt ChangeChangeChangeChange
AM Peak 575,437 576,830 1,393 (0.2%) 36,598 36,598 0 (0.0%)
Inter-
Peak
562,110 562,107 -3 (0.0%) 39,937 39,937 0 (0.0%)
PM Peak 650,620 651,164 544 (0.1%) 29,952 29,952 0 (0.0%)
TableTableTableTables s s s 6.6.6.6.11119999 and 6.6.6.6.20202020 shows that:
• As in Section 5.1, the number of HCVs remains the same between the Do-Minimum and the Option; and
• As also reported in Section 5.1, at a regional level, the option does not change the total number of trips by
more than 0.5% in either 2016 or 2026, and as may be expected, has the least impact on the inter-peak
trips.

Waterview ConnectionWaterview ConnectionWaterview ConnectionWaterview Connection
Status Final Page 63 July 2010
Document Reference No 20.1.11-R-C-903 G.25 Traffic Modelling Report
7. Operational Results
This Chapter discusses the results of the operational modelling that has been undertaken, and also provides
analysis on the stability of the model.
7.1 Background
Whilst the AM and PM operational models can provide more detailed assessment, it is noted that they are still
only a ‘simulation’ of the potential operation of the road network during these peak periods. The aim of
‘simulation’ modelling is therefore to identify any potentially significant issues associated with the road
network operation in a generic set of network operating conditions for the different assessment scenarios in
order that design modification or any further mitigation can be identified. Whilst the models give
consideration to the influence of factors, such as driver behaviour and other operational and design factors,
there will inevitably be fluctuations in the day-to-day operation of the road network, as well as across different
times of year, depending on the specific road operating conditions at that time. In this regard, manual
capacity calculations have been undertaken to assess the effects of the design specification for the roads and
to support the operational model assumptions, where necessary.
It is noted that the geographic extent of operational model can make it more difficult to assess and optimise
and coordinate each intersection across the full scope of the model network. Consequently, whilst some
optimisation of signalised intersections has generally been incorporated in the future year operational models,
further improvements in network performance may be able to be achieved at certain locations with further
refinement to the optimisation and coordination of adjacent intersections. In addition, the modelling of ramp
signals at motorway on ramps has been replicated using a slow vehicle speed over a short section of the on
ramp. Whilst this can replicate the effects of the ramp signals it does not adjust to traffic demand on the on
ramp and therefore cannot fully replicate the complex operation of the ramp signal systems. These points
have been discussed in relation to a number of locations, as identified in the following paragraphs.
7.2 Travel Time Results
The operational modelling has focused on the effect of the project on travel times, rather than on changes in
flow. The assessments consider both the 2016 and 2026 future year operating conditions with the Project
(the ‘Option’ scenarios), as well as the baseline 2006 conditions. Comparison of the wider operation of the
network without the Project (the ‘do minimum’ scenarios) in the future years has been provided earlier in
Chapter 6Chapter 6Chapter 6Chapter 6.
In relation to the average travel times, the routes extracted from the operational model, shown on Figure 7.1Figure 7.1Figure 7.1Figure 7.1
include routes along SH16 and SH20, as well as locations, where connections are provided between State
highways, or between the State highway and arterial road network.

Waterview ConnectionWaterview ConnectionWaterview ConnectionWaterview Connection
Status Final Page 64 July 2010
Document Reference No 20.1.11-R-C-903 G.25 Traffic Modelling Report
Figure Figure Figure Figure 7.17.17.17.1: Operational Model Travel Time Routes: Operational Model Travel Time Routes: Operational Model Travel Time Routes: Operational Model Travel Time Routes
7.2.1 AM Peak Period
Table Table Table Table 7.17.17.17.1 provides a summary of the predicted average travel times (minutes), comparing the 2006 operational
model outputs with the predicted 2016 OPT and 2026 OPT future year operation for the AM peak period.

Waterview ConnectionWaterview ConnectionWaterview ConnectionWaterview Connection
Status Final Page 65 July 2010
Document Reference No 20.1.11-R-C-903 G.25 Traffic Modelling Report
Table Table Table Table 7.17.17.17.1: Summary of Average Travel Times : Summary of Average Travel Times : Summary of Average Travel Times : Summary of Average Travel Times –––– AM Pe AM Pe AM Pe AM Peak Periodak Periodak Periodak Period
2006200620062006 2016 OPT 2016 OPT 2016 OPT 2016 OPT ---- With Project With Project With Project With Project 2026 OPT 2026 OPT 2026 OPT 2026 OPT ---- With Project With Project With Project With Project RouteRouteRouteRoute DirectionDirectionDirectionDirection
Average Average Average Average
Travel Time Travel Time Travel Time Travel Time
(mins)(mins)(mins)(mins)
Average Average Average Average
Travel Time Travel Time Travel Time Travel Time
(mins)(mins)(mins)(mins)
ChangeChangeChangeChange
2006 to 2006 to 2006 to 2006 to
2016 OPT 2016 OPT 2016 OPT 2016 OPT
(mins)(mins)(mins)(mins)
Average Average Average Average
Travel Time Travel Time Travel Time Travel Time
(mins)(mins)(mins)(mins)
ChangeChangeChangeChange
2016 OPT to 2016 OPT to 2016 OPT to 2016 OPT to
2026 OPT 2026 OPT 2026 OPT 2026 OPT
(mins)(mins)(mins)(mins)
N/B 6.7 7.0 0.3 6.8 -0.2 Te Atatu Rd –
SH16 (East) S/B 2.5 3.5 1.0 4.5 1.0
N/B 11.9 7.1 -4.8 8.5 1.4 Great North Rd
– SH16 (East) S/B 2.9 2.9 0.0 2.8 -0.1
N/B 7.1 4.4 -2.7 5.2 0.8 Great North Rd
- SH16 (West) S/B 5.3 4.6 -0.7 4.4 -0.2
N/B n/a 4.8 n/a 5.2 0.4 SH20: Maioro
Interchange -
SH16 (West) S/B
n/a 4.4 n/a 4.8 0.4
E/B 6.8 4.0 -2.8 4.8 0.8 SH16: Te Atatu
– Great North
Road W/B
3.5 3.7 0.2 3.7 0.0
E/B 11.8 6.1 -5.7 7.1 1.0 SH16: Te Atatu
– St Lukes W/B 5.3 5.6 0.3 5.6 0.0
The main points from Table 7.1Table 7.1Table 7.1Table 7.1 are identified as:
• Northbound traffic on Te Atatu Road to SH16 eastbound is on average identified as experiencing a broadly
similar travel time to the 2006 baseline in both the 2016 and 2026 OPT scenarios. However, vehicles
travelling in the opposite (southbound) direction from SH16 to Te Atatu Road are anticipated to experience
increased delays. This is considered to be primarily due to increased delay on Te Atatu Road, where traffic
flows are predicted to increase, due to the extra capacity provided on SH16, as identified in Table 6.5 Table 6.5 Table 6.5 Table 6.5 and
Table 6.6Table 6.6Table 6.6Table 6.6.
• On Great North Road, northbound traffic heading to either SH16 (East) or SH16 (West) is on average
anticipated to experience improvement in travel time with the Project in both 2016 OPT and 2026 OPT
scenarios, compared with the 2006 baseline. This is anticipated to be related to the predicted reductions
in traffic flow on Great North Road and extra capacity provided on SH16, discussed in Section Section Section Section 6.46.46.46.4. In the
equivalent southbound direction, there are only marginal changes in the travel times anticipated.
• Along SH20 between the Maioro Street Interchange and SH16 (West), only marginal changes in the
northbound and southbound travel times occur between the 2016 OPT and 2026 OPT scenarios. The

Waterview ConnectionWaterview ConnectionWaterview ConnectionWaterview Connection
Status Final Page 66 July 2010
Document Reference No 20.1.11-R-C-903 G.25 Traffic Modelling Report
average travel time along this route of approximately 5 minutes, which equates to an average vehicle
speed of approximately 70kph on this route.
• On SH16, there is anticipated to be noticeable improvements in the eastbound peak direction travel time in
the 2016 OPT scenario, when compared with the 2006 baseline. Between the 2016 OPT and 2026 OPT
scenarios, there is anticipated to be an increase in the eastbound travel times on SH16, although travel
times are still anticipated to be improved when compared with the 2006 baseline. In this regard,
eastbound travel times equate to average vehicle speeds of around 40kph, 70kph and 65 kph in the 2006,
2016 OPT and 2026 OPT scenarios respectively. It is noted that this should be considered in the context
of the increases of approximately 25% (2,000-2,500 vehicles in the two hour peak), in eastbound traffic on
SH16 between St Lukes and Te Atatu Interchanges. In the westbound direction, travel times are predicted
to remain broadly similar in each scenario with average vehicle speeds equating to approximately 80-
90kph.
The key observations in relation to the operational model during the AM peak period in the 2016 OPT and the
2026 OPT scenarios are provided below. Each set of observations is referenced to Figure 7.2Figure 7.2Figure 7.2Figure 7.2 and Figure 7.3Figure 7.3Figure 7.3Figure 7.3 in
relation to the 2016 OPT and 2026 OPT observations respectively. The observations from the 2016 OPT
scenario, in the AM peak period model, are as follows:
1. On the northbound approach from Te Atatu South, the observed queuing extends to the south of the
Edmonton Road roundabout over a period between approximately 0700 and 0900. It is considered that
this queuing occurs, in part, as a result of the observed vehicle weaving in the model related to the lane
changing approaching the intersection. In comparison to the model observations, it is considered that in
reality drivers are actually likely to make more informed decisions at an earlier stage and as a consequence
there would be improved lane utilisation. Given the increases in traffic flow predicted on this section of Te
Atatu Road, combined with these observation and no capacity improvements along the corridor south of
the interchange, it is considered that a broadly similar operational performance along Te Atatu Road to the
2006 baseline would be observed.
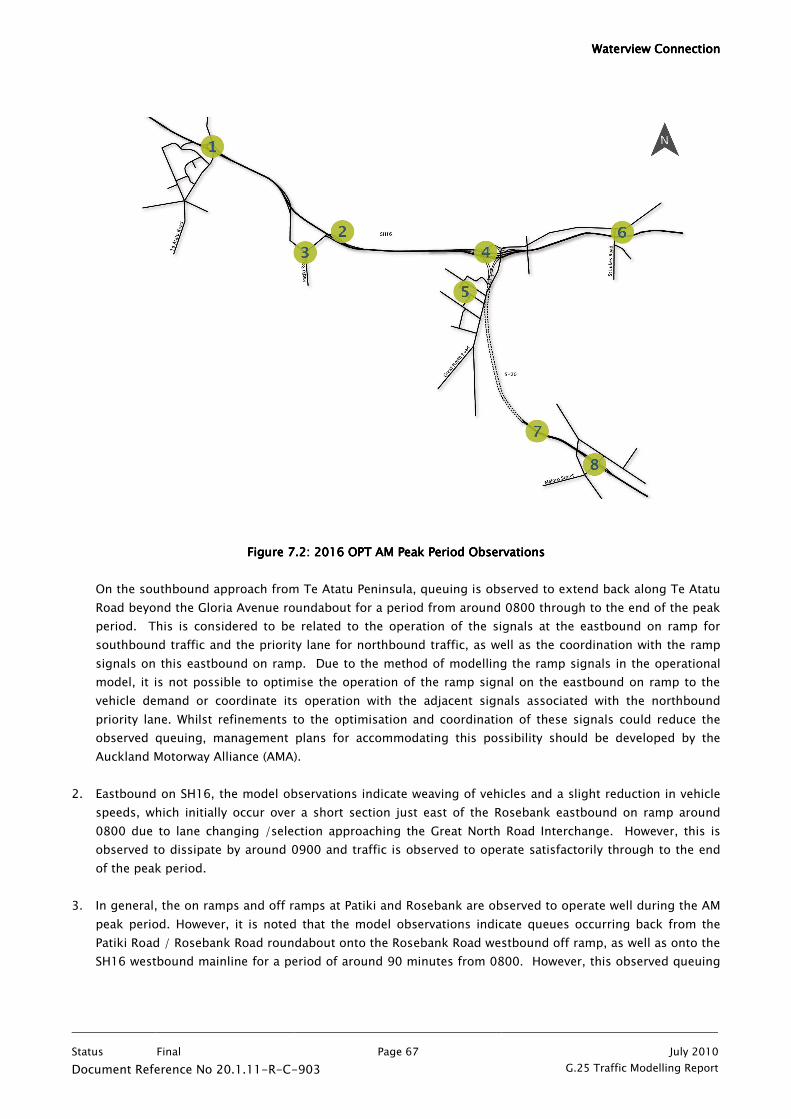
Waterview ConnectionWaterview ConnectionWaterview ConnectionWaterview Connection
Status Final Page 67 July 2010
Document Reference No 20.1.11-R-C-903 G.25 Traffic Modelling Report
Figure Figure Figure Figure 7.27.27.27.2: 2016 OPT AM Peak Period Observations: 2016 OPT AM Peak Period Observations: 2016 OPT AM Peak Period Observations: 2016 OPT AM Peak Period Observations
On the southbound approach from Te Atatu Peninsula, queuing is observed to extend back along Te Atatu
Road beyond the Gloria Avenue roundabout for a period from around 0800 through to the end of the peak
period. This is considered to be related to the operation of the signals at the eastbound on ramp for
southbound traffic and the priority lane for northbound traffic, as well as the coordination with the ramp
signals on this eastbound on ramp. Due to the method of modelling the ramp signals in the operational
model, it is not possible to optimise the operation of the ramp signal on the eastbound on ramp to the
vehicle demand or coordinate its operation with the adjacent signals associated with the northbound
priority lane. Whilst refinements to the optimisation and coordination of these signals could reduce the
observed queuing, management plans for accommodating this possibility should be developed by the
Auckland Motorway Alliance (AMA).
2. Eastbound on SH16, the model observations indicate weaving of vehicles and a slight reduction in vehicle
speeds, which initially occur over a short section just east of the Rosebank eastbound on ramp around
0800 due to lane changing /selection approaching the Great North Road Interchange. However, this is
observed to dissipate by around 0900 and traffic is observed to operate satisfactorily through to the end
of the peak period.
3. In general, the on ramps and off ramps at Patiki and Rosebank are observed to operate well during the AM
peak period. However, it is noted that the model observations indicate queues occurring back from the
Patiki Road / Rosebank Road roundabout onto the Rosebank Road westbound off ramp, as well as onto the
SH16 westbound mainline for a period of around 90 minutes from 0800. However, this observed queuing

Waterview ConnectionWaterview ConnectionWaterview ConnectionWaterview Connection
Status Final Page 68 July 2010
Document Reference No 20.1.11-R-C-903 G.25 Traffic Modelling Report
is considered to be a result of some limitations in the operational model to effectively model the operation
of the Patiki Road / Rosebank Road roundabout. Separate assessments, using the SIDRA detailed
intersection analysis package, have been undertaken to review the potential queuing. These more detailed
assessments have indicated that, based on the demand traffic flows at this roundabout extracted from the
project assignment model, the queuing on the Rosebank Road approach would not extend to the Rosebank
westbound off ramp. As such, the extent of queuing observed in the operational model is not anticipated
to occur. The SIDRA analysis undertaken is discussed in further details in later sections of this chapter.
4. At the Great North Road Interchange, both the eastbound on ramps to SH16 from SH20 and Great North
Road are generally observed to operate satisfactorily. The eastbound on ramp from Great North Road is
observed to extend back around the on ramp for a short period before 0900. It is considered that
refinement of the operation of the ramp signals by changing the signal timings could reduce the observed
queuing at this on ramp.
5. Observations of the queuing and vehicles speeds on Great North Road indicate that the overall operation
for northbound vehicles would be improved compared with observed operations in 2006, with a reduction
in the duration of queuing and improvements in vehicle speeds and travel times.
6. To the east of the St Lukes / Western Springs Interchange weaving is predicted to occur as eastbound
vehicles lane change approaching Newton Road and the SH1 Interchange, which causes slow moving queue
of traffic back along SH16 to the west of the St Lukes Interchange. This is observed to occur over a period
of around 90 minutes across the peak period. However, toward the end of the peak period, this weaving
and slow moving traffic has dissipated, similarly to the 2006 scenario.
It is also noted that the model observations indicate queuing on the Western Springs eastbound off ramp
extending back onto the eastbound mainline on SH16 for a period of around 30 minutes at the height of
the AM peak period, due to the demand for the right turn onto Great North Road at the end of the ramp.
On St Lukes Road approaching the Great North Road intersection, queuing is predicted to build from
around 0800 through to 0930, but dissipates by the end of the peak period. Whilst further optimisation
and coordination of the traffic signals on St Lukes Road and Great North Road may reduce the observed
queues back to the SH16 eastbound mainline and on St Lukes Road, management plans for
accommodating this possibility should be developed.
7. SH20 is observed to operate satisfactorily throughout the AM peak period around the Great North Road
Interchange and through the tunnel, as indicated by the travel times along the route presented above. On
the southbound approach to Maioro Street Interchange, reduced vehicle speeds are observed for HCVs and
other larger vehicles exiting the tunnel as the gradient increases. These vehicles are generally observed to
move to the nearside lane and as a result the observations do not indicate that queuing occurs back
though the tunnel.
8. At the Maioro Street Interchange, the ramps are observed to operate satisfactorily throughout the peak
periods and the SH20 mainline operates satisfactorily through the interchange. It is observed that there
high traffic flows from Maioro Street (West) and Richardson Road (South) proceeding across the
interchange bridge to turn south onto the southbound on ramp. Whilst refinement to the optimisation and
coordination of the Maioro Street / Richardson Road signals may reduce the observed queuing and the
adverse effects on the operation of the interchange, management plans for accommodating this possibility

Waterview ConnectionWaterview ConnectionWaterview ConnectionWaterview Connection
Status Final Page 69 July 2010
Document Reference No 20.1.11-R-C-903 G.25 Traffic Modelling Report
should be developed.
Figure Figure Figure Figure 7.37.37.37.3: 2026 OPT AM Peak Period Observations: 2026 OPT AM Peak Period Observations: 2026 OPT AM Peak Period Observations: 2026 OPT AM Peak Period Observations
The observations from the 2026 OPT scenario, in the AM peak period model, are as follows:
1. The observations on Te Atatu Road approaching the interchange are similar to those in the 2016 OPT
scenario, although due to variations in traffic flow demands and the optimisation/coordination of the
signals different patterns are observed.
On the southbound approach from Te Atatu Peninsula, queuing is observed to extend back along Te Atatu
Road beyond the Gloria Avenue roundabout for a period of between 45 and 60 minutes during the height
of the AM peak period. The reasons for this are considered to the similar to those discussed previously
and relate to the operation of the signals at the eastbound priority lane on ramp as well as the
coordination with the ramp signals on this on ramp.
On the northbound approach from Te Atatu South, the observed queuing extends to the south of the
Edmonton Road roundabout over a period between approximately 0700 and 0930. It is again considered
that this queuing occurs, in part, as a result of the observed lane changing approaching the intersection.

Waterview ConnectionWaterview ConnectionWaterview ConnectionWaterview Connection
Status Final Page 70 July 2010
Document Reference No 20.1.11-R-C-903 G.25 Traffic Modelling Report
Nevertheless, the observed queuing in 2026 is broadly similar to the operational performance along Te
Atatu Road in 2006, even accounting for the predicted increases in traffic flows.
2. Similarly to the 2016 OPT scenario, eastbound vehicles on SH16 are observed to weave and there is a
reduction in vehicle speeds, which initially occur over a short section just east of the Rosebank eastbound
on ramp around 0800. This is observed to be related to vehicles changing lanes in advance of the off
ramps at the Great North Road Interchange, but occurs well in advance of these off ramps. Between 0800
and 0900, this weaving continues to occur over a similar length but moves further west to around the
Rosebank eastbound on ramp. In reality, it is anticipated that this weaving of eastbound vehicles would
occur over a longer section between the Rosebank on ramp and Great North Road off ramp.
3. In general, as in the 2016 OPT scenario, the on ramps and off ramps at Patiki and Rosebank are observed
to operate well during the AM peak period. However, the model observations indicate queues occurring
back from the Patiki Road / Rosebank Road roundabout onto the Rosebank Road westbound off ramp, as
well as onto the SH16 westbound mainline for a period of around 30-45 minutes. More detailed SIDRA
analyses have again been undertaken which indicate the queuing on the Rosebank Road approach would
not extend back to the Rosebank westbound off ramp. The extent of queuing observed in the operational
model is therefore not anticipated to occur. Again, more detail o the SIDRA analysis is discussed later in
this report.
4. At Great North Road Interchange, the queue on the eastbound on ramp from Great North Road is observed
to extend back around the on ramp for a period of around 30 minutes at the height of peak period. At the
SH20 eastbound on ramp, queues are observed to extend back to around the crest of the ramp at times
during the height of the peak period.
5. Observations of the queuing and vehicles speeds on Great North Road indicate that the overall operation
for northbound vehicles would be similar to the observed operations in 2006, with some reduction in the
duration of queuing and improvements in vehicle speeds and travel times.
6. As in the 2016 OPT scenario, to the east of the St Lukes / Western Springs Interchange, weaving is
predicted to occur as eastbound vehicles change lanes approaching Newton Road and the SH1 Interchange.
In the 2026 OPT scenario this is observed to result in a slow moving queue of traffic back along SH16 to
the west of the St Lukes Interchange, which occurs over a period of around 90 minutes across the peak
period. However, toward the end of the peak period, this weaving and slow moving traffic has dissipated.
This is considered to demonstrate a similar level of observed operation for eastbound traffic on SH16 to
the observations of the 2006 baseline scenario.
It is also noted that the model observations indicate queuing on the Western Springs eastbound off ramp
extending back onto the eastbound mainline on SH16 for a period of around 60 minutes at the height of
the AM peak period, due to the demand for the right turn onto Great North Road at the end of the ramp.
On the westbound off ramp at St Lukes Interchange, queuing is predicted back to the mainline for a short
period in the AM peak, due to the demand for right turns from the off ramp onto St Lukes Road. In both
cases, whilst further optimisation and coordination of the traffic signals on St Lukes Road and Great North
Road at and between these off ramps may reduce the observed queues back to the SH16 mainline,
management plans for accommodating this possibility should be developed.

Waterview ConnectionWaterview ConnectionWaterview ConnectionWaterview Connection
Status Final Page 71 July 2010
Document Reference No 20.1.11-R-C-903 G.25 Traffic Modelling Report
7. SH20 is observed to operate satisfactorily throughout the AM peak period around the Great North Road
Interchange and through the tunnel, as indicated by the travel times along the route presented above. As
in the 2016 OPT scenario, on the southbound approach to Maioro Street Interchange reduced vehicle
speeds are observed for HCVs and other larger vehicles exiting the tunnel as the gradient increases, but
observations do not indicate that queuing occurs back though the tunnel.
8. Similar observations to the 2016 OPT scenario occur at the Maioro Street Interchange, but the extent of the
queuing on Maioro Street and Richardson Road is observed to increase. The ramps are generally observed
to operate satisfactorily throughout the peak periods and the SH20 mainline operates satisfactorily
through the interchange. It is observed that high traffic volumes from Maioro Street (West) and Richardson
Road (South) proceeding across the interchange bridge to turn south onto the southbound on ramp. It is
considered that the method used for the ramp signal operation in the model does not allow the ramp
signal to be optimised to the variations in traffic demand during the peak period. As such, queuing back
across the overbridge is observed to affect the northbound off ramp operation, resulting in queuing on the
northbound off ramp back to the SH20 northbound mainline for around 30 minutes. Whilst refinement to
the optimisation and coordination of the Maioro Street / Richardson Road signals, the interchange signals
and at the southbound on ramp, the observed queuing may be reduced, management plans for
accommodating this possibility should be developed.
PM Peak Period ModelsPM Peak Period ModelsPM Peak Period ModelsPM Peak Period Models
Table 7.2Table 7.2Table 7.2Table 7.2 provides a summary of the predicted average travel times (minutes), comparing the 2006 operational
model outputs with the predicted 2016 OPT and 2026 OPT future year operation for the PM peak period.
Table Table Table Table 7.27.27.27.2: Summary of Average Travel Times : Summary of Average Travel Times : Summary of Average Travel Times : Summary of Average Travel Times –––– PM Peak Pe PM Peak Pe PM Peak Pe PM Peak Periodriodriodriod
2006200620062006 2016 OPT 2016 OPT 2016 OPT 2016 OPT ---- With Project With Project With Project With Project 2026 OPT 2026 OPT 2026 OPT 2026 OPT ---- With Project With Project With Project With Project RouteRouteRouteRoute DirectionDirectionDirectionDirection
Average Average Average Average
Travel Time Travel Time Travel Time Travel Time
(mins)(mins)(mins)(mins)
Average Average Average Average
Travel Time Travel Time Travel Time Travel Time
(mins)(mins)(mins)(mins)
ChangeChangeChangeChange
2006 to 2006 to 2006 to 2006 to
2016 OPT 2016 OPT 2016 OPT 2016 OPT
(mins)(mins)(mins)(mins)
Average Average Average Average
Travel Time Travel Time Travel Time Travel Time
(mins)(mins)(mins)(mins)
ChangeChangeChangeChange
2016 OPT to 2016 OPT to 2016 OPT to 2016 OPT to
2026 OPT 2026 OPT 2026 OPT 2026 OPT
(mins)(mins)(mins)(mins)
N/B 3.5 10.3 6.8 9.4 -0.9 Te Atatu Rd –
SH16 (East) S/B 3.3 4.6 1.3 4.5 -0.1
N/B 4.9 4.4 -0.5 4.4 0.0 Great North Rd
– SH16 (East) S/B 3.4 4.2 0.8 4.1 -0.1
N/B 4.1 3.6 -0.5 4.5 0.9 Great North Rd
- SH16 (West) S/B 5.0 4.2 -0.8 4.2 0.0
N/B n/a 4.1 n/a 5.6 1.5 SH20: Maioro
Interchange -
SH16 (West) S/B
n/a 4.2 n/a 4.3 0.1
SH16: Te Atatu E/B 3.5 3.4 -0.1 3.4 0.0

Waterview ConnectionWaterview ConnectionWaterview ConnectionWaterview Connection
Status Final Page 72 July 2010
Document Reference No 20.1.11-R-C-903 G.25 Traffic Modelling Report
– Great North
Road W/B
7.7 6.2 -1.5 8.0 1.8
E/B 5.3 5.1 -0.2 5.1 0.0 SH16: Te Atatu
– St Lukes W/B 10.2 9.1 -1.1 10.9 1.8
The main points from Table 7.2Table 7.2Table 7.2Table 7.2 are identified as:
• Northbound traffic on Te Atatu Road to SH16 eastbound is on average identified as experiencing an
increase in travel time between the 2006 baseline and both the 2016 OPT and 2026 OPT scenarios.
Increases in travel time for southbound vehicles on Te Atatu Road are also predicted with the Project in
both the 2106 OPT and 2026 OPT scenarios. This is considered to be due to the observed poor operation
of this road corridor, in combination with the predicted increases in traffic flows associated with the
Project identified in Table 6.5 Table 6.5 Table 6.5 Table 6.5 and Table 6.6 Table 6.6 Table 6.6 Table 6.6. It is also expected that significant growth in the non-peak
direction (i.e. from the west) associated with growth to the west, add conflicting movements at the
interchange.
• On Great North Road, travel times northbound and southbound, to and from the SH16 eastbound on or off
ramp respectively are predicted to improve in the future years with the Project. There is also predicted to
be improved travel times northbound on Great North Road to SH16 westbound in the 2016 OPT scenario
However, in the other scenarios, travel times to and from the SH16 westbound carriageway are affected by
the observed queuing on SH16 westbound, as discussed below. Along SH20 between Maioro Street
Interchange and SH16 (West), only a marginal increase in the southbound travel time occurs between the
2016 OPT and 2026 OPT scenarios, with average vehicle speeds remaining 75 to 80kph. However, in the
northbound direction, an increase in travel time between the 2016 OPT and 2026 OPT scenarios is
predicted, which is consistent with the observations below relating to the increases in queuing on SH16
westbound back to the SH20 on ramp. The increase in travel time equates to a reduction in the average
vehicle speed from around 80 to 55kph along this travel time route.
• In the westbound (peak direction) on SH16 in the PM peak period, there is predicted only marginal changes
in travels times between the 2006 baseline and the 2016 OPT scenarios, even with westbound traffic flows
increasing by approximately 20-25% (or around 2,000-2,500 vehicles). Between the 2006 baseline and
2026 OPT scenario, travel times are predicted to increase by around 30-35% on SH16 westbound with the
equivalent vehicle speeds reducing from around 50-55kph to approximately 40kph over these routes.
However, it is again noted that whilst additional capacity is provided westbound with the Project, traffic
flows between these scenarios are also predicted to increase by around 35% (see Table 6.3Table 6.3Table 6.3Table 6.3).
• In the eastbound direction, travel times are predicted to remain broadly similar in each scenario with
average vehicle speeds equating to approximately 80-90kph. However, it is noted that compared to the
2006 baseline, the 2016 OPT and 2026 OPT scenarios are predicted to result in increases in 2 hour traffic
flows of 10-15% and 20-25% respectively (see Table 6.3Table 6.3Table 6.3Table 6.3).

Waterview ConnectionWaterview ConnectionWaterview ConnectionWaterview Connection
Status Final Page 73 July 2010
Document Reference No 20.1.11-R-C-903 G.25 Traffic Modelling Report
Figure Figure Figure Figure 7.47.47.47.4: 2016 OPT PM Peak Period Observations: 2016 OPT PM Peak Period Observations: 2016 OPT PM Peak Period Observations: 2016 OPT PM Peak Period Observations
The key observations in relation to the operational model during the PM peak period in the 2016 OPT and the
2026 OPT scenarios are provided below. Each set of observations is referenced to Figure 7.4Figure 7.4Figure 7.4Figure 7.4 and Figure 7.5Figure 7.5Figure 7.5Figure 7.5 in
relation to the 2016 OPT and 2026 OPT observations respectively.
The observations from the 2016 OPT scenario, in the PM peak period model, are as follows:
1. During the PM peak period, queues are observed to build on the Te Atatu Road northbound approach to
the interchange. Queues are observed to extend south past the Edmonton Road roundabout for around
two hours through the peak period until around 1830, when queuing begins to dissipate. As in the AM
peak period, observations indicate that poor lane utilisation and weaving in the model, as vehicles arrive at
the interchange, contributes to this situation. It is noted that the observations do not indicate any
significant issues with the operation of the interchange intersections or ramps and there is no significant
southbound queuing on Te Atatu Road (from Te Atatu Peninsula).
2. At around 1630, weaving and platooning of vehicles is observed to occur on a short section of SH16
westbound between Te Atatu Interchange and the Patiki westbound on ramp. As the peak period
progresses, the queue is observed to build, such that by around 1800 to 1830 it extends back to around
the Great North Road Interchange westbound on ramps. By the end of the model period, the queue

Waterview ConnectionWaterview ConnectionWaterview ConnectionWaterview Connection
Status Final Page 74 July 2010
Document Reference No 20.1.11-R-C-903 G.25 Traffic Modelling Report
reduces, but is still observed to occur from the approach to the Te Atatu Interchange back to east of the
Rosebank westbound off ramp.
It is noted that the queue is not observed to extend back onto either the SH20 or Great North Road
westbound on ramps at any stage in the peak period. It is also observed that the ramps at Great North
Road continue to operate satisfactorily throughout the peak period.
3. To the east of the Great North Road Interchange, weaving and queuing begins to occur around St Lukes /
Western Springs Interchange around 1500. It is observed that the weaving occurs as vehicles move
between lanes on this section from St Lukes approaching the Great North Road Interchange. As with the
queuing to the west of Great North Road Interchange, this builds during the peak period, such that by
around 1730 there is observed to be queuing on the SH16 mainline from the westbound off ramps at Great
North Road through to the east of the St Lukes / Western Springs Interchange. This queuing begins to
dissipate by the end of the peak period and at no stage is observed to have significant adverse effects on
the operation of the St Lukes / Western Springs Interchange and ramps.
Through the peak period, queues are observed to build on St Lukes Road northbound from the St Lukes
Road / Great North Road intersection through the peak period. As was discussed with the AM peak
observations, it is considered that further refinements to the optimisation and coordination of signals in
this part of the St Lukes Road / Great North Road corridor could reduce these observed queues.
4. In general, traffic on both Great North Road and SH20 is observed to operate satisfactorily throughout the
peak period. As in the AM peak period observations there is some platooning of slow moving traffic
exiting the tunnel in the southbound direction. However, this is not observed to result in queuing back
into the tunnel.
5. The Maioro Street Interchange is generally predicted to operate satisfactorily during the PM peak period in
the 2016 OPT scenario, with no significant queuing observed on either the SH20 mainline through the
interchange or the ramps. However, as the peak period progresses, queues build on the Stoddard Road /
Sandringham Road and the Richardson Road (North and South) approaches. By the end of the peak period
there is observed to be significant queuing on these approaches. However, it is noted that the operation
of the signals through the interchange intersections have generally been coordinated for the State highway
off ramps and through movements between the interchange and Maioro Street. As such, it is considered
that with further refinement to the phasing, optimisation and coordination at the intersections around the
Maioro Street interchange, the queuing on the surrounding arterial roads could be reduced, without
compromising the operational performance of the State highway ramps.
In general, the pattern of the observations from the 2026 OPT scenario (annotated on FigFigFigFigure 7.5ure 7.5ure 7.5ure 7.5) is similar in
character to the observations in the 2016 OPT scenario. However, as discussed following Figure 7.4Figure 7.4Figure 7.4Figure 7.4, there are
differences due to changes in peak period traffic demand:

Waterview ConnectionWaterview ConnectionWaterview ConnectionWaterview Connection
Status Final Page 75 July 2010
Document Reference No 20.1.11-R-C-903 G.25 Traffic Modelling Report
Figure Figure Figure Figure 7.57.57.57.5: 2026 PM Peak Period Observations: 2026 PM Peak Period Observations: 2026 PM Peak Period Observations: 2026 PM Peak Period Observations
1. Similar northbound queuing patterns are observed along Te Atatu Road toward the Te Atatu Interchange in
the 2026 OPT to the 2016 OPT scenario, although the extent of queuing is not as significant. From around
1530, the northbound queue on Te Atatu Road builds and extends past the Edmonton Road roundabout.
By around 1700, the queue has dissipated and there is observed to be only shorter sections of platooning
and slow moving traffic on Te Atatu Road, such that by around 1800 there is minimal queuing northbound.
It is also noted that the observations of queuing on the northbound approach to the Interchange are not
dissimilar to the observations from the 2006 baseline scenarios.
By comparison, whilst not observed in the 2016 OPT scenario, there is also predicted to be some queuing
on the southbound approach to the interchange (from Te Atatu Peninsula) later in the peak period, which
occasionally extends back to around Gloria Avenue. It is considered that the observed changes in the
queuing patterns at the Te Atatu Interchange are probably associated with changes in the signal
optimisation between the 2016 and 2026 OPT scenarios. In the 2026 OPT scenario queuing on the
northbound approach is reduced with resulting increases in queuing on the southbound approach, which
is observed to be affected by the optimisation and coordination of the signals on the eastbound priority
lane on ramp.
During the peak period, both the on and off ramps at Te Atatu Interchange are observed to operate
satisfactorily, with short queues occasionally forming on the eastbound off ramp for right turn vehicles.

Waterview ConnectionWaterview ConnectionWaterview ConnectionWaterview Connection
Status Final Page 76 July 2010
Document Reference No 20.1.11-R-C-903 G.25 Traffic Modelling Report
2. In the 2026 OPT scenario, weaving and platooning of vehicles is again observed to occur on a short section
between the Te Atatu Interchange and Patiki westbound on ramp near the start of the peak period. This
builds during the peak period to a more significant extent than observed in the 2016 OPT scenario, such
that by around 1730 queues extend back onto the SH20 westbound on ramp at the Great North Road
Interchange. As the peak period continues, the queuing is observed to extend further back along SH20
northbound into the Great North Road Underpass and around 1830 there is observed to be very slow
moving traffic northbound through northern section of the tunnel. This is observed to continue, with the
queue and slow moving remaining at a similar extent, until the end of the peak period. This is also
reflected in the travel times along SH20 to SH16 westbound in the PM peak period, as discussed above.
In these circumstances, it would be necessary for a tunnel management plan or strategy to be initiated to
manage the northbound traffic flow on SH20 into and through the tunnel, in order that more significant
stationary queues did not occur further south through the tunnel.
3. To the east of the Great North Road Interchange, similar patterns are observed in the 2026 OPT scenario to
the 2016 OPT scenario, with weaving and platooning of westbound vehicles observed between the Great
North Road Interchange and the St Lukes / Western Springs Interchange around 1500-1530, which begins
to extend back to the east through the St Lukes / Western Springs Interchange as the peak period
continues, but is observed to dissipate toward the end of the peak period. These observations are similar
to those in the 2006 baseline scenario. As the travel times in Table 7.2Table 7.2Table 7.2Table 7.2 show, there is predicted to be an
increase in the travel times westbound on SH16 in the 2026 OPT scenario, however, this in the context of
increases in the 2 hour traffic flows on SH16 westbound of approximately 35% compared with the 2006
baseline or 2026 DM scenarios.
It is also observed in the 2026 OPT scenario, that with the increases in traffic demands on St Lukes Road
and Great North Road (westbound), queuing occurs south along St Lukes Road for northbound traffic, east
along Great North Road for westbound traffic approaching the Western Springs Interchange intersection
and also on the westbound off ramp at St Lukes. As was discussed, it is considered that further
refinement of the coordination and optimisation of signals through this corridor could reduce these
observed queues.
4. Other than the queuing observed back from SH16 westbound along SH20 northbound, both SH20 and
Great North Road are observed to operate satisfactorily. As was discussed previously, the predicted
queuing back along SH16 westbound affects SH20 northbound through the tunnel and this was reflected
in the travel times shown in TableTableTableTable .
5. In the 2026 OPT scenario, the predicted traffic flows on the arterial roads around the Maioro Street
Interchange are lower than in the 2016 OPT scenario, due to wider changes in travel patterns identified in
the project assignment model. In this regard, whilst queuing is observed on the Richardson Road and
Stoddard Road approaches, as well as on the northbound off ramp, this is not observed to be significant
and is less than the observed queuing in the 2016 OPT scenario.

Waterview ConnectionWaterview ConnectionWaterview ConnectionWaterview Connection
Status Final Page 77 July 2010
Document Reference No 20.1.11-R-C-903 G.25 Traffic Modelling Report
7.3 Model Stability
The travel times discussed in Section 7.1Section 7.1Section 7.1Section 7.1 are from an average of five simulation ‘runs’ of the model and
averaged over the 2-hour period. Multiple runs of the model are required as these are stochastic simulations,
meaning each run gives different results due to the random selection of vehicles and driver behaviours.
Further analysis of these averages has been undertaken to show how the travel times vary between the five
runs, and if the results can therefore be considered to be stable and the averages representative. Three forms
of analysis have been undertaken:
• Analysis of the travel times for all five runs compared to the average;
• Analysis of the individual 15 minute data for each of the five runs, concentrating on the minimum,
maximum and average results; and
• Analysis of the travel times for five runs compared to ten runs; and
Each of these is discussed in detail in the following sections.
7.3.1 Analysis of Five Runs
Table 7.3Table 7.3Table 7.3Table 7.3 displays the modelled average travel time along certain routes from the 2006 AM peak validated
model, along with the average for five runs, with Table 7.4Table 7.4Table 7.4Table 7.4 showing the same for the 2016 AM peak.
Table Table Table Table 7.37.37.37.3: : : : Average Travel Time by model run 2006 AM PeakAverage Travel Time by model run 2006 AM PeakAverage Travel Time by model run 2006 AM PeakAverage Travel Time by model run 2006 AM Peak
Average Travel TimeAverage Travel TimeAverage Travel TimeAverage Travel Time
RouteRouteRouteRoute DirDirDirDir
Run 1 Run 2 Run 3 Run 4 Run 5
Average of Average of Average of Average of
runs 1runs 1runs 1runs 1----5555
N/B 6.86 6.65 6.80 6.73 6.57 6.7 Te Atatu Road
S/B 2.44 2.47 2.44 2.47 2.48 2.5
N/B 11.11 12.30 12.37 12.09 11.70 11.9 Great North Road
S/B 2.90 2.89 2.90 2.88 2.88 2.9
N/B 6.91 7.25 7.22 7.27 7.09 7.1 Great North Road to SH16 (west) S/B 5.14 5.28 5.53 5.26 5.21 5.3
N/B n/a n/a n/a n/a n/a n/a SH20 Maioro Interchange to
SH16 S/B n/a n/a n/a n/a n/a n/a
E/B n/a n/a n/a n/a n/a n/a SH20 Maioro Interchange to SH16 (west) W/B n/a n/a n/a n/a n/a n/a
E/B n/a n/a n/a n/a n/a n/a SH20 to Te Atatu
W/B n/a n/a n/a n/a n/a n/a

Waterview ConnectionWaterview ConnectionWaterview ConnectionWaterview Connection
Status Final Page 78 July 2010
Document Reference No 20.1.11-R-C-903 G.25 Traffic Modelling Report
Table Table Table Table 7.47.47.47.4: : : : Average Travel Time by model run 20Average Travel Time by model run 20Average Travel Time by model run 20Average Travel Time by model run 2016 AM Peak16 AM Peak16 AM Peak16 AM Peak
Average Travel TimeAverage Travel TimeAverage Travel TimeAverage Travel Time
RouteRouteRouteRoute DirDirDirDir
Run 1 Run 2 Run 3 Run 4 Run 5
Average of Average of Average of Average of
runs 1runs 1runs 1runs 1----5555
N/B 6.98 7.16 7.15 7.24 7.23 7.2 Te Atatu Road
S/B 3.37 3.37 3.43 3.42 3.40 3.4
N/B 5.72 5.54 5.92 5.45 5.64 5.7 Great North Road
S/B 3.02 3.06 3.03 3.04 3.05 3.0
N/B 4.06 4.09 4.15 3.99 4.03 4.1 Great North Road to SH16 (west) S/B 4.44 4.44 4.47 4.50 4.42 4.5
N/B 5.08 5.46 5.47 5.11 5.20 5.3 SH20 Maioro Interchange to
SH16 S/B 5.24 5.31 5.27 5.19 5.24 5.3
E/B 4.90 4.88 5.12 4.97 4.67 4.9 SH20 Maioro Interchange to SH16 (west) W/B 4.49 4.53 4.52 4.43 4.47 4.5
E/B 7.93 8.02 8.11 8.04 7.87 8.0 SH20 to Te Atatu
W/B 8.98 9.11 9.12 8.95 9.04 9.0
From Table 7.3Table 7.3Table 7.3Table 7.3 and Table 7.4Table 7.4Table 7.4Table 7.4 it can be determined that the model is stable between runs, as there is little
variation between the runs in both 2006 and 2016. AppendixAppendixAppendixAppendix G G G G contains graphical information showing this
analysis for the average across the 2 hour period, and also by each 15 minute period. The 15 minute graphs
show the there is little variation in the data for the runs in both 2006 and 2016.
7.3.2 Analysis of Five Runs vs. Ten Runs
In order to confirm that five model runs provided a representative result, the models were run for a further 5
simulations ‘runs’ to allow a comparison on results between a 5 and 10 run scenario. The results of this
analysis are presented in Table 7.5Table 7.5Table 7.5Table 7.5 for the 2016 PM peak.
Table Table Table Table 7.57.57.57.5: : : : Travel Time Results Comparison 2016 PM PeakTravel Time Results Comparison 2016 PM PeakTravel Time Results Comparison 2016 PM PeakTravel Time Results Comparison 2016 PM Peak
5 Runs5 Runs5 Runs5 Runs 10 Runs10 Runs10 Runs10 Runs RouteRouteRouteRoute DirDirDirDir
Min Avg Max Min Avg Max
N/B 9.98 10.26 10.44 9.96 10.28 10.53 Te Atatu Road - SH16 (East)
S/B
4.43 4.70 4.90 4.43 4.67 4.90

Waterview ConnectionWaterview ConnectionWaterview ConnectionWaterview Connection
Status Final Page 79 July 2010
Document Reference No 20.1.11-R-C-903 G.25 Traffic Modelling Report
N/B 4.29 4.30 4.32 4.26 4.29 4.32 Great North Road - SH16 (East)
S/B
4.20 4.27 4.32 4.19 4.26 4.32
N/B 3.52 3.55 3.61 3.48 3.55 3.61 NB - Great North Road - SH16 (West)
S/B
4.13 4.15 4.19 4.13 4.17 4.24
N/B 4.00 4.03 4.11 4.00 4.04 4.11 SH20: Maioro Interchange - SH16 (West)
S/B
4.18 4.21 4.22 4.18 4.21 4.26
E/B 3.37 3.37 3.38 3.37 3.37 3.38 EB - SH16: Te Atatu - Great North Road
W/B
5.65 6.02 6.59 5.65 6.04 6.59
E/B 5.07 5.07 5.08 5.07 5.07 5.08 EB - SH16: Te Atatu - St Lukes W/B 8.59 8.95 9.55 8.59 8.95 9.55
The results in Table 7.5Table 7.5Table 7.5Table 7.5 show little difference between the minimum, average and maximum travel times for
either 5 or 10 runs of the model. The comparison in Table 7.5Table 7.5Table 7.5Table 7.5 gives confidence that the 5 runs used for the
analysis of the model runs in both this report and the transport assessment are robust enough for the
reporting that has been undertaken.
Appendix HAppendix HAppendix HAppendix H contains data showing the variation in data across the 5 runs for each 15 minute period for the
2016 2 hour PM peak, and also data showing the minimum, maximum and average for the 5 runs and 10 runs,
which confirm the points made above.
7.4 SIDRA Analysis
As discussed previously in this chapter, a separate analysis was undertaken in SIDRA of the performance of the
roundabout at the intersection of Rosebank and Patiki Roads. This analysis was undertaken as observations
from the operational model indicated that in the AM peak in both 2016 and 2026 queues may occur back from
the Patiki/Rosebank Road roundabout onto the Rosebank Road westbound off ramp, as well as onto the SH16
westbound mainline for a period of around 30-45 minutes. Also, observations of the model showed the HCVs
appeared to circulate the roundabout very slowly, which, given the size of the roundabout in question did not
appear correct, and could be having an incorrect impact on the capacity and queueing.
A SIDRA model was developed for 2016 and 2026 for the AM peak (the peak in which the queuing was seen to
occur).
Firstly the SIDRA model was run using turning flows directly from the project assignment model this showed
the following:
• All approaches operated with a level of service C or below in 2016;

Waterview ConnectionWaterview ConnectionWaterview ConnectionWaterview Connection
Status Final Page 80 July 2010
Document Reference No 20.1.11-R-C-903 G.25 Traffic Modelling Report
• In 2016, the 95% queue on the Rosebank Road northern approach to the roundabout stretched 172m,
which would not go back as far as the SH16 off ramp;
• In 2016, the intersection as a whole, with the project assignment model flows, is expected to operate at a
level of service B;
• The project assignment model showed that all approaches operated with a level of service C or below in
2026;
• In 2026, the 95% queue on the Rosebank Road northern approach to the roundabout stretched 167m,
which would not go back as far as the SH16 off ramp; and
• In 2026, the intersection as a whole, with the project assignment model flows, is expected to operate at a
level of service B.
The SIDRA model was then re-run using demand flows created more directly from traffic counts at this
location, using the project assignment model only to get the predicted growth. This also confirmed
satisfactory operation of the roundabout under the predicted flows.
Analysis of the operation model showed that local traffic on Patiki Road was all assigned to the local access
road off the roundabout9. When more correctly allocated along Patiki Road, the model showed satisfactory
performance, consistent with that in the SIDRA model.
In summary, while the operational model showed extensive queuing going back from the Rosebank/Patiki
roundabout, this was found to be due to the local Patiki Road traffic being all loaded to a single point. When
spread more realistically, this showed satisfactory performance, which was confirmed by the SIDRA.
9 Note, when this loading pattern was also put in the SIDRA model, it also showed significant
queuing on Rosebank Road. Although this is not a realistic scenario, it shows that SIDRA and the
operational model show consistent results given the same input.

Waterview ConnectionWaterview ConnectionWaterview ConnectionWaterview Connection
Status Final Page 81 July 2010
Document Reference No 20.1.11-R-C-903 G.25 Traffic Modelling Report
8. Sensitivity Analysis
Sensitivity analysis has been undertaken on some of the assumptions made in the ART3 model which effect the
level of demands passed to the project model, particularly Travel Demand Management (TDM), road pricing
and fuel prices (that is pump prices). Analysis has also been undertaken at the ART3 level regarding two major
infrastructure projects which may occur in the Auckland region within the next thirty years, the additional
Waitemata Harbour Crossing and the Auckland CBD Rail Loop.
This chapter contains the results of a high-level analysis of the assumptions made in the ART3 model.
8.1 ART3 demand Analysis
As discussed previously, the WRR model takes its demands from the regional ART3 model. There are a
number of assumptions included in the ART3 model which may have an effect on the levels of demand forecast
to use SH16 and the Waterview Connection in the future years. Analysis has been undertaken into the effect of
two of these assumptions as follows:
• Traffic Demand Management (TDM); and
• Fuel Price (pump price).
The results of this analysis are presented in the following sections.
8.1.1 Travel Demand Management
TDM covers a wide range of measures, such as travel plans or an increase in home working.
The current preferred RLTS option in the ART3 model assumes a “medium level” of TDM is in place. To assess
the impact of the assumptions made in the models, the ART3 model was run using the latest RLTS preferred
option, with and without TDM to assess its impact on the WRR. Analysis was then undertaken both at a total
regional level (matrix totals) and also at a sector level, using the ten sector system previously discussed in
Chapter Chapter Chapter Chapter 6666. Table 8.1Table 8.1Table 8.1Table 8.1 displays the results of the regional analysis.

Waterview ConnectionWaterview ConnectionWaterview ConnectionWaterview Connection
Status Final Page 82 July 2010
Document Reference No 20.1.11-R-C-903 G.25 Traffic Modelling Report
Table 8.1 Table 8.1 Table 8.1 Table 8.1 –––– Regional Analysis of TDM Regional Analysis of TDM Regional Analysis of TDM Regional Analysis of TDM
RLTS Preferred Option RLTS Preferred Option RLTS Preferred Option RLTS Preferred Option nononono
TDMTDMTDMTDM
RLTS Preferred Option RLTS Preferred Option RLTS Preferred Option RLTS Preferred Option
WithWithWithWith TDM TDM TDM TDM
Change Change Change Change
AM 665,200 610,900 -54,300 (-9%)
IP 644,200 596,200 -48,000 (-8%)
PM 719,500 662,000 -57,500 (-9%)
Daily 7,715,100 7,097,100 -618,000 (-9%)
Table 8.1Table 8.1Table 8.1Table 8.1 shows that at a regional level, the implementation of TDM reduced the overall number of trips in the
Auckland region by 9%. As may be expected, the inter-peak experiences a lower level of reduction than the
AM and PM peaks, due to TDM being focused on ‘work’ trips, education and community-based initiatives,
which primarily occur in the AM and PM peaks.
Further analysis has been undertaken at the sector level (discussed in Section 6.5Section 6.5Section 6.5Section 6.5), this is shown in Table 8.Table 8.Table 8.Table 8.2222,
concentrating on movements to and from Sectors 5, 7 and 8, Avondale, Herne Bay/Mt Eden and
Hillsborough/Mt Roskill, (thought to be those most representative of the study area), with full sector to sector
results shown in Appendix Appendix Appendix Appendix IIII....
Table 8.2 Table 8.2 Table 8.2 Table 8.2 –––– Sector Analysis of TDM (total trips for Sectors 5 Sector Analysis of TDM (total trips for Sectors 5 Sector Analysis of TDM (total trips for Sectors 5 Sector Analysis of TDM (total trips for Sectors 5, 7 and, 7 and, 7 and, 7 and 8) 8) 8) 8)
RLTS Preferred Option no RLTS Preferred Option no RLTS Preferred Option no RLTS Preferred Option no
TDMTDMTDMTDM
RLTS Preferred Option RLTS Preferred Option RLTS Preferred Option RLTS Preferred Option
WithWithWithWith TDM TDM TDM TDM
Change Change Change Change
AM 249,700 225,500 -24,500 (-11%)
IP 235,900 215,100 20,800 (-10%)
PM 249,800 226,100 23,700 (-10%)
Daily 2,787,400 2,522,400 -265,000 (-10%)
Table 8.2Table 8.2Table 8.2Table 8.2 shows the following:
• The effects of TDM appear to be slightly greater in the study area than is observed in Table 8.1Table 8.1Table 8.1Table 8.1 at the
regional level;
• There is a 10% reduction in trips to/from the study area with TDM in place;
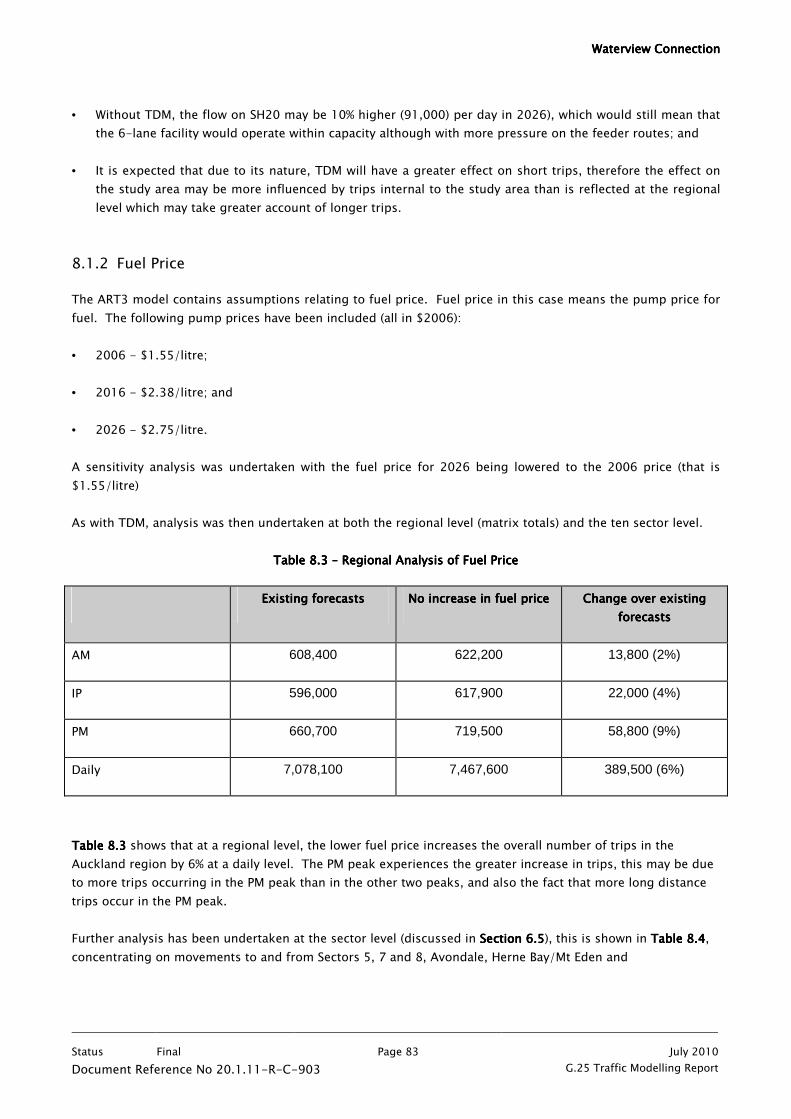
Waterview ConnectionWaterview ConnectionWaterview ConnectionWaterview Connection
Status Final Page 83 July 2010
Document Reference No 20.1.11-R-C-903 G.25 Traffic Modelling Report
• Without TDM, the flow on SH20 may be 10% higher (91,000) per day in 2026), which would still mean that
the 6-lane facility would operate within capacity although with more pressure on the feeder routes; and
• It is expected that due to its nature, TDM will have a greater effect on short trips, therefore the effect on
the study area may be more influenced by trips internal to the study area than is reflected at the regional
level which may take greater account of longer trips.
8.1.2 Fuel Price
The ART3 model contains assumptions relating to fuel price. Fuel price in this case means the pump price for
fuel. The following pump prices have been included (all in $2006):
• 2006 - $1.55/litre;
• 2016 - $2.38/litre; and
• 2026 - $2.75/litre.
A sensitivity analysis was undertaken with the fuel price for 2026 being lowered to the 2006 price (that is
$1.55/litre)
As with TDM, analysis was then undertaken at both the regional level (matrix totals) and the ten sector level.
Table 8.Table 8.Table 8.Table 8.3333 –––– Regional Analysis of Fuel Price Regional Analysis of Fuel Price Regional Analysis of Fuel Price Regional Analysis of Fuel Price
Existing forecastsExisting forecastsExisting forecastsExisting forecasts No No No No increase in fuel priceincrease in fuel priceincrease in fuel priceincrease in fuel price Change over existing Change over existing Change over existing Change over existing
forecastsforecastsforecastsforecasts
AM 608,400 622,200 13,800 (2%)
IP 596,000 617,900 22,000 (4%)
PM 660,700 719,500 58,800 (9%)
Daily 7,078,100 7,467,600 389,500 (6%)
Table 8.Table 8.Table 8.Table 8.3333 shows that at a regional level, the lower fuel price increases the overall number of trips in the
Auckland region by 6% at a daily level. The PM peak experiences the greater increase in trips, this may be due
to more trips occurring in the PM peak than in the other two peaks, and also the fact that more long distance
trips occur in the PM peak.
Further analysis has been undertaken at the sector level (discussed in Section 6.5Section 6.5Section 6.5Section 6.5), this is shown in Table 8.Table 8.Table 8.Table 8.4444,
concentrating on movements to and from Sectors 5, 7 and 8, Avondale, Herne Bay/Mt Eden and

Waterview ConnectionWaterview ConnectionWaterview ConnectionWaterview Connection
Status Final Page 84 July 2010
Document Reference No 20.1.11-R-C-903 G.25 Traffic Modelling Report
Hillsborough/Mt Roskill, (thought to be those most representative of the study area), with full sector to sector
results shown in Appendix Appendix Appendix Appendix JJJJ....

Waterview ConnectionWaterview ConnectionWaterview ConnectionWaterview Connection
Status Final Page 85 July 2010
Document Reference No 20.1.11-R-C-903 G.25 Traffic Modelling Report
Table 8.4 Table 8.4 Table 8.4 Table 8.4 –––– Sector Analysis of Fuel Price (total trips f Sector Analysis of Fuel Price (total trips f Sector Analysis of Fuel Price (total trips f Sector Analysis of Fuel Price (total trips for Sectors 5, 7 and 8)or Sectors 5, 7 and 8)or Sectors 5, 7 and 8)or Sectors 5, 7 and 8)
Existing forecastsExisting forecastsExisting forecastsExisting forecasts No No No No increase in fuel priceincrease in fuel priceincrease in fuel priceincrease in fuel price Change over existing Change over existing Change over existing Change over existing
forecastsforecastsforecastsforecasts
AM 223,300 230,000 6,700 (3%)
IP 215,000 224,400 9,400 (4%)
PM 224,900 249,800 24,900 (11%)
Daily 2,505,300 2,674,700 169,400 (7%)
Table 8.4Table 8.4Table 8.4Table 8.4 shows the following:
• The effects of fuel price appear to be similar in the study area to those observed in Table 8.Table 8.Table 8.Table 8.3333 at the
regional level;
• There is a 7% increase in trips to/from the study area with a lower fuel price – this would mean the SH20
Waterview Connection would be forecast to carry 88,000 vehicles per day –within its capacity; and
• It is expected that the impact of fuel price is seen to have a greater effect on long distance trips which may
be trips travelling through the study area on the completed Waterview Connection rather than internal
trips.
8.2 Regional Network Assumptions
Two major infrastructure schemes are planned for the Auckland Region which may have an effect on the
Waterview Connection and SH16, these being the proposed additional Waitemata Harbour Crossing and the
Auckland CBD rail loop. Although these projects are thought to be outside of the 2026 time line for the
majority of analysis undertaken for the WRR project, it is considered important nevertheless to understand
their impact. The ART3 model has been run both with and without the additional Waitemata Harbour Crossing
and CBD rail loop (these tests have been undertaken independently from each other), for the year 2041. The
results of these tests are presented in the following sections.
8.2.1 Additional Waitemata Harbour Crossing
In 2008, a joint project between Auckland City Council, the ARC, ARTA, North Shore City Council and NZTA
identified a preferred option for an additional transport link across the Waitemata Harbour between Auckland
CBD and the North Shore. The benefits of the project have been identified as10:
10 Taken from www.nzta.govt.nz

Waterview ConnectionWaterview ConnectionWaterview ConnectionWaterview Connection
Status Final Page 86 July 2010
Document Reference No 20.1.11-R-C-903 G.25 Traffic Modelling Report
• A connected and cohesive transport system to support economic growth in the region;
• More opportunities for walking, cycling and passenger transport;
• Improved access and more reliable travel times across the harbour linking the North Shore to Auckland
CBD and beyond;
• Ease congestion on the Auckland Harbour Bridge; and
• Increased resilience of the state highway network.
The recommended option comprises four tunnels, two for road and two for rail, catering for separate north
and southbound travel located to the east of the Auckland Harbour Bridge. CMJ would link to the northern
motorway; while the suburban rail network could in future be extended northward form the Auckland central
business district to the North Shore.
Although, as discussed previously, this project is thought to be outside of the 2026 time line of the main
assessment contained in this report, it is important to understand the projects impact on the Waterview
Connection. The ART3 model was run for the year 2041, with and without the additional Harbour Crossing (all
other assumptions remained the same).
TableTableTableTable 8.8.8.8.5555 shows the difference in flow for the AM peak period for a selection of links without and with the
additional Harbour Crossing. Plots showing actual flows can be seen in Appendix Appendix Appendix Appendix KKKK. In Table 8.Table 8.Table 8.Table 8.5555, AHC stands
for Additional Harbour Crossing.
Table 8.Table 8.Table 8.Table 8.5555 –––– 2041 Peak period (2 hour) flows, with and without the Additional Harbour Crossing 2041 Peak period (2 hour) flows, with and without the Additional Harbour Crossing 2041 Peak period (2 hour) flows, with and without the Additional Harbour Crossing 2041 Peak period (2 hour) flows, with and without the Additional Harbour Crossing
AMAMAMAM InterInterInterInter----peakpeakpeakpeak PMPMPMPM
LocationLocationLocationLocation DirDirDirDir No
AHC
With
AHC
Change No
AHC
With
AHC
Change No
AHC
With
AHC Change
E/B 13,900 13,600
-300 (-
2%) 11,900 11,900 0 (0%) 9,600 9,600 0 (0%)
SH16
Rosebank
Road to
Great North
Road W/B
9,500 9,500 0 (0%) 10,700 10,600
-100 (-
1%) 12,500 12,400
-100 (-
1%)
E/B 12,800 12,200
-600 (-
5%) 11,000 10,900
-100 (-
1%) 8,000 8,200 200 (3%)
SH16 Great
North Road
to St Lukes W/B
7,300 7,800 500 (7%) 10,200 10,100
-100 (-
1%) 11,400 11,300
-100 (-
1%)
SH20
Waterview N/B
6,200 6,100 -100 (-
6,200 6,100 -100 (- 6,000 6,000 0 (0%)

Waterview ConnectionWaterview ConnectionWaterview ConnectionWaterview Connection
Status Final Page 87 July 2010
Document Reference No 20.1.11-R-C-903 G.25 Traffic Modelling Report
2%) 2%)
Connection
S/B 4,900 5,000 100 (2%) 6,000 6,000 0 (0%) 4,700 4,800 100 (2%)
Table 8.5Table 8.5Table 8.5Table 8.5 shows that the Additional Harbour Crossing is not expected to have a noticeable effect on the
Waterview Connection, as the increase in flows as a result of the project is expected to be below 8% in all three
peaks – for the majority of links in the above table it is expected to be an increase of 3% or less. In a number
of cases shown in the above table there will actually be a reduction in flows on the Waterview Connection as a
result of the Additional Harbour Crossing although these are expected to be minor (less than 5%).
This analysis does not mean that some traffic using the Auckland Harbour Bridge does not also use SH20, as
shown in Figure 8.1Figure 8.1Figure 8.1Figure 8.1.

Waterview ConnectionWaterview ConnectionWaterview ConnectionWaterview Connection
Status Final Page 88 July 2010
Document Reference No 20.1.11-R-C-903 G.25 Traffic Modelling Report
FiguFiguFiguFigure re re re 8888.1 .1 .1 .1 –––– 2026 AM Peak users of Auckland Harbour Bridge2026 AM Peak users of Auckland Harbour Bridge2026 AM Peak users of Auckland Harbour Bridge2026 AM Peak users of Auckland Harbour Bridge
Figure 8.1Figure 8.1Figure 8.1Figure 8.1 shows that of the forecast 26,000 users of Auckland Harbour Bridge in the (2-hour) AM peak in
2026, 1,700 (7%) also use the SH20 extension section of the Waterview Connection. In the PM peak, there are
forecast to be 24,000 users of the Harbour Bridge, of which 800 (3%) also use the SH20 extension section of
the Waterview Connection. The vehicles using the Auckland Harbour Bridge and the SH20 extension section of
the Waterview Connection use the east facing ramps of SH20.
It should be noted that this analysis is indicative only. There are still uncertainties surrounding the final form
of the Additional Harbour Crossing and its connections both north and south of the Waitemata Harbour. This

Waterview ConnectionWaterview ConnectionWaterview ConnectionWaterview Connection
Status Final Page 89 July 2010
Document Reference No 20.1.11-R-C-903 G.25 Traffic Modelling Report
comparison was conducted to ensure that the final design of the Waterview Connection (particularly the SH20
extension section) is not compromised by the exclusion of the Additional Harbour Crossing in the analysis of
the Waterview Connection reported in earlier sections of this report and in the Technical Report G.18:
Assessment of Transport Effects.
8.2.2 Auckland CBD Rail Loop
In 2009 a preferred route was identified for Auckland’s proposed CBD Rail Loop tunnel. It is proposed that the
tunnel will run between Mt Eden and the Britomart, taking in Khyber Pass Road, Symonds Street and
Karagahape Road, with the opportunity for three train station locations at Symonds Street/Khyber Pass Road;
Karangahape Road/Pitt Street and on Albert Street between Victoria and Wellesley Streets.
The benefits of the project have been identified as:11
• The CBD loop, made possible by the Government’s decision to electrify Auckland’s rail network, has the
potential to be a transformational project for the region, providing significant economic, social and
environmental benefits, as well as revitalising the CBD and giving Auckland a truly international feel;
• It will provide easy pedestrian access to all the CBD’s commercial, tourist, residential and educational
amenities;
• The proposed tunnel will allow more train movements, by unlocking the capacity constraint of the
Britomart (developing Britomart into a through station);
• The CBD Loop Tunnel will unlock the potential of Auckland’s rapid transit network, making the tunnel as
important to the rail system as the CMJ is to the motorways; and
• The proposed tunnel is regarded is a key element in future transport infrastructure for Auckland by
increasing capacity across the entire rail network, bringing the rail network into the heart of th city and
stimulating economic development by reducing traffic congestion.
Although, as discussed previously, this project is thought to be outside of the 2026 time line of the main
assessment contained in this report, it is important to understand the projects impact on the Waterview
Connection. The ART3 model was run for the year 2041, with and without the CBD Rail Loop (all other
assumptions remained the same).
The below table (Table 8Table 8Table 8Table 8.6.6.6.6) shows the difference in flow for the AM peak period for a selection of links without
and with the CBD Rail Loop. Plots showing the actual flows can be seen in Appendix Appendix Appendix Appendix LLLL.
11 www.arta.co.nz

Waterview ConnectionWaterview ConnectionWaterview ConnectionWaterview Connection
Status Final Page 90 July 2010
Document Reference No 20.1.11-R-C-903 G.25 Traffic Modelling Report
Table 8.Table 8.Table 8.Table 8.6666 –––– 2041 Peak period (2 hour) flows, with and without the CBD Rail Loop 2041 Peak period (2 hour) flows, with and without the CBD Rail Loop 2041 Peak period (2 hour) flows, with and without the CBD Rail Loop 2041 Peak period (2 hour) flows, with and without the CBD Rail Loop
AMAMAMAM InterInterInterInter----peakpeakpeakpeak PMPMPMPM
LocationLocationLocationLocation DirDirDirDir No No No No
CBD CBD CBD CBD
Rail Rail Rail Rail
LoopLoopLoopLoop
With With With With
CBD CBD CBD CBD
Rail Rail Rail Rail
LoopLoopLoopLoop
ChaChaChaChangengengenge No No No No
CBD CBD CBD CBD
Rail Rail Rail Rail
LoopLoopLoopLoop
With With With With
CBD CBD CBD CBD
Rail Rail Rail Rail
LoopLoopLoopLoop
ChangeChangeChangeChange No No No No
CBD CBD CBD CBD
Rail Rail Rail Rail
LoopLoopLoopLoop
With With With With
CBD CBD CBD CBD
Rail Rail Rail Rail
LoopLoopLoopLoop
ChangeChangeChangeChange
E/B 13,700 13,900 200 (1%) 12,000 11,900
-100 (-
1%) 9,600 9,600 0 (0%)
SH16
Rosebank
Road to
Great North
Road W/B
9,500 9,500 0 (0%) 10,900 10,700
-200 (-
2%) 12,700 12,500
-200 (-
2%)
E/B 12,500 12,800 300 (2%) 11,000 11,000 0 (0%) 8,100 8,000
-100 (-
1%) SH16 Great
North Road
to St Lukes W/B
7,300 7,300 0 (0%) 10,400 10,200
-200 (-
2%) 11,400 11,400 0 (0%)
N/B 6,200 6,200 0 (0%) 6,100 6,200 100 (2%) 6,100 6,000
-100 (-
2%) SH20
Waterview
Connection S/B
5,000 4,900
-100 (-
2%) 6,100 6,000
-100 (-
2%) 4,800 4,700
-100 (-
2%)
It is expected that the addition of the CBD rail loop would, if anything, result in slight reductions in flow on the
Waterview Connection as a result of a mode shift to public transport. Table 8.Table 8.Table 8.Table 8.6666 shows that the CBD Rail Loop
does not appear to have a noticeable effect on the traffic forecast on the Waterview Connection. In most cases,
as may be expected, it is demonstrated that there will actually be a slight reduction in flows in all three peaks,
although, again this is negligible.
It should be noted that this analysis is indicative only. There are still uncertainties surrounding the final form
and connectivity of the CBD rail loop. This comparison was conducted to ensure that the final design of the
Waterview Connection is not compromised by the exclusion of the CBD Rail Loop in the analysis of the
Waterview Connection reported in earlier sections of this report and in the Technical Report G.18 Assessment
of Transport Effects.

Waterview ConnectionWaterview ConnectionWaterview ConnectionWaterview Connection
Status Final Page 91 July 2010
Document Reference No 20.1.11-R-C-903 G.25 Traffic Modelling Report
9. Summary
In 2009 the NZ Transport Agency confirmed its intention that the ‘Waterview Connection Project’ would be
lodged with the Environmental Protection Authority as a Project of National Significance. The Project includes
works previously investigated and developed as two separate projects: being the SH16 Causeway Project and
the SH20 Waterview Connection. The key elements of the Waterview Connection Project are:
• Completing the Western Ring Route (which extends from Manukau to Albany via Waitakere);
• Improving resilience of the SH16 causeway between the Great North Road and Rosebank Interchanges to
correct historic subsidence and “future proof” it against sea level rise;
• Providing increased capacity on the SH16 corridor (between the St Lukes and Te Atatu Interchanges);
• Providing a new section of SH20 (through a combination of surface and tunnelled road) between the Great
North Road and Maioro Street Interchanges; and
• Providing a pedestrian / cycle way throughout the surface road elements of the Waterview Connection
Project corridor.
This report details the future year traffic modelling that has been undertaken in both the project assignment
model and the operational traffic model developed for the assessment of the Waterview Connection Project.
These models form part of a hierarchy of models used for the project, comprising the Auckland Regional
Council’s multi-modal strategic demand model, a detailed project assignment model, and localised operational
models for the more detailed consideration of design and operational issues.
This report is a technical reference describing the inputs and outputs of the traffic modelling undertaken. The
detailed assessment of effects on the transport system is based on these modelling results but is reported
separately.
This report provides an overview of the modelling process and extensive model outputs. Key outcomes of the
modelling include the following forecasts (the interpretation and explanation of these results is contained in
the Technical Report G.18: Assessment of Transport Effects.):
• With the project in place, traffic on SH16 (Westgate to Newton Road) is forecast to increase by up to 26% in
2026 compared to the situation if the Waterview Connection is not completed;
• In 2026, the SH20 extension section (Maioro Street to Great North Road) of the Waterview Connection is
forecast to carry around 83,000 vehicles per day;
• The vehicle kilometres travelled (VKT) on local and arterial roads is forecast to decrease by 2% across the
Greater Auckland Region and up to 6% in the study area with the completion of the project. There is a
predicted corresponding increase in VKT on the motorways (up to 6% across the Greater Auckland Region

Waterview ConnectionWaterview ConnectionWaterview ConnectionWaterview Connection
Status Final Page 92 July 2010
Document Reference No 20.1.11-R-C-903 G.25 Traffic Modelling Report
and up to 32% in the study area) as a result of the completion of the Waterview Connection (compared to a
no project scenario);
• Similarly the amount of heavy vehicle traffic on local and arterial roads is expected to decrease by 5-8%;
• There is a projected decrease in flow on many of the arterial roads around the project. Travel times on
district and regional arterial roads are either lower or largely unchanged as a result of completing the
Waterview Connection; and
• With the extra traffic attracted to the Waterview Connection, there are some localised movements or
locations with a predicted increase in delay, however, in general, travel conditions on SH16 are expected to
be improved over current conditions, even with the significant increase in traffic that the scheme is
forecast to accommodate.
