fy2017 1st half results summary and progress of …© 2017 nippon steel & sumikin bussan...
TRANSCRIPT

© 2017 NIPPON STEEL & SUMIKIN BUSSAN CORPORATION All Rights Reserved.
FY2017 1st Half Results Summary and
Progress of Mid-term Business Plan
1
Nov. 20, 2017
President Kenji Hiwatari

© 2017 NIPPON STEEL & SUMIKIN BUSSAN CORPORATION All Rights Reserved.
Agenda
2
1. FY2017 1st Half Results & FY2017 Forecast
2. Partial Acquisition of the Steel Products
Business of the Mitsui & Co. Group, and
Strengthening the Capital Relationship
with Mitsui
3. Progress of Mid-term Business Plan 2017
4. Appendix

© 2017 NIPPON STEEL & SUMIKIN BUSSAN CORPORATION All Rights Reserved.
1. FY2017 1st Half Results &
FY2017 Forecast
3

© 2017 NIPPON STEEL & SUMIKIN BUSSAN CORPORATION All Rights Reserved.
Highlight: FY2017 1H Results
4
991.7 862.6
991.1
939.1 978.7
FY15 FY16 FY17
1,058.9
15.4 13.6 17.1
13.6 17.3
16.9
29.0 30.9
34.0
FY15 FY16 FY17
2nd half
(e)
1st half
2,050.0
9.8 8.7 11.3
7.4 9.4
8.7
17.3 18.2
20.0
FY15 FY16 FY17
Recorded Highest Profit after Merger in 1st half
Revised Full Year Ordinary Profit Forecast from ¥33.0 billion to ¥34.0 billion
Sales Ordinary Profit ¥ billion
* Profit attributable to owners of parent
Net Income* ¥ billion ¥ billion
1,930.8 1,841.3
2nd half
(e)
1st half
2nd half
(e)
1st half

© 2017 NIPPON STEEL & SUMIKIN BUSSAN CORPORATION All Rights Reserved.
86.2 83.1
77.9
71.8 69.8 70.9
73.3
82.3 85.6 84.8
Trends by Quarter
5
Strong Rise in Steel Price Boosted Profits
8.8
6.5 6.2 7.4 7.2
6.3
7.7
9.5 9.5
7.5
486.0 505.6
470.8 468.2
418.5
444.1 454.4
524.2
483.0 508.1
1Q/FY15 2Q 3Q 4Q 1Q/FY16 2Q 3Q 4Q 1Q/FY17 2Q
FY15 29.0 FY16 30.9 FY17 (e) 34.0
85.2
2H/FY17
70.4 1H/FY16
+14.8
Sales
(¥ billion)
Ordinary Profit(¥ billion)
ASP of Steel (¥ thousands per ton)

© 2017 NIPPON STEEL & SUMIKIN BUSSAN CORPORATION All Rights Reserved.
Ordinary Profit Variance Analysis [1H/FY16 vs. 1H/FY17]
6
13.6 17.1
4.5
0.9 -1.4 -0.5
1H/FY16 1H/FY17
Significant Profit Increase in Steel Covered Declines in Textiles and Foodstuffs.
¥3.5 billion
Price / Volume
1.5
Gr. Companies
3.0
Mix -0.2
Equity methods
1.1
Sales / Cost -1.0
Gr. Companies
-0.4
Margin -0.5
¥ billion 8.0 → 12.6 1.2 → 2.2 2.4 → 0.9 1.7 → 1.2 1H/FY16 1H/FY17
FOREX 107¥/$ →111¥/$
Steel I & I Textiles Foodstuffs
*I & I: Industrial Supply & Infrastructure

© 2017 NIPPON STEEL & SUMIKIN BUSSAN CORPORATION All Rights Reserved.
Steel demand was firm both in Japan and other
Asian countries.
OP improved by ¥4.5 billion because of sales
prices hike and improvement in group
companies.
Sales increased due to non-ferrous market rise.
OP improved by ¥0.9 billion due to temporary
profit from the equity methods company in
Thailand.
Severe business environment continued in apparel
customers.
OP decreased by ¥1.4 billion due to the
disappearance of the cost reduction effect
generated by the strong yen during FY16 and a
deterioration in earnings among group companies.
Prices of imported meat in Japan remained steady
overall.
OP decreased by ¥0.5 billion because of lower
profit margins for broilers.
Segment Results
7
8.0 12.6
1H/FY16 1H/FY17
670.2 803.4
1.2 2.2
1H/FY16 1H/FY17
41.7 44.4
2.4 0.9
1H/FY16 1H/FY17
76.8 72.7
1.7 1.2
72.9 69.6
1H/FY16 1H/FY17
Steel
Industrial
Supply &
Infrastructure
Textiles
Foodstuffs
Sales (¥ billion)
Ordinary
Profit (¥ billion)
Sales (¥ billion)
Ordinary
Profit (¥ billion)
Sales (¥ billion)
Ordinary
Profit (¥ billion)
Sales (¥ billion)
Ordinary
Profit (¥ billion)
© 2017 NIPPON STEEL & SUMIKIN BUSSAN CORPORATION All Rights Reserved.
Ordinary Profit
Breakdown
(1H/FY17)
Change in OP 4.5 0.9 -1.4 -0.5
Change in Group
Earnings 3.0
(Overseas companies: 2.4) 1.1 -0.4 0.0
Main Factor for
the Change
○ Sales / Costs
○ Market
○ Stable operations
○ Profit on negative
goodwill by Rojana
Industrial Park
× Margin
× Forex
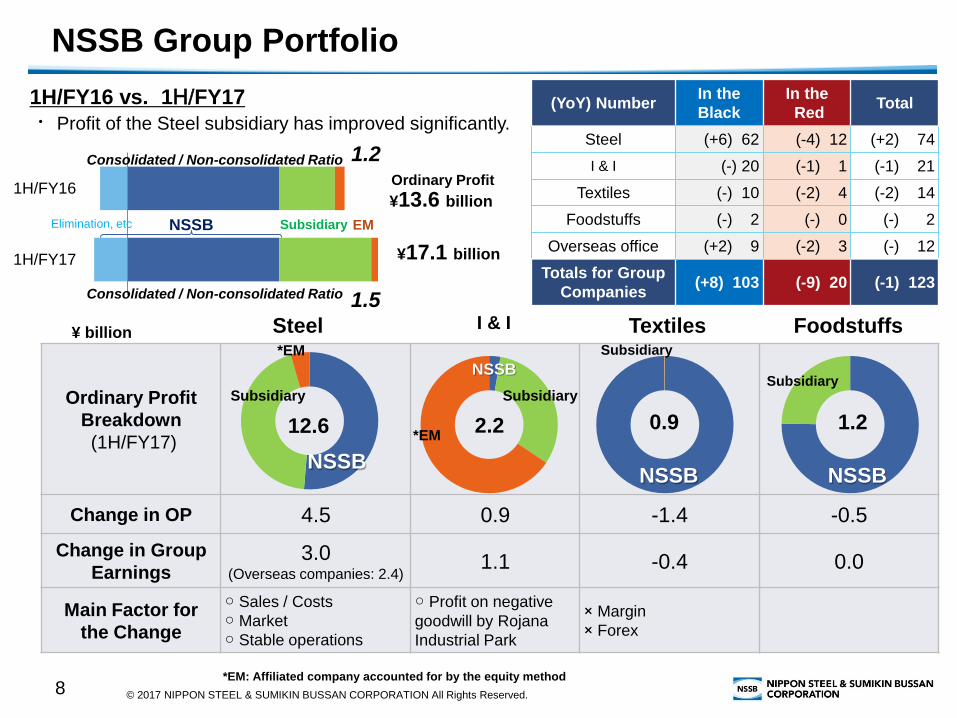
NSSB Group Portfolio
8
1H/FY16 vs. 1H/FY17
・Profit of the Steel subsidiary has improved significantly.
(YoY) Number In the
Black
In the
Red Total
Steel (+6) 62 (-4) 12 (+2) 74
I & I (-) 20 (-1) 1 (-1) 21
Textiles (-) 10 (-2) 4 (-2) 14
Foodstuffs (-) 2 (-) 0 (-) 2
Overseas office (+2) 9 (-2) 3 (-) 12
Totals for Group
Companies (+8) 103 (-9) 20 (-1) 123
NSSB
*EM
NSSB NSSB
Subsidiary
12.6 2.2 0.9 1.2
1H/FY17
1H/FY16
NSSB
¥13.6 billion
Ordinary Profit
1.5
1.2
EM Subsidiary Elimination, etc
¥17.1 billion
Consolidated / Non-consolidated Ratio
Consolidated / Non-consolidated Ratio
*EM: Affiliated company accounted for by the equity method
Steel I & I Textiles Foodstuffs ¥ billion
*EM
Subsidiary
NSSB
Subsidiary
Subsidiary

© 2017 NIPPON STEEL & SUMIKIN BUSSAN CORPORATION All Rights Reserved.
Balance Sheets
9
Total equity 206.1
Total equity 216.8
Debt 196.1
Debt 232.1
Other liabilities
270.7
Other liabilities
293.0
Fixed assets 135.6
Fixed assets 141.3
Inventories 91.6
Inventories 108.9
Other current assets 445.7
Other current assets 491.8
Total assets 673.0
Total assets 742.1
Total Consolidated Assets Increased in Trade Notes and Accounts
Receivable from Increased Sales and a Holiday Falling on the Term-end
Mar.
2017
Sep.
2017
Equity Ratio
28.2%
<28.1%>
27.0%
Net - DER 0.91 <0.98>
1.06
*69.0 ¥ billion
166.7 173.5 189.9
200.5
11.2%
10.2% 10.0%
Mar-15 Mar-16 Mar-17 Sep-17
ROE
< >: After excluding the effect of a holiday
falling on the term-end
(*Including ¥29.3 billion with a Holiday Falling on the Term-end )
Mar. 31, 2017 Sep. 30, 2017
¥ billion
Eq
uit
y

© 2017 NIPPON STEEL & SUMIKIN BUSSAN CORPORATION All Rights Reserved.
Cash Flow
10
¥ billion 1H/FY16 1H/FY17
Operating CFs 8.9 (31.1) Increased accounts receivable
Investment CFs (1.7) (2.6) CAPEX & Investments ¥2.9 billion
Free CF 7.2 (33.7)
Net increase
(decrease) of debts (2.1) 36.2
Cash dividends (2.8) (3.7)
Others (2.4) (0.7)
Changes in cash & cash
equivalents 0.2 2.0
CAPEX 2.4, Investment 0.4

© 2017 NIPPON STEEL & SUMIKIN BUSSAN CORPORATION All Rights Reserved.
Guidance for FY2017
11
¥ billion FY16 FY17 (e) Change
17–16
Change
Previous
Forecast 2H 1H 2H (e)
Sales 978.7 1,841.3 991.1 1,058.9 2,050 208.7 50
Steel 11.5 19.6 12.6 11.9 <22.0> 24.5 4.8 2.5
I & I 1.0 2.2 2.2 0.8 < 2.2> 3.0 0.7 0.8
Textiles 3.0 5.4 0.9 2.9 < 5.4> 3.8 -1.6 -1.6
Foodstuffs 1.6 3.3 1.2 1.5 < 3.4> 2.7 -0.7 -0.7
Ordinary Profit 17.3 30.9 17.1 16.9 <33.0> 34.0 3.1 1.0
Net Profit 9.4 18.2 11.3 8.7 <19.5> 20.0 1.8 0.5
EPS (¥) 305.73 589.96 365.97 281.04 647.01 57.05 16.19
Dividend (¥) 105 *180 90 90 <180> 180 - -
Pay out Ratio 30.5% 27.8%
Raised Full Year Forecast: Ordinary Profit ¥34.0 billion, Net Profit ¥20.0 billion
<2,000>
<Previous Forecast >
<630.82>
<28.5%>
Policy of cash
dividend
NSSB’s most important management goal is to improve profit returns to our shareholders.
Our basic dividend policy is to realize dividends that are in line with business results while
balancing profit trends and financial conditions.
Targeting payout ratio in this mid-term business plan is 25%–30%.
*Based on after share consolidation

© 2017 NIPPON STEEL & SUMIKIN BUSSAN CORPORATION All Rights Reserved.
2. Partial Acquisition of the Steel Products Business of
the Mitsui & Co. Group, and Strengthening the
Capital Relationship with Mitsui
12

© 2017 NIPPON STEEL & SUMIKIN BUSSAN CORPORATION All Rights Reserved.
Reorganization of Steel Industry in Japan
13
Consolidation of Blast Furnace Companies
Nippon
Sumitomo
Kobe
Nisshin
NKK
Kawasaki
2002 Alliance
JFE HD
2002 Merger
2012 Merger
2017 Subsidiaries
acquisition
48.8 million tons
30.4 million tons
7.2 million tons
*FY2016 Consolidated
Crude Steel Production
*Including Nisshin
NSSMC
Steel Trading Company Reorganization also Activated
Nippon Steel Trading
Sumikin Bussan
Kawasho
NKK Trading
Mitsubishi Corp. Gr
Sojitz Gr
Itochu Gr
Marubeni Gr
Sumitomo Corp. Gr
JFE Shoji
2004 Merger
Mitsui & Co. Gr
NSSB
2013 Merger
Metal One
Marubeni Itochu Steel
Marubeni Itochu Sumisho TS
MM & KENZAI
2014 Integrating construction
materials & raw materials business
¥1,841 billion
*FY2016
Consolidated Sales
¥1,671 billion
¥1,855 billion
¥1,797 billion
*Source: Web **Sumitomo Corp / Metal one; Considering integration of domestic steel pipe business
Marubeni Itochu TS
*Non-Consolidated
2003 Integrating steel business
2001 Integrating steel business
2016 Integrating construction
materials business
**
**

© 2017 NIPPON STEEL & SUMIKIN BUSSAN CORPORATION All Rights Reserved.
Purpose of the Transaction
14
Mitsui & Co. Group NSSB
Promoting the Growth and Development of
the Steel Business as the Core Trading
Company of the NSSMC Group
Strengthening its Profit Base through a
Business Reorganization for Further
Growth
Both Companies Could Benefit from a Partnership
Acquiring Part of the Mitsui Group's Steel Business.
Strengthen Capital Relationship and Deepen Collaborative
Relationship between Both Companies
Aiming to provide better services to our customers by using our comprehensive power and the value chains.
Expanding our steel businesses and increasing our competitive power by utilizing the combined strength
and synergy.
Aiming to be the most suitable partners for one another, capable of planning and proposing total solutions
that meet the global needs of customers all over the world.
Further Improvement in Customer Satisfaction
Improvement and Enhancement of Competitiveness
Acceleration of Global Strategies
© 2017 NIPPON STEEL & SUMIKIN BUSSAN CORPORATION All Rights Reserved.
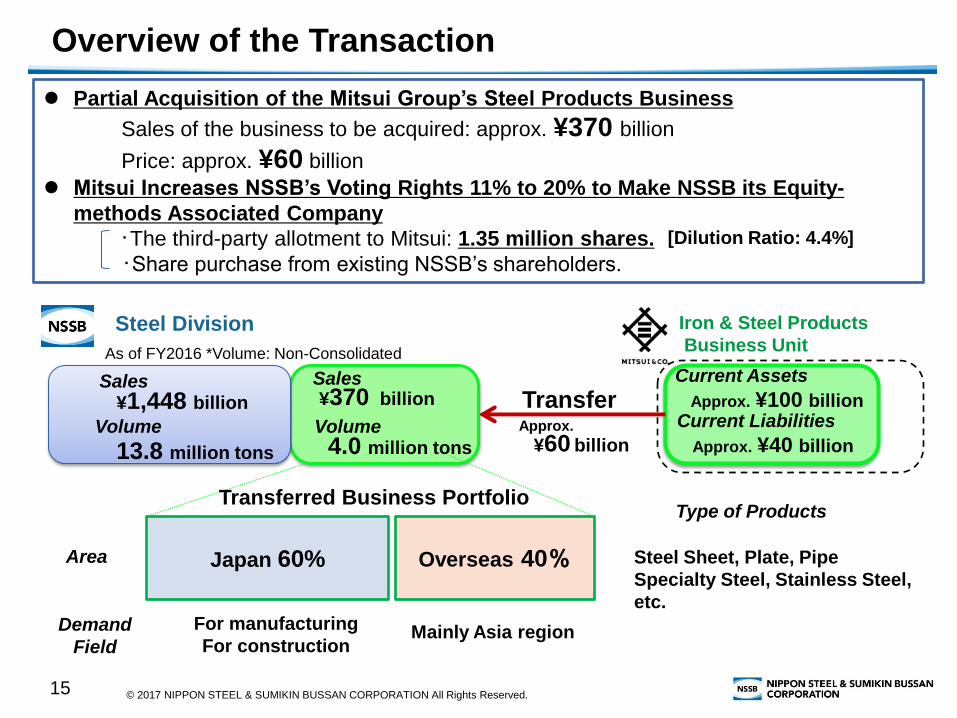
Overview of the Transaction
15
Partial Acquisition of the Mitsui Group’s Steel Products Business
Sales of the business to be acquired: approx. ¥370 billion
Price: approx. ¥60 billion
Mitsui Increases NSSB’s Voting Rights 11% to 20% to Make NSSB its Equity-
methods Associated Company
・The third-party allotment to Mitsui: 1.35 million shares.
・Share purchase from existing NSSB’s shareholders.
Iron & Steel Products
Business Unit Steel Division
Current Assets
Approx. ¥100 billion
Japan 60% Overseas 40%
Mainly Asia region For manufacturing
For construction
Steel Sheet, Plate, Pipe
Specialty Steel, Stainless Steel,
etc.
¥1,448 billion
4.0 million tons
Transfer
As of FY2016 *Volume: Non-Consolidated
¥60 billion
Sales
Volume
13.8 million tons
Sales ¥370 billion
Volume Approx. Current Liabilities
Approx. ¥40 billion
[Dilution Ratio: 4.4%]
Transferred Business Portfolio
Area
Demand
Field
Type of Products

© 2017 NIPPON STEEL & SUMIKIN BUSSAN CORPORATION All Rights Reserved.
Creating the Best Steel Trading Company
16
1,448
1,855 1,797 1,671
921
NSSB
+ MITSUI Metal One Marubeni Itochu
Steel JFE Shoji *1
Approx. 1,820
Sales of Major Steel Trading Companies in Japan [FY2016]
Approx. 370
Hanwa *2
*2 Steel Div.
+Metals & Alloys Div.
*1 Including
Non-Steel Div. Transferred
Business
¥ billion

© 2017 NIPPON STEEL & SUMIKIN BUSSAN CORPORATION All Rights Reserved.
FY15
Pursuing functions in global
distribution. [Steel service centers, logistics
networks, processing, etc.]
Utilizing excellent customer
base of Mitsui. [Customers in auto, energy field, etc.]
Expanding our steel businesses
by utilizing their combined
strengths.
Enhancing competitiveness of
group companies by improving
efficiency. FY16 FY17
(e)
+ Synergies
Expected Synergies
(cf.)Net profit of Mitsui’s Iron & Steel Products Business Unit [FY2016]: ¥6.9 billion
34.0 36.0
Profit from Synergies
MTBP
2017
17
29.0 30.9 34.0
Profit from Transferred Business
¥ billion
Ordinary Profit
of NSSB
Maximizing Corporate Value

© 2017 NIPPON STEEL & SUMIKIN BUSSAN CORPORATION All Rights Reserved.
The Effect of Integration will raise EPS
18
4,000
4,500
5,000
5,500
6,000
6,500Mar.1 Apr.1 May.1 Jun.1 Jul.1 Aug.1 Sep.1 Oct.1 Nov.1
Avg. 1month ¥6,006
Avg. 3 months:¥5,757
Avg. 6 months:¥5,314
22-Mar [“Commencement of
Discussions”] ¥4,735
-2.82%
4.33%
13.02%
26.84%
Premium
¥
Change in Stock Price of NSSB on TSE
647
FY2017 (e) The third-party
allotment
NSSB’s EPS
¥
28-Sep. ¥6,180
[Dilution ratio; 4.4%]
Profit from
Synergies Profit from
Transferred
Business

© 2017 NIPPON STEEL & SUMIKIN BUSSAN CORPORATION All Rights Reserved.
Roadmap
19
Mar. 22, 2017 • Commencement of discussion
Sep. 29, 2017 • Conclusion of the agreement
Oct. 2017- • Preparation for business transfer
• Filling with regulatory authorities in relevant
countries
( After Obtaining Approvals )
Apr. 1, 2018 (Planned) • Effective date of the business transfer
Apr. 2, 2018 (Planned) • Effective date of the third-party allotment
May 2018 (Planned) • FY2017 earnings announcement
• New Mid-term Business Plan announcement

© 2017 NIPPON STEEL & SUMIKIN BUSSAN CORPORATION All Rights Reserved.
3. Progress of Mid-term Business Plan
2017
20

© 2017 NIPPON STEEL & SUMIKIN BUSSAN CORPORATION All Rights Reserved.
Progress of Post-Merger Integration [2013-2015]
FY2013 2014 2015
Strategy
Corporate
Governance
Offices,
Group Co.,
System
Personnel
System
Ordinary
Profit ¥27.3 billion ¥30.5 billion ¥29.0 billion
Synergy
Effect Base ¥1.3 billion ¥1.7 billion
21
Commencement of discussion 13/2
Conclusion of the agreement 13/4
Merger 13/10
*NS+SB
13/10
Develop “Emergency
Communication System” 13/11
Release “Corporate Philosophy
and Management Principles” 13/10
Release “MDTP 2017” 15/5
Shareholders meetings 13/6 Investors meeting for
analysts and institutional
investors
15/5~
Integrate head office 14/3
Integrate branch offices and
group companies
13/10~
14/7 Merge unions 13/12 Integration for mgt-level
workers 15/7
14/7
Release “HR & Payroll
System” 15/7
Release “Compliance Manual”
Integration for non-mgt
workers
Release “Employee Code of
Conduct”

© 2017 NIPPON STEEL & SUMIKIN BUSSAN CORPORATION All Rights Reserved.
Progress of Post-Merger Integration [2016-2018]
FY2016 2017 2018
Strategy
Corporate
Governance
Offices,
Group Co.,
System
Personnel
System
Ordinary
Profit ¥30.9 billion ¥34.0 billion
Synergy
Effect ¥2.4 billion ¥3.0 billion
[Create Synergies from Alliance
with Mitsui]
22
• Strengthen board
decision making
• N & C committee
16/6
17/1~ Build internal control system based
on autonomous internal controls
Release “New MTBP” 18/5
(P)
Release “Partial Acquisition of
Mitsui’s Steel Business,” etc. 17/9
Effective date of the Business
transfer from Mitsui 18/4
(P)
17/12 (Planned)
(NSSB) Complete
documentation (Subsidiary) Complete
documentation
16/4 Integrated enterprise system
18/3
(P) New integrated data centers
17/7 Promote work style reforms
17/4 Integrated retirement and
pension system
18/4
(P) Transfer Mitsui’s employees
17/12
(P) Move Osaka office
forecast
Conduct “Corporate Governance Code”
Acquire Credit Rating(A) 17/10
19/3 (P)
forecast

© 2017 NIPPON STEEL & SUMIKIN BUSSAN CORPORATION All Rights Reserved.
Reinforcement of the Group Management Infrastructure
23
Prioritizing Businesses
Number of
companies
Oct.
2013
Sep.
2017 Change
Subsidiary 94 94 0
EM 33 29 -4
Consolidated 127 123 -4
Non-Consolidated 56 45 -11
Total 183 168 -15
Improving Profitability
1st half / FY2013 [NS+SB]
(before elimination) Ordinary Profit from Group Companies
¥5.0 billion
Enforcing Group Management System
Withdraw policy, communication system, monitoring system
Number of
companies Total Japan Over
sea
Integration,
Liquidation,
etc. -29 -12 -17
Acquirement,
Establishment,
Etc. 14 6 8
Total -15 -6 -9
¥8.6 billion
1st half / FY2017

© 2017 NIPPON STEEL & SUMIKIN BUSSAN CORPORATION All Rights Reserved.
Progress in Financial Targets
24
30.5 29.0 30.9 36.0 34.0
2,104.6 1,930.8 1,841.3
2,050 2,300
FY14 FY15 FY16 FY17e
108 121 109 110 120 FOREX ¥/$
Ordinary
Profit (¥ billion)
Sales (¥ billion)
FY17MTP
17.4 17.3 18.2 21.0 20.0
11.2% 10.2% 10.0%
FY14 FY15 FY16 FY17e
Net
Income (¥ billion)
ROE
FY17MTP
166.7 173.5 189.9
24.1% 26.3%
28.2% 27.0%
FY14 FY15 FY16 FY17 Sep.
Equity (¥ billion)
Equity Ratio
FY17MTP
25–30%
12.0 15.0
18.0 18.0
21.3%
26.8%
30.5% 27.8%
FY14 FY15 FY16 FY17e
Dividend (¥)
Payout Ratio
FY17MTP
1.1 1.1 0.9 1.1 Below 1.0 Net D/E
Over
10%
Over
200
25−30%
Achieved Target
553.3 503.1 480.5 680.0
Overseas
Sales
(¥ billion)
*Based on after share consolidation
200.5

© 2017 NIPPON STEEL & SUMIKIN BUSSAN CORPORATION All Rights Reserved.
Acquisition of Credit Rating
25
NSSB acquired an Issuer Rating from Rating and Investment Information, Inc.
(R&I) and Japan Credit Rating Agency, Ltd. (JCR).
Issuer Rating Rating Outlook CP
R&I A Stable a-1
JCR A Stable J-1
90.2 98.1 104.9 111.7 127.2
143.1 166.7 173.5
189.9 200.5
28.2
16.3
24.4 23.6 26.5 27.3
30.5 29.0 30.9
34.0
FY08 09 10 11 12 13 14 15 16 17
Oct.2013
Merger
Sep.2017
(e)
Trend of Ordinary Profit / Equity Ordinary Profit
Equity
※ FY08-12; NS+SB
¥ billion

© 2017 NIPPON STEEL & SUMIKIN BUSSAN CORPORATION All Rights Reserved.
13.13 13.42 13.79
15.0
91
80 74
86
FY14 FY15 FY16 FY17e
20.6 18.4 19.6 24.0
12.6
11.9
1,679.6 1,511.1 1,448.4 1,670
FY14 FY15 FY16 FY17e
Steel Business
26
Sales(¥ billion)
Ordinary Profit (¥ billion)
1H/FY17 Performance • Steel demand was firm both in Japan and other
Asian countries.
• OP improved by ¥4.5 billion because of sales
prices hike and improvement in group
companies.
Major Initiatives
Efforts to increase sales
Strengthen response to new demands
Optimization of processing
Capturing construction work demand
Preparation for business transfer from
Mitsui
1,840
FY17
MTP
Sales Volume
(million tons)
Domestic
Export
FY17
MTP
ASP (¥ thousands per ton)
Previous Forecast
<1,600>
<22.0>
13.9
Sales: Profit:
FY17 (e) (YoY)
Sales volume: Includes semi-finished products
ASP: Excludes semi-finished products
• Demand remains strong & stable,
• Supply remains tight.
Business Environment
24.5
Approx.
Approx.
2H/FY17 Forecast 1H
2H

© 2017 NIPPON STEEL & SUMIKIN BUSSAN CORPORATION All Rights Reserved.
Global Network of Steel Div.
27
Mahindra Sanyo
Special Steel
NSSB (Thailand)
SIAM lotus
NSSB Coil Center (Thailand)
[BUSAN BRANCH]
▲ Processing
■ Manufacture
◆ Distributor
Bangkok Eastern Coil Center
(As of Sep. 2017)
TAIWAN *NSSB CO., LTD.
[KAOHSIUNG OFFICE]
MANILA OFFICE
Korea Express SB
Kasco
Takahashi Steel (Thailand)
SB Showa Pipe (Thailand)
Yawata Electrode (Thailand)
Central Motor Wheel (Thailand)
Nichiwa(Thailand)
[HANOI OFFICE]
NSSB* VIETNAM CO., LTD. CSVC
CSGT Metals Vietnam NSSB Saigon Coil Center
NSSB Hanoi Steel Service
NSSB* (M) SDN. BHD.
Associated Steel Industries(M) PCM Steel Processing
NSSB* (SINGAPORE) PTE. LTD. Takahashi Steel(S)
PT. NSSB* INDONESIA
[BANDUNG BRANCH]
PT. IndoJapan Steel Center
PT. IndoJapan Wire Products
NS Resources Australia
YANGON OFFlCE
BEIJING OFFICE
SHANGHAI OFFICE
NSSB* (SHANGHAI) CO., LTD.
[BEIJING BRANCH]
[DALIAN BRANCH]
[QINGDAO BRANCH]
[NANTONG BRANCH]
[SHENZHEN BRANCH]
[GUANGZHOU BRANCH]
NSSB* (HK) CO., LTD.
Takahashi Steel (HK)
Shanghai NSSB* Automotive Parts
Suzhou Nippon Steel Service Center
Dongguan Tetsuwa Metals
Suzhou Nippon Steel Service Center
Dongguan Sumikinbussan Metal Products
Shanghai Yiyou Metal Products
Tianjin Hua Zhu Metal Products
NSSB* INDIA PVT. LTD.
[MUMBAI OFFICE] Neemrana Steel Service Center
DHAKA OFFlCE
Nippon & McDonald Steel Industries
DUBAI OFFlCE
MOSCOW OFFlCE
NSE
NSSB* (EUROPE) S.A.S.
NSSB* AMERICAS,
INC.
Kentucky Steel Center
[PITTSBURGH BRANCH]
[HOUSTON BRANCH]
[CALIFORNIA BRANCH]
NSSB* MEXICO, S.A. DE C.V.
Aguascalientes Steel Coil Center
<CF.>Global Networks of Mitsui (As of Mar. 2017)
Total Sales of Overseas Subsidiaries 1H/FY16 1H/FY17
¥72.5 billion → ¥106.4 billion
* “NSSB”: NIPPON STEEL & SUMIKIN BUSSAN
NSSB* KOREA CO., LTD.
18 69 countries /
regions
offices /
affiliates
65 138 countries /
regions offices /
affiliates

© 2017 NIPPON STEEL & SUMIKIN BUSSAN CORPORATION All Rights Reserved.
1H/FY17 Performance • Sales increased due to non-ferrous market
rise
• OP improved by ¥0.9 billion due to temporary
profit from the equity methods company in
Thailand.
Industrial Supply & Infrastructure Business
28
3.1 3.2 2.2
3.4 2.2
0.8
92.4 93.2 86.3 90.0
100.0
FY14 FY15 FY16 FY17e
20.6 22.2 22.3 28.0
FY14 FY15 FY16 FY17e
FY17
MTP
FY17
MTP
• High-performance Materials Business
Sales (¥ billion)
Ordinary Profit (¥ billion)
Sales of headrest stays
(¥ billion)
Previous Forecast
<2.2>
Sales: Profit:
FY17 (YoY)
Major Initiatives
2H/FY17 Forecast
Capturing growth demand
Responding to multimaterialization
[Steel – Aluminum – Resin – Carbon Fiber]
• Crankshaft Business
Capturing automobile production increase
• Railway-Parts Business
Acquiring parts replacement demand
• Machinery Business
Expansion of labor-saving type of
kitchen machinery
• Headrest Parts Business
Capturing automobile production increase
• Industrial Park Business
Development of the industrial park
business in Mexico
1H
2H

© 2017 NIPPON STEEL & SUMIKIN BUSSAN CORPORATION All Rights Reserved.
Expansion of Casting Parts Factory in Mexico
29
• Kitagawa Mexico (25% owned by NSSB), which
manufactures cast-iron automobile parts, etc. ,
in Mexico, has established a casting factory
expansion and a new line as a response to
growing demand
• Mass production will be started in FY 2018
• Production capacity doubled from 700 to 1,400
tons / year
• We will capture the growing demand for auto
parts in North America
KITAGAWA MEXICO,S.A.de C.V.
Location: Aguascalientes,AGS., Mexico
Founded in: Feb. 2012
Shareholders: KITAGAWA IRON WORKS 75%,
NSSB 25%
Business: Automobile parts casting &
processing
Source: KITAGAWA IRON WORKS

© 2017 NIPPON STEEL & SUMIKIN BUSSAN CORPORATION All Rights Reserved.
Textiles Business
30
3.6 4.3 5.4 5.4
0.9
2.9
178.1 176.1 160.8
150.0
200.0
FY14 FY15 FY16 FY17e
1H/FY17 Performance • Severe business environment continued in
apparel customers.
• OP decreased by ¥1.4 billion due to the
disappearance of the cost reduction effect
generated by the strong yen during FY16
and a deterioration in earnings among group
companies.
27% 32% 34% 34%
50% 36% 41% 48% 47%
FY14 FY15 FY16 1H/FY17
FY17
MTP
FY17
MTP
<5.4>
83 63 100
Ratio of “Loss”(FY14=100)
In Net
Sales
In Gross
Profit
Previous Forecast
<160.0>
Sales (¥ billion)
Ordinary Profit(¥ billion)
Ratio of ODM Business Apparel customers` cost-cutting trend, such
as smaller lots or shorter delivery times
Lack of production capacity in China
caused by labor shortage and
strengthening environmental regulations
Business Environment
Major Initiatives
• Strengthen OEM/ODM production
management and cost reduction
• Reorganization of our customer portfolios
• Considering measures to correspond to
structural changes from the mid-term viewpoint
Sales: Profit:
FY17 (YoY)
3.8
FY14 FY15 FY16
▲44%
83 63 100
56
1H/FY17
2H/FY17 Forecast
Increased costs resulting from worsened
production efficiency hit our profitability
1H
2H

© 2017 NIPPON STEEL & SUMIKIN BUSSAN CORPORATION All Rights Reserved.
Investment to Denim Production
31
Expanding sales in overseas markets
To support expanded production
capacity in Ree Blue Myanmar denim
sewing factories, NSSB decided to
make an equity investment and loan
the equipment free of charge.
We aim to expand sales to leading
Western denim brands in the US and
Europe.
NSSB
HK
office
Production Buyer
Buyer
Buyer Consultation
NSSB (Japan)
Marketing & Trading
Hong Kong
Certification
Know-how European and
US costumers
Myanmar
Factories

© 2017 NIPPON STEEL & SUMIKIN BUSSAN CORPORATION All Rights Reserved.
Foodstuffs Business
32
2.9 2.8 3.3 1.2
3.2 1.5
152.9 149.0 144.1 140.0 160.0
FY14 FY15 FY16 FY17e FY17
MTP
FY17
MTP
5.0 5.0 5.8 3.0
7.0
FY14 FY15 FY16 FY17e
Sales: Profit:
FY17 (YoY)
Previous Forecast
<150.0>
Sales (¥ billion)
Ordinary Profit (¥ billion)
FY13: NS + SB
Overseas Sales (¥ billion)
<3.4>
2.7
1H/FY17 Performance • Prices of imported meat in Japan remained
steady overall
• OP decreased by ¥0.5 billion because of
lower profit margins in broilers by hikes in
buying costs
Japan to trigger safeguard tariffs on US
frozen beef.
[Tariffs rise to 50% from 38.5%]
Business Environment & Major Initiatives
2H/FY17 Forecast
Increased sales of US chilled beef,
Australian beef and pork.
Growth of Home Meal Replacement (HMR)
market
Food development for the HMR market
2H
1H
1H

© 2017 NIPPON STEEL & SUMIKIN BUSSAN CORPORATION All Rights Reserved.
Expansion of Wagyu Export Business
33
• Taiwan reopened its market to Wagyu on Sep. 18, after 16 years long years.
• NSSB became the first Wagyu exporter to the re-opening Taiwanese market.
“Miyazaki Wagyu” NSSB The Kanpai Group [Taiwan]
In addition to “Miyazaki Wagyu,” NSSB began
export of “Omi Wagyu” from November
• Miyazaki Wagyu represents the top grade of wagyu from Miyazaki Prefecture in
Kyushu. It is known for its strict quality standards, and has an established reputation
for being one of the best varieties of beef in Japan.
• Omi Wagyu is Japanese beef originating in Shiga Prefecture. “Omi” refers to Omi
Province, the predecessor of Shiga.
Omi Wagyu is generally considered one of the three top brands of Japanese beef.

© 2017 NIPPON STEEL & SUMIKIN BUSSAN CORPORATION All Rights Reserved.
4. Appendix
34
© 2017 NIPPON STEEL & SUMIKIN BUSSAN CORPORATION All Rights Reserved.
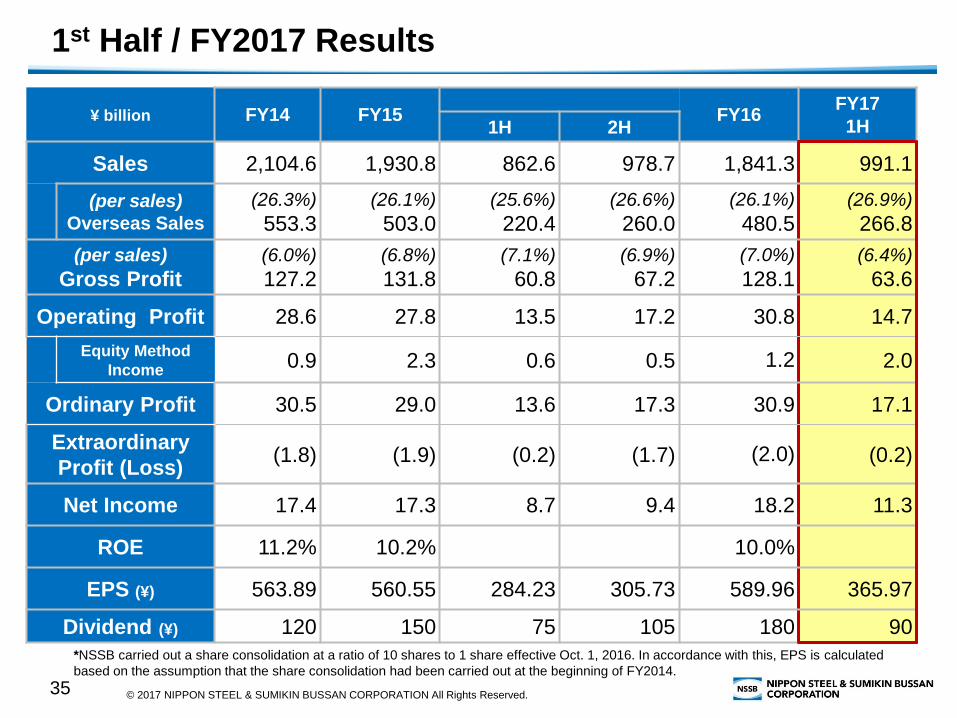
1st Half / FY2017 Results
35
¥ billion FY14 FY15 FY16 FY17
1H 1H 2H
Sales 2,104.6 1,930.8 862.6 978.7 1,841.3 991.1
(per sales)
Overseas Sales
(26.3%)
553.3 (26.1%)
503.0 (25.6%)
220.4 (26.6%)
260.0
(26.1%)
480.5 (26.9%)
266.8
(per sales)
Gross Profit
(6.0%)
127.2
(6.8%)
131.8
(7.1%)
60.8
(6.9%)
67.2
(7.0%)
128.1
(6.4%)
63.6
Operating Profit 28.6 27.8 13.5 17.2 30.8 14.7
Equity Method
Income 0.9 2.3 0.6 0.5 1.2 2.0
Ordinary Profit 30.5 29.0 13.6 17.3 30.9 17.1
Extraordinary
Profit (Loss) (1.8) (1.9) (0.2) (1.7) (2.0) (0.2)
Net Income 17.4 17.3 8.7 9.4 18.2 11.3
ROE 11.2% 10.2% 10.0%
EPS (¥) 563.89 560.55 284.23 305.73 589.96 365.97
Dividend (¥) 120 150 75 105 180 90
*NSSB carried out a share consolidation at a ratio of 10 shares to 1 share effective Oct. 1, 2016. In accordance with this, EPS is calculated
based on the assumption that the share consolidation had been carried out at the beginning of FY2014.

© 2017 NIPPON STEEL & SUMIKIN BUSSAN CORPORATION All Rights Reserved.
Extraordinary Profit (Loss)
36
¥ billion 1H/FY16 1H/FY17 Change
Gain on Sales of Non-current Assets 0.11 - -0.11
Gain on Sales of Investment Securities 0.08 0.11 0.03
Total Extraordinary Profit 0.19 0.11 -0.08
Impairment Loss 0.06 0.00 0.06
Loss on Sales of Investment Securities 0.06 - 0.06
Loss on Valuation of Investment
Securities 0.09 0.40 -0.31
Loss on Liquidation of Subsidiaries and
Associates 0.04 - 0.04
Loss on Liquidation of Subsidiaries and
Associates 0.22 - 0.22
Loss on change in equity 0.00 - 0.00
Total Extraordinary Loss 0.48 0.40 0.07
Net Extraordinary Profit (Loss) (0.29) (0.29) -0.00

© 2017 NIPPON STEEL & SUMIKIN BUSSAN CORPORATION All Rights Reserved.
Sales and Ordinary Profit by Quarter
37
¥ billion FY2014 FY2015 FY2016 FY2017
3Q 4Q 1Q 2Q 3Q 4Q 1Q 2Q 3Q 4Q 1Q 2Q
Steel 428.6 428.6 385.3 397.3 365.4 362.9 323.0 347.2 358.1 419.9 389.6 413.8
I & I 25.9 23.6 23.5 25.9 20.5 23.2 21.4 20.2 19.5 25.1 22.1 22.2
Textiles 45.4 48.4 39.0 42.9 46.7 47.3 37.3 39.4 40.4 43.5 36.1 36.6
Foodstuffs 41.3 34.3 37.8 38.6 38.0 34.4 36.3 36.5 35.9 35.3 34.6 35.0
Others 0.2 0.3 0.3 0.6 0.0 0.3 0.3 0.5 0.3 0.2 0.4 0.4
Sales 541.5 535.3 486.0 505.6 470.8 468.2 418.5 444.1 454.6 524.2 483.0 508.1
Steel 5.4 5.7 5.4 4.4 3.8 4.6 3.8 4.2 5.2 6.3 6.3 6.3
I & I 1.1 1.1 1.9 0.7 0.4 0.1 0.7 0.4 0.4 0.5 1.4 0.7
Textiles 0.3 2.0 0.7 0.5 1.0 1.9 1.6 0.8 1.1 1.8 0.9 0.0
Foodstuffs 0.8 0.4 0.7 0.6 0.8 0.6 0.9 0.7 0.7 0.8 0.7 0.4
Others 0.0 0.0 0.0 0.0 0.0 0.0 0.0 0.0 0.0 0.0 0.0 0.0
Ordinary
Profit 7.7 9.4 8.8 6.5 6.2 7.4 7.2 6.3 7.7 9.5 9.5 7.5

© 2017 NIPPON STEEL & SUMIKIN BUSSAN CORPORATION All Rights Reserved.
24.8%
25.8%
27.2% 27.2% 27.9% 27.8%
24.0%
24.2%
25.4% 25.7%
23.7%
29.0%
26.6%
27.2%
1QFY14
2Q 3Q 4Q 1QFY15
2Q 3Q 4Q 1QFY16
2Q 3Q 4Q 1QFY17
2Q
Overseas Sales Trend
Overseas Sales
38
66%
16%
16%
2%
1H/FY2017 Sales by Region
1H/FY16 1H/FY17
27%
73%
Net Sales
Overseas
26%
Domestic
74%
¥862.6 billion
¥991.1 billion
Asia
(except China) China
Americas
RoW

© 2017 NIPPON STEEL & SUMIKIN BUSSAN CORPORATION All Rights Reserved.
Sales Volume and ASP of Steel by Quarter
39
2.14 2.33 2.11 2.11 2.05 2.06 1.91 1.90 1.99 1.99 1.88 1.99 2.08 2.12 2.06 2.04
1.11 1.11
1.18 1.32 1.18 1.13 1.32 1.40 1.44 1.48 1.44 1.61 1.35 1.32 1.22 1.39
3.25 3.43
3.29 3.44
3.23 3.19 3.23 3.30 3.43 3.47 3.32 3.61 3.43 3.44
3.28 3.43
88.6 90.4 90.0 89.0 92.7 91.8
86.2 83.1
77.9 71.8 69.8 70.9 73.3
82.3 85.6 84.8
99 104 101 102
111
119 120 124
121 118
110
104 105
115 111 111
3QFY13
4Q 1QFY14
2Q 3Q 4Q 1QFY15
2Q 3Q 4Q 1QFY16
2Q 3Q 4Q 1QFY17
2Q
Sales Volume(million tons, including semi-finished product)
ASP (¥ thousands per ton, excluding semi-finished product)
FOREX(¥/$)
Domestic
Export

© 2017 NIPPON STEEL & SUMIKIN BUSSAN CORPORATION All Rights Reserved.
Steel Products Export Volume by Region
40
0.50 0.40 0.42 0.47 0.48 0.32 0.37
0.34 0.26 0.26 0.24 0.26
0.34 0.29
1.37
1.27 1.52
1.78 1.86
1.58 1.58
0.18
0.16
0.20
0.17 0.23
0.19 0.20 0.08
0.20
0.30
0.23
0.20
0.23 0.14 2.50
2.30
2.72
2.92 3.05
2.68 2.61
1H/FY14 2H 1H/FY15 2H 1H/FY16 2H 1H/FY17
Americas
Middle East
Other Asia
ASEAN
Taiwan
India, etc.
Korea
China
Million tons
RoW (Europe, etc.)

© 2017 NIPPON STEEL & SUMIKIN BUSSAN CORPORATION All Rights Reserved.
500
600
700
800
900
1,000
Apr May Jun Jul Aug Sep Oct Nov Dec Jan Feb Mar
Automobile Production
2015
2016
2017
Domestic Demand Trend for Steel
41
5,000
5,500
6,000
6,500
7,000
7,500
8,000
8,500
9,000
Apr May Jun Jul Aug Sep Oct Nov Dec Jan Feb Mar
Building Construction Started (Non-wooden) 2015
2016
2017
Thousand
units
(Source: JAMA)
Thousand ㎡
(Source: MLIT)

© 2017 NIPPON STEEL & SUMIKIN BUSSAN CORPORATION All Rights Reserved.
2,000
2,100
2,200
2,300
2,400
2,500
Jan Feb Mar Apr May Jun Jul Aug Sep Oct Nov Dec
201520162017
56.4 55.3
42.6
53.6
64.0
50.0 54.2
59.3 57.8 55.4 61.8
72.7 78.0 81.0
90.3
79.8
66.3
56.1 62.4
71.8 75.4
61.0 60.6 61.4
30
40
50
60
70
80
90
100
Apr2015
Sep Dec Mar2016
Apr May Jun Jul Aug Sep Oct Nov Dec Jan2017
Feb Mar Apr May Jun Jul Aug Sep Oct Latest
Imported iron ore price (62% fine)
Steel Market in China
42
US$/t
1,500
2,000
2,500
3,000
3,500
4,000
4,500
Apr2015
Sep Dec Mar2016
Apr May Jun Jul Aug Sep Oct Nov Dec Jan2017
Feb Mar Apr May Jun Jul Aug Sep OctLatest
HRC Market Price (including tax)
RMB/t
(Source: CISA)
(Source: CISA)
Daily Crude Steel Production
(Source: National Bureau of Statistics of China )
Thousand tons

© 2017 NIPPON STEEL & SUMIKIN BUSSAN CORPORATION All Rights Reserved.
Steel Market in Japan
43
25.2 25.1 27.2
23.0 22.1
17.2
14.4
14.7
15.7 16.1
16.7
18.6
23.1
27.0
19.8
18.3
19.7 20.0
19.3
23.4 26.5
27.2 26.1
31.2
27.4
24.7 25.5
28.0
31.6 32.2 30.6
10
20
30
Apr2015
May Jun Jul Aug Sep Oct Nov Dec Jan2016
Feb Mar Apr May Jun Jul Aug Sep Oct Nov Dec Jan2017
Feb Mar Apr May Jun Jul Aug Sep Oct
Bid Prices of Export Scrap Steel
978 794 959 876 926 1,055 728 795
1,041 968 893 1,059 964 1,020 1,042 897 876 845 754 791 688 798
473 451
481 564 465 454
438 480 545 496 417
580 506 421 545
518 490 579 500 581
470 431
46.9 46.2 43.9 44.2 43.0 43.3 42.5 44.0 45.4 44.7 45.5 46.5 45.6 47.8 52.0
54.7 58.5
61.4 63.2 63.2 63.2 63.4
0
10
20
30
40
50
60
70
80
0
500
1,000
1,500
2,000
2,500
3,000
3,500
4,000
Dec2015
Jan2016
Feb Mar Apr May Jun Jul Aug Sep Oct Nov Dec Jan2017
Feb Mar Apr May Jun Jul Aug Sep
Volume [Pickled]
Volume [Black]
Price [Pickled]
Price [Black](Source: Custom)
Volume & Price of Import HRC
¥ thousands per ton
(Source: Kanto-Tetsugen Cooperative Association)
*Price: CIF [Chiba Port]
¥ thousands per ton Thousand tons

© 2017 NIPPON STEEL & SUMIKIN BUSSAN CORPORATION All Rights Reserved.
206 207 201 197 198 198 195 189 185 185 192 203 196 198 197 191 187 180 177 173 177 186
200 201 197 197 193 189 179 182 176
77 77 77 77 75 75
73 72 72 72
70 70 70 70 70 68 68 68 68 68
70 72 72
73 75 75 75 75 75
77 77 78
50
55
60
65
70
75
80
0
100
200
300
400
Apr2015
May Jun Jul Aug Sep Oct Nov Dec Jan2016
Feb Mar Apr May Jun Jul Aug Sep Oct Nov Dec Jan2017
Feb Mar Apr May Jun Jul Aug Sep Oct Nov
Inventory (left axis) Market price (right axis)
Steel Market in Japan
44
4.23 4.31 4.20
4.07 4.26 4.21 4.13 4.08 4.09
4.27 4.17 4.11 4.08
4.18 4.03
3.91 4.05 3.97 3.96
3.83 3.81 3.89 3.88 3.80 3.88 4.08 4.01 3.96
4.11 4.14
66 66 65 65 65 65 65 65
64 63
62 61
60 60 60 60 60 60 61
62 63 63
64 65
69 69 70 70
72
76 77 77
50
55
60
65
70
75
80
3.5
4.0
4.5
5.0
5.5
6.0
6.5
Apr2015
May Jun Jul Aug Sep Oct Nov Dec Jan2016
Feb Mar Apr May Jun Jul Aug Sep Oct Nov Dec Jan2017
Feb Mar Apr May Jun Jul Aug Sep Oct Nov
Rolled steel* inventories (left axis) HRC market price (right axis)
Rolled Steel Inventory and HRC Market Price (Million tons) (¥ thousands per ton)
(Source: Japan Metal Daily *Rolled steel: Hot-rolled, cold-rolled and coated sheets)
H-beam Inventory and Market Price (Thousand tons)
(¥ thousands per ton)
(Source: Japan Metal Daily)

© 2017 NIPPON STEEL & SUMIKIN BUSSAN CORPORATION All Rights Reserved.
150
200
250
300
350
Apr2015
May Jun Jul Aug Sep Oct Nov Dec Jan2016
Feb Mar Apr May Jun Jul Aug Sep Oct Nov Dec Jan2017
Feb Mar Apr May Jun Jul Aug Sep Oct
Indicators Related Textiles and I&I Business
45
¥ thousands per ton
0
100
200
300
400
500
Jan2010
Apr Jul Oct Jan2011
Apr Jul Oct Jan2012
Apr Jul Oct Jan2013
Apr Jul Oct Jan2014
Apr Jul Oct Jan2015
Apr Jul Oct Jan2016
Apr Jul Oct Jan2017
Apr Jul
¥ billion FY2010 FY2011 FY2012 FY2013 FY2014 FY2015 FY2016
Import 2,397.5 2,628.9 2,746.4 3,294.8 3,359.2 3,346.8 2,961.0
¥ billion
ASEAN
China
Others
Import Trend of Apparel and
Clothing Accessories
Aluminum ingot market trends
Source: Nikkei
Source: Customs

© 2017 NIPPON STEEL & SUMIKIN BUSSAN CORPORATION All Rights Reserved.
Import Price and Volume Trend of Meats (1)
46
106 131
158
124
104
139 128 123
96
138 139 130
119
158 164
617
0
100
200
300
400
500
600
700
800
0
50
100
150
200
250
300
350
400
4QFY13
1QFY14
2Q 3Q 4Q 1QFY15
2Q 3Q 4Q 1QFY16
2Q 3Q 4Q 1QFY17
2Q
¥/kg
186
212 222 210
173
207 201 209 209
220 213
220 226 233 226
527
0
100
200
300
400
500
600
700
800
0
50
100
150
200
250
300
350
400
4QFY13
1QFY14
2Q 3Q 4Q 1QFY15
2Q 3Q 4Q 1QFY16
2Q 3Q 4Q 1QFY17
2Q
¥/kg
Beef Pork
(Thousand tons)
Australia
USA
Canada
USA
Import Price (right axis)
Denmark
Spain
Others
Import Volume by
Country (left axis)
(Thousand tons)
Import Price (right axis)
Import Volume by
Country (left axis)
Others
(Source: Custom) (Source: Custom)

© 2017 NIPPON STEEL & SUMIKIN BUSSAN CORPORATION All Rights Reserved.
Import Price and Volume Trend of Meats (2)
47
95
122 126 131
119 130
143 138 140 139 137 135
115
145 148
280
0
50
100
150
200
250
300
350
0
50
100
150
200
250
300
350
4QFY13
1QFY14
2Q 3Q 4Q 1QFY15
2Q 3Q 4Q 1QFY16
2Q 3Q 4Q 1QFY17
2Q
¥/kg
466 465 484 493 522 499 515 493 501 539
359 359 363 359 353 360 351 353 329 323
825 825 847 852 875 858 867 846 829 861
FY07 FY08 FY09 FY10 FY11 FY12 FY13 FY14 FY15 FY16
764 807 716 761 790 770 755 795 834 869
878 866 920 899 898 905 919 880 888 894
1,642 1,673 1,637 1,661 1,688 1,675 1,674 1,674 1,722 1,763
FY07 FY08 FY09 FY10 FY11 FY12 FY13 FY14 FY15 FY16
359 393 382 434 441 430 436 476 518 546
1,370 1,360 1,405 1,387 1,388 1,465 1,479 1,508 1,525 1,550
1,729 1,753 1,786 1,821 1,829 1,894 1,915 1,985 2,043 2,096
FY07 FY08 FY09 FY10 FY11 FY12 FY13 FY14 FY15 FY16
60%
48%
26%
57%
46%
21%
Broilers
Brazil
USA
Thailand
(Thousand tons)
Import Price (right axis)
Import Volume by
Country (left axis)
(Source: Custom)
Imported
Domestic
Estimated Marketing Quantity of Beef
(Source: Agriculture & Livestock Industries Corporation )
Imported
Domestic
(Thousand tons)
(Thousand tons)
(Thousand tons)
Estimated Marketing Quantity of Pork
Estimated Marketing Quantity of
Broilers
Imported
Domestic

© 2017 NIPPON STEEL & SUMIKIN BUSSAN CORPORATION All Rights Reserved.
Outline of Mid-term Business Plan 2017
Key measures
48
Announced
May 2015
Progressing NSSB’s Competitiveness
Accelerating NSSB’s Distinctiveness
Pursue customer safety, reliability and quality
Improve productivity and operational efficiency
Developing Auto-parts
Business and Industrial
Parks
Expanding Market Share
with NSSMC
Expanding “Out to Out”
Business in Asian Market
Strengthening ODM and
Solutions Businesses
Investment Target ¥45 billion (+25%)
FY17 target (vs. FY14)
Net Sales ¥2,300 billion (+9%)
Overseas Sales ¥680 billion (+23%)
Ordinary Profit ¥36 billion (+18%)
Net Profit ¥36 billion (+18%)
Utilize Merger Synergies
ROE over 10%
Equity over ¥200 billion
Net DER below 1.0 times
Payout Ratio 25%–30%
P/L Targets
Financial Goals
Steel Textiles
Foodstuffs I & I
Integrate Management System

© 2017 NIPPON STEEL & SUMIKIN BUSSAN CORPORATION All Rights Reserved. 49
Corporate Philosophy
1. Continuing to be a corporate group driven by the aspiration of providing
goods and services that offer new value to the larger society.
2. Putting trust and reliability first, and by doing so developing together with our customers.
3. Aiming to become the kind of organization that increasingly cultivates, utilizes, and values human resources and their talents.
The current material is not subject to the audit procedures based on the Financial Instruments and Exchange Law and it does not
guarantee the accuracy and the completeness of the material.
Forecasts regarding future performance in these materials are based on assumptions judged to be valid and information available to the
Company at the time the materials were created. These materials are not promises by the Company regarding future performance.
Actual performance may differ significantly from these forecasts for a number of reasons. Nothing in this document shall be considered
as an offer to sell or solicitation of an offer to buy any security, commodity or other instrument. No responsibility or liability can be
accepted for errors or omissions or for any losses arising from the use of this information.