fy2013 consolidated business results · 2014-06-03 · infrastructure. community solutions also...
TRANSCRIPT

1 Copyright © 2014 Toshiba Corporation. All rights reserved. FY2013 Consolidated Business Results www.toshiba.co.jp/about/ir
Makoto Kubo Representative Executive Officer and
Corporate Senior Executive Vice President
FY2013 Consolidated Business Results
May 8, 2014

2
Forward-looking Statements
Copyright © 2014 Toshiba Corporation. All rights reserved. FY2013 Consolidated Business Results www.toshiba.co.jp/about/ir
•This presentation contains forward-looking statements concerning Toshiba Group’s future plans, strategies and performance.
•These forward-looking statements are not historical facts, rather they represent assumptions and beliefs based on economic, financial and competitive data currently available.
•As a global entity, operating a wide range of businesses in countries and regions with widely different market environments, Toshiba wishes to caution that actual results may differ materially from our expectations due to risks and uncertainties that, without limitation, relate to economic conditions, worldwide mega-competition in the electronics business, customer demand, foreign currency exchange rates, tax rules, regulations and other factors.
•Toshiba’s fiscal year runs from April 1 to March 31.
•All figures are consolidated totals for the 12 months of fiscal year 2013, unless otherwise indicated.
•Prior-period performance on consolidated segment information has been reclassified to conform with the current classification.
•Toshiba TEC acquired IBM’s Retail Store Solutions business in July 2012 and completed allocation of the acquisition cost to assets and liabilities in the current fiscal year. Fiscal year 2012 results have been revised to reflect this change.
•The optical disc drive (ODD) business is classified as a discontinued operation in accordance with the Accounting Standards Classification (ASC) 205-20 “Presentation of Financial Statements – Discontinued Operations”. The results of the ODD business have been excluded from net sales, operating income (loss), and income (loss) from continuing operations, before income taxes and noncontrolling interests. Net income of Toshiba Group is calculated by reflecting the ODD business results to income (loss) from continuing operations, before income taxes and noncontrolling interests. Results of the past fiscal year have been revised to reflect this change.

3
Key Points of FY2013
Copyright © 2014 Toshiba Corporation. All rights reserved. FY2013 Consolidated Business Results www.toshiba.co.jp/about/ir
The D/E ratio improved significantly by 29 points from the year-earlier period to 113%.
All segments recorded higher sales than in the year-earlier period. Net Sales: 6,502.5 billion yen (YoY: +775.5 billion yen)
Electronic Devices & Components recorded significantly higher sales due to continued higher sales of memories throughout the year.
Energy & Infrastructure recorded higher sales due to the healthy performance of Social Infrastructure. Community Solutions also recorded sales increase due to the healthy performance of Building Solutions and Toshiba TEC.
Operating income of 290.8 billion yen was 47% higher than in the year-earlier period. Operating income: 290.8 billion yen (YoY: +93.1 billion yen) Income before income taxes and noncontrolling interest: 180.9 billion yen (YoY: +21.3 billon yen) Net income: 50.8 billion yen (YoY: -26.6 billion yen)
Electronic Devices & Components recorded operating income of 238.5 billion yen, its highest-ever, thanks to high profitability in memories in the 4Q that exceeds the first half.
Although the Energy & Infrastructure segment had the temporary negative influence of -31.0 billion yen in operating income, reflecting a conservative reassessment of the asset value of a U.S. developer of nuclear power plants, Nuclear Innovation North America LLC (NINA), the three pillars of business, which are Energy, Data Storage and Healthcare, achieved total operating income of 351.3 billion yen.
Lifestyle Products & Services saw a considerable improvement in operating income in each business from first half to second half.
Net income (loss) attributable to shareholders of the Company decreased on the negative effects of the reassessment of the asset value of NINA (-31.0 billion yen), discontinuation of the ODD business (-15.0 billion yen), and reversal of deferred tax asset due to abolition of the Special Corporation Tax for Reconstruction (-9.8 billion yen).

4
FY2013 Overall, Year-on-Year
Copyright © 2014 Toshiba Corporation. All rights reserved. FY2013 Consolidated Business Results www.toshiba.co.jp/about/ir
(Yen in billions)
Differencevs FY12
Net Sales 6,502.5 5,727.0 775.5
Operating Income (loss) 290.8 197.7 93.1% 4.5% 3.5% 1.0%
Income (loss) before income taxesand noncontrolling interests 180.9 159.6 21.3
% 2.8% 2.8% 0.0%
Net Income (loss) *1 50.8 77.4 -26.6% 0.8% 1.4% -0.6%
Earnings (losses) per shareattributable to shareholders of theCompany *2
\12.00 \18.27 -\6.27
FY13 FY12
*1 “Net income (loss)” refers to Net income (loss) attributable to shareholders of the Company hereinafter. *2 “the Company” refers to Toshiba Corporation hereinafter.

5
FY2013 by Segment, Year-on-Year
Copyright © 2014 Toshiba Corporation. All rights reserved. FY2013 Consolidated Business Results www.toshiba.co.jp/about/ir
Differencevs FY12
Energy & Infrastructure 1,812.2 1,632.3 179.9Community Solutions 1,357.4 1,179.1 178.3Healthcare Systems & Services 410.8 379.6 31.2Electronic Devices & Components 1,693.4 1,286.6 406.8Lifestyle Products & Services 1,313.8 1,269.8 44.0Others 504.0 498.8 5.2Total 6,502.5 5,727.0 775.5
Differencevs FY12
Energy & Infrastructure 32.3 85.1 -52.8% 1.8% 5.2% -3.4%
Community Solutions 51.9 42.7 9.2% 3.8% 3.6% 0.2%
Healthcare Systems & Services 28.6 23.8 4.8% 7.0% 6.3% 0.7%
Electronic Devices & Components 238.5 95.5 143.0% 14.1% 7.4% 6.7%
Lifestyle Products & Services -51.0 -42.3 -8.7% -3.9% -3.3% -0.6%
Others -8.7 -6.6 -2.1% -1.7% -1.3% -0.4%
Total 290.8 197.7 93.1% 4.5% 3.5% 1.0%
Net Sales FY13
Operating Income (loss) FY13
FY12
FY12
(Yen in billions)

6
Overview, FY2013 Results
Copyright © 2014 Toshiba Corporation. All rights reserved. FY2013 Consolidated Business Results www.toshiba.co.jp/about/ir
(+ 14% )
(+ 93.1)
(- 26.6 )
Net sales 11 12 13
(Yen in billions) (vs FY12)
Higher sales Higher sales in all five segments,
most notably Electronic Devices & Components.
Higher operating income Higher operating income reflected a significant increase of operating income in Electronic Devices & Components.
Lower net income Lower net income, on the negative effects of the reassessment of the asset value of NINA, discontinuation of the ODD business, and higher taxes.
5,994.3 5,727.0 6,502.5
202.6 197.7
290.8
Operating income (loss) 11 12 13
Net income (loss) 11 12 13
70.1 77.4
50.8

7
Operating Income (Loss) Analysis, FY2013
Copyright © 2014 Toshiba Corporation. All rights reserved. FY2013 Consolidated Business Results www.toshiba.co.jp/about/ir
0
197.7
FY12 Operating
income (loss)
+ FY13 Operating
income (loss)
290.8 [+93.1]
+356.0
VA CD
-25.0
Fixed Cost
-389.2
-
Currency Exchange +63.2 Volume, etc.
+119.1
VA: Value Analysis
CD: Cost Down
Price reduction, Structural
change
NINA reassessment of
asset value
-31.0
(Yen in billions)

8
Energy & Infrastructure, FY2013
Copyright © 2014 Toshiba Corporation. All rights reserved. FY2013 Consolidated Business Results www.toshiba.co.jp/about/ir
(+11%) (- 52.8 )
Social Infrastructure Systems operating income continue to increase on good performances by Solar Photovoltaic Power Systems, Transmission & Distribution Systems, Power Transformation Systems, Railroad Systems and other businesses. Thermal Power Systems maintained high profitability. The segment as a whole saw lower operating income due to temporary expenses incurred by the overseas nuclear power systems and a conservative reassessment of the asset value of NINA.
The segment as a whole saw higher sales on increased sales in the renewable energy business, including Solar Photovoltaic Power Systems, and in the Social Infrastructure business, including Transmission & Distribution Systems, Railroad Systems, Automotive Systems, Industrial Equipment and Landis+Gyr AG.
1,545.4 1,632.3 1,812.2
(Yen in billions) (vs FY12)
Net sales 11 12 13 Operating 11 12 13 Income (loss)
89.2 85.1
32.3

9
Energy & Infrastructure: Main Projects in 4Q
Copyright © 2014 Toshiba Corporation. All rights reserved. FY2013 Consolidated Business Results www.toshiba.co.jp/about/ir
■ Major Topics (●Overseas ■Japan) Reinforced thermal power generation business in India and enhance EPC capabilities by integrating the plant
engineering function into turbine and generator manufacturer
Entered the home fuel cell system market in Europe
Started production at a power transformer factory in Russia
Started a rechargeable battery system verification project with a major power and gas provider in Spain
Completed Global Engineering & Production Center at Keihin Product Operations
■ Orders received (●Overseas ■Japan) Super-critical steam turbine and generator island packages for the Darlipali Super Thermal Power Station in Darlipali,
India
Traversing incore probe systems for the boiling water reactors at Olkiluoto, Finland
Heating, Ventilation, and Air Conditioning system for Delhi Metro Rail Corporation Ltd.
New stations’ electrical and mechanical systems for Taiwan High Speed Rail Corporation
Motors and inverters for the Ford Motor Company for Inter-American market.
Letter sorting machines for the U.S. market
Combined-cycle thermal power generation system from Hokkaido Electric Power Co., Inc. for the Ishikariwan Shinko Power Plant
Battery energy storage systems for Kyushu Electric Power Co., Inc.
Automation machines, such as banknote processing machines for financial organizations

10 Copyright © 2014 Toshiba Corporation. All rights reserved. FY2013 Consolidated Business Results www.toshiba.co.jp/about/ir
2,000.0
2,500.0
3,000.0
3,500.0
13/3E 14/3E
Order Backlog Increased by 18% (13/3E ⇒ 14/3E)
Energy & Infrastructure Group, Order Backlog * Power Systems and Transmission & Distribution Systems
(Solar Photovoltaic Power Systems are excluded.) (Yen in billions)

11
Community Solutions, FY2013
Copyright © 2014 Toshiba Corporation. All rights reserved. FY2013 Consolidated Business Results www.toshiba.co.jp/about/ir
(+15%) (+ 9.2 )
The segment as a whole saw higher operating income. Elevator & Building Systems and Commercial Air-Conditioner businesses saw higher operating income thanks to business expansion in emerging economies. Toshiba TEC’s Retail Information Systems and Office Equipment businesses also saw higher operating income on global expansion.
The segment as a whole saw higher sales. Solar Photovoltaic Systems, Disaster Prevention Systems for local governments and Building Solutions including Elevators, Commercial Air Conditioners and Lighting maintained solid growth. Toshiba TEC recorded higher sales, mainly in the Retail Store Solutions Business acquired from IBM.
1,064.7 1,179.1
1,357.4
31.4
42.7 51.9
(Yen in billions) (vs FY12)
Net sales 11 12 13 Operating 11 12 13 Income (loss)

12
Community Solutions: Main Projects in 4Q
Copyright © 2014 Toshiba Corporation. All rights reserved. FY2013 Consolidated Business Results www.toshiba.co.jp/about/ir
■ Major Topics (●Overseas ■Japan) Started operation of a new factory of Toshiba Carrier Air Conditioning (China) Co., Ltd., which
becomes a production base for highly-efficient multi air-conditioning systems for Chinese market.
Toshiba’s proposed technology was selected for “Sewage water innovative technology verification projects” aimed at nation-wide technology expansion and enhancement of international competitiveness by the Ministry of Land, Infrastructure, Transport and Tourism
Verification project with Dai Nippon Printing Co., Ltd. for electronic receipt started at Miyagi Co-op (Business deployment in FY2014)
■ Orders received and new products (●Overseas ■Japan) Intelligent Transport System (ITS) for Vietnam’s expressway
Air-conditioners for high-end residential complex in India
Series of orders from local governments for installation of electrical equipment at water and sewage facility
Replacement and maintenance of LED security lighting from local governments
Elevators installed in Abeno Harukas, a skyscraper complex in Osaka, Japan started operation
Developed organic EL lighting for wall surface that realized as long life as LED lighting

13
Healthcare Systems & Services, FY2013
Copyright © 2014 Toshiba Corporation. All rights reserved. FY2013 Consolidated Business Results www.toshiba.co.jp/about/ir
(+8%) (+ 4.8 )
The segment as a whole saw higher operating income, reflecting a solid performance by the service sector, especially for CT systems in Japan and the U.S., the smooth establishment of local subsidiaries in emerging economies. Yen depreciation also improved profitability in overseas operations.
The segment as a whole saw higher sales on sales of computerized tomography (CT) systems in Turkey and other emerging economies as well as in Japan. The Diagnostic Ultrasonic Systems recorded solid performance. The service sector also saw good performances in Japan and overseas.
356.3 379.6 410.8
17.6 23.8
28.6
(Yen in billions) (vs FY12)
Net sales 11 12 13 Operating 11 12 13 income (loss)

14
Healthcare Systems & Services: Main Projects in 4Q
Copyright © 2014 Toshiba Corporation. All rights reserved. FY2013 Consolidated Business Results www.toshiba.co.jp/about/ir
■ Major Topics ( Diagnostic Imaging New Business) Introduced the new health care business strategy Established a new in-house company, the Healthcare Company on July 1 Developed breath analyzer that analyzes trace gas in exhaled breath Invested in CapsoVision, Inc. in the U.S., a developer of capsule endoscopes Developed a device that identifies type of rice in a short time, based on DNA chip technology Won the Innovation Award from Scottish Enterprise, a non-departmental public body of the
Scottish government, for “development of the sophisticated CT image processing technology for cardiovascular disorders”.
Vantage ElanTM and XarioTM awarded “Red Dot Product Design Award” at “Red Dot Design Award 2014”
■ New products and new orders ( Diagnostic Imaging New Business)
Developed Superb Micro-vascular Imaging (SMI) technology capable of imaging low flow rate blood and started incorporation into Aplio™ series ultrasonic diagnosis equipment
Developed Dose Tracking System (DTS) technology that delivers safety through visualization of X-ray and started to incorporate the technology in the angiographic X-ray system Infinix Celeve™-i.
Started operation of first unit of space-minimization Vantage Elan1.5T MRI system

15
Electronic Devices & Components, FY2013
Copyright © 2014 Toshiba Corporation. All rights reserved. FY2013 Consolidated Business Results www.toshiba.co.jp/about/ir
(+32%) (+143.0 )
The segment as a whole saw higher sales, reflecting higher sales in the Memories business throughout the year. The Storage Products business also recorded higher sales on sales of 3.5-inch HDDs.
The segment recorded its highest-ever operating income. Despite price reductions in 4Q in the Memories business, it maintained high profitability, supported by development of leading-edge process technologies and cost reduction. The Discrete business turned into positive operating income in 4Q.
1,356.3 1,286.6
1,693.4
75.0 95.5
238.5
Net sales 11 12 13
(Yen in billions) (vs FY12)
* The ODD business is classified as a discontinued operation in accordance with ASC 205-20 “Presentation of Financial Statements. Discontinued Operations”. The results of the ODD business have been excluded from net sales, operating income (loss), and income (loss) from continuing operations, before income taxes and noncontrolling interests. Net income of Toshiba Group is calculated by reflecting the ODD business results to income (loss) from continuing operations, before income taxes and noncontrolling interests. Results of the past fiscal year have been revised to reflect this change.
Operating 11 12 13 income (loss)

16
Electronic Devices & Components: Main Projects in 4Q
Copyright © 2014 Toshiba Corporation. All rights reserved. FY2013 Consolidated Business Results www.toshiba.co.jp/about/ir
■ Major Topics Decided a part of investments in Phase 2 of the Fab. 5 semiconductor fabrication facility at
Yokkaichi Operations Reached production of 50% of NAND flash memory with 19nm second-generation NAND
process technology at the end of March Agreed transfer of the ODD business Completed acquisition of OCZ Technology Group’s SSD business assets
New products Introduced client SSD formed with 2nd generation 19nm process technology
Commercialized 5TB* nearline 3.5-inch HDD, the industry’s largest capacity
Widened the product range of application processors (App LiteTM series) for high image quality wireless communications and wearable terminals
Developed wristband-type activity meter that works with a smartphone
Commercialized ICs for Bluetooth® Smart equipment, which allows incorporation of communication system into small devices, such as wearable terminals
Introduced new white super luminosity LED lighting of 1W type with GaN-on-Si technology
*TB: Terabyte (equals to 1024-gigabyte, about one trillion bytes)

17
Semiconductor & Storage Products Business Results Breakdown
Copyright © 2014 Toshiba Corporation. All rights reserved. FY2013 Consolidated Business Results www.toshiba.co.jp/about/ir
Difference
vs FY12
Discrete 156.9 150.7 6.2
System LSI 198.9 223.2 -24.3
Memory 826.9 529.0 297.9
Semiconductor Total 1,182.7 902.9 279.8
Storage Products 476.6 395.2 81.4
Difference
vs FY12Semiconductor & StorageProducts Total 225.8 95.8 130.0
Net Sales FY13 FY12
Operating Income (loss) FY13 FY12
(Yen in billions)

18
Semiconductor & Storage Products Business Quarterly Trend in Operating Income (Loss)
Copyright © 2014 Toshiba Corporation. All rights reserved. FY2013 Consolidated Business Results www.toshiba.co.jp/about/ir
2.0
9.1
45.4
31.3
20.0
63.7
8.0
29.7
52.3
31.4 37.0
64.4
2011 2012 2013
1Q 2Q 3Q 4Q 1Q 2Q 3Q 4Q 1Q 2Q 3Q 4Q
(Yen in billions)

19
Lifestyle Products & Services, FY2013
Copyright © 2014 Toshiba Corporation. All rights reserved. FY2013 Consolidated Business Results www.toshiba.co.jp/about/ir
Differencevs FY12
TV 231.8 260.4 -28.6
PC 733.9 705.1 28.8
Home Appliances 253.4 212.3 41.1
Difference
vs FY12
Lifestyle Products & Services Total -51.0 -42.3 -8.7
FY13 Operating IncomeFirst Half Second Half
-36.7 -14.3
Net Sales FY13 FY12
Operating Income (loss) FY13 FY12
The Home Appliances business continued to see positive operating income in the 4Q and saw a higher operating income than in the 3Q. The TV business recorded the 4Q cost of clearing inventories in Europe in 4Q as part of structural reform. The PC business halved its operating deficit in 4Q against the 3Q.
Temporal Expense incurred in second half due to structural reform in Europe
(Yen in billions)

20
Non-Operating Income (Loss) and Expenses
Copyright © 2014 Toshiba Corporation. All rights reserved. FY2013 Consolidated Business Results www.toshiba.co.jp/about/ir
Differencevs FY12
Net financial income (loss) -20.0 -20.6 0.6
Foreign exchange income (loss) 15.3 8.1 7.2
Income (loss) on sales of fixed assets -6.8 6.2 -13.0
Equity in earnings of affiliates 9.0 21.6 -12.6
Structural reform costs -57.3 -59.7 2.4
Legal settlement cost -28.7 -18.4 -10.3
Others -21.4*1 24.7*2 -46.1
Total -109.9 -38.1 -71.8
FY13 FY12
(Yen in billions)
* 1 Including the adjustment of accounting (first half of Fiscal Year) at a domestic subsidiary, the expense for recall of washing machines and other costs.
*2 Including insurance income of Thailand floods.

21
Income Tax and Net Income (Loss) Attributable to Noncontrolling Interests
Copyright © 2014 Toshiba Corporation. All rights reserved. FY2013 Consolidated Business Results www.toshiba.co.jp/about/ir
Differencevs FY12
Income (loss) before income taxes andnoncontrolling interests 180.9 159.6 21.3
Income tax *1 -96.3 -59.3 -37.0
Loss from discontinued operations *2 -15.0 -5.0 -10.0
Net income (loss) attributable tononcontrolling interests -18.8 -17.9 -0.9
Net income (loss) 50.8 77.4 -26.6
FY13 FY12
*1 Including reversal of deferred tax asset due to abolishment of the Special Corporation Tax for Reconstruction (-9.8 billion yen).
*2 Mainly due to discontinuation of the ODD business.
(Yen in billions)

22
Cash Flows, FY2013
Copyright © 2014 Toshiba Corporation. All rights reserved. FY2013 Consolidated Business Results www.toshiba.co.jp/about/ir
335.0
132.3
286.6
-377.2
-196.3 -246.6
-42.2 -64.0
40.0
FY11 FY12 FY13
Cash flow fromoperating activitiesCash flow frominvesting activitiesFree cash flow
(Yen in billions)

23
Consolidated Balance Sheets
Copyright © 2014 Toshiba Corporation. All rights reserved. FY2013 Consolidated Business Results www.toshiba.co.jp/about/ir
Liabilities and Equity Assets
3,346.6 3,515.4 3,629.9
884.2 1,003.1 934.0
1,307.6 1,372.3 1,506.4
214.3 209.2 171.3 5,752.7
6,100.0 6,241.6
12/3E 13/3E 14/3E
Cash Equivalents
AccountsReceovable Inventories
Others
1,235.8 1,471.6 1,388.4
1,230.2 1,416.1 1,652.3
3,286.7 3,212.3 3,200.9
5,752.7 6,100.0 6,241.6
12/3E 13/3E 14/3E
Others
Total Equity
Interest BearingDebt
Inventory turnover ratio became 6.96, improved by 22% from year-earlier period. Total asset turnover became 1.05, improved by 8% from year-earlier period.
(Yen in billions)

24
Total Equity
Copyright © 2014 Toshiba Corporation. All rights reserved. FY2013 Consolidated Business Results www.toshiba.co.jp/about/ir
Difference
vs 13/3E
Common stock 439.9 439.9 0.0Additional paid-in capital 404.6 404.4 0.2Retained earnings 652.4 635.4 17.0Accumulated othercomprehensive loss -266.1 -443.9 177.8
Treasury stock -1.7 -1.5 -0.2Equity attributable toshareholders of the Company 1,229.1 1,034.3 194.8Equity attributable to
noncontrollling interests423.2 381.8 41.4
Total equity 1,652.3 1,416.1 236.2
Equity attributable to shareholdersof the Company / Total assets ratio 19.7% 17.0% 2.7%
14/3E 13/3E
(Yen in billions)

25
D/E Ratio
Copyright © 2014 Toshiba Corporation. All rights reserved. FY2013 Consolidated Business Results www.toshiba.co.jp/about/ir
Yen in billions
1,235.8
1,471.6 1,388.4
863.5
1,034.3
1,229.1
143% 142%
113%
12/3E 13/3E 14/3E
Equity attributable toshareholders of thecompany
Interest bearing debt
D/E ratio
(Yen in billions)
26
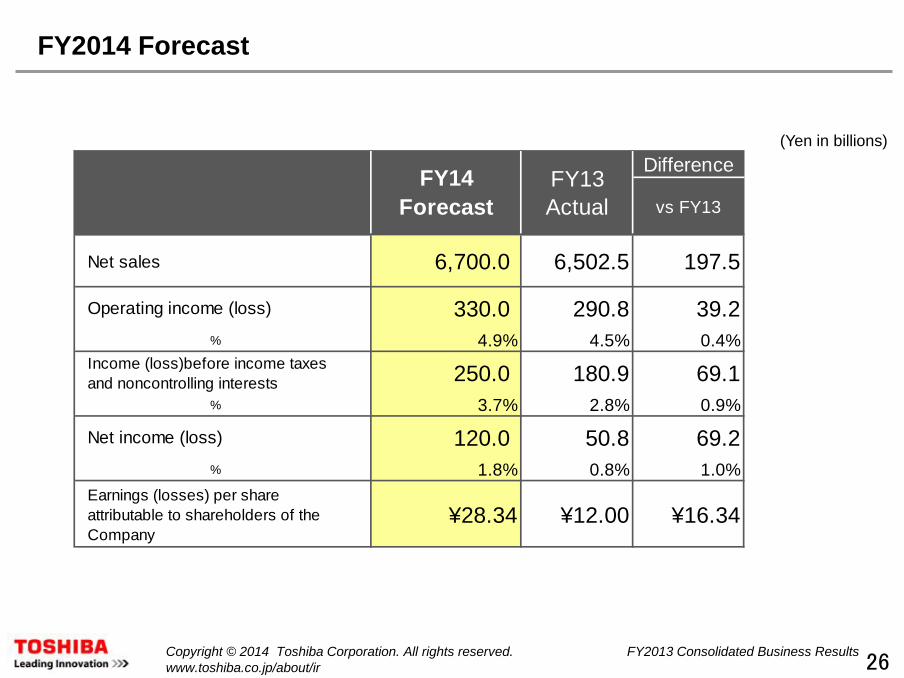
FY2014 Forecast
Copyright © 2014 Toshiba Corporation. All rights reserved. FY2013 Consolidated Business Results www.toshiba.co.jp/about/ir
Difference
vs FY13
Net sales 6,700.0 6,502.5 197.5
Operating income (loss) 330.0 290.8 39.2% 4.9% 4.5% 0.4%
Income (loss)before income taxesand noncontrolling interests 250.0 180.9 69.1
% 3.7% 2.8% 0.9%
Net income (loss) 120.0 50.8 69.2% 1.8% 0.8% 1.0%
Earnings (losses) per shareattributable to shareholders of theCompany
¥28.34 ¥12.00 ¥16.34
FY14Forecast
FY13Actual
(Yen in billions)

27
Segment FY14 Forecast
Copyright © 2014 Toshiba Corporation. All rights reserved. FY2013 Consolidated Business Results www.toshiba.co.jp/about/ir
Differencevs FY13
Energy & Infrastructure 1,950.0 1,812.2 137.8Community Solutions 1,410.0 1,357.4 52.6Healthcare Systems & Services 440.0 410.8 29.2Electronic Devices & Component 1,710.0 1,693.4 16.6Lifestyle Products & Services 1,310.0 1,313.8 -3.8Others 550.0 504.0 46.0Total 6,700.0 6,502.5 197.5
Differencevs FY13
Energy & Infrastructure 70.0 32.3 37.7% 3.6% 1.8% 1.8%
Community Solutions 58.0 51.9 6.1% 4.1% 3.8% 0.3%
Healthcare Systems & Services 30.0 28.6 1.4% 6.8% 7.0% -0.2%
Electronic Devices & Component 180.0 238.5 -58.5% 10.5% 14.1% -3.6%
Lifestyle Products & Services 3.0 -51.0 54.0% 0.2% -3.9% 4.1%
Others -6.0 -8.7 2.7% -1.1% -1.7% 0.6%
Total 330.0 290.8 39.2% 4.9% 4.5% 0.4%
Net Sales FY14Forecast
Operating Income (loss) FY14Forecast
FY13 Actual
FY13 Actual
(Yen in billions)

28 Copyright © 2014 Toshiba Corporation. All rights reserved. FY2013 Consolidated Business Results www.toshiba.co.jp/about/ir