fy2010 national report on implementing total maximum daily ... · fy2010 national report on...
TRANSCRIPT

FY2010 National Report on Implementing Total Maximum Daily Loads (TMDLs) US Environmental Protection Agency Office of Water, Washington DC
Document No. EPA841‐R‐11‐002, March 2011
Abstract
This national study assessed the implementation of Total Maximum Daily Loads (TMDLs) through the end of FY2010 by integrating multiple, independent EPA data systems through geospatial analysis. The assessment targeted the implementation activities in which EPA is directly involved but did not target all TMDL implementation activities. Point source (PS) TMDL implementation was evaluated in terms of TMDLs whose NPDES permits meet their wasteload allocations, and nonpoint source (NPS) TMDL implementation was evaluated in reference to TMDLs with Section 319 NPS control projects involved in reducing nonpoint source loads. The assessed populations of PS TMDLs and NPS TMDLs both included mixed (PS/NPS) TMDLs. The evaluation found that a total of 15,934 PS TMDLs (78% of all PS TMDLs) had mapped data available, and 2,671 (17%) of these had all data necessary to determine implementation status. Of these, 2,052 (77%) were PS TMDLs with all permits meeting the terms of the TMDL, and 133 additional TMDLs (5%) had some permits meeting with others not meeting TMDL terms. Looking specifically at 9,703 permits associated with TMDLs, 9,225 permits or 95% were meeting the terms of the TMDL wasteload allocation(s). The evaluation also found that a total of 30,702 NPS TMDLs (78% of all NPS TMDLs) had mapped data available, and 2,438 (8%) of these co‐occurred with mapped Section 319 projects. The majority of these NPS TMDLs with Section 319 projects (1,402 or 57%) had reported direct involvement in a TMDL, whereas the remaining 1,036 (43%) had a Section 319 project co‐occurring with the TMDL on the same water but without a reported relationship to the TMDL. Among the 1,402 TMDLs with reported linkages with Section 319 projects, the 319 project role in the TMDL was as follows: 1,287 were implementing a TMDL, 82 were developing a TMDL, and 33 were developing a TMDL implementation plan. Looking specifically at Section 319 projects with TMDL status tracked since 2002 by EPA, 2,729 projects (33%) reported TMDL involvement, and 1,953 (72%) of these projects were implementing a TMDL. This study also analyzed the data gaps that limit the numbers of TMDLs that could be assessed, and noted that EPA data systems that could track all TMDL implementation nationwide are likely to remain prohibitively expensive and logistically infeasible. The study concluded that the assessment methodology developed for this project is capable of producing useful, documented TMDL implementation numbers that are substantial but, due to data limitations that would be highly expensive to overcome, still represent an underestimate of total TMDL implementation actually occurring. Introduction and Background
A Total Maximum Daily Load, or TMDL, is a calculation of the maximum amount of a pollutant that a waterbody can receive and still meet water quality standards. Under Section 303(d) of the Clean Water Act (CWA), states, territories, and authorized tribes are required to develop lists of impaired waters. These are waters that are too polluted or otherwise degraded to meet the water quality standards set by states, territories, or authorized tribes (hereafter referred to as states, for brevity). The

FY2010 National Report on Implementing TMDLs – Doc. No. EPA841-R-11-002, March 2011
law requires that these jurisdictions establish priority rankings for waters on the lists and develop TMDLs for these waters. As of FY2010, EPA and states have developed more than 42,000 TMDLs. TMDLs are an essential part of the CWA’s strategy to attain its main goal, “to restore and maintain the chemical, physical and biological integrity of the Nation’s waters” (FWPCA, 1972).
This report provides an analysis of TMDL implementation frequency as determined from EPA data systems and state records. A TMDL provides a technical, quantitative plan that is an important step toward reducing pollutants, but implementing pollution control practices consistent with the TMDL is the follow‐on action needed in order for waters to be restored. TMDL implementation broadly includes any actions consistent with the TMDL that are taken to reduce the pollutant loads causing impairment. Although a wide variety of actions might be carried out to reduce pollution, the two main types of TMDL implementation actions are discharge permits to control point sources and a variety of management practices to control nonpoint sources.
There is great interest as well as frequent confusion regarding TMDL implementation roles and responsibilities. Under the CWA, states are primarily responsible for developing and implementing TMDLs. EPA is required to review and approve or disapprove TMDLs developed and submitted by states within 30 days. After EPA’s approval of a TMDL, the Agency’s statutory authority is limited and it is largely the state’s responsibility to implement the control practices called for in the TMDL. Nevertheless, EPA contributes support to TMDL implementation in two major ways: 1) Section 303(d) of the CWA does not specifically require implementation plans for TMDLs; however, it requires that wasteload allocations (WLAs) to point sources be implemented through the National Pollutant Discharge Elimination System (NPDES) permit program. After a TMDL has been developed, water quality‐based discharge limits in NPDES permits authorized under CWA Section 402 must be consistent with the assumptions and requirements of the WLA; and 2) load allocations (LAs) are implemented to control nonpoint sources through a wide variety of state, local, and federal programs (which may be regulatory, non‐regulatory, or incentive‐based, depending on the program), as well as voluntary action by citizens. CWA Section 319 establishes EPA's nonpoint source management program. As part of this program, states receive grant money, and often pass the funding along to counties and other local groups to support a variety of activities for managing nonpoint sources.
EPA, states and others share a keen interest in knowing the frequency of TMDL implementation. However, many obstacles to comprehensive TMDL implementation tracking exist, including: workload to track TMDLs due to the large numbers of TMDLs; limited state reporting requirements relating TMDLs to NPDES permits; the decentralized nature of nonpoint source control practitioners and practices, and the lack of any centralized reporting on implementation; and the expense and logistical challenges of developing databases that could be queried on TMDL implementation. Furthermore, many TMDL implementation actions (such as permits other than NPDES, or nonpoint source controls funded by USDA or state programs) have little or nothing to do with EPA. EPA has no authority to require TMDL implementation tracking and reporting. Developing and managing a comprehensive TMDL implementation database has been estimated to cost tens of millions of dollars annually. Insights about TMDL implementation rates have therefore been gained through sample‐based studies, anecdotal information, and professional judgment. Although a full census of implementation remains infeasible, improvements to EPA data systems have recently enabled new annual and national approaches to estimating TMDL implementation. During 2007, the EPA Office of Inspector General (OIG) Program Evaluation Division reviewed the TMDL Program in EPA’s Office of Water (OW) and issued a final report (see Total Maximum Daily
2

FY2010 National Report on Implementing TMDLs – Doc. No. EPA841-R-11-002, March 2011
Load Program Needs Better Data and Measures to Demonstrate Environmental Results; Report No. 2007‐ P‐00036 Date Issued: 09/19/2007). The report contained seven recommendations. In the following months, OW developed and finalized a Corrective Actions Plan identifying specific actions and a schedule for addressing the OIG review. OW’s Plan included 31 actions to address the OIG report’s 7 recommendations.
The TMDL program review included one recommendation concerning TMDL implementation reporting metrics (OIG, 2007). The three metrics of OIG recommendation 2 were: Demonstrate that TMDLs are being implemented by annually reporting on the progress of TMDL implementation activities completed nationwide including the number of TMDLs:
[1]‐‐that have all wasteload allocations (WLAs) incorporated into NPDES permits, [2]‐‐that have implemented load allocations through at least one BMP funded through the Section 319 Program, and [3]‐‐for which implementation data are not available to EPA.
Several action items were proposed in response to this recommendation. One action was:
Action #31 ‐‐ Complete national sample‐based assessment of TMDL implementation rates
Although a national survey of the complexities of TMDL implementation would be very expensive and time‐consuming (estimated cost at over $ 700K and requiring an Information Collection Request that involves a year‐long procedure before the survey can begin), this action was appropriate when written as the only method available to obtain national figures on TMDL implementation. Data system improvements since 2007 have made it possible to assess TMDL implementation using national geospatial datasets and previously uncollected permit and Section 319 project data in new ways. Based on this change, the original corrective action was replaced by revised Action #31 as follows: Action #31 ‐‐ Beginning with FY2010, produce a national end‐of‐FY annual report on the number of TMDLs implementing WLAs in NPDES permits, the number of TMDLs implementing LAs through CWA Section 319 projects, and the number of TMDLs with data gaps relative to implementation tracking.
This technical report provides the results of assessing TMDL Implementation through the end of FY2010. To develop this report, the TMDL program assessed all three of the implementation metrics in recommendation 2 using a primarily GIS‐based and query‐augmented analysis of multiple EPA data systems including TMDL, NPS, and permits databases. The first two parts of the results section focus on the population of PS‐related TMDLs and the population of NPS‐related TMDLs in order to address the first two reporting metrics of recommendation 2, respectively. The third part of the results section addresses unavailable data and the different ways that data gaps affect measured results for the PS and NPS TMDLs. This report also includes several additional metrics related to TMDL implementation that were gathered as part of the TMDL Program Results Analysis Project (see also the Results Analysis website at http://water.epa.gov/lawsregs/lawsguidance/cwa/tmdl/results_index.cfm).
3

FY2010 National Report on Implementing TMDLs – Doc. No. EPA841-R-11-002, March 2011
The Target Population of Approved and Established TMDLs The number of TMDLs continues to increase, thus any statistics about TMDLs are limited by the date of the study and the lag time involved in obtaining data. This study focused on and represented the status of known TMDL implementation through September 2010. Figure 1 (below) conceptually represents the TMDL “universe” of 42,134 TMDLs developed through the end of FY2010 (EPA, 2011) and the subset of 31,951 TMDLs that address impaired waters that have been mapped. Figure 1 also illustrates the relative proportions of NPS, PS, and NPS/PS (mixed) TMDLs, and their extensive overlap in the case of mixed TMDLs. As recommendation 2 asks for separately reporting implementation status of
PS and NPS TMDLs, the mixed TMDLs are a component of both the PS and NPS statistics.
Methods Development and Evaluation
Because this study represented a first‐time national scale analysis of TMDL implementation from EPA’s GIS and tabular data together, it explored several slightly different options for a methodology. Six alternative methods, three each for the PS and NPS components of the analysis, were carried out to evaluate options. Selection of the best PS and NPS analysis method was based on the ability to identify implementation status for the greatest number of TMDLs accurately as well as
4

FY2010 National Report on Implementing TMDLs – Doc. No. EPA841-R-11-002, March 2011
minimize and explain data gaps. All of these alternatives were carried out and generated national results on TMDL implementation. Quality control/quality assurance checks on the draft datasets enabled the final method selection. The steps in each method appear in summary form below.
PS APPROACH 1: Permits/TMDLs datasets and GIS analysis Analysis Summary: Identify permits with known permit WLA status from the annual national analysis done under the Priority Permits Initiative. Use the Permits GIS Dataset to identify these permits geospatially. Overlay the Permits GIS Dataset and the Waters with TMDLs GIS Dataset. Use the Waters with TMDLs GIS Dataset to obtain unique TMDL IDs (i.e., the TMDL identifiers) for the Reach Codes where permit WLA status information is available. Identify the LIST IDs (i.e., the impaired waters segments) that relate to these TMDL IDs. Analyze LIST ID and TMDL POLLUTANT attribute information referenced to the Waters with TMDLs GIS Dataset to identify the LIST ID/POLLUTANT combinations (i.e., TMDLs) associated with those waters. Re‐link these TMDLs with the known WLA status already analyzed for each TMDL’s permits. Compile results in terms of TMDLs with permits meeting all WLAs, TMDLs with permits partly meeting WLAs, and TMDLs with permits not meeting WLAs.
PS APPROACH 2: Permits/TMDLs datasets, GIS, and ATTAINS query Analysis Summary: Identify permits with known permit WLA status from the annual national analysis done under the Priority Permits Initiative. Use the Permits GIS Dataset to identify these permits geospatially. Overlay the Permits GIS Dataset and the Waters with TMDLs GIS Dataset. Use the Waters with TMDLs GIS Dataset to obtain unique TMDL IDs (i.e., the TMDL identifiers) for the Reach Codes where permit WLA status information is available. Identify the LIST IDs (i.e., the impaired waters segments) that relate to these TMDL IDs. Run an ATTAINS query to identify the LIST ID/POLLUTANT combinations (i.e., TMDLs) associated with those LIST IDs. Re‐link these TMDLs with the known WLA status already analyzed for each TMDL’s permits. Compile results in terms of TMDLs with permits meeting all WLAs, TMDLs with permits partly meeting WLAs, and TMDLs with permits not meeting WLAs.
PS APPROACH 3: Permits/Listed waters datasets, GIS, and ATTAINS query Analysis Summary: Identify permits with known permit WLA status from the annual national analysis done under the Priority Permits Initiative. Use the Permits GIS Dataset to identify these permits geospatially. Overlay the Permits GIS Dataset and the 303(d) Listed Impaired Waters GIS Dataset. Use the 303(d) Listed Impaired Waters GIS Dataset to obtain unique LIST IDs for the Reach Codes where permit WLA status information is available. Repeat the overlaying with the 2002 Impaired Waters Baseline GIS Dataset, and generate a second set of unique LIST IDs for the Reach Codes where permit WLA status information is available. Combine the two sets and filter for unique LIST IDs. Run an ATTAINS query to identify the TMDLs associated with those LIST IDs. Re‐link these TMDLs with the known WLA status already analyzed for each TMDL’s permits. Compile results in terms of TMDLs with permits meeting all WLAs, TMDLs with permits partly meeting WLAs, and TMDLs with permits not meeting WLAs.
NPS APPROACH 1: GRTS/TMDLs datasets and GIS analysis Analysis Summary: Obtain an updated version of the NPS Projects GIS Dataset and use it to identify thewaters related to all GRTS projects (Section 319 projects) geospatially. Include as attributes each GRTS
5

FY2010 National Report on Implementing TMDLs – Doc. No. EPA841-R-11-002, March 2011
project ID and TMDL status from GRTS. Overlay the NPS Projects GIS Dataset and the Waters with TMDLs GIS Dataset. Use the Waters with TMDLs GIS Dataset Reach Codes to obtain unique TMDL IDs (i.e., the TMDL identifiers) for the Reach Codes where the 319 projects’ TMDL status information (whether developing or implementing a TMDL or developing an implementation plan) is available. Identify the LIST IDs (i.e., the impaired waters segments) that relate to these TMDL IDs. Analyze LIAND POLLUTANT attribute information referenced to the Waters with TMDLs GIS Dataset to identifyLIST ID/POLLUTANT combinations (i.e., TMDLs) associated with those waters. Re‐link these TMDLs with the known TMDL status already analyzed for each TMDL’s 319 projects. Compile results in terms of TMDLs with a 319 project implementing a TMDL, TMDLs with a 319 project developing a TMDL, TMDLs with a 319 project developing an implementation plan, and TMDLs with a 319 project of uncertain relationship to the TMDL although concerning the same water.
NPS APPROACH 2: GRTS/TMDLs datasets, GI
ST ID the
S, and ATTAINS query Analysis Summary: Obtain an updated version of the NPS Projects GIS Dataset and use it to identify the aters related to all GRTS projects (Section 319 projects) geospatially. Note each GRTS project ID and
fiers)
d waters datasets, GIS, and ATTAINS query
wthe Reach Codes for waters affected by the project. Overlay the NPS Projects GIS Dataset and the Waters with TMDLs GIS Dataset. The intersection of these two datasets represents the waters commonto both. Use the Waters with TMDLs GIS Dataset to obtain unique TMDL IDs (i.e., the TMDL identifor the Reach Codes where the 319 projects’ TMDL status information is available. Identify the LIST IDs (i.e., the impaired waters segments) that relate to these TMDL IDs and geographically coincide with the waters identified in the intersection above. Run an ATTAINS query to identify the LIST ID/POLLUTANT combinations (i.e., TMDLs) associated with those LIST IDs. Re‐link these TMDLs with the known TMDL status entered in GRTS for each TMDL’s 319 projects. Compile results in terms of TMDLs with a 319 project implementing a TMDL, TMDLs with a 319 project developing a TMDL, TMDLs with a 319 projectdeveloping an implementation plan, and TMDLs with a 319 project of uncertain relationship to the TMDL although concerning the same water.
NPS APPROACH 3: GRTS/Liste
Analysis Summ
ary: Obtain an updated version of the NPS Projects GIS Dataset and use it to identify the aters related to all GRTS projects (Section 319 projects) geospatially. Note each GRTS project ID and
set
a 319
PS and NPS assessment components. The chosen ethodologies are described in detail below.
wthe Reach Codes for waters affected by the project. Overlay the NPS Projects GIS Dataset and the 303(d) Listed Impaired Waters GIS Dataset. The intersection of these two datasets represents the waters common to both. Identify the unique LIST IDs (i.e., the impaired waters segments) for these waters. Repeat the overlaying with the 2002 Impaired Waters Baseline GIS Dataset, and generate a second of unique LIST IDs. Combine the two sets and filter for a set of unique LIST IDs that represent impairedwaters with Section 319 projects. Run an ATTAINS query to identify the LIST ID/POLLUTANT combinations (i.e., TMDLs) associated with those LIST IDs. Re‐link these TMDLs with the known TMDL status entered in GRTS for each TMDL’s 319 projects. Compile results in terms of TMDLs withproject implementing a TMDL, TMDLs with a 319 project developing a TMDL, TMDLs with a 319 projectdeveloping an implementation plan, and TMDLs with a 319 project of uncertain relationship to the TMDL although concerning the same water.
Approach 3 was selected for both them
6

FY2010 National Report on Implementing TMDLs – Doc. No. EPA841-R-11-002, March 2011
7
Figure 2. Flow diagram for the PS TMDL implementation assessment methodology.
PS TMDLs Assessment Approach The data to assess the WLA status of individual permits and relate the findings to specific TMDLs were drawn from separate permit and TMDL data sources and integrated via this analysis project (Figure 2). Permit information was available from the Permit Compliance System (PCS) and the updated Integrated Compliance Information System (ICIS). Geospatial (GIS) information on permits was recently compiled in a Permits GIS Dataset that documented the Latitude/Longitude of permitted facilities and outfalls and referenced these to the National Hydrography Dataset (NHD). Key information was also obtained through the Priority Permits Initiative, within which state and EPA permit programs annually and nationally flag permits associated with WLAs in TMDLs and relate their update status to meeting the TMDL WLAs. TMDL information was extracted from the ATTAINS data system, as well as from national geospatial datasets of impaired waters with related attributes on TMDL existence accessible through the Reach Address Database. The existence of geospatial data for both permits and TMDLs enabled the linkage of greater numbers of TMDL and permit attributes than previously possible through the limited linkages across the independent ATTAINS and PCS/ICIS data systems.
The approach for PS TMDLs began with identifying the WLA status through data gathered by the EPA Permits program in the Priority Permits Initiative, which added ‘permits associated with a TMDL’ to its list of criteria after the 2007 TMDL program review. EPA’s analytical process for priority permits engages all the states annually and requires their participation in documenting the WLA status for their permits. At the beginning of each fiscal year, states review a list of all permits that have a TMDL WLA
FY2010 National Report on Implementing TMDLs – Doc. No. EPA841-R-11-002, March 2011
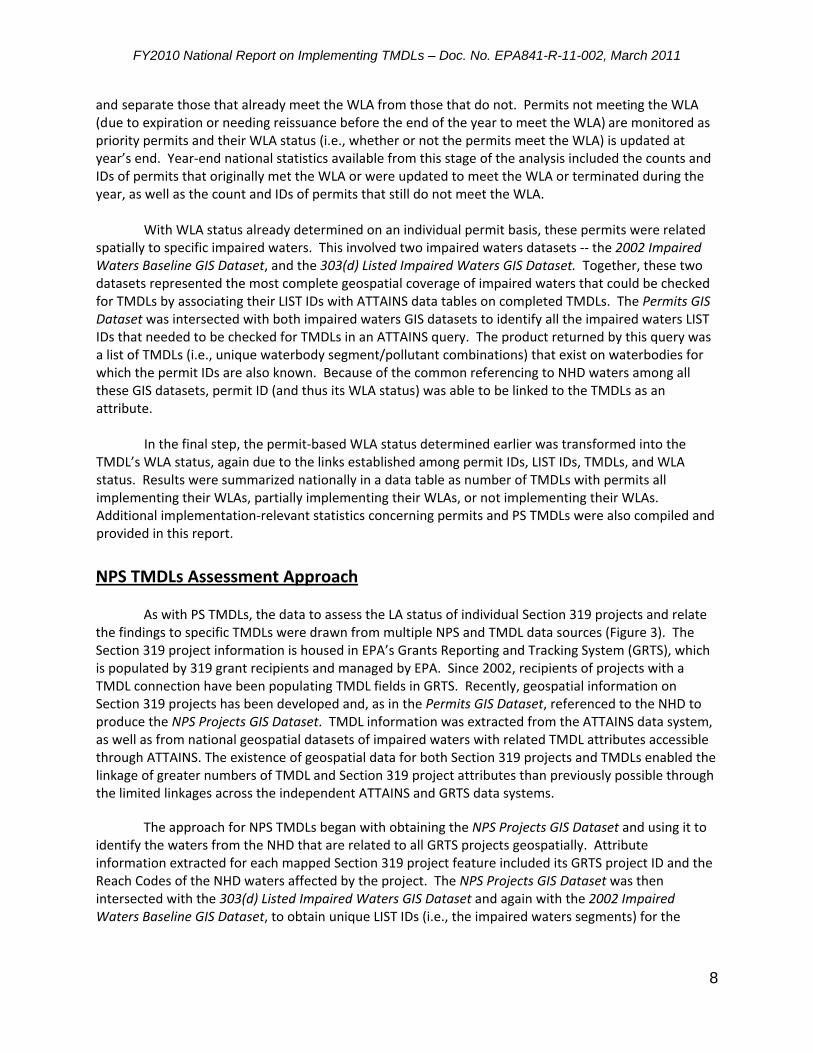
and separate those that already meet the WLA from those that do not. Permits not meeting the WLA (due to expiration or needing reissuance before the end of the year to meet the WLA) are monitored as priority permits and their WLA status (i.e., whether or not the permits meet the WLA) is updated at year’s end. Year‐end national statistics available from this stage of the analysis included the counts and IDs of permits that originally met the WLA or were updated to meet the WLA or terminated during the year, as well as the count and IDs of permits that still do not meet the WLA.
With WLA status already determined on an individual permit basis, these permits were related
spatially to specific impaired waters. This involved two impaired waters datasets ‐‐ the 2002 Impaired Waters Baseline GIS Dataset, and the 303(d) Listed Impaired Waters GIS Dataset. Together, these two datasets represented the most complete geospatial coverage of impaired waters that could be checked for TMDLs by associating their LIST IDs with ATTAINS data tables on completed TMDLs. The Permits GIS Dataset was intersected with both impaired waters GIS datasets to identify all the impaired waters LIST IDs that needed to be checked for TMDLs in an ATTAINS query. The product returned by this query was a list of TMDLs (i.e., unique waterbody segment/pollutant combinations) that exist on waterbodies for which the permit IDs are also known. Because of the common referencing to NHD waters among all these GIS datasets, permit ID (and thus its WLA status) was able to be linked to the TMDLs as an attribute.
In the final step, the permit‐based WLA status determined earlier was transformed into the
TMDL’s WLA status, again due to the links established among permit IDs, LIST IDs, TMDLs, and WLA status. Results were summarized nationally in a data table as number of TMDLs with permits all implementing their WLAs, partially implementing their WLAs, or not implementing their WLAs. Additional implementation‐relevant statistics concerning permits and PS TMDLs were also compiled and provided in this report.
NPS TMDLs Assessment Approach
,
ally. Attribute forma
As with PS TMDLs, the data to assess the LA status of individual Section 319 projects and relate
the findings to specific TMDLs were drawn from multiple NPS and TMDL data sources (Figure 3). The Section 319 project information is housed in EPA’s Grants Reporting and Tracking System (GRTS), which is populated by 319 grant recipients and managed by EPA. Since 2002, recipients of projects with a TMDL connection have been populating TMDL fields in GRTS. Recently, geospatial information on Section 319 projects has been developed and, as in the Permits GIS Dataset, referenced to the NHD to produce the NPS Projects GIS Dataset. TMDL information was extracted from the ATTAINS data systemas well as from national geospatial datasets of impaired waters with related TMDL attributes accessible through ATTAINS. The existence of geospatial data for both Section 319 projects and TMDLs enabled the linkage of greater numbers of TMDL and Section 319 project attributes than previously possible through the limited linkages across the independent ATTAINS and GRTS data systems.
The approach for NPS TMDLs began with obtaining the NPS Projects GIS Dataset and using it to identify the waters from the NHD that are related to all GRTS projects geospatiin tion extracted for each mapped Section 319 project feature included its GRTS project ID and the Reach Codes of the NHD waters affected by the project. The NPS Projects GIS Dataset was then intersected with the 303(d) Listed Impaired Waters GIS Dataset and again with the 2002 Impaired Waters Baseline GIS Dataset, to obtain unique LIST IDs (i.e., the impaired waters segments) for the
8

FY2010 National Report on Implementing TMDLs – Doc. No. EPA841-R-11-002, March 2011
waters that were related to the Section 319 projects as well as being mapped impaired waters (from either of the two impaired waters GIS datasets).
Figure 3. Flow diagram for the NPS TMDL implementation assessment methodology.
At this stage, it was necessary to further analyze this set of waters to determine which waters
are not only impaired and related to Section 319 projects but also have one or more completed TMDL. This step was accomplished by ATTAINS database query to determine the TMDLs from the LIST IDs mentioned above. Because of the common referencing to NHD waters among all the GIS datasets, GRTSproject ID was able to be linked to all of these TMDLs as an attribute.
The final stage of the analysis required linking these TMDLs back to GRTS data system fields that show the relationship of Section 319 projects since 2002 to TMDL implementation (i.e., TMDL status). Specific GRTS TMDL field entry options include “implementing a TMDL”, “developing a TMDL”, and “developing an implementation plan.” A fourth entry option, “not applicable” indicates that the primary purpose of the project was not directly related to a TMDL; however, these projects may have indirect relationships to TMDL implementation that were not specifically defined. Beca
use the GRTS project IDs re
s er.”
were tained throughout the analysis by their spatial relationship to LIST IDs, the GRTS data on TMDL status of each Section 319 project were able to be made attributes of the individual TMDLs. In doing so,the analysis revealed that some Section 319 projects co‐occurred with waters that do have TMDLs but none of the GRTS options above were reported. A fourth TMDL status option was thus createdcombine the “not applicable” GRTS entries with these co‐occurring projects, and represent the“TMDLs with a 319 project of uncertain relationship to the TMDL although concerning the samThe analysis concluded in the development of a data table that summarized the national numbTMDLs with Section 319 projects in each of the four TMDL status categories. Additional
to m ae waters of
9

FY2010 National Report on Implementing TMDLs – Doc. No. EPA841-R-11-002, March 2011
implementation‐relevant statistics concerning Section 319 projects and NPS TMDLs were also providein this report.
d
Assessment Results
The analysis procedures described above were able to produce national‐scale summary statistics on PS and NPS TMDL implementation as well as the data gaps and causes associated with each. Further, these analyses generated information on permits and Section 319 projects that is directly relevant to implementation but not able to be expressed in TMDL terms. Table 1 provides a summary of these results followed by text sections on PS TMDL findings, NPS TMDL findings, and data gaps.
Table 1a. PS TMDL IMPLEMENTATION: SUMMARY RESULTS How many TMDLs are (PS‐only and Mixed)?
PS‐related TMDLs 20,336
How many/what mapped waters?
%
of PS TMDLs are on 15,934 78%
How many/what % TMDLs have permit
of mapped PS WLA status known?
2,671 17%
How many/what % of PS TMDLs known permit WLA status are in WLA status category?
with each
All Meeting WLAs Part Meeting WLAs Not Meeting WLAs
2,052 133 486
All Meeting WLAs Part Meeting WLAs Not Meeting WLAs
77% 5% 18%
How many/what % in each WLA status
of these permits category?
are Permits Permits
Meeting WLAs 9,225 Not Meeting WLAs 478
Permits Permits
Meeting WLAs Not Meeting WLAs
95% 5%
Table 1b. NPS TMDL IMPLEMENTATION: SUMMARY RESULTS
How many TMDLs are TMDLs (NPS‐only and
NPS‐related mixed)?
39,478
How many/what mapped waters?
% of NPS TMDLs are on 30,702 78%
How many/what TMDLs have CWA
% Sof ection
mapped NPS 319 projects?
2,438 8%
How many/what % of mapped NPS TMDLs with CWA Section 319 projects have reported direct relationships or spatial co‐occurrence with TMDLs?
Direct relationship Spatial association
1,402 1,036
Direct relationship Spatial association
57% 43%
How many/what % of mapped NPS TMDLs with Section 319 projects of known TMDL status are in each status category?
Implementing a TMDL Developing a TMDL Developing a TMDL Implementation Plan Uncertain Relationship to Co‐Occurring TMDL
1,287 82
33
1,036
Implementing a TMDL Developing a TMDL Developing a TMDL Implementation Plan Uncertain Relationship to Co‐Occurring TMDL
53% 3%
1%
43% How many GRTS?
Section 319 projects are in 19,251
How data
many Section 319 available to query
projects have TMDL status?*
8,210 43%
How many/what % of these Section projects have a reported direct relationship to a TMDL?**
319 2,729 33%
How many/what % of these Section projects are in each TMDL status category?
319 Implementing a TMDL Developing a TMDL Developing a TMDL Implementation Plan
1,953 522 254
Implementing a TMDL Developing a TMDL Developing a TMDL Implementation Plan
72% 19%
9%
10

FY2010 National Report on Implementing TMDLs – Doc. No. EPA841-R-11-002, March 2011
*Mapping was not available or required for Section 319 projects prior to 2002 **TMDL status was not available or required for Section 319 projects prior to 2002 Results Part 1: Implementation of PS‐related TMDLs Metric 1: TMDLs with NPDES permits implementing TMDL wasteload allocations (WLAs) PS TMDL implementation Highlights Number of PS TMDLs for which sufficient data were available to assess WLA status: 2,671 Number of PS TMDLs with all NPDES permits implementing WLAs:* 2,052 Percent of assessed PS TMDLs with NPDES permits implementing WLAs: 77% Number of NPDES permits for which sufficient data were available on WLA status: 9,703 Number of NPDES permits meeting WLAs: 9,225 Percent of assessed NPDES permits meeting WLAs: 95% * the actual Metric 1 reporting statistic required under OIG Recommendation 2 As of FY2010 end of year, a total of 20,336 PS TMDLs (including point‐source‐only and mixed TMDLs) had been documented in ATTAINS. The PS TMDLs for which mapped impaired waters information was available constituted 15,934 (78%) of all PS TMDLs. Availability in mapped form was essential to linking permits and TMDLs in this assessment. Although similar figures relating total permits to mapped permits were not available, the permits GIS dataset contained over 160,000 permit related features (mostly not related to impaired waters or TMDLs) at the time of this analysis. The third essential data component was permit WLA status determined via the priority permits initiative. This component related to the subset of permits that involve an impaired water, are related to a TMDL, and have an individual WLA. The nexus of these three main inputs was a total of 2,671 PS TMDLs for which NPDES permit WLA status was known and therefore assessable (Figure 4a). Some of these TMDLs involved multiple permits of known WLA status, thus it was possible to identify TMDLs that were partly meeting and partly not meeting WLAs as well as the “meeting” and “not meeting” categories. Some permits also related to more than one TMDL, due to multiple TMDLs on the same waterbody and/or multiple water body
Figure 4. Number and proportions of assessed PS TMDLs (a, left) and NPDES permits (b, right) categorized by meeting or not meeting TMDL wasteload allocations (WLAs) in the permit terms.
(a)
(b)
11

FY2010 National Report on Implementing TMDLs – Doc. No. EPA841-R-11-002, March 2011
segments under the same permit. There were 2,052 PS TMDLs (77%) for which all permits were meeting eting their WLAs. A total
f 486 PS TMDLs (17%) had not met their WLAs.
ized nationally because it prese ed a more direct way of observing the primary element of PS TMDL implementation without
he
national total of all NPDES permits that have an individual WLA
20 d of a ot
per As
their WLAs. An additional 133 PS TMDLs (5%) had some but not all permits meo
e data on NPDES permits meeting their WLAs was also summarTh
ntrelosing data quantity due to data gaps in the translation to reporting WLA status on a TMDL basis. Tnecessary information on permits meeting or not meeting their TMDL WLAs was available for 9,703permits. This quantity represented theas reported in ATTAINS. Of these permits, 8,849 were verified by EPA and states as already meetingtheir WLAs, and 854 that needed changes to meet the WLA were tracked throughout 10. Among thetracked permits, 376 were meeting the WLAs or were terminated by th en FY2010 nd 478 did neyet meet the WLAs. In total, the permits meeting WLAs constituted 95% o mits with WLf the total(Figure 4b).
Results Part 2: Implementation of NPS‐related TMDLs Metric 2: TMDLs with one or more 319 projects implementing TMDL load allocations (LAs) NPS TMDL implementation Highlights Number of NPS TMDLs for which sufficient data were available to assess LA status: 2,438 Number of NPS TMDLs with Section 319 projects implementing LAs:* 1,287 Percent of assessed NPS TMDLs with Section 319 projects implementing LAs: 53% Number of Section 319 projects implementing LAs: 1,953 * the actual Metric 2 reporting statistic required under OIG Recommendation 2 As of FY2010 a total of 39,478 NPS TMDLs (including nonpoint‐source‐only and mixed TMDLs) had been documented in ATTAINS. The NPS TMDLs for which mapped impaired waters information was available constituted 30,702 (78%) of all NPS TMDLs. Availability of impaired waters and TMDL information and Section 319 project information in mapped form was essential to linking TMDLs and Section 319 projects in this assessment. The third essential ingredient for this analysis was Section 319 project‐specific information from the GRTS data system identifying the project’s relationship to implementing a TMDL, developing a TMDL, developing an implementation plan, or its uncertain relationship to a TMDL although concerning the same water. A total of 19,251 Section 319 projects are documented in GRTS, and 8,210 of these projects have appeared since the GRTS TMDL field for data entry has existed (2002). It should be noted that several of the Section 319 NPS management program’s many purposes and applications are unrelated to implementing TMDLs. For example, Section 319 grants can be used to protect or restore threatened waters that are as‐yet unimpaired. Implementing practices relative to a TMDL is one of the major purposes, but not the sole purpose, of Section 319 program resources. Thus, a specific target number or percent of Section 319 projects implementing TMDLs does not exist.
12
FY2010 National Report on Implementing TMDLs – Doc. No. EPA841-R-11-002, March 2011
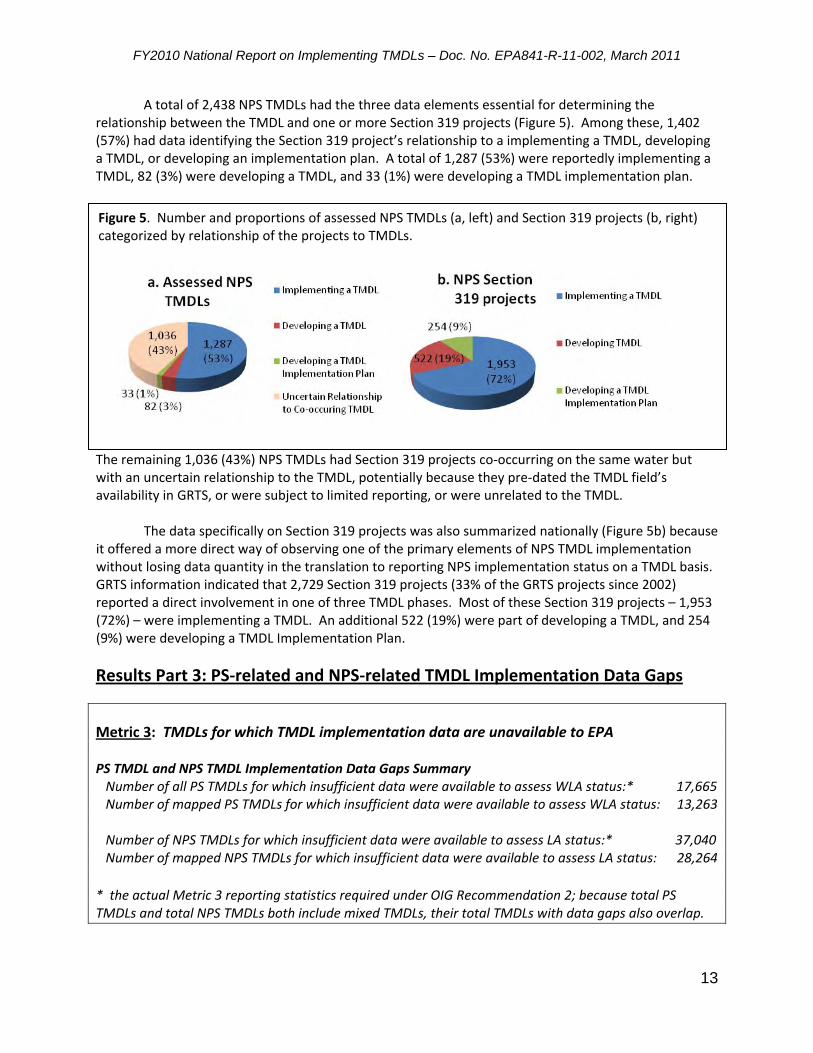
A total of 2,438 NPS TMDLs had the three data elements essential for determining the relationship between the TMDL and one or more Section 319 projects (Figure 5). Among these, 1,402 (57%) had data identifying the Section 319 project’s relationship to a implementing a TMDL, developing a TMDL, or developing an implementation plan. A total of 1,287 (53%) were reportedly implementing a TMDL, 82 (3%) were developing a TMDL, and 33 (1%) were developing a TMDL implementation plan.
Figure 5. Number and proportions of assessed NPS TMDLs (a, left) and Section 319 projects (b, right) categorized by relationship of the projects to TMDLs.
potentially because they pre‐dated the TMDL field’s
DL.
(Fig use
rt g NPS pleme tation is. TS information indicated that 2,729 Section 319 projects (33% of the GRTS projects since 2002)
on 319 projects – 1,953 2%) – were implementing a TMDL. An additional 522 (19%) were part of developing a TMDL, and 254 %) we
Twhe remaining 1,036 (43%) NPS TMDLs had Section 319 projects co‐occurring on the same water butith an uncertain relationship to the TMDL,
availability in GRTS, or were subject to limited reporting, or were unrelated to the TM The data specifically on Section 319 projects was also summarized ure 5b) beca nationallyit offered a more direct way of observing one of the primary elements of NPS TMDL lementation impwithout losing data quantity in the translation to repo in im n status on a TMDL basGRreported a direct involvement in one of three TMDL phases. Most of these Secti(7(9 re developing a TMDL Implementation Plan. Results Part 3: PS‐related and NPS‐related TMDL Implementation Data Gaps Metric 3: TMDLs for which TMDL implementation data are unavailable to EPA PS TMDL and NPS TMDL Implementation Data Gaps Summary Number of all PS TMDLs for which insufficient data were available to assess WLA status:* 17,665 Number of mapped PS TMDLs for which insufficient data were available to assess WLA status: 13,263 Number of NPS TMDLs for which insufficient data were available to assess LA status:* 37,040 Number of mapped NPS TMDLs for which insufficient data were available to assess LA status: 28,264 * the actual Metric 3 reporting statistics required under OIG Recommendation 2; because total PS TMDLs and total NPS TMDLs both include mixed TMDLs, their total TMDLs with data gaps also overlap.
13

FY2010 National Report on Implementing TMDLs – Doc. No. EPA841-R-11-002, March 2011
Data limitations are an inevitable component of any data system that involves continuaand lag times in data reporting or processing. Data gaps do affect TMDL, permits, and NPS data systemand thus the completeness of information targeted for this assessment. This report section addresses what is known about existing TMDL implementation data gaps and discusses how these gaps probably affect the assessment results by reducing the proportion of the TMDL universe that could be assessed
waters mapping that covers the majority of their waters, but they may vary in their recent mapping updates. Whereas the data gaps related to mapping may seem substantial, they must be seen in context that a mapping approach is currently the only feasible method for nationally relatin
l change s
in this project. PS and NPS gaps are discussed separately in order to relate the gaps to the independent PS
ATTAINS data tables provide the most comprehensive information available on TMDLs reported regularly by states and uploaded to ATTAINS by EPA Regional staff. Because of the long‐standing emphasis on reporting TMDL numbers each fiscal year, gaps in the total of 20,336 PS TMDLs indicated in ATTAINS are likely insignificant. This analysis found that 15,934 (78%) of those PS TMDLs were on mapped waters present in EPA’s national GIS datasets; this well‐known data gap is primarily due to the significant lag time between state development of tabular list information and reformatting of the information as impaired waters GIS data. The unmapped waters with TMDLs are thus likely to be among the most recent (last year or two) TMDLs, which also constitute TMDLs that have not had time to begin significant implementation. Nevertheless, 78% of PS TMDLs were able to be included in the first stage of this analysis. The mapping data gap did not represent any significant coverage bias (e.g., no data at ll for whole states) that would affect the national coverage of the assessment. All states have impaired
the g thousands
f TMDLs, permits, and Section 319 projects implementation to one another without extraordinary xpense
and
rmation was present in the priority permits bular data, which were derived through data systems queries.
There were 9,703 candidate priority permits of known WLA status used in this analysis. The apped coverage contained 6,535 (67%) of these permits. Among the mapped permits 6,071 (93%)
gap may be due the time lag associated with continually georeferencing the newest permits as well as potentially
and continues to evolve. The
ailable representation of the permits subpopulation of known WLA status. The proportion of the
the proportions meeting WLAs suggests that, were mapping available for the additional one‐third of ith
and NPS analysis methods. This discussion generally follows the same information sequence seen in Table 1.
a
oe . Permits data are also likely to have data gaps related to mapping, although these could not be quantified like the TMDL mapped data gap. The Permits GIS dataset was very recently constructedstill undergoing improvement, yet contains over 160,000 permit features. The proportion of total individual (major and minor) permits included is believed to be very high, while coverage may be more uneven for general permits. More comprehensive infota
mwere meeting their WLAs and 464 (7%) were not meeting their WLAs. The mapped data toincomplete mapping, as the Permits GIS dataset is relatively newexpectation is that the quality of the dataset will continue to improve resulting in better permit coverage. For the purpose of this analysis, the mapped portion of the permits provided the best avmapped permits meeting their WLAs (93%) and not meeting their WLAs (7%) was similar to that of the 9,703 candidate priority permits meeting their WLAs (95%) and not meeting their WLAs (5%). Similarity inpermits that were not mapped, this may have increased the evidence of total numbers of TMDLs wpermits meeting WLAs by one‐third.
14

FY2010 National Report on Implementing TMDLs – Doc. No. EPA841-R-11-002, March 2011
The number of mapped PS TMDLs (2,671 or 17%) containing all three necessary elements required for this analysis significantly reduced the number of fully assessable PS TMDLs. This proportion still represents a robust subset of TMDLs approximately 20 times the size of a TMDL sample design capable of providing statistically significant results on a national level. The subset of TMDLs that could not be assessed appears to be the result of a cumulative effect of the three data sources’ individual gaps. As noted above, despite the significant size of the gap, there was no evidence that it represented any significant coverage bias. Generally minor mapping errors also contributed to reducing the total number of PS TMDLs for which a
me
ed to
re
s .
PS TMDLs to 30,702 (78%) of the total. The NPS projects GIS dataset also represents less than
00% of the projects tracked in the GRTS data system. Of the 8,931 projects in GRTS since 2002, 3,170 5%) h
in
ll the necessary data were available to assess WLA status. The 2002 Impaired Waters Baseline GIS Dataset and the 303(d) Listed Impaired Waters GIS Dataset have data gaps mainly due to the tilag continually associated with mapping the newest impaired waters and TMDLs and secondarily due a variety of minor state‐level mapping issues. NHD mapping inconsistencies also may have contributthe data gaps. For example, NHD contains polygons for which no artificial flow line has been generated,and it is possible that a number of polygonal features in the impaired and listed waters datasets wenot included in this analysis due to the lack of flow lines. Another data gap is associated with permits that might be associated with a PS TMDL but are located on a different Reach Code than the PS TMDL itself. This situation might arise from permits issued to dischargers that are located upstream from an impaired waterbody, yet included in a watershed TMDL. This study did not estimate how many PS TMDLs might fall under such a scenario, but it is likely that not accounting for upstream permit locationfurther contributes to underestimating the total number of PS TMDLs with known permit WLA status Like the PS TMDLs described above, the 39,478 NPS TMDLs are comprehensively documented in ATTAINS and data gaps are likely minor, but the same lag time in GIS data development reduced themapped N1(3 ave been mapped, and mapping of GRTS Section 319 projects was not conducted before 2002. As the third primary element for NPS analysis, GRTS has comprehensive coverage of Section 319 projects throughout the history of the program but its field that directly addresses TMDLs has beenuse only since 2002. Further, mapping has not been required for Section 319 statewide program implementation efforts or education/outreach efforts, both of which may be related to TMDLs. Thus, a potentially significant number of TMDL and Section 319 relationships could be undocumented in GRTS pre‐2002, or in the unmapped proportion of TMDLs and Section 319 relationships. The 2,438 mapped NPS TMDLs with all three necessary data sources equals just 8% of all mapped NPS TMDLs, but it should be noted that Section 319 projects are not the exclusive or the largest source of NPS implementation activities. Thus the data gap’s unassessed NPS TMDLs may include TMDLs that are being implemented by other NPS‐related activities, implemented by unmapped or unreported Section 319 projects, or not implemented. Similar to the analysis for the PS TMDLs, the geospatial analysis for the NPS TMDLs also was limited by data gaps associated with mapping and the inability to track the relationship between TMDLs and upstream locations of associated Section 319 projects. These data gaps contributed to undercounting the number of NPS TMDLs with Section 319 projects contributing to implementation in this analysis. It is important to note that the group called “uncertain relationship to co‐occurring TMDL” was based on two sources. In the geospatial data, some Section 319 projects were shown to co‐occur on the same water as a TMDL but had not reported a direct relationship to the TMDL, sometimes due to the project preceding the GRTS TMDL field’s availability. Other Section 319 projects had left the field blank
15

FY2010 National Report on Implementing TMDLs – Doc. No. EPA841-R-11-002, March 2011
o ed “N/A,” both of which imply that although the project’s primary purpose is likely not TMrelated, indirect relationships to TMDL implementation may exist. Thus, additional NPS TMDLs actually might have a Section 319 project on the same waterbody segment associated with their implementation. As data entry for the TMDL field in the GRTS dataset continues to increase and work continues on the GIS dataset, a more comprehensive list of NPS TMDLs is expected. In summary, the high cost
r check DL‐
s and logistical infeasibility of maintaining total coverage state and PA data systems concerning all TMDLs, Section 319 projects, and permits cause significant data gaps, ut high
d
Eb numbers of TMDLs can still be assessed. The gaps limit the ability of this study to report on percentages of all TMDLs being implemented with statistical confidence, but they do not prevent the ability to report on a subset of sufficiently documented TMDLs in terms of the numbers of PS TMDLs anNPS TMDLs with implementation occurring. The thousands of TMDLs that did have sufficient data to assess their implementation were not a probabilistic statistical sample. Thus, the figures presented as percents refer to the proportion of TMDLs with sufficient data and are not meant to represent percentages of all TMDLs implementing permits or Section 319 projects. Yet, no biases were identifiedin this subset of TMDLs that would suggest the TMDLs with sufficient data have a higher, or lower, implementation rate than TMDLs in general. The available data, the size of the data gaps, and what is known about the data gaps, do suggest that the actual national totals of PS and NPS TMDLs being implemented far exceed the numbers counted in this assessment.
Discussion and Conclusions EPA, states and others have long maintained a keen interest in knowing more about TMDL implementation, but aside from case studies implementation results have remained elusive. In early 2008, there were virtually no methods available to use EPA data systems to count or estimate implementation of PS TMDLs or NPS TMDLs on a national basis. A very limited TMDL implementation tracking concept was costed out as requiring a data systems budget of over $10 million per year, even with caveats that said decentralized implementation, lack of reporting authority, non‐response, aother factors would cause significant data gaps in such a system. A probabilistic survey approach couldobtain statistically valid implementation estimates of a few primary implementation rates but woualso require several hundred thousand dollars and well over a year to complete. One six‐state, probabilistic statistical sampling study found an implementation rate exceeding 80% (Tetra Tech, Inc., 2009; EPA, 2009), but the sampling experience indicated that higher logistical difficu
nd
ld
lties and expense ould challenge such a survey at national level.
and on,
present a minority of all TMDLs, yet the TMDLs at had evidence of implementation occurring numbered in the thousands. Of those TMDLs that could e asse
w
The geospatial data representing TMDLs, impaired waters, Section 319 projects, and permits changed significantly between 2008 and the present. The ATTAINS data system reporting of WLAs,GRTS data system reporting of projects implementing TMDLs, both continued to improve. In additithe priority permits initiative added a procedure for nationally evaluating permits with WLAs from TMDLs. Together, these factors opened an opportunity to assess implementation for a significant number of PS and NPS TMDLs.
The TMDLs that could be assessed in this study re
thb ssed, the proportions that are implementing are substantial. This finding is consistent with otherstatistical studies of TMDLs that show a majority undergoing implementation. Analysis of the data gaps appears to indicate that, were it possible to analyze many more TMDLs similarly, much more
16
FY2010 National Report on Implementing TMDLs – Doc. No. EPA841-R-11-002, March 2011
implementation would be found. This assessment approach can be repeated periodically, provided thathe key data sources and data systems are able to keep pace with TMDLs, permits, and Section 319 projects. Improvements in these data systems are likely to show much better numbers inimplementation if they can reduce the data gaps that limited this study’s findings.
t
TMDL
oticeN This study was performed by the US Environmental Protection Agency Office of Water in
Washington, DC. The document has undergone program review and approval for online publication. Publication does not signify that the contents necessarily reflect the views and policies of the USEPA. Mention of commercial or trade names does not constitute endorsement for use. This document should be cited as: EPA. 2011. FY2010 National Report on Implementing Total Maximum Daily Loads (TMDLs). Document #EPA841‐R‐11‐002. Office of Water, US Environmental Protection Agency, Washington DC. Availabonline at http://water.epa.gov/lawsregs/lawsguidance/cwa/tmdl/results_index.cfm
le 17 pp.
References EPA. 2009. Analysis of TMDL Implementation Rates in EPA Region 5: Final Report. Document #EPA841‐‐005.
st
R Office of Water, US Environmental Protection Agency, Washington DC. 44 pp. EPA. 2011. National Summary of Impaired Waters and TMDL Information. Accessed 3/3/11, laupdated 3/3/11. URL: http://iaspub.epa.gov/waters10/attains_nation_cy.control?p_report_type=T. Federal Water Pollution Control Act of 1972 (FWPCA). 1972. Public Law 92‐500, 86 Stat. 816. Amendin 1977 and 1987, referred to as the Clean Water Act, codified at 33 U.S.C. 1251‐1387 (1988) OIG. 2007. Total Maximum Daily Load Program Needs Better Data and Measures to DemonstraEnvironmental Results, OIG Report No. 2007‐P‐00036 Office of the Inspector General, US EnvironmentaProtection Agency, Washington DC. 30 pp.
ed
te l
etra Tech, Inc. 2009. Analysis of TMDL Implementation Rates in EPA Region 5. Project Report, USEPA Office o
Tf Water Contract # EP‐C‐08‐004. Cleveland, Ohio. 33 pp.
17