fy14 narrative with signature - illinois.gov · or argued that the employee assumed certain risks...
TRANSCRIPT

ILLINOIS WORKERS’ COMPENSATION COMMISSION Fiscal Year 2014 Annual Report
Bruce Rauner Governor
Joann M. Fratianni Chairman

TABLE OF CONTENTS
Letter to Governor Rauner .............................................. 1
Highlights ........................................................................ 2 Mission Statement ........................................................... 2 Overview of Workers' Compensation ............................. 3 Board Members ............................................................... 4 Financial Information ...................................................... 5 Insurance ......................................................................... 8 Administration .............................................................. 10 Statistics ........................................................................ 11 Interstate Comparisons ................................................. 19 References .................................................................... 23
COMMISSION OFFICES
100 W. Randolph #8-200 1014 Eastport Plaza Dr. Chicago, IL 60601 Collinsville, IL 62234 312/814-6611 618/346-3450 401 Main Street, 6th floor 200 S. Wyman Peoria, IL 61602 Rockford, IL 61101 309/671-3019 815/987-7292
4500 S. Sixth St. Frontage Road Springfield, IL 62703 217/785-7087
Toll-free: 866/352-3033 (within Illinois only) TDD: 312/814-2959 Website: www.iwcc.il.gov E-Mail: [email protected]
This report was posted online in June 2015 by the authority of the State of Illinois. No printing order number was used. 100 copies were printed on recycled paper using soy-based inks at a per-copy price of $

1
Illinois Workers’ Compensation Commission 100 W. Randolph St., Suite 8-200 Chicago, IL 60601 312-814-6500
Bruce Rauner, Governor Joann M. Fratianni, Chairman
June 16, 2015 The Honorable Bruce Rauner Governor, State of Illinois 207 State House Springfield, IL 62706 Dear Governor Rauner: On behalf of the entire Workers’ Compensation Commission, I am pleased to submit the Fiscal Year 2014 annual report. Workers’ compensation costs are declining. Insurers reported a 19% decrease in total benefit payments (loss costs) between 2011-2015. The Workers’ Compensation Research Institute found that Illinois experienced the largest decrease in the average medical payment per claim among study states. The Oregon study found Illinois experienced the largest savings on workers’ compensation insurance. More good news: in FY14, the first two felony convictions came in against employers that failed to follow the law to buy workers’ compensation insurance. These employers were given many opportunities to obtain insurance, but they refused. Uninsured employers put their workers at risk and they enjoy an unfair competitive advantage over law-abiding employers. These convictions strike a blow for a safer, more competitive Illinois economy for all. My goals for the upcoming year are to instill professionalism, increase efficiency, and improve technology at the Commission. Through this effort, we will improve the administration of the Illinois workers’ compensation program. We appreciate your leadership and support in this process. Sincerely,
Joann M. Fratianni Chairman

2
HIGHLIGHTS • Illinois insurers reported a 19% drop in benefit payments (loss costs) between 2011-2015.
• Illinois experienced the largest decrease in the average medical payment per claim among WCRI study states, and moved from the highest state to near the median. For all cases, Illinois’ average medical payment per case fell 16% from 2010-2012. Importantly, there was little change in utilization, meaning providers did not provide more services to make up for the lost income.
• The Commission established fee schedule values for 16,000 medical procedures that had previously defaulted to POC53.2 (payment at 53.2% of charge). Payers and providers both benefit from clearly defined maximum reimbursement amounts.
• The closely-watched Oregon study found that Illinois had the largest decrease in premiums among all the states, dropping from the 4th highest to the 7th highest between 2012-2014. And the effects of some of the 2011 legislative changes have yet to register.
• The Illinois 2011 injury rate is 66% lower than in 1990. The overall injury rate in Illinois is lower than most states, and has declined dramatically over the years. Roughly 3% of Illinois workers experience an injury each year; only 1% loses time from work.
• The first two felony convictions against uninsured employers occurred in FY14. Both employers were given many opportunities to obtain insurance before charges were filed, but they refused. Employers that fail to follow the law put their workers at risk, and they enjoy an unfair competitive advantage over law-abiding employers.
• Fines collected from uninsured employers are used to pay benefits to the injured workers of uninsured employers. Unfortunately, the Commission paid only 79% of the benefits due, based on the claims-to-collections ratio.
• For the first time, the Commission translated the handbook into Polish, and created web pages in Polish and Spanish.
MISSION STATEMENT The Illinois Workers’ Compensation Commission resolves claims made by injured workers for injuries arising out of and in the course of employment. The Commission strives to assure financial protection for injured workers and their dependents at a fair cost to employers. The Commission performs three main functions: 1) Resolves claims. The Commission strives to provide a fair, timely process by which disputed claims
may be resolved. 2) Ensures compliance with the law. The Commission protects the rights of employees and employers
under the Illinois Workers’ Compensation and Occupational Diseases Acts. 3) Administers self-insurance. The Commission evaluates and approves eligible employers that wish
to insure themselves for their workers’ compensation liabilities. The Commission strives to accomplish these goals while looking constantly for ways to improve the quality of service.

3
OVERVIEW OF WORKERS’ COMPENSATION Workers’ compensation laws were the first acts of social legislation passed in the United States. At the beginning of the 20th century, employers feared the assumption of liability for work injuries would destroy their businesses, while workers feared financial ruin from disabling injuries. Before the advent of workers’ compensation laws, an injured worker had to file a lawsuit against the employer, and prove the employer had failed to provide a safe workplace, to warn of danger, or to provide enough appropriate fellow workers. The employer then could present a defense that blamed the injured worker’s contributory negligence, or attributed the injury to the negligence of a fellow servant, or argued that the employee assumed certain risks in accepting the job. The process was prolonged and uncertain, with large risks to both employee and employer. The employer’s liability was unlimited. The high injury and death rates throughout the Industrial Revolution and growing dissatisfaction with the common law gradually led to the enactment of employer liability acts. Employers were held more responsible for negligence, but employees still had to file lawsuits for damages. The first workers’ compensation law originated in Germany in 1884. Similar laws passed in other European countries. In the U.S., workers’ compensation laws were passed on a state-by-state basis. Most of the early laws covered only hazardous occupations and were found unconstitutional. Maryland passed the first act in 1902. Wisconsin’s law of 1911 was the first that withstood legal challenges. Illinois also passed its first law in 1911, effective May 1, 1912.1 It took until 1948 for all states to establish a law. Workers’ compensation laws balance competing interests: employees give up their right to sue in civil court and potentially win large awards in exchange for more modest but prompt compensation; employers give up their common law defenses in exchange for limits on their liabilities. Workers’ compensation was established as a no-fault system. Originally, the courts administered the Act, but the volume overwhelmed the courts. On July 1, 1913, a three-member Industrial Board was created.2 In 1917, a five-member Industrial Commission was created within the Illinois Department of Labor.3 In 1957, the Commission separated from the Department of Labor and became a self-standing agency.4 On January 1, 2005, the agency officially became the Illinois Workers’ Compensation Commission. 5 Almost every employee who is hired, injured, or whose employment is located in Illinois is protected by the Illinois Workers’ Compensation Act. When an injury is caused by work, the injury is compensable according to the Act. Benefits may include an award for medical treatment, lost income, and permanent disability. Illinois employers pay for workers’ compensation benefits through insurance policies or by becoming self-insured. Cases are first heard by Arbitrators, whose decisions may be appealed to Commissioners. Cases may proceed on to the Circuit Court, Illinois Appellate Court, and, if leave is granted, the Illinois Supreme Court. Most claims, however, are settled between the parties prior to, or subsequent to, the initial arbitration.
1 Act of June 10, 1911. 1911 Ill. Laws 315-26. 2 Act of June 28, 1913, sec. 1, § 13. 1913 Ill. Laws 346-347. 3 Act of May 31, 1917, sec. 1, § 13(a) and (b). 1917 Ill. Laws 498-99. 4 Act of July 11, 1957, sec. 1, § 13(a). 1957 Ill. Laws 2633. 5 P.A. 93-721.
4
BOARD MEMBERS
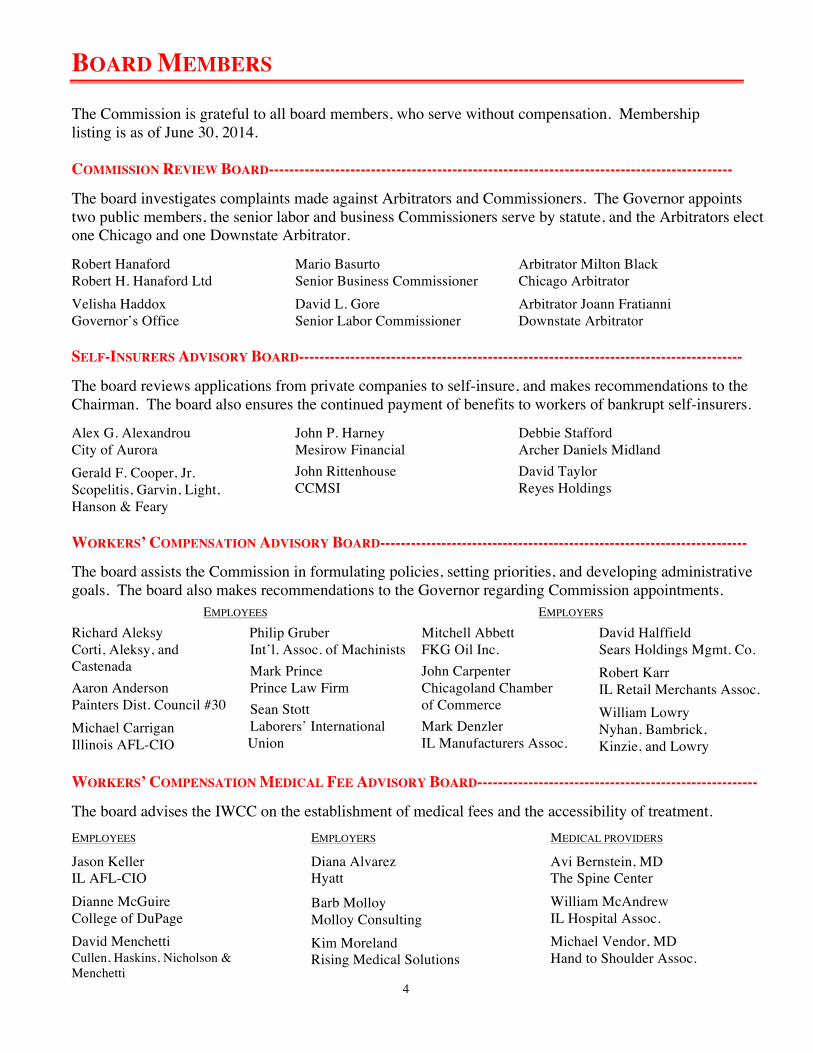
The Commission is grateful to all board members, who serve without compensation. Membership listing is as of June 30, 2014. COMMISSION REVIEW BOARD-------------------------------------------------------------------------------------------
The board investigates complaints made against Arbitrators and Commissioners. The Governor appoints two public members, the senior labor and business Commissioners serve by statute, and the Arbitrators elect one Chicago and one Downstate Arbitrator. Robert Hanaford Robert H. Hanaford Ltd
Velisha Haddox Governor’s Office
Mario Basurto Senior Business Commissioner
David L. Gore Senior Labor Commissioner
Arbitrator Milton Black Chicago Arbitrator
Arbitrator Joann Fratianni Downstate Arbitrator
SELF-INSURERS ADVISORY BOARD---------------------------------------------------------------------------------------
The board reviews applications from private companies to self-insure, and makes recommendations to the Chairman. The board also ensures the continued payment of benefits to workers of bankrupt self-insurers. Alex G. Alexandrou City of Aurora
Gerald F. Cooper, Jr. Scopelitis, Garvin, Light, Hanson & Feary
John P. Harney
Mesirow Financial
John Rittenhouse CCMSI
Debbie Stafford Archer Daniels Midland
David Taylor Reyes Holdings
WORKERS’ COMPENSATION ADVISORY BOARD------------------------------------------------------------------------
The board assists the Commission in formulating policies, setting priorities, and developing administrative goals. The board also makes recommendations to the Governor regarding Commission appointments.
EMPLOYEES EMPLOYERS
Richard Aleksy Corti, Aleksy, and Castenada
Aaron Anderson Painters Dist. Council #30
Michael Carrigan Illinois AFL-CIO
Philip Gruber Int’l. Assoc. of Machinists
Mark Prince Prince Law Firm
Sean Stott Laborers’ International
Union
Mitchell Abbett FKG Oil Inc.
John Carpenter Chicagoland Chamber of Commerce
Mark Denzler IL Manufacturers Assoc.
David Halffield Sears Holdings Mgmt. Co.
Robert Karr IL Retail Merchants Assoc.
William Lowry Nyhan, Bambrick, Kinzie, and Lowry
WORKERS’ COMPENSATION MEDICAL FEE ADVISORY BOARD-------------------------------------------------------
The board advises the IWCC on the establishment of medical fees and the accessibility of treatment.
EMPLOYEES
Jason Keller IL AFL-CIO
Dianne McGuire College of DuPage
David Menchetti Cullen, Haskins, Nicholson & Menchetti
EMPLOYERS
Diana Alvarez Hyatt
Barb Molloy Molloy Consulting
Kim Moreland Rising Medical Solutions
MEDICAL PROVIDERS
Avi Bernstein, MD The Spine Center
William McAndrew IL Hospital Assoc.
Michael Vendor, MD Hand to Shoulder Assoc.

5
FINANCIAL INFORMATION The Commission operates eight funds that are independent of the General Revenue Fund.
SPECIAL FUNDS 6/30/13 Plus Minus 6/30/14 Fund name Balance Income Expenses Balance
IWCC Operations Fund $21,765,017 $28,540,292 $26,254,471 $24,050,838
Injured Workers Benefit Fund $1,161,510 $1,879,407 $1,377,134 $1,663,783
Rate Adjustment Fund $8,657,559 $14,548,707 $11,200,422 $12,005,844
Second Injury Fund $1,193,218 $1,038,288 $1,377,500 $854,006
Self-Insurers Administration Fund $728,271 $385,676 $408,149 $705,798
Self-Insurers Security Fund $22,160,256 $520,969 $1,673,218 $21,008,007
Settlement Fund $30,874,048 $0 $0 $30,874,048
Transcript Deposit Fund6 $66,183 $1,974 $68,157 $0 ILLINOIS WORKERS’ COMPENSATION COMMISSION OPERATIONS FUND (OPS) 820 ILCS 305/4d; 215 ILCS 5/416
The Commission’s Operations Fund (OPS) was created in 2003 to pay for most of the administrative costs of the Commission.7 Illinois was the 46th state to create an independent source of funds for its workers’ compensation agency.
OPS revenues come from two sources. The Department of Insurance (DOI) collects a 1.01% surcharge on workers’ compensation insurance premiums. In FY14, DOI transferred $26.2 million to the Commission. The Commission assesses self-insured employers 0.0075% of payroll. In FY14, the Commission collected $2.5 million. INJURED WORKERS’ BENEFIT FUND (IWBF) 820 ILCS 305/4(d)
The Injured Workers’ Benefit Fund (IWBF) was created in 2005 to pay benefits to injured workers whose employers failed to provide workers’ compensation insurance and also failed to pay benefits to injured workers. The IWBF is funded solely through the fines collected from uninsured employers.
Each year, the fund pays benefits on cases that were closed in the previous year. In FY14, the IWCC collected approximately $1.9 million in fines, as shown in the income column. The Commission paid benefits to 41 injured workers whose cases were closed in FY14. See the Insurance Compliance section for more information.
6 A minor accounting adjustment was made to revise the FY2014 beginning balance to match with updated Comptroller reporting. 7 The Operations Fund supports expenditures that are appropriated by the General Assembly. Non-appropriated programs, including IWBF, RAF, SIF, SISF, SIAF, and SETT are excluded.
6
RATE ADJUSTMENT FUND (RAF) 820 ILCS 305/7-8
The Rate Adjustment Fund (RAF) was created in 1975 to pay cost-of-living increases to individuals who are either permanently and totally disabled or are the survivors of fatally-injured workers. Benefit payments are made each month to recipients, beginning on July 15 of the second year after the final award. Recipients are given an amount equal to the percentage increase in the Statewide Average Weekly Wage, as calculated by the Illinois Department of Employment Security.
Revenues are generated through assessments on self-insured employers and insurance companies. The assessment schedule and rates depend upon 1) indemnity benefits paid in the preceding six-month period; 2) estimated benefit expenditures; and 3) projected RAF balance. The Commission may assess up to twice a year at either half (0.625%) or full (1.25%) assessment rates. In FY14, the Commission issued a half assessment in the fall and a full assessment in the spring.
In FY14, the Commission paid $11.1 million of RAF payments to 1,343 recipients at an average monthly benefit of $687.
The Commission is restructuring the RAF program to provide a more accurate and efficient administration of this benefit. SECOND INJURY FUND (SIF) 820 ILCS 305/7-8
The Second Injury Fund (SIF) provides an incentive for employers to hire disabled workers by limiting the liability of those employers for the injured workers hired. If a worker who had previously incurred the complete loss of a member or the use of a member (one hand, arm, foot, leg, or eye) is injured on the job and suffers the complete loss of another member so that he or she is permanently and totally disabled (PTD), the employer is liable only for the injury due to the second accident. The SIF pays the amount necessary to provide the worker with a PTD indemnity benefit.
Similar to the RAF, the SIF program relies on revenues from self-insured employers and insurance companies, and bases assessments on the same factors. In FY14, the Commission issued a no assessment in the fall, and a full assessment (0.1250%) in the spring.
In FY14, the Commission paid $1.4 million of SIF benefits to 78 recipients at an average monthly benefit of $1,476. SELF-INSURERS ADMINISTRATION FUND (SIAF) 820 ILCS 305/4a-6.1
The Self-Insurers Administration Fund (SIAF) was created in 1988 to pay the administrative costs of the Commission’s self-insurance program. Revenues come from a $500 fee paid by private self-insured employers when applying for or renewing the privilege to self-insure. SELF-INSURERS SECURITY FUND (SISF) 820 ILCS 305/4a-5, 7
The Self-Insurers Security Fund (SISF) was created in 1986 to pay benefits to employees of private self-insurers that became insolvent after 1986. SISF also pays for a portion of operations costs related to the self-insurance program.

7
Self-insurance offers employers an alternative to conventional insurance. Qualified employers may manage their risk by controlling costs in an efficient manner and ensuring their injured employees receive timely and proper care. Employers that want to self-insure must show the Commission they meet certain financial requirements.
Revenues come from two major sources: assessments and securities (i.e., surety bonds, escrow deposits, and letters of credit). The securities are called when self-insured employers file bankruptcy and default on their obligations. A letter of credit may also be called as it approaches expiration and is not replaced.
The Commission may assess up to 1.2% of indemnity benefits paid during the preceding year. To determine if an assessment is needed, the Self-Insurers Advisory Board reviews the SISF fund balance and outstanding liabilities each quarter. Upon approval, the Board may assess current and former self-insured employers. In FY14, the Board determined that no assessment was needed.
In FY14, the Commission paid $1.3 million for SISF benefits. During the year, the Commission funded benefits for an average of 49 SISF recipients at an average monthly benefit of $2,175.8 SETTLEMENT FUND (SETT) 820 ILCS 305/7
The Settlement Fund was created in FY11 as a result of litigation between the State of Illinois and the Chamber of Commerce (Chamber of Commerce v. Filan, et al, case #04CH6750). At issue was the constitutionality of the IWCC Operating Fund surcharge. The litigation started in FY04 and was amicably resolved in FY10. During FY04-10, the State collected the surcharge revenues, but placed them in an escrow account. In FY10, a settlement agreement was entered into by the parties.9
By June 2011, $30.8 million had accrued in the Settlement Fund. Based on the terms of the agreement, the Commission may use these funds to pay for capital/systems improvements to the Commission’s Information Technology (IT) infrastructure or pay prior-year RAF liabilities.
In FY14, the Commission continued to work the Attorney General’s Office on the release of dollars from the Settlement Fund. The final payout of RAF liabilities is anticipated in FY2015. TRANSCRIPT DEPOSIT FUND (TDF) 820 ILCS 305/19a
The Transcript Deposit Fund (TDF) was created to cover the costs of transcripts copies and related document production. On June 28, 2013, Governor Quinn signed HB 3390 (Public Act 98-40), which eliminated the transcript fee, and directed all remaining funds in the TDF to be transferred to the IWBF. The Commission transferred most of the funds in August 2013, but left a small balance to cover outstanding expenses. The Commission conducted a second transfer at the end of FY14 to close the fund.
8 Unlike the RAF and SIF programs, which provide only cash benefits, SISF provides both indemnity and medical benefits. 9 On July 19, 2010, the Circuit Court gave order for Final Approval of the Settlement Agreement. The order established a Settlement Fund of $44.0 million, which was composed of $31.6 million from the Protest Fund and $12.4 million from the Escrow Account. A transfer of $13.2 million from the Fund to the General Revenue Fund (GRF) was made to release the loan of RAF from the GRF incurred in prior years in accordance with Public Act 094-0277, which authorized the State Comptroller and Treasurer to transfer at the request of the Chairman of the Commission up to a total of $19,000,000 from the GRF to the RAF to the extent that there were insufficient money in the RAF to pay claims and obligations.

8
INSURANCE Employers are responsible for the payment of benefits to injured workers. Employers are required to either purchase workers’ compensation insurance or obtain permission to self-insure. Between 2011-2015, advisory rates decreased more than 18%.10 Illinois insurers reported a 19% decrease in loss costs (benefit payments) from 2011-2015.11 Illinois has the most insurers selling workers’ compensation policies in the U.S.12 Since 2006, the number of insurance companies writing workers’ compensation policies has jumped 13%.13 INSURANCE COMPLIANCE PROGRAM
Illinois law requires employers to insure against workers’ compensation liabilities, but some employers fail to comply. These employers enjoy an unfair competitive advantage over law-abiding companies, while leaving employees vulnerable if accidents should occur. If the Commission finds that an employer knowingly and willfully failed to obtain insurance, the employer may be fined up to $500 for every day of noncompliance, with a minimum fine of $10,000. Corporate officers may be held personally liable if the company fails to pay the fine. An employer may also face criminal charges and/or a work-stop order for failing to obtain insurance. In FY14, the first two felony indictments for workers’ compensation were returned. Both employers were given many opportunities to obtain insurance before charges were filed, but they refused. Employers who fail to follow the law put their workers at risk, and they enjoy an unfair competitive advantage over law-abiding employers. In FY14, the Division collected $1.9 million in fines from 216 uninsured employers. These fines were used to pay benefits to 41 injured workers whose cases were closed in FY14. These workers received only 79% of benefits awarded, because the Commission pays out only those funds collected during the year. The IWBF makes only one payment to injured workers; if the fund cannot pay all benefits, payments are pro-rated. Unfortunately, the balance of the Injured Workers Benefit Fund (IWBF) could not cover all claims. This includes workers who were permanently and totally disabled, and who were killed. The Commission has hired additional investigators to increase compliance. INSURANCE FRAUD
The Illinois Department of Insurance investigates workers’ compensation fraud through its Fraud Unit, which is funded by the Commission. It is illegal for anyone—a worker, employer, insurance carrier, or medical provider—to intentionally make a false statement in order to obtain or deny workers’ compensation benefits, obtain workers’ compensation insurance at less than the proper rate, obtain approval to self-insure, etc. A “statement” includes any writing, notice, proof of injury, medical bill, record, report, or test result. More information is available at http://www.insurance.illinois.gov/wcfu/. 10 See “NCCI Proposes Decrease for Workers’ Compensation Advisory Loss Costs and Rates in Illinois.” 11 See NCCI “Illinois State Advisory Forum, 2014,” page 25. 12 See IDOI “Insurance Oversight Report,” page 1. 13 See IDOI Market Share Reports.

9
RESIDUAL INSURANCE MARKET
Employers that cannot obtain workers’ compensation insurance in the open market may buy it through the residual market. The chart below shows the residual market written premium as a percentage of the total direct written premium. Employers in the residual market pay 50% more than the voluntary market. Although insurers’ costs have been dropping, the proportion of Illinois employers in the residual market nearly doubled in 2012. Illinois represents 2/3 of the entire U.S. market.14
WORKERS’ COMPENSATION INSURANCE RESIDUAL MARKET IN ILLINOIS
IL as % Illinois National of National
2000 3.5% 3.4% 102% 2005 7.6% 11.6% 66% 2010 2.7% 4.6% 59%
2011 2.7% 5.0% 54% 2012 4.3% 6.5% 66%
SELF-INSURANCE
Private employers may obtain approval to insure themselves for their workers’ compensation liabilities, or they may join a pool of other employers. The Commission evaluates individual self-insurers, while the Illinois Department of Insurance evaluates insurance pools. Public employers may self-insure without obtaining approval. All together, self-insured employers pay 25% of benefits.15
PARENT COMPANIES IN THE COMMISSION’S SELF-INSURANCE PROGRAM
# Parent Date Companies
6/30/00 361 6/30/05 319 6/30/10 268
6/30/11 249 6/30/12 241 6/30/13 240 6/30/14 236
14 See NCCI Annual Statistical Bulletins, Exhibit 13. 15 See NASI Workers’ Compensation: Benefits, page 20.
10
ADMINISTRATION At the end of FY14, the Commission consisted of the Chairman, nine Commissioners, 154 employees, and five employees in the separately funded Self-Insurance Division, for a total of 169 people.16 During FY14, the Commission made the following improvements: DOWNSTATE ARBITRATORS MOVED TO NEW HEARING SITES
As directed by House Bill 1698 (Public Act 97-18), the Commission rotated arbitrators among the Downstate hearing sites. This law provides that arbitrators may not serve more than two years of any three-year term in a single Downstate county. LANGUAGE INTERPRETATION SERVICES OFFERED
As directed by House Bill 3390 (Public Act 98-40), the Commission now provides language interpreters for petitioners without attorneys who are signing settlement contracts. Also, for the first time, the Commission translated the handbook into Polish. We also created web pages in Polish and Spanish. DOLLAR VALUES ASSIGNED TO 16,000 MEDICAL PROCEDURES IN FEE SCHEDULE
On October 11, 2013, the Commission posted fee schedule amounts for 16,000 Professional Services procedures that had defaulted to POC53.2 (Pay 53.2% Of Charge). Payers and medical providers both prefer the clarity of a defined maximum reimbursement level. COMMISSION DECISIONS POSTED ONLINE
The Commission now posts Commission-level decisions online. INTERAGENCY AGREEMENT SIGNED FOR ELECTRONIC ACCIDENT REPORTING
In February 2014, the Commission signed an interagency agreement with the University of Illinois to create an electronic accident reporting system in the Release 3 national format established by the International Association of Industrial Accident Boards and Commissions (IAIABC). TRANSCRIPT DEPOSIT FUND ELIMINATED
As directed by House Bill 3390 (Public Act 98-40), the Commission eliminated the $35 transcript fee for parties appealing decisions from the Commission to the Circuit Court. On 6/30/14, the Commission eliminated the Transcript Deposit Fund. This change eliminates administrative work for a minor fee.
16 Temporary employees, summer workers, and employees on leave were not included.

11
STATISTICS Each year in Illinois, approximately 200,000 work-related accidents occur. In most of these cases, the worker does not lose time from work. Fewer than 50,000 claims are filed with the Commission. The statistics in this section refer only to those cases that are filed with the Commission. The flowchart below illustrates the main process. Note that cases can go back and forth, and there are other processes to hear insurance compliance cases, motions, etc.
Employee reports injuryto employer
~200,000/year
Employer reports to Commission injuries
of more than 3 lost workdays~65,000/year
Parties Parties do not resolve case resolve case
Employee files claimat Commission
50,000/year
Arbitrator dismisses case5,000/year
Appeal tocommissioner 50% appealed
Commissioner dismisses case100/yr.
Appeal toCircuit Court25% appealed
Circuit Ct. issues opinion250 - 300/year
Appeal toAppellate Court
Appellate Ct. issues opinion100/year
Appeal toSupreme Court5% appealed
Supreme Ct. issues opinion1/year
Arbitrator issues decision 3,000 - 4,000/year
Panel issues decision 1,500/year
Arbitrator settles case 40,000/year
Commissioner settles case 500/year

12
ACCIDENT
Cases are assigned to the hearing site nearest the site of the accident. If the accident occurred outside of Illinois, the case is assigned to the hearing site closest to the petitioner’s home; if the petitioner lives outside of Illinois, the case is set at the site most convenient to the parties.
In January 2015, new hearing sites were created in Kankakee and Elgin. The following table lists the current zones and hearing sites.
NEW CLAIMS FILED IN FY14 Chicago (1 hearing site) 18,665 (43% of total) Downstate (18 sites) 25,068 (57% of total) Zone 1 Zone 2 Zone 3 Zone 4 Zone 5 Zone 6 Collinsville/Belleville Quincy Bloomington Kankakee Rockford Elgin 2,350 (5%) 404 (1%) 992 (2%) 335 (1%) 1,785 (4%) 489 (1%) Herrin Springfield Peoria New Lenox Waukegan Geneva 1,140 (3%) 1,861 (4%) 1,630 (4%) 2,584 (4%) 1,739 (4%) 1,710 (4%) Mt. Vernon Urbana Rock Island Ottawa Woodstock Wheaton 1,209 (3%) 1,478 (3%) 1,102 (3%) 750 (2%) 654 (1%) 2,855 (7%) Zone total 4,699 (11%) 3,743 (9%) 3,724 (9%) 3,669 (8%) 4,178 (10%) 5,054 (12%) Because of rounding, percentages may not add up to 100%.
CASES OPENED
Filings have been generally declining for years, but they increased slightly in FY14. Workers hire attorneys in 89% of new cases.
CASES OPENED FY10 FY11 FY12 FY13 FY14
New claims filed 50,854 50,381 46,689 42,543 43,732 Reinstated 1,511 1,659 1,592 1,594 1,387 Remanded to Arbitrator 396 486 505 439 353 Remanded to Commissioner 22 21 22 48 61 Total cases returned to caseload 1,929 2,166 2,119 2,081 1,801 Total additions to the caseload 52,783 52,547 48,808 44,624 45,533 Change from previous year (8%) (0%) (7%) (9%) 2%

13
CASES CLOSED
As in other court systems, most cases filed at the Commission are settled. Note that the figures below report only the final action on a case. If a case had more than one action (e.g., a case was decided at arbitration, then decided on the Commission level, then settled), only the final action is reported here. An arbitration case is counted as closed if it was dismissed, settled, or if a decision was issued and no appeal was filed.17
CASES CLOSED BY ARBITRATORS FINAL ACTION FY10 % FY11 % FY12 % FY13 % FY14 %
Voluntary dismissals 606 569 587 607 629 DWP 4,390 4,930 4,422 4,663 3,881 Total dismissals 4,996 9% 5,499 11% 5,009 11% 5,270 12% 4,510 10%
Original settlements 7,853 6,786 5,895 4,925 4,610 SC before arb. dec. 38,691 35,322 33,778 33,496 33,258 SC after arb. decision 985 973 778 759 578 Total settlements 47,529 88% 43,081 87% 40,451 87% 39,180 86% 38,446 87%
Arbitration decisions18 1,601 3% 1,066 2% 1,020 2% 1,048 2% 1,113 3%
Total 54,126 49,646 46,480 45,498 44,069
CASES CLOSED BY COMMISSIONERS Dismissals at review 176 10% 117 8% 175 10% 201 11% 162 11%
SC before arb. decision 109 43 191 111 110 SC before review dec. 200 117 195 193 144 SC after review dec. 108 83 97 126 109 Total settlements 417 23% 243 16% 483 27% 430 24% 363 26%
Review decisions18 1,201 67% 1,130 76% 1,158 64% 1,162 65% 890 63%
Total 1,794 1,490 1,816 1,793 1,415
TOTAL CASES CLOSED Dismissals 5,172 9% 5,616 11% 5,184 11% 5,471 12% 4,672 10% Settlements 47,946 86% 43,324 85% 40,934 84% 39,610 84% 38,809 85% Decisions 2,802 5% 2,196 4% 2,178 5% 2,210 5% 2,003 4%
Total 55,920 51,136 48,296 47,291 45,484 Change from previous year (5%) (9%) (6%) (2%) (4%)
17 “DWP” refers to cases that were Dismissed for Want of Prosecution. “Original settlements” are settlements that were filed without a prior application. “SC” refers to settlement contracts. 18 The total number of decisions issued may be found on the following page.

14
DECISIONS ISSUED
While most cases are settled, the more complex cases usually go to trial. Cases involving novel or difficult issues are often appealed. Out of 200,000 work-related injuries that occur each year, only about 400 cases remain unresolved as they are appealed from the Commission to the circuit courts.19
DECISIONS AND APPEALS Arbitration % Commission % Circuit Ct. Appellate Ct. Supreme Ct. Decisions Appealed Decisions Appealed Decisions Opinions/Orders Opinions
2010 3,581 49% 1,503 26% 295 119 1 2011 3,171 55% 1,405 25% 218 140 0 2012 3,096 57% 1,410 29% 245 109 0 2013 3,326 57% 1,504 27% 219 128 1 2014 2,693 52% 1,069 26% 202 113 0 Outcome of appeals. Parties have the right to appeal Arbitrators’ decisions, but history has shown that Commissioners most often affirm the Arbitrators’ decisions. Petitioners (workers) appeal in hopes of higher benefits, but 83% of the time their appeals do not result in higher benefits. Similarly, 70% of cases appealed by Respondents (employers) do not result in lower benefits. Trends. Under Section 19(b-1), an injured worker who is not receiving temporary total disability or medical benefits may petition for an emergency hearing. Alternately, the worker may choose to file under 19(b) if he or she is not receiving TTD or medical benefits. Over the years, there has been a clear shift from 19(b-1) petitions, which involve statutorily set deadlines, to 19(b) petitions. Each year, Arbitrators issue fewer than a dozen 19(b-1) decisions and less than 1,000 19(b) decisions.
GENDER
Women constitute 47% of the Illinois workforce,20 but they file a smaller share of claims. This may be because the most dangerous industries—construction, agriculture, and transportation—are still male-dominated. Over the years, the proportion of female claimants has increased from 22% of claimants in FY85 to 35% in FY14.
INJURY RATES
The statistics in this section come from the National Council on Compensation Insurance (NCCI) and the U.S. Bureau of Labor Statistics (BLS), which use different methods. NCCI excludes self-insurers, while the BLS nonfatal survey is prone to sampling error. Despite these limitations, these two sources produce the best data now available.
Both data sets indicate that 3.2-3.5% of Illinois workers were injured each year. Only 1% loses time from work. For decades, the overall injury rate in Illinois has been below average and continues to drop. The NCCI 2011 injury rate is 66% lower than 1990.
19 Commission figures are for the fiscal year. Court figures are for the calendar year. 20 See http://www.bls.gov/lau/#ex14

15
NCCI DATA
PERCENTAGE OF WORKERS EXPERIENCING WORK-RELATED INJURIES IN ILLINOIS EACH YEAR BY INJURY TYPE21
Policy Medical Temporary Permanent Permanent Year Only Total Partial Total Fatal Total
1990 6.9% 1.66% 0.92% .004% .007% 9.5% 1995 4.9% 1.23% 0.68% .004% .004% 6.8% 2000 3.9% 0.84% 0.69% .007% .005% 5.4% 2005 2.6% 0.60% 0.54% .013% .002% 3.7% 2010 2.2% 0.53% 0.56% .002% .002% 3.3% 2011 2.1% 0.51% 0.55% .001% .002% 3.2% BLS DATA
RATE OF NONFATAL WORK-RELATED INJURIES AND ILLNESSES IN ILLINOIS IN 201222
Workers’ Nonfatal Injury Rate by Industry Number of Private Sector Workers’ Injuries
Government 8.2% Overexertion and bodily reaction 15,160 Manufacturing 4.5% Contact w. object, equipment 10,320 Natural resources and mining 4.4% Fall, slip, trip 8,790 Construction 3.7% Transportation accident 1,590 Services 2.9% Exposure to harmful substance/environ. 1,520 Violence—intentional injury 490 Incidence rate for all workers 3.5% Fire or explosion 20
DISTRIBUTION OF 146 FATAL WORK-RELATED INJURIES
IN ILLINOIS IN 201223 Distribution by Industry Distribution by Event Goods-producing 31% Transportation incident 36% Agriculture 6% Violence/injuries 22% Construction 11% Falls, slips, trips 17% Manufacturing 12% Contact with objects/equip. 12% Service-providing 59% Exposure to harmful substance 7% Trade 15% Fires and explosions 5% Transportation 22% Government (state and local) 10%
21 See NCCI Annual Statistical Bulletin, 1994 – 2014 editions, Exhibit XII First Report data. Figures for fatalities and PTDs come from a small number of cases and should be viewed with caution. This information refers only to the experience of employers with insurance, not self-insurers. The NCCI updated figures from earlier reports. 22 See http://www.idph.state.il.us/about/epi/cfoirpt.htm
23 See http://www.bls.gov/iif/oshwc/cfoi/tgs/2012/iiffw17.htm

16
MEDICAL CARE
It is estimated that, in Illinois, medical costs represent 49% of total workers’ compensation costs.24 As shown below, since 2010, Illinois medical costs are trending lower than the rest of the country.25
MEDICAL BENEFIT PAYMENTS $ in billions 2008 2009 2010 2011 2012
Illinois $1.44 $1.47 $1.43 $1.45 $1.19 % change from prior year 2% (3%) 2% (18%) U.S. nonfederal total $28.03 $27.12 $27.62 $29.45 $29.73 % change from prior year (3%) 2% 7% 1% The 2011 legislative changes started to take effect on June 28, 2011, with more changes taking effect through 2012-2013, as outlined below. February 1, 2006 Fee schedules take effect for treatment on or after this date February 1, 2009 Fee schedules were created for Ambulatory Surgical Treatment Centers and Hospital Outpatient services: before, treatment paid at 76% of charge (POC)
A new fee schedule was created for three Rehabilitation Hospitals June 30, 2009 Hospital Inpatient fee schedule converted to new MS-DRG coding system May 21, 2010 Fee schedule created for Ambulatory Surgical Treatment Centers in Geozip 607, Chicago/Niles (formerly POC) July 6 – Oct. 28, 2010 Emergency rule limiting implant reimbursements in effect June 28, 2011 Physician-dispensed medicines capped
Ambulatory Surgical Treatment Center (ASTC) fee schedule expanded to include both licensed and certified ambulatory surgical centers
Out-of-state reimbursements reduced September 1, 2011 Implant reimbursements were again limited to 25% over invoice
All fee schedule amounts were cut by 30%
PPD awards hereafter shall consider AMA Guides rating
Utilization review provisions strengthened
Intoxicated injured workers barred from compensation January 1, 2012 Geozips were converted to regions, making reimbursements more consistent June 20, 2012 First dental fee schedule took effect
24 See NCCI Illinois State Advisory Forum, page 54. 25 See NASI Workers’ Compensation: Benefits 2012, pages 26-27. The 2013 report is expected in August 2015.

17
November 20, 2012 Reimbursement for repackaged drugs must now be based on the original National Drug Code (NDC) March 4, 2013 Preferred Provider Program (PPP) rules took effect: employer’s PPP counts as one of employee’s two chosen medical providers October 11, 2013 Roughly 16,000 Professional Services procedures that defaulted to POC53.2
were assigned dollar values, using non-Medicare Relative Value Units. Both payers and providers benefit from clear fee schedule amounts.
Clearly, these changes have saved money. Insurers reported that loss costs (benefit payments) fell 19% between 2011-2015.26 The Workers’ Compensation Research Institute (WCRI) reported that Illinois experienced the largest decrease in the average medical payment per claim among the study states, and had moved from the highest state to near the median.
The WCRI reported significant reductions in the growth of both indemnity and medical costs per case. Note that the average medical cost per case was 13% lower in 2013 than it was in 2010.27
AVERAGE COST PER CASE IN ILLINOIS FOR ALL CASES AT 12 MONTHS EXPERIENCE
Indemnity % Annual Medical % Annual Total Benefit % Annual Year Cost per case Change Cost per case Change Cost per case Change
2005 $1,649 6% $3,799 14% $5,448 11%
2010 $2,398 -3% $5,434 5% $7,832 3% 2011 $2,441 2% $5,276 -3% $7,717 -1% 2012 $2,346 -4% $4,570 -13% $6,916 -10% 2013 $2,389 2% $4,749 4% $7,138 3% Importantly, the WCRI found little change in utilization, meaning providers did not provide more services to make up for the lost income.28
PENALTIES
Under Section 19(k), the Commission may award the petitioner additional compensation equal to 50% of the amount of compensation payable at the time of the award if there was an unreasonable or vexatious delay of payment, or an intentional underpayment of compensation. Under Section 19(l), the Commission may award the petitioner $30 per day for every day that a cash or medical benefit has been withheld without good and just cause, up to $10,000.
26 See NCCI “Illinois State Advisory Forum, 2014,” page 25. 27 See WCRI CompScope (all) Benchmarks studies: Early Evidence 2013 57; Baseline for Monitoring 2012, page 50; and Baseline Metrics 2008, page 38. The WCRI did not publish 2012 data; Evelyn Radeva of WCRI emailed figures to IWCC. 28 See WCRI CompScope Medical Benchmark studies, 2008-2014, Figures 2, 30. Note the WCRI has two series of reports, one called Benchmarks, the other called Medical Benchmarks, whose methods and results vary slightly.
18
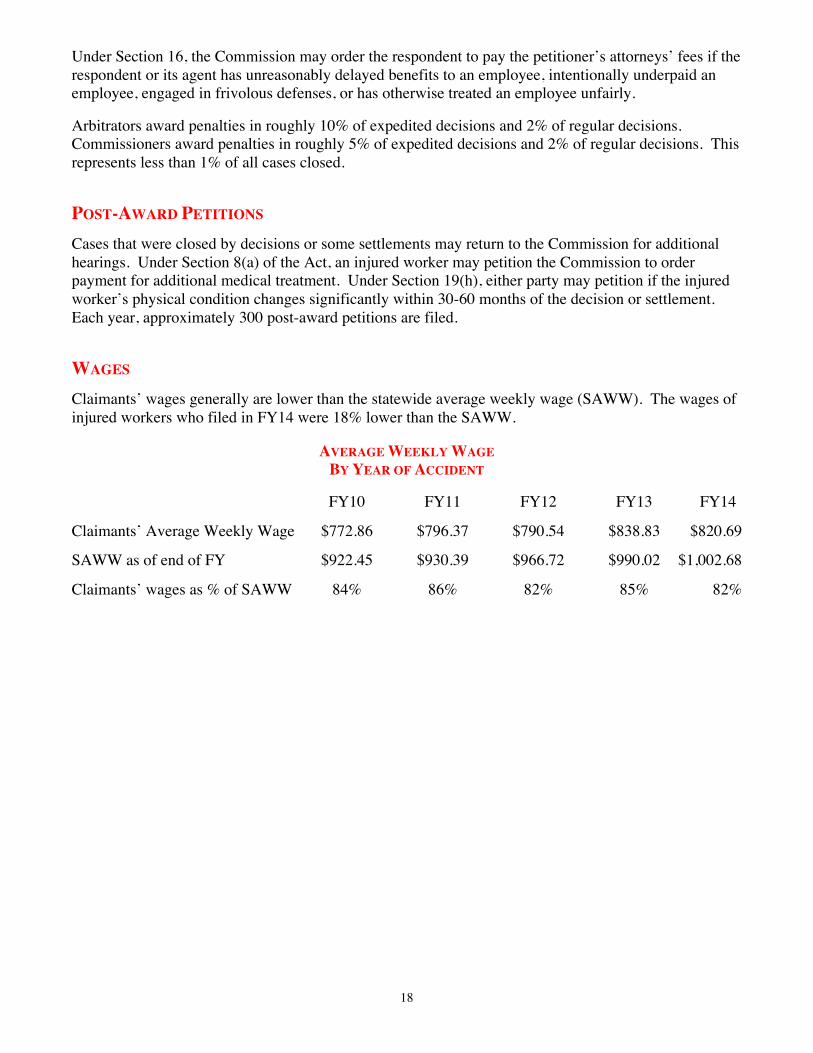
Under Section 16, the Commission may order the respondent to pay the petitioner’s attorneys’ fees if the respondent or its agent has unreasonably delayed benefits to an employee, intentionally underpaid an employee, engaged in frivolous defenses, or has otherwise treated an employee unfairly. Arbitrators award penalties in roughly 10% of expedited decisions and 2% of regular decisions. Commissioners award penalties in roughly 5% of expedited decisions and 2% of regular decisions. This represents less than 1% of all cases closed.
POST-AWARD PETITIONS
Cases that were closed by decisions or some settlements may return to the Commission for additional hearings. Under Section 8(a) of the Act, an injured worker may petition the Commission to order payment for additional medical treatment. Under Section 19(h), either party may petition if the injured worker’s physical condition changes significantly within 30-60 months of the decision or settlement. Each year, approximately 300 post-award petitions are filed.
WAGES
Claimants’ wages generally are lower than the statewide average weekly wage (SAWW). The wages of injured workers who filed in FY14 were 18% lower than the SAWW.
AVERAGE WEEKLY WAGE BY YEAR OF ACCIDENT
FY10 FY11 FY12 FY13 FY14
Claimants’ Average Weekly Wage $772.86 $796.37 $790.54 $838.83 $820.69
SAWW as of end of FY $922.45 $930.39 $966.72 $990.02 $1,002.68
Claimants’ wages as % of SAWW 84% 86% 82% 85% 82%

19
INTERSTATE COMPARISONS Experts advise that interstate comparisons of state workers’ compensation programs should be done with caution.29 Every study has some limitations, and no one measure can give a full picture of a state’s workers’ compensation program. Workers’ compensation benefits are often paid out for years, so it takes a long time to see the effects of a legislative change. And the goal is not the lowest cost possible, which could lead to a race to the bottom, but adequate benefits for workers delivered at a reasonable cost to employers. All information is the latest available.
BENEFITS PAID
Total benefits paid reflect employment levels and other factors, so this figure is not a clear indicator of workers’ compensation trends. Still, it is welcome news that the growth rate in Illinois has run below the national average for the past three years.30
TOTAL WORKERS’ COMPENSATION BENEFIT PAYMENTS
$ in billions 2008 2009 2010 2011 2012
Illinois $2.98 $3.06 $3.01 $3.05 $2.70 % change from prior year 6% 3% (2%) 1% (11%) U.S. nonfederal total $55.33 $54.89 $54.79 $57.26 $58.08 % change from prior year 4% (1%) (0%) 5% 1%
COMPLIANCE WITH 1972 RECOMMENDATIONS
In 1972, the National Commission on State Workmen’s Compensation Laws, appointed by President Nixon, unanimously listed 19 items as essential to an adequate system. Decades later, no state in the country meets all the requirements; Illinois meets more than most.31
NUMBER OF 19 ESSENTIAL RECOMMENDATIONS MET
Illinois 15.00
U.S. average 12.83
NEIGHBORING STATES LARGE INDUSTRIAL STATES
Iowa 15.50 Pennsylvania 13.75 Wisconsin 15.00 Texas 12.50 Missouri 13.75 California 12.00 Indiana 11.50 New York 10.75 Michigan 9.75 Florida 9.75
29 See Burton’s “Workers’ Compensation Costs for Employers,” pages 14-22. 30 See NASI Workers’ Compensation: Benefits 2012, pages 24-25. 31 See USDOL "State Workers’ Compensation Laws in Effect” Tables 1, 2.

20
COST TO EMPLOYERS
All things being equal, a state with higher wages will have higher workers’ compensation benefit and insurance costs. Illinois is consistently in the top 10 wage states, with wages 6% above average, so one would expect employers’ workers’ compensation costs to be higher.32 How much higher? Studies indicate that Illinois is either 4% higher, or 18% higher, or 27% higher, indicating the way different methodologies yield different results, and the need to read headlines with caution. See the footnotes for the limitations of each study, and the time periods covered.
The National Academy of Social Insurance (NASI) found Illinois employers’ workers’ compensation costs to be only 4% higher than the norm. Note also the general downward trend of costs. The 2013 figures are expected in August 2015.
NASI ESTIMATE OF EMPLOYER COSTS33 Per $100 of payroll/ 2006 2010 2012
Illinois $1.44 $1.32 $1.34 National nonfederal $1.54 $1.19 $1.29
IL v. National nonfederal (6%) 11% 4% The National Council on Compensation Insurance (NCCI) analyzed pure loss costs (the percentage of premium that pays benefits), and found those in Illinois were 18% higher.34 The Oregon study, which has received the most attention, found the highest variance. When the 2010 Oregon report ranked Illinois as the 3rd most expensive state for workers’ compensation insurance, it contributed to the drive for cuts in benefits, which took effect in stages beginning June 28, 2011. Some of the changes, such as the cap on wage differential benefits, will take years to register. Subsequent reports moved Illinois down to #4 in 2012 and #7 in 2014. The 2014 report also found Illinois led the nation in workers’ compensation premium savings.
OREGON ESTIMATE OF PREMIUM RATES35 % Change Per $100 of payroll/ 1994 2000 2006 2010 2012 2014 2012-2014
Illinois $5.48 $2.74 $2.69 $3.05 $2.83 $2.35 (17%) Median $4.35 $2.26 $2.48 $2.04 $1.88 $1.85 (2%)
IL as % over median 26% 21% 8% 50% 51% 27% IL rank among 51 9 15 20 3 4 7
(1= most expensive)
32 See http://www.bls.gov/cew/cewind.htm#year=2013&qtr=A&own=0&ind=10&size=0 33 See NASI Workers’ Compensation: Benefits, Coverage, and Costs 2012 report (issued in 2014), pages 32-39; 2010 report, page 34. For employers that buy insurance, cost = insurance premiums + estimated deductibles; for self-insured employers, cost = benefit costs + estimated administrative costs. Costs also include self-insurers’ data, as well as payments to Second Injury Funds, Rate Adjustment Funds, etc. NASI says it may underestimate costs. 34 See NCCI “Illinois State Advisory Forum, 2014,” page 27. The study covers the most recent year available (a mix of 2013- 2015); analyzes only the cost of paying benefits, not administrative costs, dividends, taxes, profits, etc.; does not cover all states; and excludes all self-insurers. 35 See “Oregon Workers’ Compensation Premium Rate Ranking Summary.” The study compares only 50 class codes out of 700; it applies the Oregon employment mix to all other states, which skews the results; and it does not consider discounts—Illinois reportedly gives more discounts than most states—so Illinois rates look higher than they are.

21
COVERAGE OF EMPLOYEES
More workers are covered under the law in Illinois than in most other states.36
PERCENTAGE OF EMPLOYEES COVERED Illinois 99.8% U.S. nonfederal average 97.1%
NEIGHBORING STATES LARGE INDUSTRIAL STATES
Indiana 99.5% California 100.0% Iowa 99.1% New York 99.8% Wisconsin 97.1% Pennsylvania 99.7% Michigan 97.0% Florida 94.8% Missouri 95.4% Texas 80.6%
DURATION OF DISABILITY
The duration of temporary total disability in Illinois is longer than most states in the study.37
TTD DURATION IN WEEKS
Illinois 20.8
16-state Median 16.7 NEIGHBORING STATES LARGE INDUSTRIAL STATES
Michigan 16.8 Pennsylvania 24.9
Indiana 11.8 California 22.7
Wisconsin 10.8 Texas 16.6 Iowa 10.7 Florida 12.1
INJURY RATES
Illinois has a lower injury rate than most states.38
FREQUENCY OF INJURY PER 100,000 WORKERS
Illinois 3,201
Countrywide 3,491
NEIGHBORING STATES LARGE INDUSTRIAL STATES
Wisconsin 4,600 Pennsylvania 4,775 Iowa 4,507 California 4,037 Indiana 4,180 Florida 3,609 Michigan 4,064 Texas 2,557 Missouri 3,318 New York 2,475
36 See NASI Workers’ Compensation: Benefits, page 54. 37 See WCRI Early Evidence, page 65. 38 See NCCI Annual Statistical Bulletin 2014, pages 432-3. Policy Year 2011 figures were used when available; only PY10 statistics were available for CA, MI, PA, and WI.

22
PROMPTNESS OF FIRST TTD PAYMENT
Illinois is slower than most states in the payment of Temporary Total Disability benefits.39
PERCENTAGE OF CLAIMS WITH FIRST INDEMNITY PAYMENT WITHIN 14 DAYS OF NOTICE
Illinois 38.2%
16-state Median 43.6%
NEIGHBORING STATES LARGE INDUSTRIAL STATES Wisconsin 51.3% Texas 49.7% Iowa 45.8% California 44.3% Michigan 42.7% Florida 42.7% Indiana 35.6% Pennsylvania 35.9%
WAGES
Wages in Illinois are 6% above the U.S. average and 23% above the median of our neighboring states.40
AVERAGE ANNUAL WAGES
Illinois $52,590
U.S. average $49,808
NEIGHBORING STATES LARGE INDUSTRIAL STATES Michigan $47,131 New York $63,089 Missouri $43,066 California $57,111 Wisconsin $42,777 Texas $52,201 Indiana $41,660 Pennsylvania $49,077 Iowa $41,107 Florida $43,649
39 See WCRI Early Evidence, page 75. 40 See http://www.bls.gov/cew/cewind.htm#year=2013&qtr=A&own=0&ind=10&size=0
23
REFERENCES Burton, Jr., John F. “Workers’ Compensation Costs for Employers: National and State Data.” Workers’
Compensation Resources Research Report. May 2013. Retrieved from http://workerscompresources.com/
Illinois Department of Public Health Illinois Occupational Injuries and Illnesses: 2011. Springfield: IDPH. September 2014. Retrieved from http://www.idph.state.il.us/about/epi/cfoirpt.htm
Illinois Department of Insurance. “Premium Written in Illinois by Illinois Licensed Companies: Workers’ Compensation.” Market Share Report, 1999-2013 editions. Springfield: IDOI, 2000-2013. Retrieved from http://insurance.illinois.gov/Reports/Report_Links.asp#
---. “Workers’ Compensation Insurance Oversight Report: 2014.” Springfield: IDOI, 2014. Retrieved from http://insurance.illinois.gov/Reports/Report_Links.asp#
Illinois Governor Pat Quinn. “Governor Quinn Announces Historic Workers’ Compensation Rate Reductions.” July 30, 2014. Retrieved from http://www3.illinois.gov/PressReleases/showbym.cfm?SID=3&Y=2014&M=7
National Academy of Social Insurance. Workers’ Compensation: Benefits, Coverage, and Costs, 2012. Washington, D.C.: NASI, August 2014. Retrieved from http://www.nasi.org/research/workers-compensation
--. Workers’ Compensation: Benefits, Coverage, and Costs, 2010. Washington, D.C.: NASI, August 2012. Retrieved from http://www.nasi.org/research/workers-compensation
National Council on Compensation Insurance. Annual Statistical Bulletin, 1996-2014 editions. Boca Raton: NCCI, 1997-2014. Print.
---. Illinois State Advisory Forum. Boca Raton: NCCI, 2011-14. Print.
---. Illinois Voluntary Market: Workers’ Compensation: Advisory Rates, Loss Costs and Rating Values Effective January 1, 2014. Little Rock: NCCI, July 30, 2013. Print.
---. “NCCI Proposes Decrease for Workers’ Compensation Advisory Loss Costs and Rates in Illinois.” Little Rock: NCCI, July 31, 2013. Print.
Oregon Department of Consumer and Business Services, “Oregon Workers’ Compensation Premium Rate Ranking Summary.” 1994-2014 reports. Salem: ODCBS, 1994-2014. Retrieved from http://www4.cbs.state.or.us/ex/imd/external/reports/index.cfm?fuseaction=dir&ItemID=1992
United States Department of Labor, Bureau of Labor Statistics. “Quarterly Census of Employment and Wages.” December 17, 2014. Retrieved from
http://www.bls.gov/cew/cewind.htm#year=2013&qtr=A&own=0&ind=10&size=0
--. “Employment Status of the Civilian Noninstitutional Population in States by Sex, Race, Hispanic or Latino Ethnicity, and Detailed Age: 2013 Annual Averages.” Retrieved from http://www.bls.gov/lau/#ex14
--. “2012 Census of Fatal Occupational Injuries: Fatal Work Injury Rates: Illinois.” Retrieved from http://www.bls.gov/iif/oshstate.htm#IL
United States Department of Labor, Employment Standards Administration. "State Workers’ Compensation Laws in Effect January 1, 2004 Compared With the 19 Essential Recommendations

24
of the National Commission on State Workmen’s Compensation Laws.” January 1, 2004. Retrieved from http://workerscompresources.com/?page_id=28
Workers’ Compensation Research Institute. Benchmarks reports in reverse chronological order:
---. CompScope™ Benchmarks for Illinois, 15th edition. Workers’ Compensation Research Institute. Boston: WCRI, 2015. Available from http://www.wcrinet.org/
---. Early Evidence and Baselines for Monitoring the 2011 Reforms in Illinois: CompScope™ Benchmarks, 14th edition. Workers’ Compensation Research Institute. Boston: WCRI, 2013. Available from http://www.wcrinet.org/
---. Baseline for Monitoring the Impact of 2011 Reforms in Illinois: CompScope™ Benchmarks, 13th edition. Workers’ Compensation Research Institute. Boston: WCRI, 2012. Available from http://www.wcrinet.org/
---. Baseline for Monitoring the Impact of 2011 Reforms in Illinois: CompScope™ Benchmarks, 12th edition. Boston: WCRI, 2011. Available from http://www.wcrinet.org/
--. Monitoring the Impact of 2005 Reforms in Illinois: CompScope™ Benchmarks, 9th edition. Workers’ Compensation Research Institute. Boston: WCRI, 2009. Available from http://www.wcrinet.org/
--. Baseline Metrics for Monitoring 2005 Reforms in Illinois: CompScope™ Benchmarks, 8th edition. Workers’ Compensation Research Institute. Boston: WCRI, 2008. Available from http://www.wcrinet.org/
Medical Benchmarks reports in reverse chronological order:
---. CompScope™ Medical Benchmarks for Illinois, 15th edition. Workers’ Compensation Research Institute. Boston: WCRI, 2014. Available from http://www.wcrinet.org/
---. Early Insights on the 2011 Reforms in Illinois: CompScope™ Medical Benchmarks, 14th edition. Workers’ Compensation Research Institute. Boston: WCRI, 2014. Available from http://www.wcrinet.org/
---. Medical Payments, Prices, and Utilization Prior to 2011 Reforms in Illinois: CompScope™ Medical Benchmarks, 13th edition. Workers’ Compensation Research Institute. Boston: WCRI, 2013. Available from http://www.wcrinet.org/
---. Illinois Medical Cost Drivers Prior to 2011 Reforms: CompScope ™ Medical Benchmarks, 12th edition. Workers’ Compensation Research Institute. Boston: WCRI, 2012. Available from http://www.wcrinet.org/
---. CompScope™ Medical Benchmarks for Illinois, 11th edition. Workers’ Compensation Research Institute. Boston: WCRI, 2011. Available from http://www.wcrinet.org/
---. Monitoring the Impact of Illinois Regulatory Changes: CompScope™ Medical Benchmarks, 10th edition. Workers’ Compensation Research Institute. Boston: WCRI, 2010. Available from http://www.wcrinet.org/