fy12 first half results presentation
TRANSCRIPT

FY12 First Half Results Presentation By Chris Sutherland, Managing Director
23 November 2011
2
Important notice and disclaimer
The information contained in this presentation is for information purposes only and does not
constitute an offer to issue, or arrange to issue, securities or other financial products. The
information contained in this presentation is not investment or financial product advice and is
not intended to be used as the basis for making an investment decision.
This presentation has been prepared without taking into account the investment objectives,
financial situation or particular needs of any particular person. Before making an investment
decision, you should consider, with or without the assistance of a financial adviser, whether an
investment is appropriate in light of your particular investment needs, objectives and financial
circumstances. Past performance is no guarantee of future performance.
No representation or warranty, express or implied, is made as to the fairness, accuracy,
completeness or correctness of the information, opinions and conclusions contained in this
presentation. To the maximum extent permitted by law, none of Programmed Maintenance
Services Limited, its directors, employees or agents, nor any other person accepts any liability,
including, without limitation, any liability arising out of fault or negligence, for any loss arising
from the use of the information contained in this presentation.
In particular, no representation or warranty, express or implied, is given as to the accuracy,
completeness, likelihood of achievement or reasonableness of any forecasts, projections,
prospects or returns contained in this presentation. Such forecasts, projections, prospects or
returns are by their nature subject to significant uncertainties and contingencies.
This presentation should be read in conjunction with the Announcements issued to the ASX
since the 2011 Annual Report and can be found on the Programmed website at
www.programmed.com.au.

3
Welcome to the world of Programmed

4
Safety is paramount.
We will act to ensure
the safety and
environmental well-
being of our
customers, the public
and ourselves.
Our Vision: To be the leading provider of staffing, maintenance and project services, without injury
SAFETY TEAMWORK
We respect everyone’s
contribution by working
together to achieve
common goals and
project outcomes. Our
sense of team extends
to building long-term
customer and
community
relationships for the
benefit of all.
ACCOUNTABILITY
We encourage
individuals and teams
to take responsibility
and ownership of the
process, and the
outcome, through
decisive leadership
and initiative.
HONESTY
& INTEGRITY
Our business
relationships are
based on fair, open,
and ethical principles.
We take pride in the
way we work with our
customers and
communities, the
integrity of our
services, and doing
what we say we are
going to do.
RECOGNITION
& ENJOYMENT
We are a people
business. We
recognise and reward
outstanding
achievement, and
provide opportunity for
our employees to
develop and
succeed. We create
an environment for
every team member
to have a positive,
enjoyable and
rewarding work
experience.

5
Programmed Today
$1200 million+ revenue
100 offices around Australia and NZ
10,000+ employees

6
Our visible commitment, leadership, systems and processes to
prevent injury with a goal of Zero Harm
Our ability to recruit, deploy and manage a large skilled workforce to
support our customers’ operations…5,000+ permanent and 5,000+
casuals…30,000+ people each year
Our many long-term contracts…more than 5,000
Our diversity across all industry sectors including the offshore oil and
gas sector
Our wide network that serves and supports large and small customers
alike across Australia and NZ…100+ branches
Our Competitive Advantages

7
INTEGRATED WORKFORCE Staffing Services
Customers contract a complete MANAGEMENT
and / or maintenance SOLUTION
Customers contract the STAFFING service
PROPERTY & INFRASTRUCTURE
Maintenance, Building and Operational Services
PROPERTY SERVICES
FACILITY MANAGEMENT
KLM ELECTRICAL & COMMUNICATIONS
Customers contract the TASK capability
Our Structure
RESOURCES
Maintenance, Construction and
Operational Services
TOTAL MARINE SERVICES
CONSTRUCTION & MAINTENANCE

8
Revenue of $652.3 million, up 8% on pcp1
EBITA of $23.7 million, up 129% on pcp1
Profit of $11.6 million, up 153% on pcp1
Fully franked interim dividend of 5.0 cents per share,
up 2c on pcp
Net debt lower to $110 million (down from $118
million at 31 March 2011)
Debt refinanced to October 2014
WA Water Corporation $785 million contract
1 pcp excluding discontinued operations
Group Performance Highlights

9
Group Results
Group Results1H 2012
30 Sep 2011
1H 2011
30 Sep 2010 % change
$m $m
Continuing operations
Revenue 652.3 604.7 8%
EBITDA (before restructuring costs) 29.2 22.7 29%
Depreciation (5.5) (6.5) 15%
EBITA (before restructuring costs) 23.7 16.2 46%
Restructuring costs 0.0 (5.9)
EBITA 23.7 10.3 129%
Amortisation (0.1) (0.2) 38%
EBIT 23.6 10.2 132%
Net Interest (7.0) (6.8) (3%)
Profit Before Tax 16.6 3.4 391%
Income Tax Expense1 (5.0) 1.2
Profit From Continuing Operations 11.6 4.6 153%
Discontinued operations2 0.0 (7.6)
Profit After Tax (statutory basis) 11.6 (3.1)
Earnings Per Share 9.8 (2.6)
Earnings Per Share (continuing operations) 9.8 3.9 153%
Weighted Average Shares on Issue (million) 118.2 118.2
1 1H 2011 includes $1.9m tax benefit from retrospective change in tax consolidation rules to allow
additional deductions for assets acquired after 1 July 20022 Discontinued operations comprise the United Kingdom painting business
10
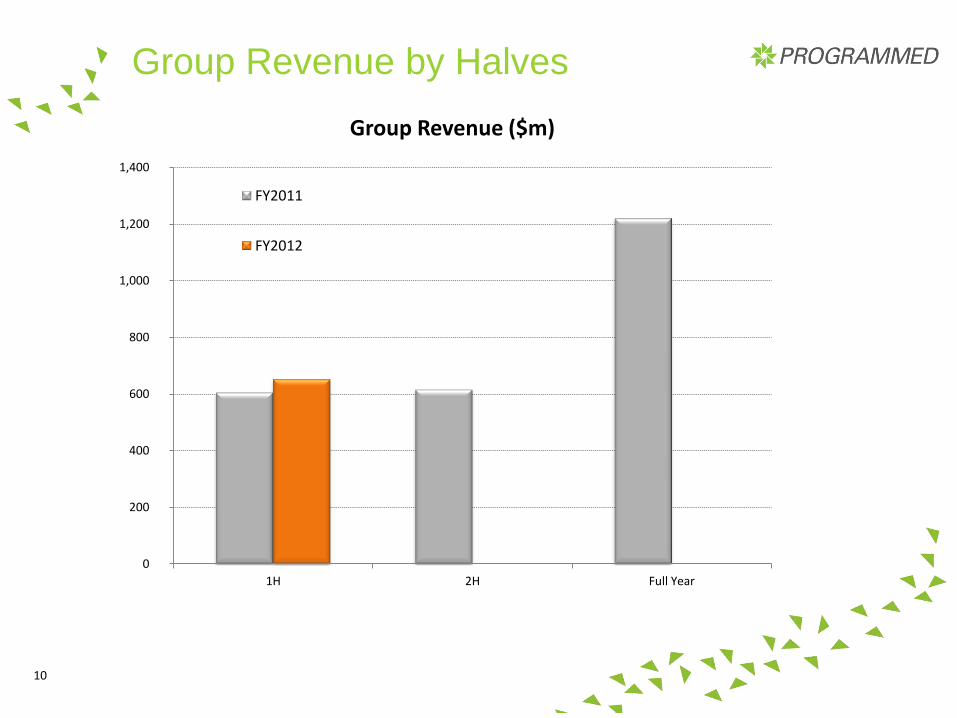
Group Revenue by Halves
0
200
400
600
800
1,000
1,200
1,400
1H 2H Full Year
Group Revenue ($m)
FY2011
FY2012

11
Group EBITA by Halves
0
10
20
30
40
50
60
1H 2H Full Year
Group EBITA ($m)
FY2011
FY2012

12
Group Cash Flow
Group Cash Flow1H 2012
30 Sep 2011
1H 2011
30 Sep 2010
$m $m
Gross Operating Cash Flow 33.1 15.9
Interest paid (7.7) (7.0)
Income tax paid (8.5) (6.8)
Net Operating Cash Flow 16.9 2.1
Net purchases of non current assets (2.1) (2.7)
Payment for businesses (0.4) (0.1)
Proceeds from sales of businesses 3.2 3.0
Other investing cash flows 0.3 0.5
Net Investing Cash Flow 1.0 0.7
Net borrowings / (repayments) (17.2) (25.1)
Proceeds from issue of shares 0.0 0.0
Dividends paid (7.1) (7.1)
Net Financing Cash Flow (24.3) (32.2)
Net Increase / (Decrease) in Cash (6.4) (29.4)
Cash at beginning of year 20.1 46.5
Disposals & Exchange Rate Variances 0.3 (0.1)
Cash at End of Period 14.0 17.0

13
Group Balance Sheet
Balance Sheet 30 Sep 2011 31 Mar 2011 % change
$m $m
Cash 14.0 20.1 (30%)
Trade and other receivables 199.4 189.5 5%
Contract Recoverables 132.1 133.8 (1%)
Inventories 70.7 73.8 (4%)
Property, plant & equipment 23.1 24.4 (5%)
Goodwill & other intangible assets 252.1 251.0 0%
Other assets 23.7 25.0 (5%)
Total Assets 715.1 717.6 (0%)
Trade and other payables 132.2 134.3 (2%)
Borrowings 124.0 138.5 (10%)
Provisions and other liabilities 98.8 93.4 6%
Total Liabilities 355.0 366.2 (3%)
Total Equity 360.1 351.5 2%
Net Debt 110.0 118.4 (7%)
Net Debt / Equity 30.5% 33.7% (9%)

14
Debt Refinancing
New bank syndicated lending facility until October 2014
The facility includes three financing tranches aggregating $250
million comprising
• Working capital and overdraft facility of $70 million (rolling 1 year
term)
• A revolving debt facility of $120 million (3 year term)
• A bank guarantee facility of $60 million (rolling 1 year term)
Other arrangements remain for ongoing support of asset finance
requirements ($17 million)

15
Property & Infrastructure
Property Services margin improved on pcp
Facility Management revenue and earnings higher on pcp
KLM Electrical and Communication earnings lower than pcp but
expect similar result to last year for full year
0
100
200
300
400
500
600
700
1H 2H Full Year
Property & Infrastructure Revenue ($m)
FY2011
FY2012
0
5
10
15
20
25
30
35
1H 2H Full Year
Property & Infrastructure EBITA($m)
FY2011
FY2012

16
New Maintenance Programmes
Property Services improvement projects being delivered well
Three new maintenance programmmes offered this year
• giving customers greater choice
• lower capital requirements
• approx. 25% of new programmes sold YTD are non classic
Classic Programme ™
An upfront work schedule with periodic payment
Choices Programme ™
You decide when, where and how often, and pay as you go
Multiform Programme ™
A uniform solution for multiple facilities or multiple locations
Safeguard Programme ™
Ongoing preservation programme to keep your coating as new

17
WA Water Corporation
Perth Region Alliance
Programmed Facility Management successful tenderer
Estimated revenue over 10 years $785m
Work commences 1 Feb 2012
In partnership with the Water Corporation; scope is for
supply of operation and maintenance services covering
water, sewerage, and storm water network across north &
south metropolitan Perth and Mandurah / Peel region

18
Resources
Strong growth in offshore oil and gas projects driving increased
revenue and earnings from Total Marine Services
Major Gorgon contract to commence in December 2011
Onshore Construction & Maintenance business delivered
maintenance and construction support services to a range of
clients in the North and South WA
0
50
100
150
200
250
1H 2H Full Year
Resources Revenue ($m)
FY2011
FY2012
0
2
4
6
8
10
12
14
16
1H 2H Full Year
Resources EBITA($m)
FY2011
FY2012

19
Integrated Workforce
Demand was flat through first quarter and weakened in second
quarter across general manufacturing, transport and industrial client
base
Demand was strong across mining and heavy construction markets
Result shows slight revenue decline overall but improved margin
0
50
100
150
200
250
300
350
400
450
1H 2H Full Year
Workforce Revenue ($m)
FY2011
FY2012
0
2
4
6
8
10
12
1H 2H Full Year
Workforce EBITA($m)
FY2011
FY2012
20
‘With more than 7,000 customers and 100 branches throughout Australia
and New Zealand, Programmed is well placed to continue to expand our
operations and increase the range of services we provide to each
customer,’ said Mr Sutherland.
‘While the external business environment remains challenging and
demand from some sectors has weakened, this is balanced by
Programmed’s increasing exposure to the resources, infrastructure and
government sectors.’
‘Overall, the group continues to project for FY2012 growth in the
Property & Infrastructure division’s earnings supported by the cost
reductions in FY2011; growth in the Resources division’s revenue and
earnings due to strong demand; and growth in the Integrated Workforce
division’s earnings as a result of tight control of margins and costs.’
Outlook

21
Key growth strategy
.....mine the customer base
Common Customer Relationship Management System (CRM)
• being installed across Property & Infrastructure operations initially
Align Incentives
• common group-wide customer referral incentive scheme running
since April 2011
• 215 opportunities registered in first half
• 15 converted for contract revenue of approx $3m so far
Brand refresh

22
We have the power
to build your business
• Reposition Programmed.
• Staff think and act as one business.
• Customers know our full offer
23
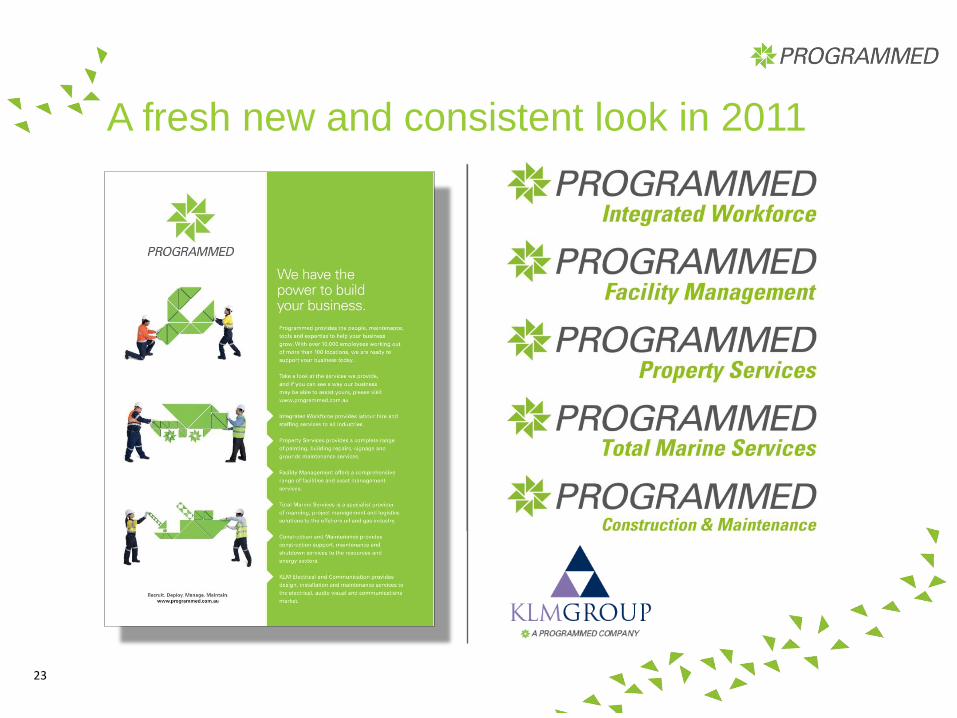
A fresh new and consistent look in 2011

24

25
Appendix

26
Segment Revenue
Revenue by division1H 2012
30 Sep 2011
1H 2011
30 Sep 2010 % change
$m $m
Continuing Operations
Property & Infrastructure 321.5 298.1 8%
Resources 138.6 103.5 34%
Workforce 190.6 201.5 (5%)
Total Continuing Operations 650.7 603.1 8%
Other Revenue 1.5 1.6
Discontinued Operations1 0.0 6.7
Total Consolidated Revenue 652.2 611.4 7%
1 Discontinued operations comprise the United Kingdom painting business

27
Segment EBITA
EBITA by division1H 2012
30 Sep 2011
1H 2011
30 Sep 2010 % change
$m $m
Continuing Operations
Property & Infrastructure 12.3 10.5 17%
Resources 10.8 4.3 151%
Workforce 6.0 5.3 13%
Unallocated (5.4) (3.9) 38%
Total Continuing Operations 23.7 16.2 46%
Restructuring Costs 0.0 (5.9)
Discontinued Operations1 0.0 (8.9)
Total Consolidated EBITA 23.7 1.4 1593%
1 Discontinued operations comprise the United Kingdom painting business