fy 2016-17 proposed budget booklet
TRANSCRIPT

FY 2016-17 Proposed Budget
Booklet

Strategic Goals

Administrative Services
• ERP Project o Implement Munis HR Payroll and time keeping project by January 1, 2017 (with IS and HR). o Continue implementation of Munis Financial Modules for a targeted go live of July 1, 2018 (with IS).
• GASB & Governmental Compliance o Implement second round of subsidies for low-income retiree medical, which will take effect January 1, 2017 (with HR). o Continue to develop and implement Affordable Care Act reporting to the IRS (with HR).
• Finance, Budgeting & Accounting o Revise reallocation and over-hire process (with HR). o Finalize cost allocation strategy for Building Maintenance/Facilities Fund (with PW). o Review/reconfigure Police Building Loan/COPs by application date. o Assist GWP in the Grayson Repower project including COSA and bond issues. o Review application procedures and controls to ensure adherence to the State Controllers guidelines and compliance to AB1248 on
Internal Controls. o Prepare white paper on vacation rental issues, including land use regulatory issues, taxation and collection (with CA and CD). o Implement community budgeting outreach tool (with MS). o Develop internal scorecards and reports for department-wide distribution to ensure line-level employees’ grasp of effective budgeting,
and the need for long-range financial planning and fiscal management (with GPD). • Develop a voter approved revenue enhancement measure (May be dependent on UUT repeal).
City Attorney
• Risk Management o In conjunction with line departments, complete system-wide evaluation for City's safety/risk prevention program.
• Governance, Charter Reform & Special Projects o Develop and implement potential Charter amendments relative to Civil Service, including modifications to the rule of three,
layoff/bumping procedures, duration of eligible lists and reclassifications (with MS and HR). o Develop revised procedures for Civil Service Commission hearings (with the HR and MS). o Develop a comprehensive review and revision of the sign code to incorporate recent legal developments (with CD). o Update the Wireless Telecommunication Ordinance to incorporate recent amendments to state law and federal regulations governing
the permitting process (with CD).
NOTE: Bold: carryover goal Italic: stretch goal
1 of 232

o Prepare white paper on vacation rental issues, including land use regulatory issues, taxation and collection (with AS and CD). o Implement security camera policy (with MS, GPD & PW). o Complete DEIR process for Scholl Canyon Landfill (with PW and MS).
• Transactional Law o Develop and Introduce legal and land use requirements for local hotels and motels that generate significant calls for public
safety service (with CD). o Update current construction specification with most recent legal developments and to ensure consistency across departments. o Develop a short-form Professional Services Agreement for smaller or lower risk contracts and develop guidelines for its use. o Develop a form general services RFP and form contract. The City has a form construction contract and form PSA but not a universal
RFP and contract for general non-professional services that require a contract more extensive than a purchase order. Community Development
• Neighborhood Services o Fully implement BRC Program (with AS). o Restructure the Code Compliance and Licensing Work Program, creating Commercial and Residential Enforcement Teams and
improving effectiveness. o Rewrite Title 5 of the GMC relating to Permits and Licenses to remove barriers and speed of issuance and enforcement to gain
efficiencies. o Reduce Inspection Backlog to a specified target. o Prepare white paper on vacation rental issues, including land use regulatory issues, taxation and collection (with AS and CA).
• Building & Safety o Complete the implementation of the “field technology” for the inspection staff, including handheld devices to transmit
inspection results, photos and/or videos to CSI and to be able to provide “robotic” inspections (with IS). o Return and maintain plan check turnaround time to an average 10-weeks. o Develop and implement cross-training program to allow one commercial inspector (instead of four: Building, Electrical, Mechanical
and Plumbing) to inspect simple TIs. o Develop the 1st draft of the Document Management Quality Assurance Program for plans and permits. o Develop and implement cross-training program for associate and assistant Permit Services Technicians allowing them to provide
expanded services to customers. • Planning
o Complete the South Glendale Community Plan. o Complete the Historic Commercial Property Survey.
2 of 232

o Develop and Introduce legal and land use requirements for local hotels and motels that generate significant calls for public safety service (with CA).
o Initiate West (and/or East) Glendale Community Plan. o Draft modification to Title 30 to allow for the automatic renewal or no-expiration of AUPs/CUPs for uses with little or “no activity” or
calls for service. o Develop a comprehensive review and revision of the sign code to incorporate recent legal developments (with CA). o Initiate and complete 50% of planning and design of Wilson and Columbus soccer fields, in collaboration with GUSD (with CSP and
PW). o Develop the Administrative Coordinator Series with the goal of updating job scope and adding quasi-technical skills to assist in
primary Planning and BRC functions. o Reduce Planning entitlement processing to 60 days following “Deemed Complete” on 80% of the applications.
• Urban Design & Mobility o Update the Pedestrian Master Plan & Safety Initiative for adoption in FY 17-18 (with PW and GPD). o Enter design-build contract phase of Beeline bus maintenance facility project with 90% of design completion by year-end (with PW). o Initiate adoption hearings for Small Lot Development Standards. o Complete Historic Resource Database of designated and potential historic resources and integrate into Property Information Portal on
City website to provide public access to information (with IS). o Complete the RFP process and execution of the technical studies phase of the Space 134 project (with PW and CSP). o Participate in and complete the feasibility study with Metro of adding mass transit service through Glendale between Bob Hope
Airport and Union Station, up to and including light rail/street car service (with PW). o Pursue design/construction/operational commitments from Metro for Glendale’s connection to regional mass transportation network
(with PW). o Initiate comprehensive, citywide, Multi-Modal Mobility Plan.
• Economic Development & Asset Management o Complete Tech Initiative analysis and implementation as directed by Board. o Develop Business and funding plan related to Space 134. o Develop and Conduct First Annual Tech Week. o Complete negotiations and commence entitlement for boutique hotel development(s) in Downtown Glendale. o Update the Wireless Telecommunication Ordinance to incorporate recent amendments to state law and federal regulations governing
the permitting process (with CA). o Complete due diligence on the ENA with the Armenian American Museum and Cultural Center of California, and complete
specifications for public parking at Central Park. o Complete Laemmle Lofts Project.
3 of 232

o Complete Hyatt Place Project. o Develop signature event in the Arts & Entertainment District focusing attraction on Maryland Avenue. o Increase Social Media presence on Twitter (600+), Facebook (200+) and Instagram (1000+). o Recruit 2-3 businesses that align with the 18-hour day lifestyle including bars, breweries, entertainment venues, breakfast venues and
unique coffee shops. • Housing
o Develop a Legislative Strategy to restore meaningful and ongoing funding for the creation and maintenance of Affordable Housing in California.
o Achieve “High Performer” rating from HUD for Section 8 operations. o Conduct Section 8 Landlord Recruitment Survey and host Enrollment Forum. o Convert Section 8 landlords to Direct Deposit. o Complete negotiations with selected developer and initiate development of Fifth & Sonora. o Complete construction and lease-up of YMCA/Meta Housing Development. o Initiate plan for an online housing service center for tenants and landlords enabling 24-hour access to housing resources and
services. Community Services and Parks
• Administration o Develop website portal for connecting community volunteers, nonprofit organizations, and centralized community calendar
(with MS). o Complete/close-out upgrades of Palmer, Deukmejian and Sports Complex Projects (with PW). o Complete the RFP process and execution of the technical studies phase of the Space 134 project (with PW and CSP). o Complete mini-master plan for Central Park and mini-master plan for Verdugo North. o Complete a phasing strategy for Fremont Park Master Plan and complete design development and construction documents for Phase I
to include a new artificial turf soccer field with fencing and lighting (with PW). o Complete planning and design for Deukmejian Barn Nature Center Interior Improvements and start construction (with PW). o Initiate and complete 50% of planning and design of Wilson and Columbus soccer fields, in collaboration with GUSD (with CD and
PW). o Complete execution of a ten year license agreement with St. Francis, including completion of conversion of Baseball Field 1 at Sports
Complex to artificial turf, paid for by St. Francis, to accommodate soccer play for use by the community during baseball off-season. • Recreation Services
4 of 232

o Expand “One Glendale” youth sports collaborative with GUSD from 4 schools (500 youth) to 8 schools (1,000 youth), and expand community engagement and healthy programming.
o Maintain/increase enterprise facility rental income level. o Eliminate operating deficit at Civic Auditorium.
• Parks Maintenance Services o Complete design and conversion of ornamental turf on north Brand median to drought-tolerant plantings. o Complete conversion of turf areas in the parks, where practical, to drought tolerant ground covers and plantings to reduce water usage. o Implement a centralized, electronic irrigation control system to improve water use efficiency. o Complete the Integrated Pest Management Program.
• Workforce Development o Complete transition to new federal Workforce Innovation and Opportunities Act (WIOA) organizational and program requirements. o Improve financial sustainability of Workforce Development and the VJC by bringing in $1.5 million in additional competitive grant
funding, or new sources of revenue. • Human Services
o Development strategy to secure a site and seek funding for a new homeless services facility that balances needs and requirements for transitional and permanent housing.
Fire
• Operations & Facilities o Develop and implement recommendations for resource reallocation in impacted districts. o Evaluate efficiency and effectiveness of Verdugo Fire Communication’s current dispatching procedures. o Develop and distribute internally real-time monitoring/reporting for overtime usage. o Commence remodel of Station 29 to accommodate female firefighters (with PW). o Develop and implement systematic approach to decrease apparatus downtime due to mechanical maintenance and repairs (with PW). o Develop a mental health training program (with GPD).
• Training o Demolish/prep Training Center site and obtain new burn building (with PW). o Conduct “in-service” academies for captain and engineer ranks. o Implement recruit academies. o Develop a system to standardize and digitally store employee certificates and records.
• Emergency Medical Service o Complete and report evaluation of Community Paramedic Program.
5 of 232
o Complete and report evaluation of Alternative Delivery Program. o Develop revised protocols for ordering/stocking pharmaceuticals, aimed at reducing costs, redundancy and waste.
• Disaster Preparedness o Develop and refine workplace emergency protocols and commence training/education for all City employees (with GPD and MS). o Commence Community EMT training program.
Glendale Water and Power
• Administration o Initiate and complete the consolidation of the citywide warehouse operations.
• Electric o Initiate and complete the development, installation and commissioning of a 2MW battery storage pilot project. o Complete six (6) 4kv to 12kv electrical distribution conversions. o Initiate and complete a new COSA and rate structure for the Electric Division including incorporation of Distributed Energy
Resources such as Net Energy Metering, Time of Use, and Electric Vehicle rate schedules. o Complete the installation of four (4) new electrical vehicle charging stations in the City.
• Water o Update and implement the Water System Master Plan’s 10-year capital improvement program and proposed funding plan. o Initiate and complete a new COSA and rate structure for the Water Division with emphasis on tier level review, recycled water rates,
drought rates and energy cost allocation. o Complete water storage assessment and develop operational plan/policy for future storage.
• Power Supply & Generation o Complete Risk Assessment & Analysis regarding risk tolerance, active hedge plan, and long term risk management oversight. o Commence procurement process for biogas-fueled electrical generation units at Scholl Canyon Landfill. o Review and recommend to Council responses to RFP – Phase I regarding the Grayson Repowering Project, and commence AQMD
permitting process.
Human Resources
• ERP Project o Implement the HR/Payroll module of the Tier II Tyler Munis project effective January 1, 2017, including transition to bi-weekly
payroll (with AS). • Compensation and Benefit Administration
6 of 232

o Execute second round of compensation alignment for 2016/2017. Additionally, per the City IBEW MOU, conduct salary survey of relevant utility classifications.
o Implement second round of subsidies for low-income retiree medical, which will take effect January 1, 2017 (with AS). o Continue to develop and implement Affordable Care Act reporting to the IRS (with AS). o Revise reallocation and over-hire process (with AS). o Revise and update background investigation protocol for specified new hires.
• Labor Relations o Implement reforms to the Charter provisions relative to Civil Service, including modifications to the rule of three,
layoff/bumping procedures, duration of eligible lists and reclassifications. This effort will require engagement with the City Council, Civil Service Commission and the respective employee bargaining groups (with CA and MS).
o Develop revised procedures for Civil Service Commission hearings (with the CA and MS). o Complete labor negotiations with GPOA and GMA/Police Sworn & Fire Sworn groups for multi-year MOUs. o Begin the process of labor negotiations in Spring 2017 for GCEA and GMA bargaining groups.
• Workers’ Compensation o Hire and fully integrate the third-party administrator for Workers’ Compensation to augment in-house staff.
Information Services
• ERP Project o Complete the implementation of Munis HR/Payroll Module(s) and online Timekeeping (with AS and HR). o Initiate implementation of the Munis Financial Modules (with AS). o Commence migration of Oracle databases into a SQL enterprise environment.
• Infrastructure & Hardware o Continue Phase II of data center upgrade project/disaster recovery environment. o Continue City wide telephone system upgrades, commencing with GWP UOC telephone system upgrade. o Install State grant funded CENIC network to expand speed and access for members of the public. Separate the public and staff
networks (with LAC). o Complete Historic Resource Database of designated and potential historic resources and integrate into Property Information Portal on
City website to provide public access to information (with CD). • Applications
o Implement application virtualization, including remote access and mobile solutions. o Implement the upgraded Intranet web site. o Complete the mobile ticketing solution for the Police Department (with GPD).
7 of 232

o Continue the Licensing/Permitting software implementations including online permit renewal, submittal, and mobile solutions for all affected departments.
• Wireless & Radio o Complete the radio system Dynamic System Resilience disaster recovery site. o Complete regular radio redundancy testing throughout the year and develop a scoresheet to document and diagnose technical
infrastructure failures versus user/operator errors (with GPD & PW). Library Arts and Culture
• Facilities o Complete Central Library Renovation by Spring of 2017 (with PW). o Complete installation of RFID and Automated Materials Handling System technology to provide staffing efficiencies and improve
security and self-service options. o Install State grant funded CENIC network to expand speed and access for members of the public. Separate the public and staff
networks (with IS). o Explore and propose a self-service model at Chevy Chase to expand access to services beyond 11 hours/week.
• Programming and Outreach o Develop the design and programming strategy for the Remembrance (Man’s Inhumanity to Man) Room at Central Library. o Develop a system-wide marketing strategy to increase patronage at all venues, with emphasis on reopening of Central
Library. Transform the image of Central Library as a digital center where state of the art technology can be accessed. o Create a sustainable model for adult literacy services with new grant funding from the State Library. o Complete the Arts and Culture Commission Public Art Master Plan.
Management Services
• Administration o Develop website portal for connecting community volunteers, nonprofit organizations, and centralized community calendar
(with CSP). o Convene quarterly meetings of local non-profit organization leadership. o Development and implementation of potential Charter amendments relative to Civil Service, including modifications to the
rule of three, layoff/bumping procedures, duration of eligible lists and reclassifications (with HR & CA). o Develop revised procedures for Civil Service Commission hearings (with the CA and HR). o Implement security camera policy (with CA, GPD & PW).
8 of 232

o Implement 2nd phase of Exceptional Customer Service Policy. o Prepare and submit white paper on proposed revision of Commission Appointment Process. o Implement community budgeting outreach tool (with AS). o Develop and refine workplace emergency protocols and commence training/education for all City employees (with GPD and GFD). o Complete DEIR process for Scholl Canyon Landfill (with PW and CA). o Develop and Implement Citizen’s Leadership Academy.
• Community Information & Outreach o Complete the merger of Graphics & GTV6, to be known as Creative Media & Digital Innovation. o Create/centralize City of Glendale film office. o Centralize special events marketing and promotion in Management Services. o Formalize print-for-fee services with GUSD, identify additional partners for Graphics Unit services, and increase Graphics output by
10% among external clients. o
Police
• Crime Suppression o Procure and implement predictive policing advanced analytics to maximize the effectiveness of patrol and investigative resources to
address current local and regional crime trends. • Support Services
o Complete regular radio redundancy testing throughout the year and develop a scoresheet to document and diagnose technical infrastructure failures versus user/operator errors (with IS & PW).
o Develop internal scorecards and reports for department-wide distribution to ensure line-level employees’ grasp of effective budgeting, and the need for long-range financial planning and fiscal management (with AS).
o Develop and implement a minimum of three (3) updated employee training programs to assure that component courses are both interesting and cost-effective, by taking full advantage of existing GPD subject matter experts.
o Develop a mental health training program (with GFD). o Implement security camera policy (with CA, MS & PW). o Develop and refine workplace emergency protocols and commence training/education for all City employees (with GFD and MS). o Add two (2) agencies as fee-for-service clients of the Verdugo DNA Lab, while maintaining or reducing current turnaround times.
• Community Policing o Complete a six and twelve-month evaluation of the new Crime Impact Team, focusing on key performance indications among the
team as well as overcome community outcomes.
9 of 232

o Complete not less than twenty-four (24) Community Outreach events and collect no less than two hundred (200) new contacts to accept GPD messaging and crime prevention information.
• Traffic Safety o Complete the mobile ticketing solution for the Police Department (with IS). o Update the Pedestrian Master Plan & Safety Initiative for adoption in FY 17-18 (with PW and GPD).
Public Works
• Parking Operations o Complete automated parking system upgrade at City garages, including digital wayfinding signs to direct traffic to City garages.
• Sewer Maintenance o Execute Chevy Chase Sewer Diversion Project at 66% of construction completion. o Develop COSA for restructure and increase of current sewer rates. o Increase the use of recycled water for sewer cleaning to 60% of the total.
• Engineering & Traffic Engineering o Establish a “partial quiet zone” at the railroad crossings along San Fernando Corridor. o Implement the construction of the new Glendale Sub-regional Traffic Operations Center. o Complete the construction of the City’s first green street demonstration project. o Participate in and complete the feasibility study with Metro of adding mass transit service through Glendale between Bob Hope
Airport and Union Station, up to and including light rail/street car service (with CD). o Complete the RFP process and execution of the technical studies phase of the Space 134 project (with CD and CSP). o Update the Pedestrian Master Plan & Safety Initiative for adoption in FY 17-18 (with GPD and CD). o Pursue design/construction/operational commitments from Metro for Glendale’s connection to regional mass transportation network
(with CD). • Project Management
o Complete/close-out upgrades of Palmer, Deukmejian and Sports Complex Projects (with CSP). o Complete Central Library Renovation by Spring of 2017 (with LAC). o Demolish/prep Training Center site and obtain new burn building (with GFD). o Develop plan and remodel Station 29 to accommodate female firefighters (with GFD). o Enter design-build contract phase of Beeline bus maintenance facility project with 90% of design completion by year-end (with CD). o Complete the Wilson Mini-Park Restroom and Maple and Maryland Park shade structures projects (with CSP). o Complete a phasing strategy for Fremont Park Master Plan and complete design development and construction documents for Phase I
to include a new artificial turf soccer field with fencing and lighting (with CSP).
10 of 232

o Complete planning and design for Deukmejian Barn Nature Center Interior Improvements and start construction (with CSP). o Initiate and complete 50% of planning and design of Wilson and Columbus soccer fields, in collaboration with GUSD (with CD and
CSP). • Fleet Maintenance
o Revamp Fleet Charge Program to actual monthly billing with the goal of equalizing annual, adjusted costs from departments with annual revenues.
o Develop and implement systematic approach to decrease apparatus downtime due to mechanical maintenance and repairs (with GFD). o Implement full conversion of Refuse Fleet to Compressed Natural Gas.
• Integrated Waste Management o Commence ENA process for anaerobic digestion pilot project at Scholl Canyon Landfill. o Complete DEIR process for Scholl Canyon Landfill (with CA and MS). o Develop and present strategy for franchising commercial waste hauling sector. o Implement mandatory commercial recycling, restaurant food recycling and commercial waste reduction programs. o Evaluate the bulky/abandoned item pick up program and recommend improvements, including but not limited to outsourcing.
• Facilities Maintenance o Develop universal scorecard for satisfaction with maintenance/management of all City facilities. o Finalize cost allocation strategy for Building Maintenance/Facilities Fund (with AS). o Implement security camera policy (with CA, GPD & MS). o Complete regular radio redundancy testing throughout the year and develop a scoresheet to document and diagnose technical
infrastructure failures versus user/operator errors (with IS & GPD).
11 of 232

Key Performance Indicators

Performance Indicator
1st
Quarter
2nd
Quarter
3rd
Quarter
4th
Quarter*
FY 2015-16
Actual
FY 2014-15
Actual
FY 2013-14
Actual Primary Secondary
Financial Operations
1 Total Citywide personnel cost $56,606,642 $56,756,719 $55,458,850 $0 $217,712,150 $216,208,153 FR -
2 Citywide personnel cost to total operating cost 37.2% 37.7% 36.8% 0.0% 35.4% 34.0% FR -
3 Departmental personnel cost to total operating cost
Administrative Services - General Fund 75% 75% 76% 0% 72% 70% FR -
City Attorney - General Fund 95% 94% 93% 0% 93% 92% FR -
City Attorney - All Funds 28% 23% 55% 0% 49% 48% FR -
City Clerk - General Fund 74% 78% 79% 0% 46% 73% FR -
City Treasurer - General Fund 87% 89% 88% 0% 87% 85% FR -
Community Services & Parks - General Fund 62% 61% 62% 0% 63% 62% FR -
Community Services & Parks - All Funds 60% 56% 57% 0% 57% 55% FR -
Community Development - General Fund 93% 92% 90% 0% 87% 93% FR -
Community Development - All Funds 25% 26% 27% 0% 24% 24% FR -
Fire - General Fund 88% 88% 88% 0% 88% 88% FR -
Fire - All Funds 85% 85% 83% 0% 84% 83% FR -
Glendale Water & Power - All Funds 16% 17% 16% 0% 15% 14% FR -
Human Resources - General Fund 63% 66% 70% 0% 62% 61% FR -
Human Resources - All Funds 4% 5% 5% 0% 4% 5% FR -
Information Services - All Funds 36% 34% 27% 0% 34% 42% FR -
Library, Arts & Culture - General Fund 69% 69% 67% 0% 69% 71% FR -
Library, Arts & Culture - All Funds 67% 68% 65% 0% 67% 70% FR -
Management Services - General Fund 75% 76% 72% 0% 77% 80% FR -
Police Department - General Fund 85% 84% 84% 0% 86% 85% FR -
Police Department - All Funds 83% 84% 82% 0% 79% 80% FR -
Public Works - General Fund 40% 50% 48% 0% 48% 51% FR -
Public Works - All Funds 38% 36% 35% 0% 32% 33% FR -
4 # of reports prepared and published by Finance 82 89 80 0 278 241 IEC -
5 Citywide average operating cost per day $1,695,384 $1,674,212 $1,676,841 $0 $1,705,920 $1,741,256.22 FR -
Financial Ratios
6 Actual operating cost, General Fund, per capita $237 $229 $228 $0 $923 $873.00 FR -
7 Actual expenditures, all funds, per capita $801 $792 $793 $0 $3,287 $3,373.00 FR -
8 Liquidity ratio (Annually) N/A N/A N/A 0 N/A N/A FR -
9 Debt ratio (Annually) N/A N/A N/A 0% N/A N/A FR -
Accounts Payable & Purchasing
10 Number of employees with open procurement cards citywide 243 236 237 0 211 190 FR -
11 Average procurement card purchase amount $208.73 $142.50 $132.16 $0.00 $224.69 $222.75 FR -
12 Total dollar value of purchasing conducted with procurement cards $483,364 $480,146 $334,542 $0 $1,828,937 $1,740,914.82 FR -
13 Total number of invoices processed for payment 28,023 25,600 26,416 0 110,947 112613 FR -
14 Average number of invoices processed for payment N/A N/A N/A 0 27,737 28153 FR -
15 Avg. calendar days from approved requisition to purchase order issued 21 12 10 0 16 18 ECS -
Council Priority
Administrative Services
Key Performance IndicatorsFY 2015-16
12 of 232

Performance Indicator
1st
Quarter
2nd
Quarter
3rd
Quarter
4th
Quarter*
FY 2015-16
Actual
FY 2014-15
Actual
FY 2013-14
Actual Primary Secondary
Council Priority
Administrative Services
Key Performance IndicatorsFY 2015-16
Budget
16 Ratio of Gen. Fund Admin. Services budget to total Gen. Fund budget 3.0% 3.0% 3.0% 0.0% 2.7% 3.2% FR -
17 Ratio of General Fund budget to the overall City Budget 22.6% 19.0% 19.0% 0.0% 19.1% 20.7% FR -
18 Number of residents per authorized salaried positions 127 127 126 0 126 121 FR -
19 % accuracy in budget revenue to actual in General Fund (Annually) N/A N/A N/A 0% N/A N/A ECS IEC
Internal Audit
20 Audits completed 2 0 3 0 11 16 IEC FR
21 Audit close-out rate 28% 32% 3% 0% 19% 32% IEC FR
22 Average number of open audit issues 38 26 30 0 39 59 IEC FR
13 of 232

Performance Indicator
1st
Quarter
2nd
Quarter
3rd
Quarter
4th
Quarter
FY 2015-16
Actual
FY 2014-15
Actual
FY 2013-14
Actual Primary Secondary
1 Number of Public Records Requests Received 192 180 176 0 434 452 IEC -
2 Number of Public Records Requests Completed 189 179 176 0 392 441 IEC -
3 Number of Parking Appeals Handled 58 23 15 0 228 281 SHC -
4 Number of Insurance Certificates Handled N/A 692 633 0 N/A N/A SHC -
5 Number of Legal Service Requests Received 213 254 186 0 672 656 ECS -
6 Number of Legal Service Requests Completed 204 283 168 0 582 543 ECS -
7 Number of Claims Received 36 39 60 0 232 276 FR -
8 Number of Claims Closed 66 41 52 0 276 285 FR -
9 Avg. Cost per Claim Closed $1,608 $462 $1,281 $0 $1,081 $649 FR -
10 Number of Lawsuits Received 10 9 5 0 22 33 FR -
11 Number of Lawsuits Closed 5 7 7 0 19 29 FR -
12 Number of Lawsuits Resolved Through Settlement 3 2 1 0 9 19 FR -
13 Number of Lawsuits Dismissed Through Dispositive Motion* 0 2 0 0 10 3 FR -
14 Number of Lawsuits Tried to Verdict* 0 0 0 0 0 3 FR -
15 Number of Lawsuits Disposed on Appeal 0 0 0 0 0 1 FR -
16 Avg. Cost per Lawsuit Settled $224,899 $2,077 $80,035 $0 $29,589 $171,437 FR -
17 Avg. Cost per Lawsuit Tried $0 $0 $0 $0 $0 $1,050 FR -
18 Number of Code Enforcement Cases Received 525 484 241 0 1,217 848 SHC -
19 Number of Code Enforcement Cases Closed 561 259 252 0 998 769 SHC -
* Not all cases may have a final judgment.
Council Priority
City Attorney
Key Performance IndicatorsFY 2015-16
FY 2015-16 Quarterly Results
14 of 232

Performance Indicator
1st
Quarter
2nd
Quarter
3rd
Quarter
4th
Quarter
FY 2015-16
Actual
FY 2014-15
Actual
FY 2013-14
Actual Primary Secondary
1 Total public records requests received 145 171 164 0 410 413 IEC -
2 Total public records requests provided 144 170 163 0 409 389 IEC -
3 Number of public records requests completed within 10 days 135 161 155 0 399 356 IEC ECS
4 Number of public records requests completed beyond 10 days 10 10 9 0 5 22 IEC ECS
5 Number of non-responsive public records requests 1 0 0 0 5 25 IEC -
6 Number of Filming Permits issued 64 65 78 0 244 278 EV -
7 Number of Special Event Permits issued 38 45 15 0 169 144 AC IEC
8 Total number of agenda items processed 103 76 91 0 227 407 IEC -
9
Percentage of time Council meeting minutes are docketed for
City Council approval within three weeks of meeting date 90% 95% 95% 0% 98% 93% IEC ECS
10 Number of registered voters 97,293 98,032 98,032 0 98,127 97,249 IEC -
11 Voter registration percentage 51% 51% 51% 0% 51% 51% IEC -
12 Ratio of provisional ballots cast vs. votes cast in person at poll location* N/A NA 0 0 16.4 0 IEC -
*9.66 poll voters to every 1 provisional vote cast in the April 2, 2013 Election
Council Priority
City Clerk
Key Performance IndicatorsFY 2015-16
FY 2015-16 Quarterly Results
15 of 232

Performance Indicator
1st
Quarter
2nd
Quarter
3rd
Quarter
4th
Quarter
FY 2015-16
Actual
FY 2014-15
Actual
FY 2013-14
Actual Primary Secondary
1
Median weighted average for maturity of City portfolio assets
(months) 24.0 24.4 21.8 0.0 23.1 22 FR -
2 Total investment earnings per quarter (millions) $1,172,287 $1,181,917 $1,649,195 $0 $3,955,795 $3,296,035 FR -
3 Rate of return on the City Portfolio per quarter (%) 1.20% 1.23% 1.25% 0.00% 1.08% 0.89% FR -
4 Number of overages or shortages in daily cash balances 1 0 0 0 0 5 FR -
Council Priority
City Treasurer
Key Performance IndicatorsFY 2015-16
FY 2015-16 Quarterly Results
16 of 232

Performance Indicator
1st
Quarter
2nd
Quarter
3rd
Quarter
4th
Quarter
FY 2015-16
Actual
FY 2014-15
Actual
FY 2013-14
Actual Primary Secondary
Housing
1 Number of active Section 8 Rental Assistance vouchers 2,972 2,965 2,996 0 3,011 3,029 BQH -
2 Number of Section 8 Housing Quality Standard Inspections conducted 991 913 940 0 3925 4196 BQH -
3 Number of new affordable housing units completed 0 0 0 0 9 17 BQH -
4 Number of new affordable housing units under development 121 121 121 0 245 240 BQH -
5 Number of affordable housing units monitored 421 410 169 0 714 773 BQH -
Building & Safety
6 Number of building permits issued (all types) 814 848 751 0 2,871 2,814 BQH EV
7 Building Permit Issued " Over the Counter" 564 791 532 0 2,087 N/A BQH EV
8 Number of trade permits issued 761 698 686 0 2,627 2,992 BQH EV
9 Avg. valuation per building permit $58,800 $51,533 $118,970 $0 $113,723 $84,223 FR EV
10 Number of building plan checks submitted 200 101 130 0 608 $416 EV -
11 Number of sub-trade plan checks submitted 372 104 293 0 1,200 1,252 EV -
12 Avg. turnaround time per building plan check (days) 35 25 30 0 27 18 ECS -
13 Number of customers served 12,783 11,649 11,756 0 38,417 28,206 ECS EV
14 Avg. turnaround time per sub-trade plan check (days) 13 14 14 0 21 10 ECS -
15 Number of permit inspections completed 7,387 7,985 8,230 0 34,165 32,214 ECS EV
16 Building and Safety fees received $2,410,484 $1,695,654 $2,248,214 $0 $9,269,104 $7,795,814 FR EV
17 Ratio of Building & Safety fees received to section's expenditures 3 1 2 0 2.43 2.63 FR -
18 Number of complaints received 64 50 65 0 191 149 ECS -
19 Cost per hour of operation $1,351 $1,565 $1,828 $0 $1,420 $1,099 FR -
Planning/Neighborhood Services
20 Number of development applications submitted for review by: 0 0 0 0
Design Review Board 17 9 8 0 34 62 BQH EV
Planning Commission 2 3 9 0 13 19 BQH EV
Historic Preservation Commission 2 1 2 0 11 2 BQH EV
Planning Hearing Officer 6 7 6 0 24 76 BQH EV
21 Number of City applications initiated for: 0 0 0 0
General Plan Amendments 0 0 0 0 2 4 BQH EV
Council Priority
Community Development
Key Performance IndicatorsFY 2015-16
FY 2015-16 Quarterly Results
17 of 232
Performance Indicator
1st
Quarter
2nd
Quarter
3rd
Quarter
4th
Quarter
FY 2015-16
Actual
FY 2014-15
Actual
FY 2013-14
Actual Primary Secondary
Council Priority
Community Development
Key Performance IndicatorsFY 2015-16
FY 2015-16 Quarterly Results
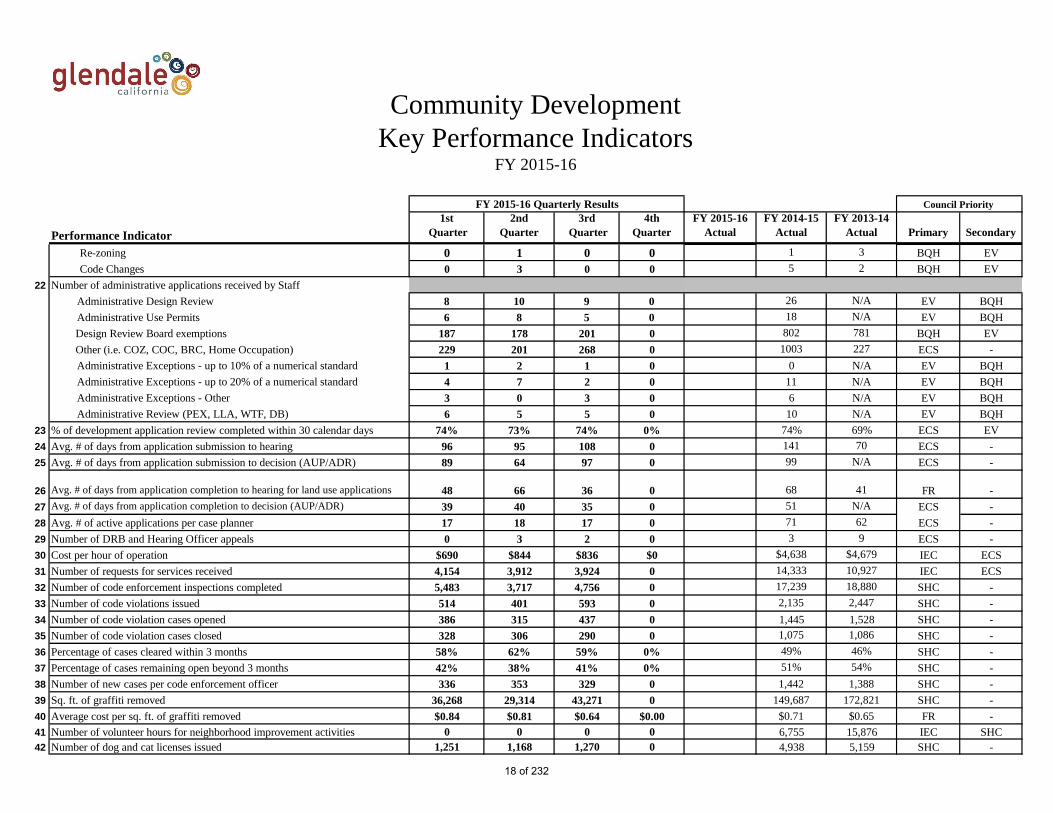
Re-zoning 0 1 0 0 1 3 BQH EV
Code Changes 0 3 0 0 5 2 BQH EV
22 Number of administrative applications received by Staff
Administrative Design Review 8 10 9 0 26 N/A EV BQH
Administrative Use Permits 6 8 5 0 18 N/A EV BQH
Design Review Board exemptions 187 178 201 0 802 781 BQH EV
Other (i.e. COZ, COC, BRC, Home Occupation) 229 201 268 0 1003 227 ECS -
Administrative Exceptions - up to 10% of a numerical standard 1 2 1 0 0 N/A EV BQH
Administrative Exceptions - up to 20% of a numerical standard 4 7 2 0 11 N/A EV BQH
Administrative Exceptions - Other 3 0 3 0 6 N/A EV BQH
Administrative Review (PEX, LLA, WTF, DB) 6 5 5 0 10 N/A EV BQH
23 % of development application review completed within 30 calendar days 74% 73% 74% 0% 74% 69% ECS EV
24 Avg. # of days from application submission to hearing 96 95 108 0 141 70 ECS -
25 Avg. # of days from application submission to decision (AUP/ADR) 89 64 97 0 99 N/A ECS -
26 Avg. # of days from application completion to hearing for land use applications 48 66 36 0 68 41 FR -
27 Avg. # of days from application completion to decision (AUP/ADR) 39 40 35 0 51 N/A ECS -
28 Avg. # of active applications per case planner 17 18 17 0 71 62 ECS -
29 Number of DRB and Hearing Officer appeals 0 3 2 0 3 9 ECS -
30 Cost per hour of operation $690 $844 $836 $0 $4,638 $4,679 IEC ECS
31 Number of requests for services received 4,154 3,912 3,924 0 14,333 10,927 IEC ECS
32 Number of code enforcement inspections completed 5,483 3,717 4,756 0 17,239 18,880 SHC -
33 Number of code violations issued 514 401 593 0 2,135 2,447 SHC -
34 Number of code violation cases opened 386 315 437 0 1,445 1,528 SHC -
35 Number of code violation cases closed 328 306 290 0 1,075 1,086 SHC -
36 Percentage of cases cleared within 3 months 58% 62% 59% 0% 49% 46% SHC -
37 Percentage of cases remaining open beyond 3 months 42% 38% 41% 0% 51% 54% SHC -
38 Number of new cases per code enforcement officer 336 353 329 0 1,442 1,388 SHC -
39 Sq. ft. of graffiti removed 36,268 29,314 43,271 0 149,687 172,821 SHC -
40 Average cost per sq. ft. of graffiti removed $0.84 $0.81 $0.64 $0.00 $0.71 $0.65 FR -
41 Number of volunteer hours for neighborhood improvement activities 0 0 0 0 6,755 15,876 IEC SHC
42 Number of dog and cat licenses issued 1,251 1,168 1,270 0 4,938 5,159 SHC -
18 of 232

Performance Indicator
1st
Quarter
2nd
Quarter
3rd
Quarter
4th
Quarter
FY 2015-16
Actual
FY 2014-15
Actual
FY 2013-14
Actual Primary Secondary
Council Priority
Community Development
Key Performance IndicatorsFY 2015-16
FY 2015-16 Quarterly Results
43 Number of (new) business license/permit applications received 787 336 395 0 1,906 1,024 EV -
44 Number of (new/renewal) business license/permit applications issued 640 307 345 0 2,068 1,773 EV -
Economic Development
45 General Inquiries 275 414 258 0 822 653 EV ECS
46 Class A office vacancy rate 12.2% 11.6% 10.6% 0.0% 14.0% 19.0% EV -
47 Vacancy Rate: Retail (ICMA Community Attribute) 2.9% 2.5% 2.1% 0.0% 2.8% 3.8% EV -
48 Sales tax revenue** $39 $41 $43 $0 $38 $37 EV -
49 Number of outside businesses assisted with Glendale location needs 60 46 74 0 239 270 ECS EV
50 Number of outside businesses assisted that came to Glendale 6 1 0 0 10 13 ECS EV
51
Sq. footage of leases executed by businesses that came to Glendale (involving
the assistance of Economic Development) 57,963 4,900 0 0 54,991 75,750 EV -
52 Number of existing Glendale businesses assisted 123 85 127 0 299 243 ECS EV
Urban Design and Mobility
53 Beeline "on-time" performance rate 89% 87% 88% 0% 89% 89% ECS -
54 Beeline Passangers per revenue hour 24 23 23 0 24 22 FR -
55 Beeline cost per revenue hour (annual measure) N/A N/A N/A $0 $85 $85 FR -
56 Miles Between mechanical system failures 52,070 46,374 23,310 0 N/A N/A IM -
57 Individuals engaged through Social Media 51,191 106,674 168,049 0 N/A N/A IEC -
58
Individuals engaged through community meetings, events, and
presentations 126 630 0 0 N/A N/A IEC -
19 of 232

Performance Indicator
1st
Quarter
2nd
Quarter
3rd
Quarter
4th
Quarter
FY 2015-16
Actual
FY 2014-15
Actual
FY 2013-14
Actual Primary Secondary
Administration
1 Total developed park acreage per 1,000 residents 1.44 1.44 1.44 0.00 1.46 1.49 CSF IEC
2 Total undeveloped park acreage per 1,000 residents 25.28 25.28 25.28 0.00 25.68 26.26 CSF IEC
3 Total number of volunteers for:
Community centers and human service programs 27 27 34 0 143 111 IEC -
Open space and trails 193 125 141 0 939 929 IEC -
4 Total number of volunteer hours for:
Community centers and human service programs 2,571 1,867 1,927 0 11,158 9,885 IEC -
Open space and trails 469 411 422 0 2,803 2,988 IEC -
5 Total number of participants in open space & trails programs 226 146 223 0 405 478 CSF IEC
Park Maintenance
6 Acres of developed parkland and community buildings maintained per FTE 4.13 4.13 4.13 0.00 4.20 4.76 CSF IEC
7 # of hours to maintain 31.73 acres of sports fields (19 fields) 1,671 1,026 1,459 0 5,094 6,069 CSF IEC
8 # of incidents of vandalism reported 76.00 63.00 72.00 0.00 684 180 SHC -
9 % of time graffiti vandalism was removed within 24 hours of notification 90% 90% 90% 0% 91% 90% SHC -
10 # of completed special work orders 820 511 556 0 2,330 2,075 CSF -
Park Planning & Development
11 # of safety and security improvement projects at parks & community facilities 4 4 0 0 4 0 SHC -
12 Park, open space & comm. facility projects developed or improved
# of projects developed or improved 2 1 0 0 6 10 CSF IEC
% of projects completed within 45 days of project completion date 100% 0% N/A 0% 100% 100% CSF IEC
% of projects completed within 5% of project cost target 50% 100% N/A 0% 100% 100% CSF IEC
Recreation
13 Number of hours the sports fields are permitted 11,145 6,544 10,858 0 41,725 41,669 CSF IEC
14
Percentage of permitted hours on lit sports fields at peak time
(4pm-10pm weeknights and 8am-10pm weekends) 79% 67% 67% 0% 79% 80.75% CSF IEC
15 Facility rental revenue
Non-sports fields $259,014 $210,235 $263,107 $0 $1,027,667 $958,721 FR -
Sports fields $140,043 $155,831 $230,541 $0 $436,700 $516,957 FR -
16 Total number of hours of use for non-revenue rentals
Facility Rentals 2,856 2,356 2,643 0 16,268 n/a CSF -
Sport Field Rentals 7,479 3,120 5,639 0 24,604 n/a CSF -
Community Services & Parks
Key Performance IndicatorsFY 2015-16
Council Priority FY 2015-16 Quarterly Results
20 of 232

Performance Indicator
1st
Quarter
2nd
Quarter
3rd
Quarter
4th
Quarter
FY 2015-16
Actual
FY 2014-15
Actual
FY 2013-14
Actual Primary Secondary
Community Services & Parks
Key Performance IndicatorsFY 2015-16
Council Priority FY 2015-16 Quarterly Results
17 Total number of contract classes offered:
Duplicated (total # of contract classes offered at different time/location) 54 53 50 0 191 331 CSF IEC
Unduplicated (total # of individual contract classes offered) 17 21 21 0 75 133 CSF IEC
18 Total number of contract classes held:
Duplicated (total # of contract classes offered at different time/location) 46 46 33 0 116 179 CSF IEC
Unduplicated (total # of individual contract classes held) 21 18 16 0 58 99 CSF IEC
19 Total number of recreation classes held :
Duplicated (total # of recreation classes held at different time/location) 188 29 25 0 368 441 CSF IEC
Unduplicated (total # of individual recreation classes held 29 8 9 0 81 83 CSF IEC
20 Number of duplicated participants in:
Contract Classes 420 422 341 0 1,638 2,120 CSF IEC
Recreation Classes 14,899 6,539 6,440 0 35,538 36,761 CSF IEC
21 Total contract class revenue $37,826 $42,372 $32,854 $0 $170,884 $201,785 FR -
22 Total recreational class revenue $280,300 $24,777 $12,260 $0 $543,652 $504,868 FR -
23 Number of recreation programs offered at 21 facilities: 1
Duplicated (total # of recreation programs offered at different time/location) 79 75 76 0 77 73 CSF IEC
Unduplicated (total # of individual recreation programs offered) 40 38 35 0 37 33 CSF IEC
24 Total number of teens participating in a structured recreation/fitness program 61 35 94 0 198 n/a CSF -
25 Number of events co-sponsored by the department 19 8 8 0 35 32 IEC -
26
Number of non-profit organizations/public agencies that operate
programs/services at park facilities at no cost for facility rental (unduplicated) 25 11 2 0 40 30 IEC -
Human Services
27 # of unduplicated persons served w/ social service resources in CDBG 339 319 294 0 1,409 1,596 CSF IEC
28 Number of meals served to seniors 14,900 14,006 13,935 0 54,178 50,988 CSF IEC
29 Cost per meal served to seniors $6.15 $6.68 $6.72 $0.00 $6.78 $7.21 FR -
30 Number of cases for senior care management:
Total number of new cases 31 14 19 0 111 111 CSF IEC
Average number of open cases 76 86 83 0 102 87 CSF IEC
Total number of closed cases 19 11 11 0 49 91 CSF IEC
31 Total Cost per senior care management case $329 $354 $348 $0 $301 $310 FR -
32 Number of persons who exited Glendale Homeless Continuum of Care (CoC) 2
220 140 752 0 1,113 1,180 CSF IEC
# of people who exited the program that were placed into Permanent
Supportive Housing 87 44 84 0 463 516 CSF IEC
% of people who exited the program that were placed into Permanent
Supportive Housing 40% 31% 11% 0% 47% 53% CSF IEC
33 Number of homeless persons receiving services (duplicated) 3
627 1,130 1,453 0 4,184 6,093 CSF IEC
21 of 232
Performance Indicator
1st
Quarter
2nd
Quarter
3rd
Quarter
4th
Quarter
FY 2015-16
Actual
FY 2014-15
Actual
FY 2013-14
Actual Primary Secondary
Community Services & Parks
Key Performance IndicatorsFY 2015-16
Council Priority FY 2015-16 Quarterly Results
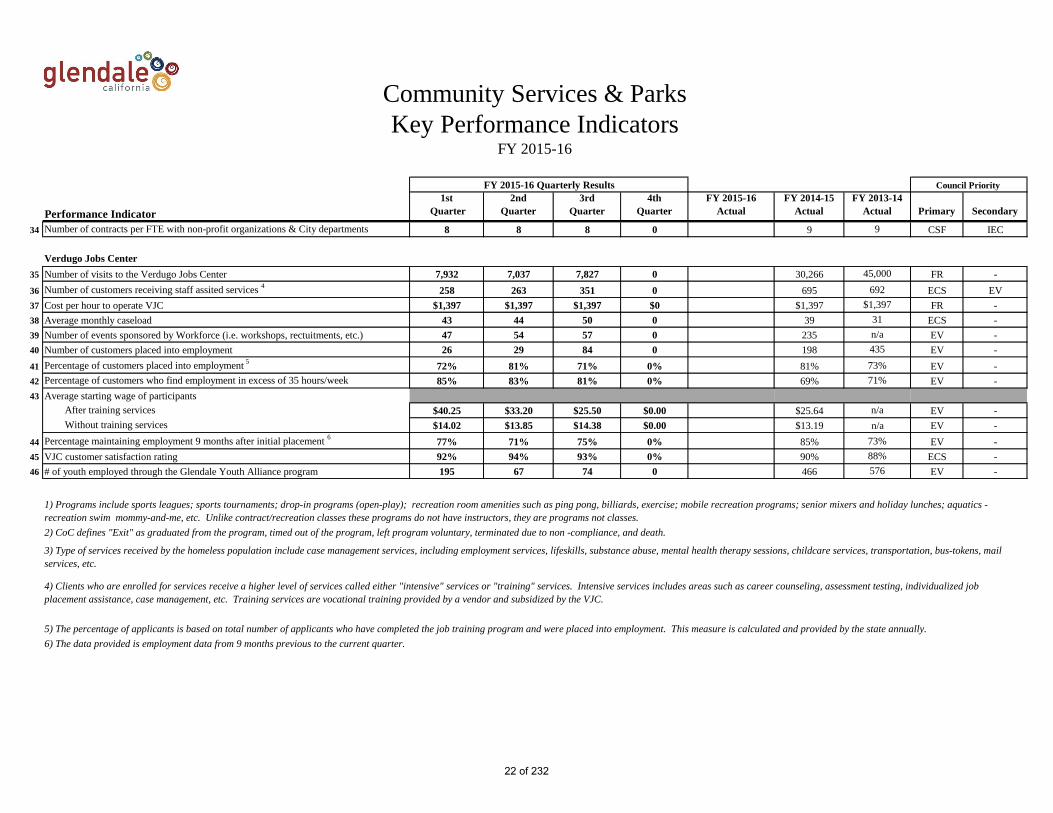
34 Number of contracts per FTE with non-profit organizations & City departments 8 8 8 0 9 9 CSF IEC
Verdugo Jobs Center
35 Number of visits to the Verdugo Jobs Center 7,932 7,037 7,827 0 30,266 45,000 FR -
36 Number of customers receiving staff assited services 4
258 263 351 0 695 692 ECS EV
37 Cost per hour to operate VJC $1,397 $1,397 $1,397 $0 $1,397 $1,397 FR -
38 Average monthly caseload 43 44 50 0 39 31 ECS -
39 Number of events sponsored by Workforce (i.e. workshops, rectuitments, etc.) 47 54 57 0 235 n/a EV -
40 Number of customers placed into employment 26 29 84 0 198 435 EV -
41 Percentage of customers placed into employment 5
72% 81% 71% 0% 81% 73% EV -
42 Percentage of customers who find employment in excess of 35 hours/week 85% 83% 81% 0% 69% 71% EV -
43 Average starting wage of participants
After training services $40.25 $33.20 $25.50 $0.00 $25.64 n/a EV -
Without training services $14.02 $13.85 $14.38 $0.00 $13.19 n/a EV -
44 Percentage maintaining employment 9 months after initial placement 6
77% 71% 75% 0% 85% 73% EV -
45 VJC customer satisfaction rating 92% 94% 93% 0% 90% 88% ECS -
46 # of youth employed through the Glendale Youth Alliance program 195 67 74 0 466 576 EV -
4) Clients who are enrolled for services receive a higher level of services called either "intensive" services or "training" services. Intensive services includes areas such as career counseling, assessment testing, individualized job
placement assistance, case management, etc. Training services are vocational training provided by a vendor and subsidized by the VJC.
5) The percentage of applicants is based on total number of applicants who have completed the job training program and were placed into employment. This measure is calculated and provided by the state annually.
6) The data provided is employment data from 9 months previous to the current quarter.
1) Programs include sports leagues; sports tournaments; drop-in programs (open-play); recreation room amenities such as ping pong, billiards, exercise; mobile recreation programs; senior mixers and holiday lunches; aquatics -
recreation swim mommy-and-me, etc. Unlike contract/recreation classes these programs do not have instructors, they are programs not classes.
2) CoC defines "Exit" as graduated from the program, timed out of the program, left program voluntary, terminated due to non -compliance, and death.
3) Type of services received by the homeless population include case management services, including employment services, lifeskills, substance abuse, mental health therapy sessions, childcare services, transportation, bus-tokens, mail
services, etc.
22 of 232

Performance Indicator
1st
Quarter
2nd
Quarter
3rd
Quarter
4th
Quarter
FY 2015-16
Actual
FY 2014-15
Actual
FY 2013-14
Actual Primary Secondary
Administration
1 Avg. number of Firefighters per 1,000 residents 0.78 0.77 0.75 0 0.80 0.79 SHC -
2 Number of fire companies per household (per 10,000 residents) 0.60 0.60 0.60 0.00 0.62 0.63 SHC -
3 Number of Paramedics per 1,000 residents 0.44 0.44 0.44 0.00 0.44 0.44 SHC -
4 Fire Department General Fund Budget per capita $59.74 $57.06 $56.50 $0.00 $219.81 $217.80 FR -
5 Percentage of Fire Department budget that is grant funded 1.33% 0.13% 0.00% 0.00% 0.01% 0.02% FR -
6 Total overtime hours worked 56,403 42,983 42,181 0 164,439 169,795 FR -
7 Total overtime cost/staffing $2,764,489 $2,043,776 $2,103,373 $0 $7,111,137 $8,392,955 FR -
Total amount of MOU related staffing overtime $1,793,463 $1,638,639 $1,693,867 $0 $5,233,497 $6,427,337 FR -
Total amount of work comp related overtime $166,049 $160,488 $158,321 $0 $1,091,424 $1,309,768 FR -
Total amount of training and other overtime $119,451 $209,705 $240,586 $0 $427,731 $355,860 FR -
Total amount of reimbursed overtime $685,553 $34,944 $10,598 $0 $358,485 $299,990 FR -
8 In-service fire suppression training hours 2,126 1,912 2,506 0 9,523 9,029 SHC -
9 Cost per Firefighter attending the Fire Academy $0.00 $0.00 $0.00 $0.00 N/A N/A FR -
Operations
10 Total calls for Fire Department services* 4,862 4,955 5,137 0 18,798 17,825 SHC -
11 Number of EMS calls* 4,100 4,290 4,520 0 16,164 15,310 SHC -
12 Number of fire-related calls* 518 459 445 0 1,898 1,790 SHC -
13 Number of false alarms 275 235 256 0 1,001 938 SHC -
14 Number of services calls* 231 196 160 0 729 725 SHC -
15 Value of property lost (structure and contents) $351,375 $1,182,400 $34,050 $0 $2,342,050 $6,190,980 SHC -
16 % of 911 calls answered 15 seconds or less (per NFPA standard 1221) 99.00% 99.00% 99.00% 0.00% 99.05% 98.92% SHC ECS
17 Avg. time to dispatch – Emergency Medical Service (EMS) 0:00:57 0:00:58 0:00:55 0:00:00 0:00:52 0:00:54 SHC ECS
18 Avg. time to dispatch – Fire 0:00:52 0:00:56 0:00:59 0:00:00 0:00:50 0:00:58 SHC ECS
19 Avg. turn-out time 0:00:41 0:00:41 0:00:42 0:00:00 0:00:42 0:00:54 SHC ECS
20 Avg. time to arrive on scene for EMS calls 0:03:51 0:03:48 0:03:53 0:00:00 0:03:49 0:03:42 SHC ECS
21 Avg. time to arrive on scene for Fire calls 0:04:33 0:04:19 0:04:25 0:00:00 0:04:19 0:04:19 SHC ECS
22 Percent of response times under 5 minutes (NFPA 1710) 65% 66% 64% 0% 67% 69% SHC ECS
23 Avg. incident duration per call category:
Service Calls 0:21:09 0:24:31 0:24:53 0:00:00 0:25:29 0:22:30 SHC -
Emergency Medical Calls 0:38:10 0:38:35 0:39:40 0:00:00 0:39:16 0:39:37 SHC -
Fire Calls 0:50:24 0:34:46 0:29:25 0:00:00 0:47:36 0:52:49 SHC -
Alarm Calls 0:17:32 0:15:56 0:15:07 0:00:00 0:17:26 0:16:55 SHC -
Flooding Calls 0:41:07 0:51:29 0:31:44 0:00:00 0:39:11 0:38:20 SHC -
24 Average number of responses per fire unit 549 581 604 0 2,212 2,061 SHC -
25 Automatic aid ratio:
Aid Provided 425 405 381 0 364 362 SHC
Aid Received 269 204 269 0 229.25 215 SHC -
Emergency Medical Services (EMS)
26 Number of victims transported 2,707 2,772 2,829 0 10,936 10,094 SHC -
27 Overall documentation compliance (goal = 90%) 91% 91% 92% 0% 94% 91% SHC -
Council Priority
Fire Department
Key Performance IndicatorsFY 2015-16
FY 2015-16 Quarterly Results
23 of 232

Performance Indicator
1st
Quarter
2nd
Quarter
3rd
Quarter
4th
Quarter
FY 2015-16
Actual
FY 2014-15
Actual
FY 2013-14
Actual Primary Secondary
Council Priority
Fire Department
Key Performance IndicatorsFY 2015-16
FY 2015-16 Quarterly Results
28 Vital sign compliance (goal = 90%) 96% 99% 93% 0% 94% 96% SHC -
29 Patient pain assessment compliance (goal = 90%) 96% 90% 95% 0% 98% 99% SHC -
30 Number of medical cardiac arrest patients 43 60 52 0 170 137 SHC -
31 Number of cardiac arrest patients transported 26 29 21 0 90 57 SHC -
32 Average number of uninsured homeless person related EMS calls 33 15 6 0 72 103 SHC -
33
Avg, STEMI response time (goal = time lapse between initial paramedic contact to opening of the artery
should be within 90 minutes, 90% of the time) 100% 100% 100% 0% 99% 100% SHC -
34 Avg. transport “wall time” 0:21:06 0:21:49 0:24:58 0:00:00 0:21:20 0:17:13 SHC -
35 Avg. time A/O unit assigned to incidents in a 24 hr. period 4:17:53 4:30:12 4:50:18 0:00:00 4:20:17 4:34:19 SHC -
36 Avg. time paramedic unit assigned to incidents in a 24 hr period 2:06:55 2:18:34 2:21:49 0:00:00 2:16:38 2:43:14 SHC -
37 Average EMS billing recovery rate 31% 21% 35% 0% 30% 31% FR -
38 Number of EMS calls per paramedic 94.25 98.62 103.91 0 381.45 350.2 SHC -
Fire Prevention
39 Number of CIP Inspections conducted 1,648 1,912 599 0 8,458 5,615 SHC -
40 Number of Brush Inspections (Vegetation Management Program) 230 5 0 0 4,759 4,091 SHC -
41 Number of Underground Tank Inspections completed 14 17 7 0 71 93 SHC -
42 Number of Veg. Management Program & Fire Company Insp. Hours 957 1,505 100 0 2,941 4,421 SHC -
43 Number of Residents Relinquishing Household Hazardous Waste 1,475 1,205 1,334 0 N/A N/A SHC -
44 Number of Filming Permits Reviewd 63 66 88 0 N/A N/A
45 Number of Filming Safety Inspections Performed 16 8 9 0 N/A N/A
46 Number of plan checks submitted 459 490 475 0 1,518 1,327 SHC -
47 Number of plan checks completed 571 521 460 0 1,931 1,764 SHC -
48 Avg. turnaround time per plan check (days) 27 31 33 0 19.525 14.3 ECS -
Public Education
49 Number of students attending Junior Fire Academy program 0 0 0 0 2,280 2,084 SHC IEC
50 Avg. cost per attendee at Junior Fire Academy program $0.00 $0.00 $0.00 $0.00 $0.57 $2.25 FR -
51 Number of CERT programs conducted 2 1 1 0 5 8 IEC SHC
52 Avg. number of residents and businesses trained in CERT 13 18 10 0 10 22 IEC SHC
* Previously reported KPI’s #10, 11, 12, and 14 have been adjusted to reflect the inclusion of out of jurisdiction responses
24 of 232

Performance Indicator1st
Quarter
2nd
Quarter
3rd
Quarter
4th
Quarter
FY 2015-16
Actual
FY 2013-14
Actual
FY 2014-15
Actual Primary Secondary
Water Section
1 Water produced from Verdugo Basin (billion gallons) 0.09 0.09 0.07 0.00 0.45 0.36 IM -
2 Avg. production per well from Verdugo Basin (billion gallons) 0.01 0.01 0.01 0.00 0.0 0.0 IM -
3 Water imported from MWD (billion gallons) 1.18 1.08 1.04 0.00 6.61 5.56 IM -
4 Volatile Organic Compounds (VOC) treatment at San Fernando Basin (billion of gallons of water treated) 0.66 1.04 0.51 0.00 2.29 2.28 SHC -
5 Percent of positive water samples in the distribution system 1.15% 0.65% 0.00% 0.00% 0.43% 1.13% SHC -
6 Number of repeat positive samples 1.00 0.00 0.00 0.00 1 5 SHC -
7 Number of positive e-coli samples N/A 0.00 0.00 0.00 0 0 SHC -
8 Number of “high chlorine” complaints by customers 5.00 2 3 0 25 39 SHC -
9 Production from local Wells (billion gallons) 0.75 1.19 0.52 0.00 2.53 2.53 IM -
10 Cost to treat from local wells (billion gallons) $925 $1,106 $817 $0 $16,653 $15,272 FR -
11 Percentage of backflow devices tested/maintained (total of 1,851 devices) 497 505 583 0 IM SHC
12 Water meters repaired (large meters 3" and above) 3.00 0 0 0 30 11 IM -
13 New service/turn-ons 9.00 15 36 0 33 60 IM -
14 Number of main breaks 2.00 3 5 0 17 9 IM -
15 Avg. time to repair a main break (hours) 3.33 0.33 5.17 0.00 4.28 3.25 IM ECS
16 Total Service-Hour Interruption 891 599 1,185 0 5,393 7,725 IM ECS
17 Water valves exercised vs. target (goal = 4,671 w/ each exercised 2x/year) 550 1,357 840 0 N/A N/A IM SHC
18 Number of Fire hydrants inspected, operated and maintained vs. target (goal = 3,134) 789 802 314 0 N/A N/A IM SHC
19 # of reservoirs inspected and cleaned vs. target (goal = 6 facilities/year) 0.00 0.00 0.00 0.00 11 8 IM SHC
20 Water loss through the distribution system 3.20% -4.90% 4.21% 0.00% 6.23% 2.53% IM FR
21 Chemical use per volume of water (pounds per million gallons of water) 4.16 4.43 4.02 0.00 2.62 4.76 IM SHC
22 Electric use per acre foot of water (KwH)** 472.91 454.88 420.35 0.00 445.22 566.58 IM FR
Electric Section
23 Total O&M Expense per KWH Sold ** $0.19 $0.17 $0.16 $0.00 $0.20 $0.15 FR -
24 Revenue per KWH
All Retail Customers ** $0.17 $0.16 $0.18 $0.00 $0.16 $0.15 FR -
Residential Customers ** $0.18 $0.16 $0.18 $0.00 $0.17 $0.16 FR -
Commercial Customers ** $0.18 $0.16 $0.19 $0.00 $0.16 $0.17 FR -
Industrial Customers ** $0.16 $0.16 $0.17 $0.00 $0.14 $0.13 FR -
25 Distribution O&M Expense
per retail customer ** $51 $50 $48 $0 $213 $204 FR -
26 Distribution O&M Expense per Circuit Mile ** $8,029 $7,899 $7,502 $0 $33,005 $31,166 FR -
27 Outage Indices
Total Number of Outages 17.00 11.00 18 0 65 46 IM ECS
SAIDI (System Average Interruption Duration Index) 34.02 37.20 44.56 0.00 40.785 34.2675 IM ECS
SAIFI (System Average Interruption Index) 0.71 0.75 0.84 0.00 1.09925 0.875 IM ECS
CAIDI (Customer Average Interruption Index) 43.68 48.45 53.44 0.00 37.0925 38.5325 IM ECS
ASAI (Average Service Availability Index) 99.99% 100.00% 100.00% 0.00% 100.00% 100.00% IM ECS
28 Number of preventable outages 1.00 0.00 0 0 7 0 IM ECS
29 Percentage of overloaded transformers 2.24% 2.61% 0.59% 0.00% 0.57% 0.89% IM SHC
30 Number of transformer failures 7.00 4.00 1 0 10 13 IM SHC
31 System Load Factor (average operating capacity out of 100% available) 45.58% 36.94% 33.82% 0.00% 42.68% 40.32% IM SHC
32 Energy Loss Percentage (i.e. loss due to theft or line loss) 7.24% 6.94% 6.97% 0.00% 11.53% 11.21% IM FR
33 OSHA Incidence Rate (per OSHA's formula calculation) 0.14 0.00 24.00 0.00 0.75 1.31 IM SHC
34 Number of Accidents SHC -
FY 2015-16 Quarterly Results Council Priority
Glendale Water and Power
Key Performance IndicatorsFY 2015-16
25 of 232

Performance Indicator1st
Quarter
2nd
Quarter
3rd
Quarter
4th
Quarter
FY 2015-16
Actual
FY 2013-14
Actual
FY 2014-15
Actual Primary Secondary
FY 2015-16 Quarterly Results Council Priority
Glendale Water and Power
Key Performance IndicatorsFY 2015-16
Preventable 3.00 0.00 4 0 1 5 SHC -
Non Preventable N/A 0.00 0.00 0.00 2 0 SHC -
35 Number of Vehicle Accidents SHC -
Preventable 2.00 0.00 0 0 1 3 SHC -
Non Preventable N/A 0.00 0.00 0.00 4 0 SHC -
36 Residential Energy Efficiency * FR -
Ratio of $ realized in energy savings per $ from PBC prog. funds N/A N/A N/A $0.00 $3.93 $3.62 FR -
37 Commercial Energy Efficiency * FR -
Ratio of $ realized in energy savings per $ from PBC prog. funds N/A N/A N/A $0.00 $14.88 $18.10 FR -
38 Administrative and program support costs as a % of annual revenues** 6% 7% 6% 0% 12% 6% FR -
39 Number of workdays lost per employee due to occupational accidents 6.33 0.00 0.04 0.00 4.92 14.75 SHC -
40 Average Training hours per employee 2.00 2.00 2 0 3.5 2 SHC ECS
41 Number of days for service connection (working days) 7.20 4.82 9.3 0.0 7.72 6.01 ECS -
42 Number of NERC/WECC reportable incidents N/A 0.00 0.00 0.00 0 0 SHC -
Production, Services and Financial Section
43 Debt to Total Assets Ratio** 47% 46% 49% 0% 37% 40% FR -
44 Debt Service Coverage (# of times revenue covers interest on debt)** 6.0x 6.0x 6.00 0.00 4.5x 4.5x FR -
45 Operating Ratio** 85% 73% 98% 0% 103% 63% FR -
46 Net Income per Revenue Dollar** $0.16 $0.10 $0.08 $0.00 -$0.12 $0.02 FR -
47 Uncollectible Accounts per Revenue Dollar 0.09% 0.09% 0.13% 0.00% 0.13% 0.13% FR -
48 Administrative and General Expenses per Retail Customer** $35.00 $34.00 $34.00 $0.00 $197.40 $143.00 FR -
49 Purchased Power Cost per KwH** $0.06 $0.05 $0.06 $0.00 $0.06 $0.06 FR -
50 Total Power Supply Expense per KwH Sold** $0.07 $0.07 $0.07 $0.00 $0.06 $0.07 FR -
51 Number of complaints received against GWP 11.00 4.00 10 0 8 29 ECS -
52 Number of bills processed 246,128 224,096 239,955 0 898,872 923,509 FR -
53 Percentage of bills accurately calculated (thousand bills) 99.9% 99.7% 99.9% 0.0% 99.9% 99.9% FR ECS
54 Number of customer service calls received 9,831 26,188 23,054 0 99,713 105,231 ECS -
55 Number of customer service requests completed 11,898 12,030 9,160 0 42,073 46,718 ECS -
56 Number of plan checks submitted to GWP 36.00 44.00 34 0 139 114 EV -
57 Number of plan checks completed by GWP 36.00 44.00 34 0 139 114 EV -
58 Avg. turnaround time to complete plan checks (working days) 9.19 9.63 8.96 0.00 8.4625 8.9425 ECS -
59 Bill afforability ranking against comparable utilities (1=most affordable)** 2.0 2.0 2.0 0.0 3.5 2.0 FR -
60
Bill affordability (% of income average residential customer spends on
electric bill excluding taxes) ** 0.7% 0.5% 70.0% 0.0% 2.3% 1.0% FR -
61
GWP cash reserves compared to City's reserve policy for GWP
(goal = 100% or $124 million)** 101% 132% 145% 0% 64% 79% FR -
62 Actual vs. Budget O&M expense** 31% 23% 23% 0% 101% 97% FR -
63 Actual vs. Budget Revenue** 32% 28% 21% 0% 102% 109% FR -
* Energy Efficiency savings are calculated annually at the end of the fourth quarter.
** Denotes that the current data presented is a projection and will be updated as necessary the following quarter.
26 of 232

Performance Indicator1st
Quarter
2nd
Quarter
3rd
Quarter
4th
Quarter
FY 2015-16
Actual
FY 2014-15
Actual
FY 2013-14
Actual Primary Secondary
Recruitment and Selection
1 Total number of employment applications filed 1,822 1,903 4,301 0 9,615 16,669 IEC -
2 Total number of job bulletins posted 20 40 33 0 134 117 IEC -
3 Total number of eligible lists established 24 22 30 0 109 96 IEC -
Administration
4 Citywide management-to-non-management employee ratio 14% 14% 14% 0% 14% 13% FR -
5 Departmental management-to-non-management ratios
Administrative Services 30% 30% 30% 0% 30% 32% FR -
City Attorney 38% 38% 38% 0% 38% 37% FR -
City Clerk 29% 29% 29% 0% 29% 29% FR -
City Treasurer 40% 40% 40% 0% 40% 40% FR -
Community Development 24% 24% 24% 0% 24% 25% FR -
Community Services & Parks 23% 23% 23% 0% 23% 22% FR -
Fire 7% 7% 7% 0% 7% 8% FR -
Glendale Water & Power 16% 16% 16% 0% 16% 15% FR -
Human Resources 30% 30% 30% 0% 30% 29% FR -
Information Services 8% 8% 8% 0% 8% 8% FR -
Library 12% 12% 12% 0% 12% 12% FR -
Management Services 36% 36% 36% 0% 36% 32% FR -
Police 5% 5% 5% 0% 5% 5% FR -
Public Works 12% 12% 12% 0% 12% 11% FR -
6 Percentage of employee performance evaluations submitted on time 88% 85% 83% 0% 86% 87% - -
7 Percentage of employee turnover for full-time positions 1% 2% 1% 0% 2.5% 1.3% - -
8 Number of formal grievances filed 0 0 1 0 1 3 - -
9 Total Unemployment claim costs $46,971 $32,563 $21,662 $0 $196,449 $229,293 FR -
Training and Development
10 Number of Glendale University classes offered 32 28 16 0 74 86 IEC -
Council Priority
Human Resources
Key Performance IndicatorsFY 2015-16
FY 2015-16 Quarterly Results
27 of 232

Performance Indicator1st
Quarter
2nd
Quarter
3rd
Quarter
4th
Quarter
FY 2015-16
Actual
FY 2014-15
Actual
FY 2013-14
Actual Primary Secondary
Council Priority
Human Resources
Key Performance IndicatorsFY 2015-16
FY 2015-16 Quarterly Results
11 Average number of participants per class 49 18 10 0 19 18 - -
12 Average cost per participant $15 $28 $20 $0 $33 $38 FR -
13 Total amount of tuition reimbursement paid $32,301 $36,268 $21,088 $0 $101,070 $150,922 FR -
14 Number of employees participating in tuition reimbursement 27 38 37 0 81 94 FR -
Employee Health/Wellness
15 Number of ADA interactive processes 1 3 3 0 18 12 ECS -
16 Total number of sick leave hours used 15,661 20,760 21,372 0 65,358 70,302 FR -
17 Number of EHS Safety/Wellness events conducted 4 1 1 0 8 14 SHC -
18 Average number of participants per Safety/Wellness event 14 30 21 0 18 19 SHC -
Worker's Compensation
19 Number of new workers compensation claims 63 58 60 0 214 246 FR -
20 Number of active workers compensation claims 767 767 787 0 784 788 FR -
21 Median incurred per open workers compensation claim $54,071 $54,073 $51,506 $0 $50,312 $43,182 FR -
22 Average incurred for open workers compensation claims per FTE $51,174 $47,632 $48,461 $0 $48,055 $44,291 FR -
23 Percentage of FTE’s without any on the job injury in this quarter 84% 86% 88% 0% 86% 86% SHC -
Investigations
24 Average number of investigations active 7 8 13 0 8 8 IEC FR
25 Number of investigations completed 5 1 4 0 22 31 IEC FR
26 Average length of time per investigation (in months) 7 5 4 0 39 4.1 IEC ECS
28 of 232

Performance Indicator
1st
Quarter
2nd
Quarter
3rd
Quarter
4th
Quarter
FY 2015-16
Actual
FY 2014-15
Actual
FY 2013-14
Actual Primary Secondary
1 Number of Enterprise Software Licenses per support staff 9,724 9,670 9,730 0 9,650 9,345 FR -
2 Number of radios per support staff 526 526 600 0 523 334 IM -
3 Percentage of staffing costs to Information Services Department budget 38% 26% 21% 0% 28% 35% FR -
4 Department budget as a percentage of Citywide operating budget 2.0% 3.0% 3.0% 0.0% 3.5% 3.3% FR -
5 Percentage of ISD FTE to Citywide FTE 2.7% 2.7% 2.4% 0.0% 2.7% 3.1% FR ECS
6 Number of PCs supported to number of PC Specialists 463 387 282 0 459 313 IM ECS
7 Number of calls received by the Help Desk 1,727 1,522 1,419 0 7,270 7,728 IM ECS
8 Percentage of calls resolved as a:
Level 1 - Help Desk 31% 32% 37% 0% 30% 27% ECS -
Level 2 - Incidents escalated and resolved in ISD 69% 68% 63% 0% 70% 73% ECS -
Level 3 - Incidents escalated and closed outside ISD 0% 0% 0% 0% 0% 0% ECS -
9 Average time to close an AIMS Ticket (in minutes) 64.8 63.2 58.3 0.0 69.0 64.1 ECS -
10 Overall satisfaction rating by internal users (1=Low, 5=High) 4.96 4.97 4.98 0.00 4.96 4.96 ECS -
11 Percentage of unplanned network downtime during Prime-Time 5% 5% 5% 0% 5% 5% IM ECS
12 Percentage of unplanned network downtime during non Prime-Time 7% 5% 5% 0% 6% 5% IM ECS
13 Number of phone lines per technician 1,488 1,182 1,495 0 954 466 IM -
14 Percentage of unplanned radio system downtime (24x7x365) 1.0% 0.0% 0.0% 0.0% 0.21% 0.33% IM SHC
15 Percentage of maintenance tasks to total number of radios in service 48% 42% 30% 0% 55% 41% IM -
Council Priority
Information Services
Key Performance IndicatorsFY 2015-16
FY 2015-16 Quarterly Results
29 of 232

Performance Indicator
1st
Quarter
2nd
Quarter
3rd
Quarter
4th
Quarter
FY 2015-16
Actual
FY 2014-15
Actual
FY 2013-14
Actual Primary Secondary
1 Total circulation per capita* 1.301 1.184 1.243 0.000 1.712 1.4315 IEC AC
2 Total circulation by material checked out 259,100 235,761 0 0 1,326,955 1,115,326 IEC AC
International Languages* 10,959 10,131 10,256 0 48,581 50,204 IEC AC
Children’s Materials* 101,331 98,095 104,437 0 373,305 394,646 IEC AC
e-Books* 23,964 22,996 24,221 0 86,698 59,868 IEC AC
Audio-visual materials* 60,787 52,185 55,166 0 266,012 271,639 IEC AC
other* 65,059 52,354 53,555 0 552,359 338,969 IEC AC
3 Number of annual library visits by site: 168,217 138,502 0 0 734,879 732,308 IEC AC
Central Library 89,280 57,908 59,024 0 402,818 432,939 IEC AC
Brand Library & Art Center 12,652 11,981 11,287 0 37,163 5,811 IEC AC
Library Connections @ Adams Square 6,500 6,500 11,614 0 44,000 44,000 IEC AC
Pacific Park Branch Library 17,000 17,000 17,992 0 69,956 82,421 IEC AC
Casa Verdugo Branch Library 10,000 17,202 18,133 0 42,300 43,300 IEC AC
Grandview Branch Library 16,000 12,000 10,000 0 57,000 36,180 IEC AC
Chevy Chase Branch Library 1,028 776 1,238 0 3,819 3,561 IEC AC
Montrose Branch Library 15,757 14,685 17,033 0 77,823 84,096 IEC AC
4 Average number of annual visits per open hour by site: 357 289 0 0 336 364 IEC AC
Central Library 149 97 98 0 134 179 IEC AC
Brand Library & Art Center 24 27 25 0 82 13 IEC AC
Library Connections @ Adams Square 10 10 19 0 25 25 IEC AC
Pacific Park Branch Library 44 44 46 0 45 54 IEC AC
Casa Verdugo Branch Library 14 25 26 0 25 26 IEC AC
Grandview Branch Library 64 48 40 0 36 23 IEC AC
Chevy Chase Branch Library 6 6 9 0 7 6 IEC AC
Montrose Branch Library 46 34 39 0 44 48 IEC AC
5 Total circulation by site: 259,100 235,761 0 0 1,326,955 1,113,922 IEC AC
Central Library* 166,303 138,959 146,075 0 865,357 799,304 IEC AC
Brand Library & Art Center* 17,629 15,282 16,466 0 83,354 16,861 IEC AC
Library Connections @ Adams Square* 7,578 11,282 10,248 0 58,761 47,766 IEC AC
Pacific Park Branch Library* 17,555 20,346 20,029 0 95,679 73,880 IEC AC
Casa Verdugo Branch Library* 16,289 19,367 21,833 0 56,439 46,989 IEC AC
Grandview Branch Library* 11,088 9,988 11,069 0 54,313 42,678 IEC AC
Chevy Chase Branch Library* 1,896 2,066 1,761 0 10,670 7,707 IEC AC
Montrose Branch Library* 20,762 18,471 20,154 0 102,382 78,737 IEC AC
Council Priority
Library, Arts, & Culture
Key Performance IndicatorsFY 2015-16
FY 2015-16 Quarterly Results
30 of 232

Performance Indicator
1st
Quarter
2nd
Quarter
3rd
Quarter
4th
Quarter
FY 2015-16
Actual
FY 2014-15
Actual
FY 2013-14
Actual Primary Secondary
Council Priority
Library, Arts, & Culture
Key Performance IndicatorsFY 2015-16
FY 2015-16 Quarterly Results
6 Average circulation per open hour by site: 502 461 0 0 574 458 IEC AC
Central Library* 277 232 243 0 289 260 IEC AC
Brand Library & Art Center * 39 34 37 0 46 37 IEC AC
Library Connections @ Adams Square* 12 18 16 0 34 27 IEC AC
Pacific Park Branch Library* 45 52 52 0 62 48 IEC AC
Casa Verdugo Branch Library* 23 28 31 0 33 28 IEC AC
Grandview Branch Library* 44 40 44 0 34 27 IEC AC
Chevy Chase Branch Library* 14 15 13 0 19 14 IEC AC
Montrose Branch Library* 47 42 46 0 59 45 IEC AC
7 Total operating hours 3,589 3,589 0 0 13,708 9,415 IEC AC
Central Library 600 600 600 0 3,000 2,512 IEC AC
Brand Library & Art Center 450 450 450 0 1,800 37 IEC AC
Library Connections @ Adams Square 625 625 625 0 1,752 1,341 IEC AC
Pacific Park Branch Library 388 388 388 0 1,552 1,208 IEC AC
Casa Verdugo Branch Library 700 700 700 0 1,700 1,303 IEC AC
Grandview Branch Library 250 250 250 0 1,600 1,225 IEC AC
Chevy Chase Branch Library 138 138 138 0 552 428 IEC AC
Montrose Branch Library 438 438 438 0 1,752 1,361 IEC AC
8 Average cost per operating hour by sites $3,554 $3,695 $0 $0 $3,174 $3,003 FR -
Central Library $2,321 $2,204 $2,302 $0 $1,977 $1,966 FR -
Brand Library & Art Center $331 $457 $477 $0 $274 $227 FR -
Library Connections @ Adams Square $136 $198 $154 $0 $169 $188 FR -
Pacific Park Branch Library $172 $178 $204 $0 $156 $167 FR -
Casa Verdugo Branch Library $108 $119 $125 $0 $159 $158 FR -
Grandview Branch Library $188 $223 $247 $0 $135 $169 FR -
Chevy Chase Branch Library $103 $108 $113 $0 $102 $97 FR -
Montrose Branch Library $196 $209 $225 $0 $203 $202 FR -
9 Total collection expenditure per capita $1 $1 $2 $0 $3 $4 FR -
10 Total volumes 526,213 534,772 542,978 0 549,630 593,095 IEC AC
11 Total volumes per capita 3 3 3 0 3 3 IEC AC
12 FTE volunteer hours average 3 2 4 0 4 4 IEC FR
13 Total # of children’s programs 459 492 605 0 1,713 1,288 IEC CSF
14 Total # of adult programs 269 332 94 0 720 1,153 IEC CSF
15 Total children’s program attendance 9,199 8,246 9,874 0 35,164 37,783 IEC CSF
31 of 232

Performance Indicator
1st
Quarter
2nd
Quarter
3rd
Quarter
4th
Quarter
FY 2015-16
Actual
FY 2014-15
Actual
FY 2013-14
Actual Primary Secondary
Council Priority
Library, Arts, & Culture
Key Performance IndicatorsFY 2015-16
FY 2015-16 Quarterly Results
16 Total adult program attendance 3,037 3,173 2,147 0 14,626 18,019 IEC CSF
17 # of public computers 115 115 115 0 115 110 IEC CSF
18 Number of Internet computer users per site 23,848 22,179 0 0 116,012 126,191 IEC CSF
Central Library 14,596 12,455 10,837 0 83,145 93,405 IEC CSF
Brand Library & Art Center 1,308 1,211 955 0 4,204 679 IEC CSF
Library Connections @ Adams Square 1,079 1,156 1,201 0 3,143 4,032 IEC CSF
Pacific Park Branch Library 1,754 2,001 1,615 0 7,099 7,458 IEC CSF
Casa Verdugo Branch Library 1,907 2,616 2,968 0 5,975 5,891 IEC CSF
Grandview Branch Library 882 800 696 0 4,580 7,635 IEC CSF
Montrose Branch Library 2,322 1,940 1,788 0 7,866 7,091 IEC CSF
19 Number of visits to library website 172,564 140,511 144,666 0 766,496 463,450 IEC -
20 Number of LITS HELP Requests (Public & Staff) 1,066 868 869 0 4,259 3,056 ECS IM
21 Overall LITS Satisfaction Rating 4.97 5 5 0 5 5 ECS
22 Number of Help Requests closed within: 502 390 505 0 2,024 1,252
Less than 1 day 349 285 395 0 1,474 784 ECS IM
3 Days 45 30 25 0 200 150 ECS IM
1 Week 45 30 35 0 164 135 ECS IM
More than 1 Week 63 45 50 0 186 183 ECS IM
23 Ratio of Library sources of City funds to outside sources 98.0% 98.0% 98.0% 0.0% 97.8% 98.7% FR -
24 Grant dollars received $1,788 $57,000 $4,791 $0 $23,129 $9,500 FR -
25 Number of interlibrary loans (materials) loaned 14,000 14,000 11,067 0 53,442 57,531 FR -
26 Number of interlibrary loans (materials) borrowed 10,000 10,000 10,849 0 42,130 41,615 FR -
27 Facility rental revenue $12,040 $9,795 $8,017 $0 $34,926 $35,413 CSF FR
28 Number of reference questions 25,994 23,978 19,377 0 72,038 77,224 IEC -
32 of 232

Performance Indicator
1st
Quarter
2nd
Quarter
3rd
Quarter
4th
Quarter
FY 2015-16
Actual
FY 2014-15
Actual
FY 2013-14
Actual Primary Secondary
City Manager's Office
1 Total number of citizen service requests 52 109 147 0 340 433 ECS -
2 Percentage of citizen service requests responded to within 10 days 99% 100% 99% 0% 99% 99% ECS -
3 Number of press releases distributed 30 33 58 0 122 221 IEC -
4 Number of GTV6 programs produced 33 27 23 0 124 132 IEC -
5 Number of local government meetings broadcast (first run) 43 42 42 0 168 218 IEC -
6 Number of website visitors 1,368,685 1,160,946 1,299,742 0 4,976,115 2,743,748 IEC -
**Sales tax revenue data has a 2 quarters delay in reporting since the data does not become available until immediately.
Council Priority
* The City recently concluded its Citizen Satisfaction Survey. When asked how they would rank Glendale as a community on a scale of one to ten (with ten as the highest rating),
nearly three-fourths (73%) of those surveyed rated Glendale as a community with an eight or higher.
Management Services
Key Performance IndicatorsFY 2015-16
FY 2015-16 Quarterly Results
33 of 232

Performance Indicator
1st
Quarter
2nd
Quarter
3rd
Quarter
4th
Quarter
FY 2015-16
Actual
FY 2014-15
Actual
FY 2013-14
Actual Primary Secondary
1 Police Department budget per capita $353 $353 $353 $0 $343 $349 FR SHC
2 Police Department budget per household $0 $922 $922 $0 $885 $925 FR SHC
3 Sworn police officers per 1,000 residents 1.23 1.23 1.23 0.00 1.23 1.32 SHC -
4 Number of volunteers working at GPD 32 38 37 0 33 32 FR IEC
5 Total number of hours volunteered 1,738 2,877 2,692 0 6,932 7,877 IEC FR
6 Value of volunteer hours contributed $75,772 $125,486 $117,378 $0 $302,263 $343,517 FR IEC
7 Number of Reserve Officer hours volunteered 1,322 954 816 0 4,662 4,601 IEC FR
8 Value of Reserve Officer volunteer hours contributed $120,765 $87,148 $74,542 $0 $425,827 $420,357 FR IEC
9 Total overtime hours worked 26,595 25,543 17,585 0 86,529 84,511 FR -
10 Total overtime cost $1,849,361 $1,806,288 $1,201,671 $0 $5,950,813 $5,997,967
Total overtime cost - MOU Entitled $1,494,994 $1,433,547 $988,559 $0 $4,900,797 $4,848,775 FR -
Total overtime cost - Reimbursed (Grant, Movie) $246,633 $313,381 $162,706 $0 $792,547 $845,174 FR -
Total overtime cost - Training $107,734 $59,360 $50,406 $0 $257,469 $304,018 FR -
11 Number of Neighborhood Watch Groups 323 327 327 0 309 214 IEC SHC
12 Total number of Neighborhood Watch / Town Hall Meetings 68 41 48 0 218 294 IEC SHC
13 Number of complaints against Police Department received 11 8 4 0 75 77 ECS -
14 Number of complaints against Police Department sustained 3 1 1 0 10 5 ECS -
15 Number of Part I crimes – total 943 938 1,031 0 3,410 3,426 SHC -
16 Number of Part I crimes – violent 49 47 52 0 198 180 SHC -
17 Number of Part I crimes – property 894 926 979 0 3,212 3,245 SHC -
18 Total Part I crimes per 1,000 residents 4.73 4.64 5.18 0 17.33 17.87 SHC -
19 Number of Part II crimes – total 2,193 1,944 2,213 0 7,873 7,579 SHC -
20 Total arrests made 2,577 2,286 2,458 0 9,279 8,735 SHC -
21 Total felony arrests made 409 399 417 0 1,946 2,631 SHC -
22 Total DUI arrests made 178 132 124 0 690 728 SHC -
23 Total drug-related cases investigated 355 290 343 0 1,053 939 SHC -
24 Total fraud/financial crime cases investigated 306 325 409 0 1,081 906 SHC -
25 Average number of arrests made per sworn officer 14.73 13.06 14.05 0 53.17 51.81 SHC -
26 Average number of arrests made per patrol officer 27.71 25.69 28.25 0 111.65 103.71 SHC -
27 Number of reports generated 7,852 7,489 8,189 0 29,920 30,021 SHC -
28 Patrol officer initiated observations 19,022 16,781 17,349 0 77,920 81,098 SHC -
29 Air support productivity - flight hours 409 428 427 0 1,631 1,516 SHC -
30 Air support productivity - calls for service - observations 3,742 3,330 3,155 0 14,278 14,431 SHC -
Council Priority
Police Department
Key Performance IndicatorsFY 2015-16
FY 2015-16 Quarterly Results
34 of 232
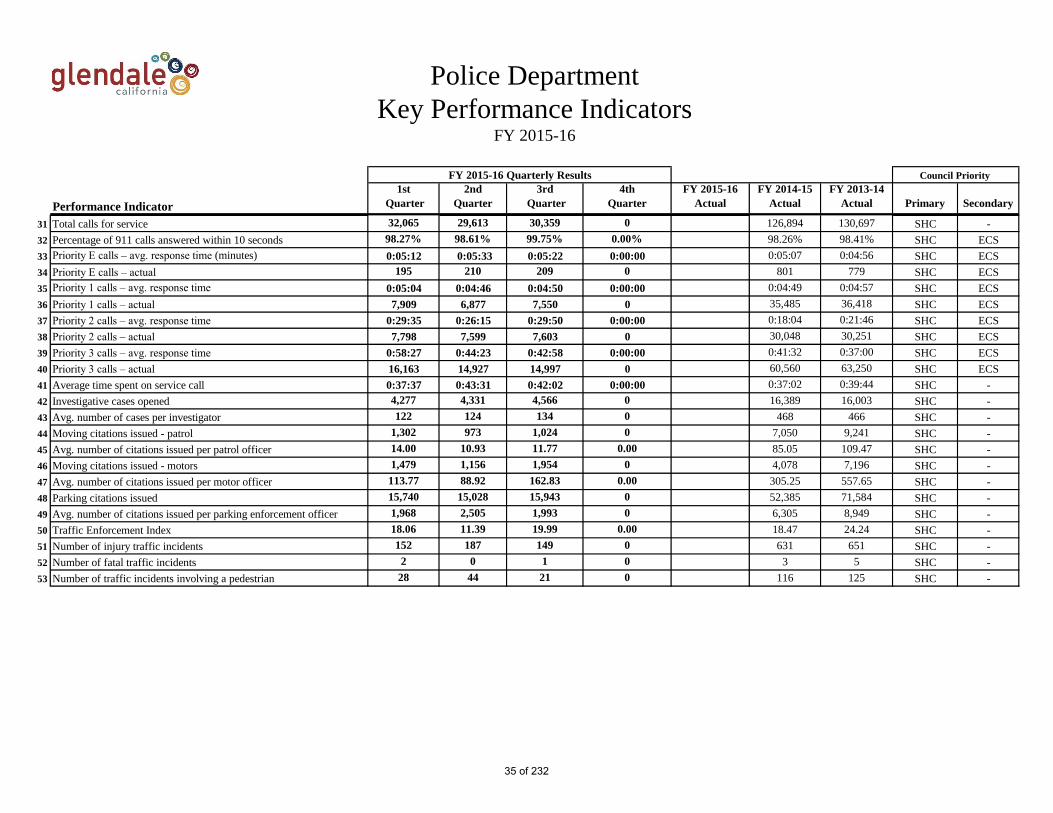
Performance Indicator
1st
Quarter
2nd
Quarter
3rd
Quarter
4th
Quarter
FY 2015-16
Actual
FY 2014-15
Actual
FY 2013-14
Actual Primary Secondary
Council Priority
Police Department
Key Performance IndicatorsFY 2015-16
FY 2015-16 Quarterly Results
31 Total calls for service 32,065 29,613 30,359 0 126,894 130,697 SHC -
32 Percentage of 911 calls answered within 10 seconds 98.27% 98.61% 99.75% 0.00% 98.26% 98.41% SHC ECS
33 Priority E calls – avg. response time (minutes) 0:05:12 0:05:33 0:05:22 0:00:00 0:05:07 0:04:56 SHC ECS
34 Priority E calls – actual 195 210 209 0 801 779 SHC ECS
35 Priority 1 calls – avg. response time 0:05:04 0:04:46 0:04:50 0:00:00 0:04:49 0:04:57 SHC ECS
36 Priority 1 calls – actual 7,909 6,877 7,550 0 35,485 36,418 SHC ECS
37 Priority 2 calls – avg. response time 0:29:35 0:26:15 0:29:50 0:00:00 0:18:04 0:21:46 SHC ECS
38 Priority 2 calls – actual 7,798 7,599 7,603 0 30,048 30,251 SHC ECS
39 Priority 3 calls – avg. response time 0:58:27 0:44:23 0:42:58 0:00:00 0:41:32 0:37:00 SHC ECS
40 Priority 3 calls – actual 16,163 14,927 14,997 0 60,560 63,250 SHC ECS
41 Average time spent on service call 0:37:37 0:43:31 0:42:02 0:00:00 0:37:02 0:39:44 SHC -
42 Investigative cases opened 4,277 4,331 4,566 0 16,389 16,003 SHC -
43 Avg. number of cases per investigator 122 124 134 0 468 466 SHC -
44 Moving citations issued - patrol 1,302 973 1,024 0 7,050 9,241 SHC -
45 Avg. number of citations issued per patrol officer 14.00 10.93 11.77 0.00 85.05 109.47 SHC -
46 Moving citations issued - motors 1,479 1,156 1,954 0 4,078 7,196 SHC -
47 Avg. number of citations issued per motor officer 113.77 88.92 162.83 0.00 305.25 557.65 SHC -
48 Parking citations issued 15,740 15,028 15,943 0 52,385 71,584 SHC -
49 Avg. number of citations issued per parking enforcement officer 1,968 2,505 1,993 0 6,305 8,949 SHC -
50 Traffic Enforcement Index 18.06 11.39 19.99 0.00 18.47 24.24 SHC -
51 Number of injury traffic incidents 152 187 149 0 631 651 SHC -
52 Number of fatal traffic incidents 2 0 1 0 3 5 SHC -
53 Number of traffic incidents involving a pedestrian 28 44 21 0 116 125 SHC -
35 of 232

Performance Indicator
1st
Quarter
2nd
Quarter
3rd
Quarter
4th
Quarter
FY 2015-16
Actual
FY 2014-15
Actual
FY 2013-14
Actual Primary Secondary
Administration Division
1 Occupancy rate for City-owned parking structures 90% 92% 79% 0% 91% 80% IM -
2 Occupancy rate for Brand Blvd. parking meters (85% is goal) 97% 97% 96% 0% 98% 97% IM -
3 Number of Industrial Off Duty (IOD) days 5 0 0 0 18 N/A SHC -
Engineering Division
4 Percentage of CIP projects completed on-time and on-budget 100% 100% 100% 0% 100% 100% FR -
5 Total lane miles of street resurfaced 1.52 0.00 0.86 0.00 19.99 8.96 IM -
6 Total lane miles of street slurry sealed 1.62 3.40 1.30 0.00 15.17 24.60 IM -
7 Total square feet of sidewalks replaced 34,141 130,399 5,372 0 203,171 283,367 IM -
8 Total linear feet of sewer mains replaced 51 2,212 2,152 0 3,137 2,384 IM -
9 Million gallons of sewage treated per day (annual measure) N/A N/A N/A 0 15 15 IM S
10 Number of Land Development applications received 327 282 335 0 N/A N/A - -
11 Number of Land Development applications completed 335 307 331 0 N/A N/A - -
12 Number of Right of Way Permit Applications Received 145 71 80 0 N/A N/A - -
13 Number of Right of Way Permit Applications Completed 93 46 35 0 N/A N/A - -
14 Traffic system failures 125 144 175 0 780 963 SHC IM
15 Traffic plan reviews for developments 2 5 3 0 25 20 IM -
16 Street Occupancy and Oversized Load Travel Permit Issued 215 229 196 0 N/A N/A - -
17 Traffic related Customer Service Request Received 143 173 94 0 N/A N/A - -
18 Traffic related Customer Service Request Completed 53 72 25 0 N/A N/A - -
19 Traffic Signal Construction Completed 2 10 0 0 N/A N/A - -
20 Number of Industrial Off Duty (IOD) days 0.94 1.00 0.22 0.00 34 N/A SHC -
Facilities Management Division
21 Cost per square foot - Building Maintenance $0.50 $0.46 $0.48 $0.00 N/A N/A ECS -
22 Cost per square foot - Custodial Services $0.44 $0.48 $0.48 $0.00 N/A N/A ECS -
23 Number of facilities service requests received 1,925 2,003 1,923 0 N/A N/A ECS -
24 Number of facilities service service requests completed 1,948 1,551 1,504 0 N/A N/A ECS -
25 Number of Industrial Off Duty (IOD) days 64 40 3 0 N/A N/A ECS -
Fleet Services Division
26 Number of vehicles maintained 962 978 978 0 988 1,007 IM -
27 Cost of preventative maintenance by Fleet Services per shop per vehicle:
Council Priority
Public Works
Key Performance IndicatorsFY 2015-16
FY 2015-16 Quarterly Results
36 of 232

Performance Indicator
1st
Quarter
2nd
Quarter
3rd
Quarter
4th
Quarter
FY 2015-16
Actual
FY 2014-15
Actual
FY 2013-14
Actual Primary Secondary
Council Priority
Public Works
Key Performance IndicatorsFY 2015-16
FY 2015-16 Quarterly Results
Mechanical Maintenance $443 $425 $453 $0 $1,649 $1,615 FR IM
Glendale Water & Power $393 $392 $368 $0 $1,339 $1,223 FR IM
Civic Center $263 $332 $435 $0 $1,003 $938 FR IM
Fire $953 $1,391 $2,596 $0 $7,201 $6,289 FR IM
28 Cost of repairs performed by fleet maintenance per shop per vehicle:
Mechanical Maintenance $2,661 $2,886 $31,196 $0 $11,682 $11,080 FR IM
Glendale Water & Power $1,302 $1,059 $1,364 $0 $4,145 $3,915 FR IM
Civic Center $1,040 $1,033 $1,067 $0 $3,174 $2,024 FR IM
Fire $3,637 $3,908 $6,238 $0 $21,181 $14,872 FR IM
29 Average number of days vehicles are held per shop:
Mechanical Maintenance 1.80 1.72 1.31 0.00 2.32 7.45 ECS IM
Glendale Water & Power 2.40 1.47 1.19 0.00 1.63 3.50 ECS IM
Civic Center 1.30 0.48 0.70 0.00 1.52 4.55 ECS IM
Fire 9.00 4.19 12.42 0.00 9.16 13.85 ECS IM
30 Number of vehicle and equipment breakdowns by shop:
Mechanical Maintenance 33 22 21 0 201 161 IM -
Glendale Water & Power 6 2 3 0 45 82 IM -
Civic Center 3 4 0 0 6 9 IM -
Fire 1 1 1 0 11 14 IM -
31 Total fuel consumption in gallons:
Unleaded 105,578 94,962 95,921 0 375,757 402,588 S IM
Diesel 27,712 27,455 30,560 0 100,612 112,309 S IM
CNG 68,672 68,726 67,508 0 279,371 278,578 S IM
32 Percentage of vehicles and equipment exceeding replacement criteria 45% 45% 45% 0% 58% 49% IM -
33 Percentage of scheduled vs. non-scheduled repairs 44% 44% 45% 0% 44% 55% IM -
34 Number of Industrial Off Duty (IOD) days 69 71 202 0 51 109 SHC -
35 Percentage of equipment available by shop:
Mechanical Maintenance 96% 96% 97% 0% 97% 93% IM ECS
Glendale Water & Power 94% 97% 97% 0% 96% 96% IM ECS
Civic Center 96% 97% 98% 0% 96% 96% IM ECS
Fire 90% 94% 87% 0% 89% 92% IM ECS
36 Percentage of direct labor hours by shop:
Mechanical Maintenance 72% 77% 83% 0% 83% 69% IM FR
Glendale Water & Power 74% 65% 67% 0% 95% 70% IM FR
Civic Center 77% 87% 95% 0% 83% 55% IM FR
37 of 232

Performance Indicator
1st
Quarter
2nd
Quarter
3rd
Quarter
4th
Quarter
FY 2015-16
Actual
FY 2014-15
Actual
FY 2013-14
Actual Primary Secondary
Council Priority
Public Works
Key Performance IndicatorsFY 2015-16
FY 2015-16 Quarterly Results
Fire 99% 74% 81% 0% 68% 59% IM FR
Integrated Waste Division
37 Annual percentage of waste diverted from Scholl landfill (annual measure) N/A N/A N/A -$ 66% N/A S -
38 Total tons of residential refuse collected 8,985 9,508 8,977 0 36,120 35,247 S IM
39 Total tons of commercial refuse collected 9,046 8,596 9,150 0 34,899 33,270 S IM
40 Total tons of all refuse collected 18,031 18,104 18,127 0 71,019 68,517 S IM
41 Total tons of green waste collected 3,818 4,772 3,852 0 15,213 17,272 S IM
42 Total tons of recyclables collected 2,803 2,841 2,786 0 11,083 10,847 S IM
43 Total tons of street sweeping refuse collected 275 345 318 0 1,652 1,965 S IM
44 Total tons of e-waste collected 25 25 24 0 78 65 S IM
45 Total tons of bulky and abandoned items collected 453 382 507 0 1,781 1,210 ECS S
46 Total tons of recyclables collected through buy-back facility 2,138 3,108 2,044 0 10,754 9,149 S -
47 Cost per ton of waste diverted $203 $202 $207 $0 $204 $198 FR -
48 Total number of bulky item stops 5,731 4,087 4,417 0 14,902 12,174 ECS -
49 Total number of abandoned items stops 1,207 827 1,241 0 3,419 5,011 ECS -
50 Number of refuse collection service calls 14,598 14,415 14,888 0 44,965 38,742 ECS -
51 Cost per ton of waste collected $164 $175 $181 $0 $184 $199 FR -
52 Revenue per ton of waste collected $205 $207 $214 $0 $195 $197 FR -
53 Curb miles of streets swept 7,113 8,152 7,130 0 33,275 37,567 IM SHC
54 Cost per curb mile of streets swept $43 $51 $59 $0 $35 $33 FR -
55 Number of Industrial Off Duty (IOD) days 496 438 391 0 1,322 842 SHC -
Maintenance Services Division
56 Total square feet of potholes filled 1,958 2,359 3,180 0 14,553 10,909 IM SHC
57 Total square feet of sidewalks repaired 8,339 6,416 6,862 0 30,998 45,807 IM SHC
58 Street trees trimmed 832 3,314 2,285 0 9,286 12,582 IM SHC
59 Street trees planted 2 145 8 0 326 795 S IM
60 Number of storm drain catch basins cleaned 1,357 364 531 0 2,963 1,685 IM SHC
61 Storm drain catch basin inspections completed 435 567 683 0 3,942 1,488 IM SHC
62 Linear feet of sanitary sewer inspected (CCTV) 61,959 57,049 59,934 0 272,424 317,919 IM SHC
63 Linear feet of sanitary sewer cleaned 382,925 344,797 421,406 0 1,430,391 1,561,214 IM SHC
64 Illicit discharge violations into storm drain or sewer system 3 4 3 0 3 14 S -
65 Number of service requests received 782 758 701 0 9,230 8,132 ECS -
66 Number of service requests completed 773 727 705 0 8,032 7,821 ECS -
38 of 232

Performance Indicator
1st
Quarter
2nd
Quarter
3rd
Quarter
4th
Quarter
FY 2015-16
Actual
FY 2014-15
Actual
FY 2013-14
Actual Primary Secondary
Council Priority
Public Works
Key Performance IndicatorsFY 2015-16
FY 2015-16 Quarterly Results
67 Number of Industrial Off Duty (IOD) days 117 123 118 0 642 437 SHC -
68 Linear feet of painted traffic curbs and/or street striping 190,095 22,580 18,766 0 145,160 355,583 SHC -
69 Number of traffic signs installed and/or repaired 176 411 718 0 1,248 1,934 IM SHC
70 Number of parking meters repaired 6,781 4,527 4,889 0 24,482 20,581 IM -
39 of 232

Department Dashboards
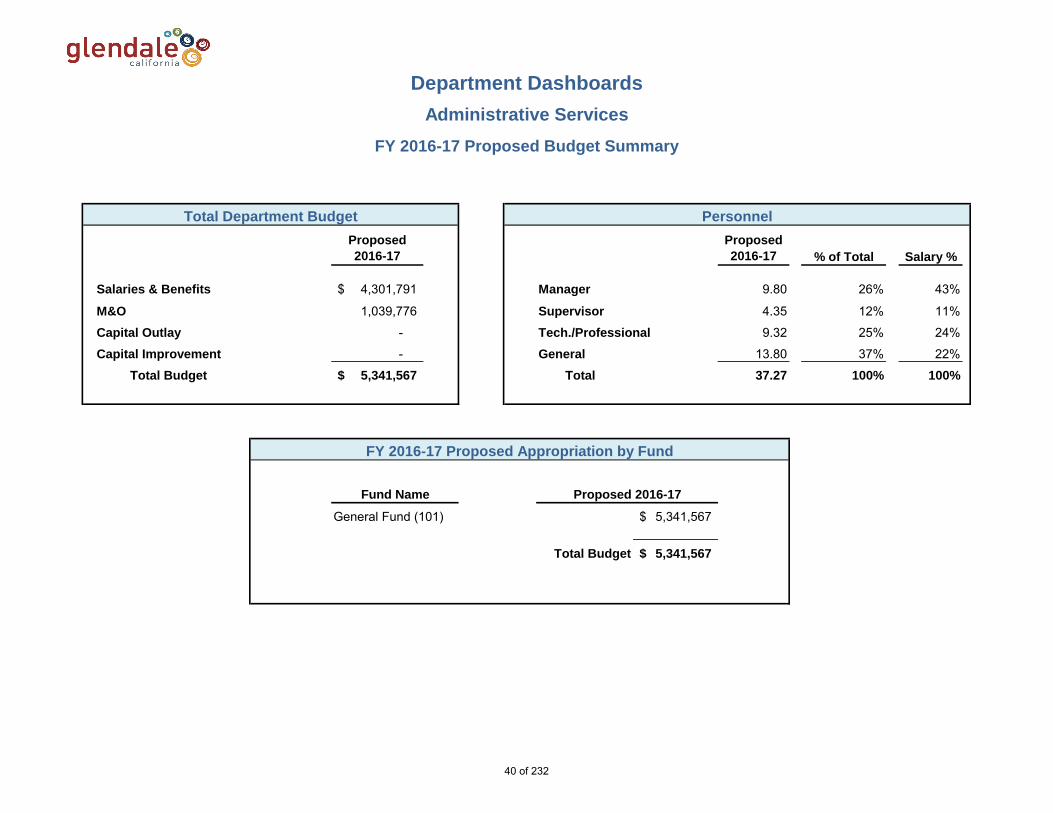
Proposed
2016-17
Proposed
2016-17 % of Total Salary %
Salaries & Benefits 4,301,791$ Manager 9.80 26% 43%
M&O 1,039,776 Supervisor 4.35 12% 11%
Capital Outlay - Tech./Professional 9.32 25% 24%
Capital Improvement - General 13.80 37% 22%
Total Budget 5,341,567$ Total 37.27 100% 100%
General Fund (101) 5,341,567$
Total Budget 5,341,567$
Proposed 2016-17Fund Name
FY 2016-17 Proposed Appropriation by Fund
Department Dashboards
Administrative Services
FY 2016-17 Proposed Budget Summary
Total Department Budget Personnel
40 of 232
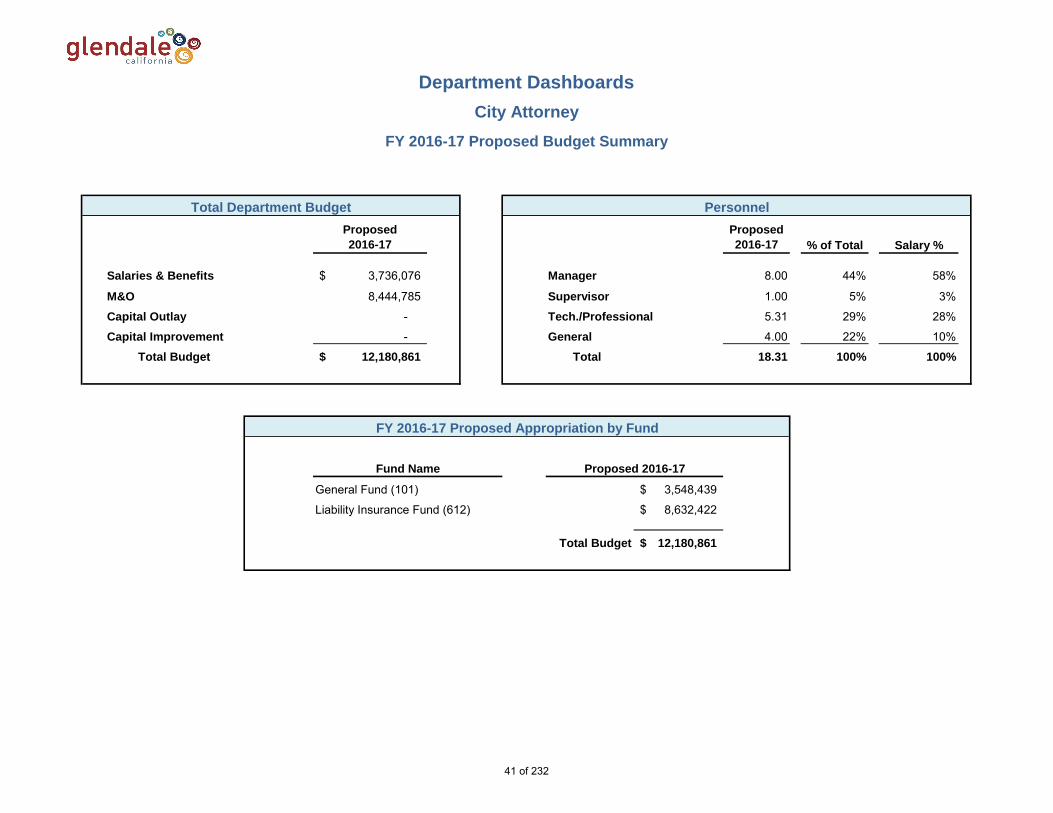
Proposed
2016-17
Proposed
2016-17 % of Total Salary %
Salaries & Benefits 3,736,076$ Manager 8.00 44% 58%
M&O 8,444,785 Supervisor 1.00 5% 3%
Capital Outlay - Tech./Professional 5.31 29% 28%
Capital Improvement - General 4.00 22% 10%
Total Budget 12,180,861$ Total 18.31 100% 100%
General Fund (101) 3,548,439$
Liability Insurance Fund (612) 8,632,422$
Total Budget 12,180,861$
FY 2016-17 Proposed Appropriation by Fund
Proposed 2016-17Fund Name
Department Dashboards
City Attorney
FY 2016-17 Proposed Budget Summary
Total Department Budget Personnel
41 of 232

Proposed
2016-17
Proposed
2016-17 % of Total Salary %
Salaries & Benefits 683,206$ Manager 2.00 32% 46%
M&O 666,424 Supervisor - - -
Capital Outlay - Tech./Professional 1.00 16% 18%
Capital Improvement - General 3.30 52% 36%
Total Budget 1,349,630$ Total 6.30 100% 100%
General Fund (101) 1,349,630$
Total Budget 1,349,630$
Fund Name Proposed 2016-17
FY 2016-17 Proposed Appropriation by Fund
Department Dashboards
City Clerk
FY 2016-17 Proposed Budget Summary
Total Department Budget Personnel
42 of 232

Proposed
2016-17
Proposed
2016-17 % of Total Salary %
Salaries & Benefits 635,333$ Manager 2.00 40% 61%
M&O 106,831 Supervisor - - -
Capital Outlay - Tech./Professional - - -
Capital Improvement - General 3.00 60% 39%
Total Budget 742,164$ Total 5.00 100% 100%
General Fund (101) 742,164$
Total Budget 742,164$
FY 2016-17 Proposed Appropriation by Fund
Proposed 2016-17Fund Name
Department Dashboards
City Treasurer
FY 2016-17 Proposed Budget Summary
Total Department Budget Personnel
43 of 232
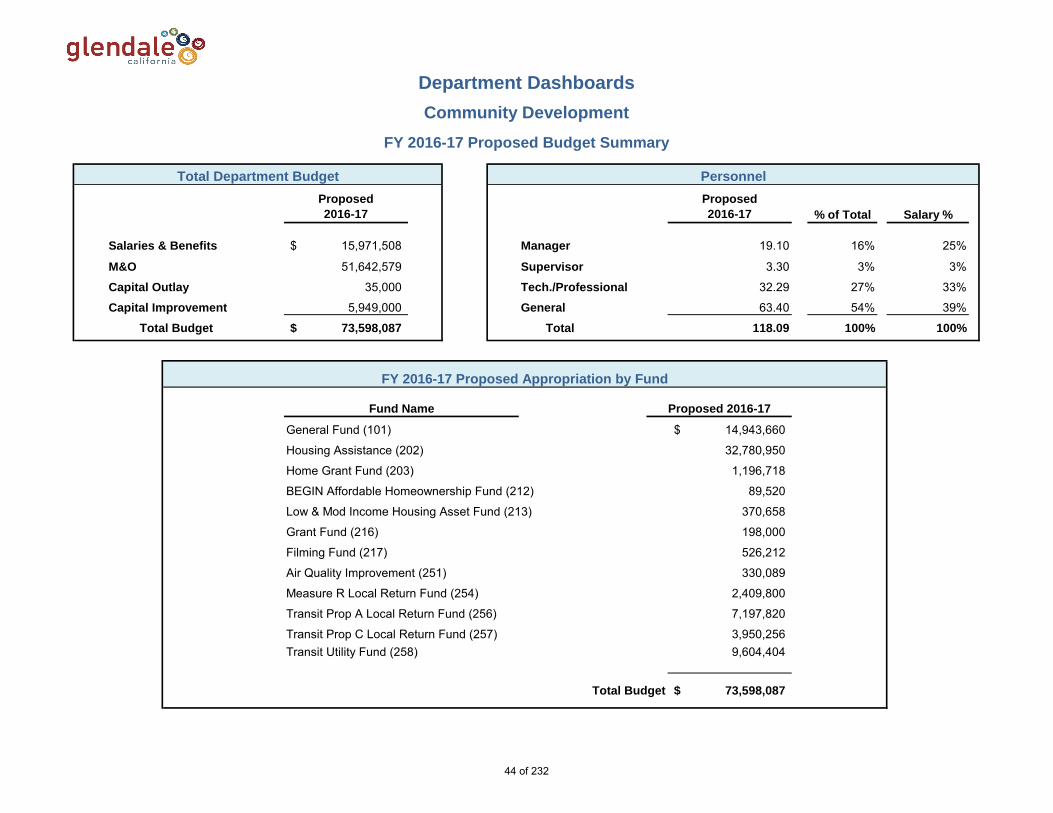
Proposed
2016-17
Proposed
2016-17 % of Total Salary %
Salaries & Benefits 15,971,508$ Manager 19.10 16% 25%
M&O 51,642,579 Supervisor 3.30 3% 3%
Capital Outlay 35,000 Tech./Professional 32.29 27% 33%
Capital Improvement 5,949,000 General 63.40 54% 39%
Total Budget 73,598,087$ Total 118.09 100% 100%
General Fund (101) 14,943,660$
Housing Assistance (202) 32,780,950
Home Grant Fund (203) 1,196,718
BEGIN Affordable Homeownership Fund (212) 89,520
Low & Mod Income Housing Asset Fund (213) 370,658
Grant Fund (216) 198,000
Filming Fund (217) 526,212
Air Quality Improvement (251) 330,089
Measure R Local Return Fund (254) 2,409,800
Transit Prop A Local Return Fund (256) 7,197,820
Transit Prop C Local Return Fund (257) 3,950,256 Transit Utility Fund (258) 9,604,404
Total Budget 73,598,087$
FY 2016-17 Proposed Appropriation by Fund
Fund Name Proposed 2016-17
Department Dashboards
Community Development
FY 2016-17 Proposed Budget Summary
Total Department Budget Personnel
44 of 232

Proposed
2016-17
Proposed
2016-17 % of Total Salary %
Salaries & Benefits 15,654,085$ Manager 20.10 20% 33%
M&O 12,178,780 Supervisor 4.35 4% 5%
Capital Outlay - Tech./Professional 9.83 10% 11%
Capital Improvement 17,897,731 General 65.05 65% 51%
Total Budget 45,730,596$ Total 99.33 100% 100%
General Fund (101) 12,631,020$
CDBG Fund (201) 1,643,605
Continuum of Care Grant (204) 2,319,804
Emergency Solutions Grant Fund (205) 142,237
Workforce Investment Act Fund (206) 5,505,000
Glendale Youth Alliance (211) 1,905,519
Nutritional Meals Grant Fund (270) 430,827
Recreation Fund (501) 3,579,584
Capital Improvement Fund (401) 1,400,000
Parks Mitigation Fee Fund (405) 16,173,000
Total Budget 45,730,596$
Proposed 2016-17Fund Name
FY 2016-17 Proposed Appropriation by Fund
Department Dashboards
Community Services & Parks
FY 2016-17 Proposed Budget Summary
Total Department Budget Personnel
45 of 232

Proposed
2016-17 % of Total Salary %
Salaries & Benefits 49,055,711$ Manager 12.00 6% 8%
M&O 12,072,191 Supervisor 43.00 21% 25%
Capital Outlay - Tech./Professional 12.00 6% 5%
Capital Improvement 175,000 General 142.00 68% 63%
Total Budget 61,302,902$ Total 209.00 100% 100%
General Fund (101) 48,702,523$
Fire Mutual Aid Fund (266) 250,000
Special Events Fund (267) 5,545
Hazardous Disposal Fund (510) 1,534,266
Emergency Medical Services Fund (511) 5,917,304
Capital Improvement Fund (401) 551,000
Fire Communications Fund (701) 4,342,264
Total Budget 61,302,902$
Fund Name Proposed 2016-17
FY 2016-17 Proposed Appropriation by Fund
Department Dashboards
Fire
FY 2016-17 Proposed Budget Summary
Total Department Budget Personnel
Proposed
2016-17
46 of 232

Proposed
2016-17 % of Total Salary %
Salaries & Benefits 31,544,890$ Manager 24.00 7% 13%
M&O 278,111,724 Supervisor 49.00 15% 18%
Capital Outlay 1,136,000 Tech./Professional 41.50 13% 15%
Capital Improvement 23,355,191 General 213.00 65% 55%
Total Budget 334,147,805$ Total 327.50 100% 100%
Electric Public Benefit Fund (290) 7,711,563$
Electric Works Revenu Fund (552) 251,103,371
Electric Depreciation Fund (553) 15,768,182
Electric Customer Paid Capital Fund (555) 1,894,751
Water Works Revenue Fund (572) 51,977,680
Water Depreciation Fund (573) 4,222,618
Water Customer Paid Capital Fund (575) 1,469,640
Total Budget 334,147,805$
Proposed
2016-17
Proposed 2016-17Fund Name
FY 2016-17 Proposed Appropriation by Fund
Department Dashboards
Glendale Water and Power
FY 2016-17 Proposed Budget Summary
Total Department Budget Personnel
47 of 232

Proposed
2016-17 % of Total Salary %
Salaries & Benefits 3,019,866$ Manager 5.00 21% 34%
M&O 58,248,458 Supervisor - - -
Capital Outlay - Tech./Professional 7.95 33% 35%
Capital Improvement - General 10.95 46% 31%
Total Budget 61,268,324$ Total 23.90 100% 100%
General Fund (101) 2,654,861$
Unemployment Fund (610) 78,243
Compensation Insurance Fund (614) 12,928,223
Dental Insurance Fund (615) 1,655,291
Medical Insurance Fund (616) 35,101,482
Vision Insurance Fund (617) 294,568
Employee Benefits Fund (640) 4,317,791
RHSP Benefits Fund (641) 2,017,690
Post Employment Benefits Fund (642) 2,220,175
Total Budget 61,268,324$
Proposed
2016-17
Proposed 2016-17Fund Name
FY 2016-17 Proposed Appropriation by Fund
Department Dashboards
Human Resources
FY 2016-17 Proposed Budget Summary
Total Department Budget Personnel
48 of 232

Proposed
2016-17 % of Total Salary %
Salaries & Benefits 6,266,542$ Manager 6.00 14% 22%
M&O 9,937,462 Supervisor 2.00 5% 4%
Capital Outlay 1,259,320 Tech./Professional 17.00 40% 42%
Capital Improvement - General 17.00 40% 32%
Total Budget 17,463,324$ Total 42.00 100% 100%
ISD Infrastructure Fund (603) 7,773,035$
ISD Applications Fund (604) 6,498,261
ISD Wireless Fund (660) 3,192,028
Total Budget 17,463,324$
Proposed
2016-17
Proposed 2016-17Fund Name
FY 2016-17 Proposed Appropriation by Fund
Department Dashboards
Information Services
FY 2016-17 Proposed Budget Summary
Total Department Budget Personnel
49 of 232

Proposed
2016-17 % of Total Salary %
Salaries & Benefits 6,265,196$ Manager 14.00 30% 40%
M&O 3,809,713 Supervisor 1.00 2% 2%
Capital Outlay - Tech./Professional 17.00 36% 36%
Capital Improvement 905,000 General 15.00 32% 23%
Total Budget 10,979,909$ Total 47.00 100% 100%
General Fund (101) 9,594,695$
Urban Art Fund (210) 235,000
Library Fund (275) 245,214
Capital Improvement Fund (401) 350,000
Library Mitigation Fee Fund (407) 555,000
Total Budget 10,979,909$
Department Dashboards
Library, Arts & Culture
FY 2016-17 Proposed Budget Summary
Proposed
2016-17
Proposed 2016-17
FY 2016-17 Proposed Appropriation by Fund
Fund Name
PersonnelTotal Department Budget
50 of 232

Proposed
2016-17 % of Total Salary %
Salaries & Benefits 3,090,438$ Manager 10.00 45% 58%
M&O 1,301,844 Supervisor 2.00 9% 9%
Capital Outlay - Tech./Professional 1.00 5% 5%
Capital Improvement - General 9.00 41% 27%
Total Budget 4,392,282$ Total 22.00 100% 100%
General Fund (101) 4,392,282$
Total Budget 4,392,282$
Proposed
2016-17
Fund Name Proposed 2016-17
FY 2016-17 Proposed Appropriation by Fund
Department Dashboards
Management Services
FY 2016-17 Proposed Budget Summary
Total Department Budget Personnel
51 of 232

Proposed
2016-17 % of Total Salary %
Salaries & Benefits 62,280,033$ Manager 18.60 5% 9%
M&O 16,718,727 Supervisor 49.50 15% 18%
Capital Outlay - Tech./Professional 10.00 3% 2%
Capital Improvement - General 261.50 77% 71%
Total Budget 78,998,760$ Total 339.60 100% 100%
General Fund (101) 72,730,666$
Asset Forfeiture Fund (260) 568,473
Police Special Grants Fund (261) 363,528
Supplemental Law Enforcement Fund (262) 397,501
Special Events Fund (267) 301,940
Police Building Project Fund (303) 3,010,000
Joint Helicopter Operation Fund (602) 1,626,652
Total Budget 78,998,760$
Proposed
2016-17
Fund Name
FY 2016-17 Proposed Appropriation by Fund
Proposed 2016-17
Department Dashboards
Police
FY 2016-17 Proposed Budget Summary
Total Department Budget Personnel
52 of 232

Proposed
2016-17 % of Total Salary %
Salaries & Benefits 28,876,607$ Manager 23.40 8% 15%
M&O 57,575,518 Supervisor 19.50 7% 8%
Capital Outlay 6,096,960 Tech./Professional 28.80 10% 15%
Capital Improvement 13,523,000 General 212.00 75% 62%
Total Budget 106,072,085$ Total 283.70 100% 100%
General Fund (101) 14,184,318$
San Fernando Landscape District Fund (253) 89,986
Capital Improvement Fund (401) 2,479,000
State Gas Tax Fund (402) 1,854,000
Parking Fund (520) 8,829,655
Sewer Fund (525) 30,480,999
Refuse Disposal Fund (530) 24,657,570
Fleet Management Fund (601) 16,023,658
Building Maintenance Fund (607) 7,472,899
Total Budget 106,072,085$
Proposed
2016-17
Proposed 2016-17Fund Name
FY 2016-17 Proposed Appropriation by Fund
Department Dashboards
Public Works
FY 2016-17 Proposed Budget Summary
Total Department Budget Personnel
53 of 232

Proposed
2016-17
Proposed
2016-17 % of Total Salary %
Salaries & Benefits 897,511$ Manager - - -
M&O 5,067,327 Supervisor - - -
Capital Outlay - Tech./Professional - - -
Capital Improvement - General - - -
Total Budget 5,964,838$ Total - - -
General Fund (101) Retirement Incentive 897,511$
General Fund (101) Transfers 3,067,327
Capital Improvement Fund (401) Scholl Canyon Transfer 2,000,000
Total Budget 5,964,838$
FY 2016-17 Proposed Appropriation by Fund
Proposed 2016-17Fund Name
Department Dashboards
Non-Departmental
FY 2016-17 Proposed Budget Summary
Total Non-Departmental Budget Personnel
54 of 232

Study Session #1

City of Glendale Budget Study Session #1
May 3, 2016
55 of 232

Slide 2
Agenda FY 2015-16
• 3rd Quarter Update
• Year-End Projection
• General Fund Forecast
FY 2016-17
• Proposed General Fund Budget
• General Fund Forecast
• Organizational Profile
• Budget Calendar
Questions & Comments
56 of 232

Slide 3
FY 2015-16 Third Quarter Update March 31, 2016
57 of 232
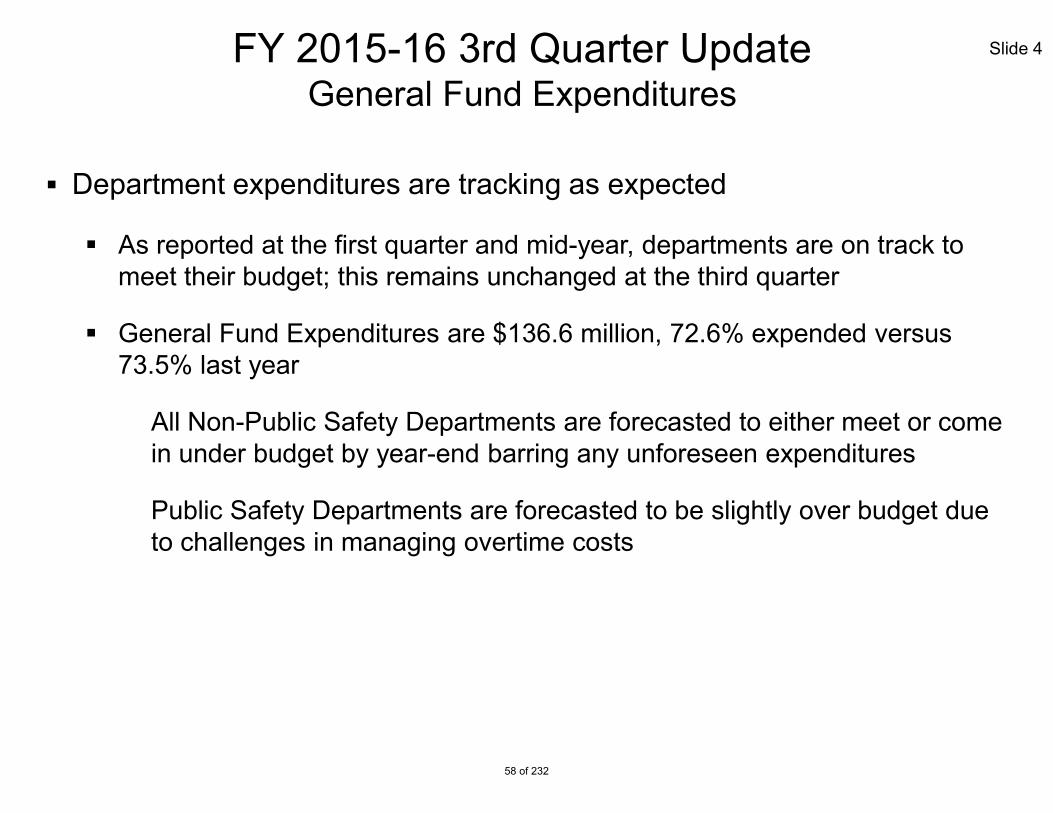
Slide 4 FY 2015-16 3rd Quarter Update General Fund Expenditures
Department expenditures are tracking as expected
As reported at the first quarter and mid-year, departments are on track to meet their budget; this remains unchanged at the third quarter
General Fund Expenditures are $136.6 million, 72.6% expended versus 73.5% last year
– All Non-Public Safety Departments are forecasted to either meet or come in under budget by year-end barring any unforeseen expenditures
– Public Safety Departments are forecasted to be slightly over budget due to challenges in managing overtime costs
58 of 232

Slide 5 General Fund Resources March 31, 2016 (In Thousands)
Adopted 15-16
Adjustments 15-16
Revised Resources
Actual Receipts
% Received
Property Taxes $ 49,740 $ - $ 49,740 $ 26,937 54.2%
Sales Tax 37,700 - 37,700 19,039 50.5%
Utility Users Tax 28,250 - 28,250 19,929 70.5%
Occupancy & Other Taxes 11,000 150 11,150 6,226 55.8%
Licenses And Permits 8,105 250 8,355 7,369 88.2%
Revenue From Other Agencies 350 245 595 662 111.3%
Charges For Services 2,781 582 3,363 2,867 85.3%
Cost Allocation 15,091 (150) 14,941 11,214 75.1%
Fines & Forfeitures 2,850 (50) 2,800 1,852 66.1%
Interest/Use Of Money 3,220 200 3,420 2,766 80.9%
Misc & Non-Operating 1,402 250 1,652 1,479 89.5%
Transfers 21,257 - 21,257 862 4.1%
GSA Reimbursement 3,921 - 3,921 - 0.0%
Subtotal: $ 185,667 $ 1,477 $ 187,144 $ 101,202 54.1%
Use of Fund Balance - 1,088 1,088 - N/A
Total Resources: $ 185,667 $ 2,565 $ 188,232 $ 101,202 53.8%
59 of 232

Slide 6 General Fund Expenditures March 31, 2016 (In Thousands)
Adopted 15-16
Adjustments* 15-16
Revised Budget
Actual Expended
% Expended
Administrative Services $ 5,501 $ 182 $ 5,683 $ 3,796 66.8%
City Attorney 3,190 87 3,277 2,360 72.0%
City Clerk 1,054 396 1,450 543 37.4%
City Treasurer 665 26 691 492 71.2%
Community Development 9,846 448 10,294 7,162 69.6%
Comm. Services & Parks 10,500 496 10,996 7,811 71.0%
Fire 45,027 368 45,395 34,768 76.6%
Human Resources 2,661 56 2,717 1,670 61.5%
Library, Arts & Culture 8,489 1,262 9,751 5,917 60.7%
Management Services 3,869 426 4,295 2,773 64.6%
Police 70,301 220 70,521 53,804 76.3%
Public Works 17,965 1,374 19,339 13,795 71.3%
Transfers 2,125 - 2,125 1,006 47.3%
Retirement Incentive 898 - 898 673 74.9%
OPEB/RHSP 800 - 800 0.0%
Total Expenditures: $ 182,891 $ 5,341 $ 188,232 $ 136,570 72.6%
Proposed 3rd Qtr Adjustments - - - - -
Total Expenditures: $ 182,891 $ 5,341 $ 188,232 $ 136,570 72.6%
* Includes Carryovers & Adjustments 60 of 232

Slide 7
FY 2015-16
Projected
Results
Unassigned
& Charter
Reserve
% of
Budget
Unassigned & Charter Reserve, 7/1/2015 $ 66,052 36.1%
Revenues:
Adopted Revenue 185,667
Adjustments as of March 31, 2016 1,477
Total Revenue as of March 31, 2016 $ 187,144
Appropriations:
Adopted Appropriation (182,891)
Adjustments as of March 31, 2016 (2,214)
Total Appropriation as of March 31, 2016 $ (185,105)
Projected Surplus for FY 2015-16 $ 2,039
Projected Additional FY 2015-16 Savings $ 364
Unassigned & Charter Reserve, 3/31/2016 $ 68,455 37.4%
Less: Carryover Appropriation from FY 2014-15 $ (3,127)
Projected Ending Unassigned & Charter Reserve, 6/30/2016 $ 65,328 35.7%
FY 2015-16 General Fund Projected Fund Balance As of June 30, 2016 (In Thousands)
*Based on FY 2015-16 adopted recurring appropriation of $182.9 million. Current policy is a floor of 30%
with a target of 35% 61 of 232
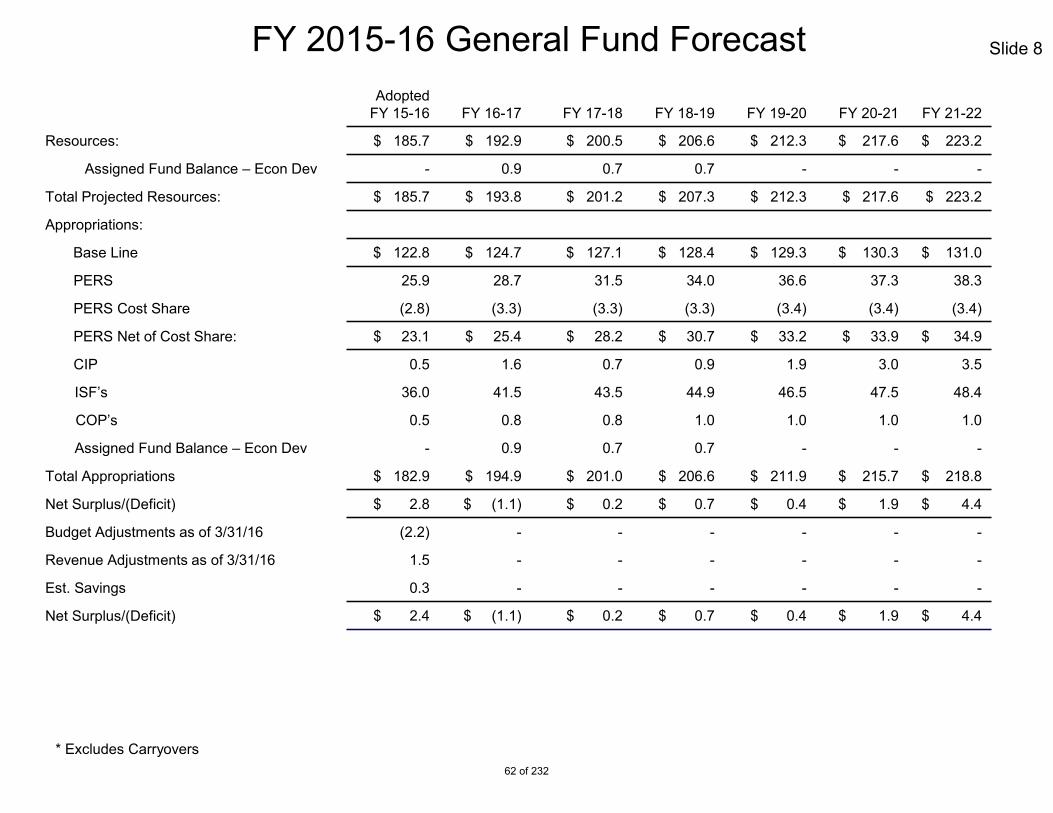
FY 2015-16 General Fund Forecast Adopted
FY 15-16 FY 16-17 FY 17-18 FY 18-19 FY 19-20 FY 20-21 FY 21-22
Resources: $ 185.7 $ 192.9 $ 200.5 $ 206.6 $ 212.3 $ 217.6 $ 223.2
Assigned Fund Balance – Econ Dev - 0.9 0.7 0.7 - - -
Total Projected Resources: $ 185.7 $ 193.8 $ 201.2 $ 207.3 $ 212.3 $ 217.6 $ 223.2
Appropriations:
Base Line $ 122.8 $ 124.7 $ 127.1 $ 128.4 $ 129.3 $ 130.3 $ 131.0
PERS 25.9 28.7 31.5 34.0 36.6 37.3 38.3
PERS Cost Share (2.8) (3.3) (3.3) (3.3) (3.4) (3.4) (3.4)
PERS Net of Cost Share: $ 23.1 $ 25.4 $ 28.2 $ 30.7 $ 33.2 $ 33.9 $ 34.9
CIP 0.5 1.6 0.7 0.9 1.9 3.0 3.5
ISF’s 36.0 41.5 43.5 44.9 46.5 47.5 48.4
COP’s 0.5 0.8 0.8 1.0 1.0 1.0 1.0
Assigned Fund Balance – Econ Dev - 0.9 0.7 0.7 - - -
Total Appropriations $ 182.9 $ 194.9 $ 201.0 $ 206.6 $ 211.9 $ 215.7 $ 218.8
Net Surplus/(Deficit) $ 2.8 $ (1.1) $ 0.2 $ 0.7 $ 0.4 $ 1.9 $ 4.4
Budget Adjustments as of 3/31/16 (2.2) - - - - - -
Revenue Adjustments as of 3/31/16 1.5 - - - - - -
Est. Savings 0.3 - - - - - -
Net Surplus/(Deficit) $ 2.4 $ (1.1) $ 0.2 $ 0.7 $ 0.4 $ 1.9 $ 4.4
* Excludes Carryovers
Slide 8
62 of 232

Slide 9 Cash Balances – All Funds March 31, 2016 (In Thousands)
Major Funds:
General Fund $ 62,764
Housing Assistance Fund 2,575
Capital Improvement Fund 9,159
Sewer Fund 58,750
Electric Fund 215,560
Operating Cash $ 108,673
Transfer Reserve 15,080
Restricted Cash 12,087
Operating Reserve 41,900
Bond Cash 37,820
Water Fund $ 16,193
Operating Cash $ (550)
Restricted Cash 5,131
Bond Cash 11,612
Major Funds Total: $ 365,001
Other Funds:
Capital Projects Funds $ 56,128
Debt Service Funds 21,840
Special Revenue Funds 65,813
Nonmajor Enterprise Funds 35,898
Internal Service Funds 109,530
Other Funds Total: $ 289,209
Grand Total: $ 654,210
63 of 232

FY 2016-17 General Fund Proposed Budget
64 of 232
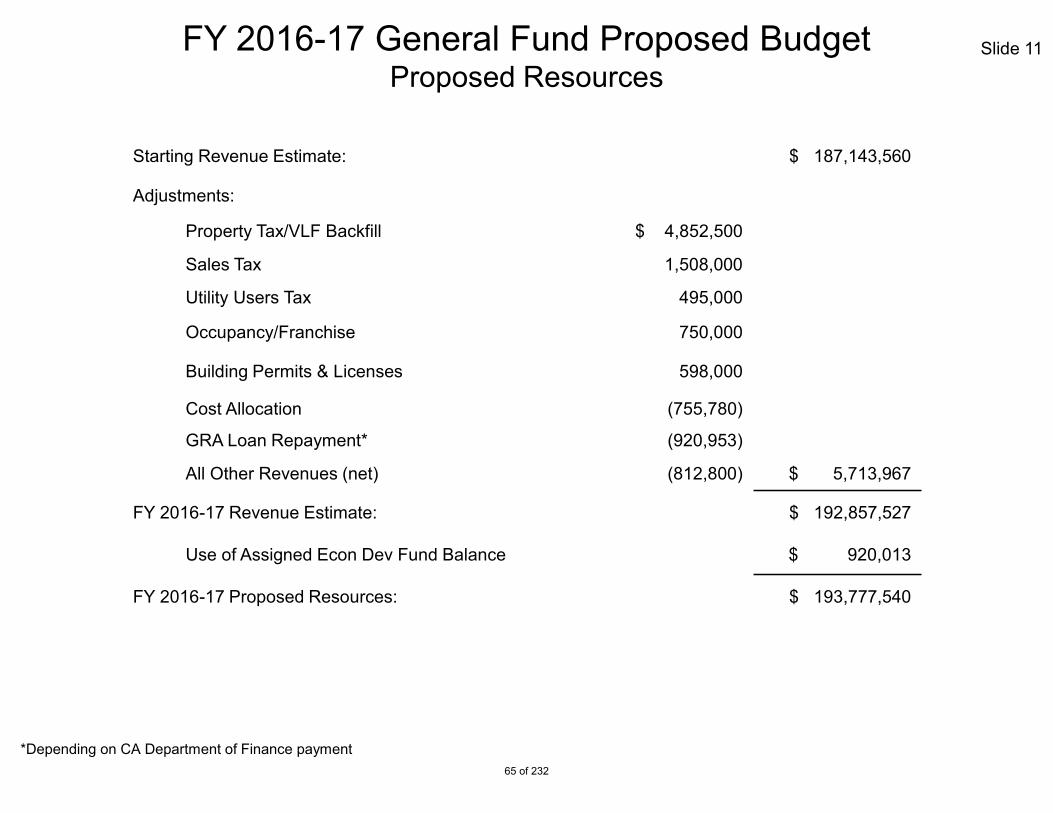
Slide 11
Starting Revenue Estimate: $ 187,143,560
Adjustments:
Property Tax/VLF Backfill $ 4,852,500
Sales Tax 1,508,000
Utility Users Tax 495,000
Occupancy/Franchise 750,000
Building Permits & Licenses 598,000
Cost Allocation (755,780)
GRA Loan Repayment* (920,953)
All Other Revenues (net) (812,800) $ 5,713,967
FY 2016-17 Revenue Estimate: $ 192,857,527
Use of Assigned Econ Dev Fund Balance $ 920,013
FY 2016-17 Proposed Resources: $ 193,777,540
FY 2016-17 General Fund Proposed Budget Proposed Resources
*Depending on CA Department of Finance payment 65 of 232

Slide 12
Property Tax forecasted to increase 9.8%
Sales Tax forecasted to increase 4.0%
Occupancy Tax will increase approximately 12.1% due to the increase of the TOT rate from 10.0% to 12.0% and the continued economic recovery
Overall General Fund revenues expected to grow at 3.1%
• Other increases include Utility Users’ Tax 1.8%, Franchise Tax 3.4%, Licenses and
Permits 10.4%
• Some of the increases are offset by the decreases in Cost Allocation revenue, Fines & Forfeitures and Revenues from Other Agencies
• Electric Fund Transfer to General Fund is now equal to 10.0% starting in FY 2016-17
FY 2016-17 General Fund Proposed Budget Revenue Changes
66 of 232

Slide 13
Starting Budget $ 182,890,934
Salaries & Benefits Increase
Salaries $ 1,730,038
PERS, Net of Cost Share 2,327,775
Hourly Wages-Less Econ Dev 546,439
Overtime 112,896
All Other Benefits (Medical, Dental, Vision, Work’ Comp, etc.) 120,488
Total Salaries & Benefits Increase $ 4,837,636
Use of Assigned Econ Dev Fund Balance-Hourly Wages & Benefits $ 723,960 $ 5,561,596
Maintenance & Operation Increase / (Decrease)
Liability Insurance (605,541)
Fleet/Equipment Rental Charge (140,904)
ISD Service Charge 825,579
All Other M&O 5,291,326
Total Maintenance & Operations Increase $ 5,370,460
Use of Assigned Econ Dev Fund Balance-Contractual Services $ 196,053 $ 5,566,513
Transfers Out/Capital Outlay $ 906,886
Proposed FY 2016-17 General Fund Budget $ 194,005,916
Use of Assigned Econ Dev Fund Balance $ 920,013
Total Proposed FY 2016-17 General Fund Budget $ 194,925,929
FY 2016-17 General Fund Proposed Budget Proposed Appropriations
67 of 232

Slide 14
Salaries & Benefits total increase of $5.5 million compared to $5.2 million last year
Cost of Living Adjustments for GMA (3%), GCEA (3%) and Hourly Employees (1%)
– Offset by an increase of 1% in PERS cost share
Net PERS increase of $2.3 million compared to $3.0 million last year
Workers’ Comp increase of $270 thousand
– Fund Balance deficit is $14.4 million as of June 30, 2015
– Will be amortized over next 5 years
$1.7 million in increase for program restoration in personnel costs
$724 thousand is for Economic Development Hourly Wages and Benefits using Assigned Fund Balance
FY 2016-17 General Fund Proposed Budget Salary & Benefit Changes
68 of 232

Slide 15
Maintenance & Operation increase by $5.5 million
$749 thousand increase in Program Restoration
$825 thousand increase in ISD Service Charge
$1.1 million increase in Economic Development Shifting to the General Fund
$2.5 million increase due to Building Maintenance costs shifting to Maintenance & Operation offset by Salaries and Benefits decreases
$179 thousand increase due to adjustments in the Elections budget
$100 thousand increase due to Maintenance of Graphics Printers
FY 2016-17 General Fund Proposed Budget Maintenance & Operation Changes
69 of 232
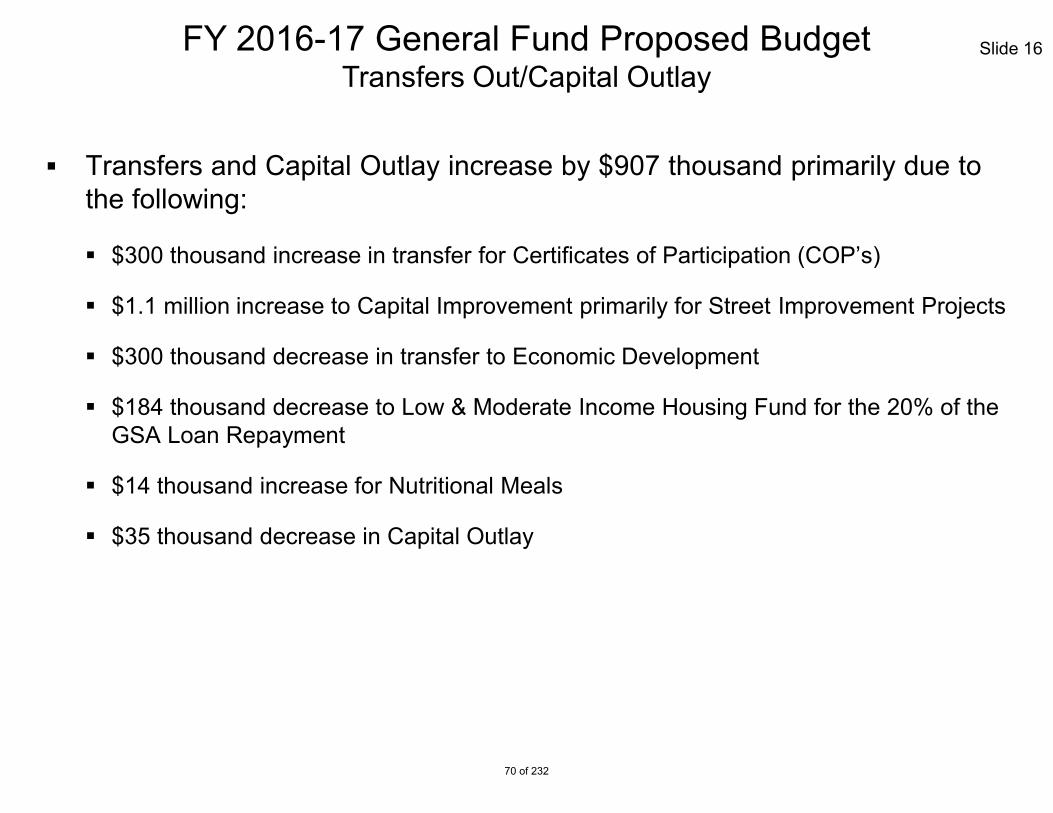
Slide 16
Transfers and Capital Outlay increase by $907 thousand primarily due to the following:
$300 thousand increase in transfer for Certificates of Participation (COP’s)
$1.1 million increase to Capital Improvement primarily for Street Improvement Projects
$300 thousand decrease in transfer to Economic Development
$184 thousand decrease to Low & Moderate Income Housing Fund for the 20% of the GSA Loan Repayment
$14 thousand increase for Nutritional Meals
$35 thousand decrease in Capital Outlay
FY 2016-17 General Fund Proposed Budget Transfers Out/Capital Outlay
70 of 232
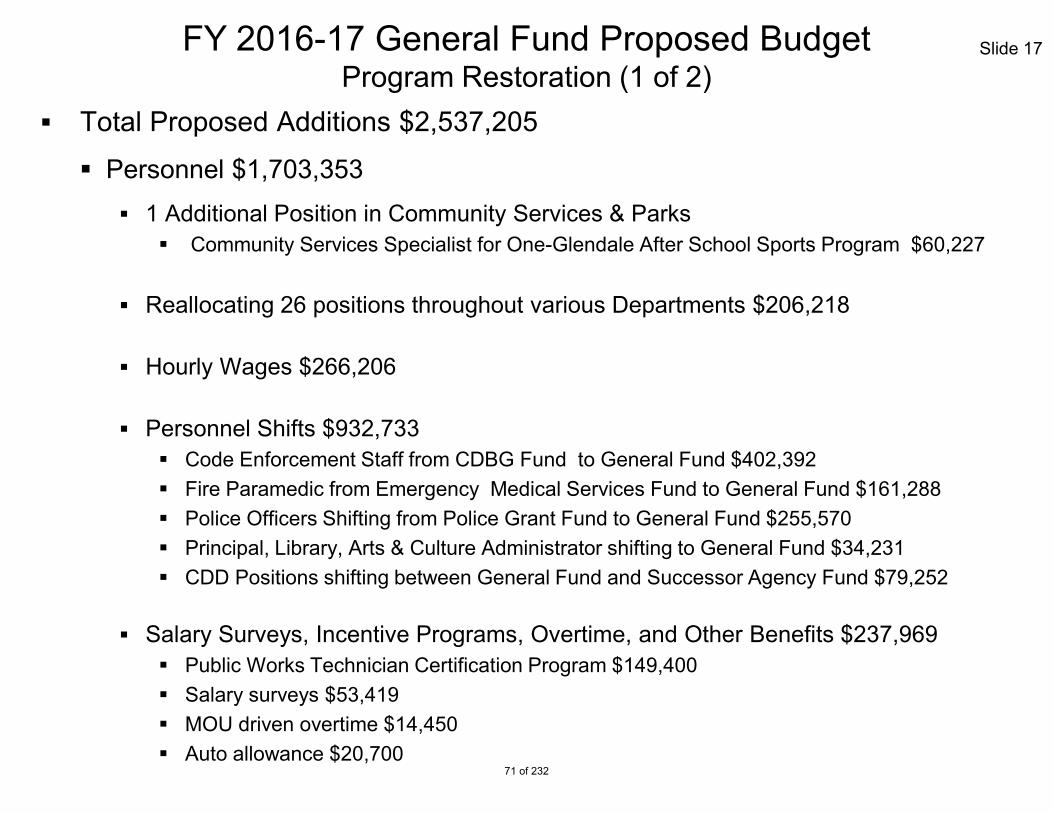
Slide 17
Total Proposed Additions $2,537,205
Personnel $1,703,353 1 Additional Position in Community Services & Parks
Community Services Specialist for One-Glendale After School Sports Program $60,227 Reallocating 26 positions throughout various Departments $206,218 Hourly Wages $266,206
Personnel Shifts $932,733 Code Enforcement Staff from CDBG Fund to General Fund $402,392 Fire Paramedic from Emergency Medical Services Fund to General Fund $161,288 Police Officers Shifting from Police Grant Fund to General Fund $255,570 Principal, Library, Arts & Culture Administrator shifting to General Fund $34,231 CDD Positions shifting between General Fund and Successor Agency Fund $79,252
Salary Surveys, Incentive Programs, Overtime, and Other Benefits $237,969 Public Works Technician Certification Program $149,400 Salary surveys $53,419 MOU driven overtime $14,450 Auto allowance $20,700
FY 2016-17 General Fund Proposed Budget Program Restoration (1 of 2)
71 of 232

Slide 18
Maintenance & Operation, and Transfers-Out $833,852
Community Development Department Revised Code Books $20,000
Community Services & Parks Students as Role Models Program (STAR) After School Program $3,000 Transfer to Nutritional Meals Fund $84,577 One-Glendale After School Sports Program $157,131
Fire
Inspection Code Books $20,000 SCBA Bottle Replacement Program $53,955 Verdugo Dispatch Services $121,105 Hose, Valves, Thermal Imagers for Two Fire Engines $260,084 Emergency Supply Kit Replacement $59,000
Public Works
Fairmont Bridge Crash Cushion Repair & Maintenance $15,000 Traffic Safety Control Paint $40,000
FY 2016-17 General Fund Proposed Budget Program Restoration (2 of 2)
72 of 232

Slide 19
Revenues: $ 193,777,540
Appropriations: 194,925,929
Surplus/(Deficit): $ (1,148,389)
FY 2016-17 General Fund Proposed Budget
73 of 232

Slide 20 FY 2016-17 General Fund Proposed Budget Fund Balance Projection
Unassigned & Charter Reserve
Projected Beginning Balance, 7/1/2016 $ 65,328,000
Projected Net Surplus/(Deficit) (1,148,389)
Projected Ending Fund Balance, 6/30/2017 $ 64,179,611
Projected Reserve Percentage* 33.1%
* Based on proposed recurring appropriation of $194.0 million. Current policy is floor of 30% with a target of 35%.
74 of 232

FY 2016-17 General Fund Forecast
* Excludes Carryovers
Slide 21
Adopted FY 15-16 FY 16-17 FY 17-18 FY 18-19 FY 19-20 FY 20-21 FY 21-22
Resources: $ 185.7 $ 192.9 $ 200.5 $ 206.6 $ 212.3 $ 217.6 $ 223.2
Assigned Fund Balance – Econ Dev - 0.9 0.7 0.7 - - -
Total Projected Resources: $ 185.7 $ 193.8 $ 201.2 $ 207.3 $ 212.3 $ 217.6 $ 223.2
Appropriations:
Base Line $ 122.8 $ 124.7 $ 127.1 $ 128.4 $ 129.3 $ 130.3 $ 131.0
PERS 25.9 28.7 31.5 34.0 36.6 37.3 38.3
PERS Cost Share (2.8) (3.3) (3.3) (3.3) (3.4) (3.4) (3.4)
PERS Net of Cost Share: $ 23.1 $ 25.4 $ 28.2 $ 30.7 $ 33.2 $ 33.9 $ 34.9
CIP 0.5 1.6 0.7 0.9 1.9 3.0 3.5
ISF’s 36.0 41.5 43.5 44.9 46.5 47.5 48.4
COP’s 0.5 0.8 0.8 1.0 1.0 1.0 1.0
Assigned Fund Balance – Econ Dev - 0.9 0.7 0.7 - - -
Total Appropriations $ 182.9 $ 194.9 $ 201.0 $ 206.6 $ 211.9 $ 215.7 $ 218.8
Net Surplus/(Deficit) $ 2.8 $ (1.1) $ 0.2 $ 0.7 $ 0.4 $ 1.9 $ 4.4
Budget Adjustments as of 3/31/16 (2.2) - - - - - -
Revenue Adjustments as of 3/31/16 1.5 - - - - - -
Est. Savings 0.3 - - - - - -
Net Surplus/(Deficit) $ 2.4 $ (1.1) $ 0.2 $ 0.7 $ 0.4 $ 1.9 $ 4.4
75 of 232

FY 2016-17
Organizational Profile
76 of 232

Slide 23 FY 2016-17 Citywide Organizational Profile
Adopted FY 2015-16
Proposed FY 2016-17
Total Population 199,182 201,668
Total City Employees (FTE) Budgeted 1,566 1,579
Total General Fund FTE 882 866
Total Adopted Budget $ 797,829,593 $ 819,987,400
Total General Fund Adopted Budget $ 182,890,934 $ 194,925,929
Residents served per FTE 127 128
Residents served per FTE (General Fund) 226 233
Total Budget per capita $4,006 $4,066
General Fund Budget per capita $918 $967
77 of 232

Slide 24 FY 2016-17 Citywide Organizational Profile Per Capita Tri-City Comparison – General Fund
Property Tax
Adopted FY 2011-12
Adopted FY 2012-13
Adopted FY 2013-14
Adopted FY 2014-15
Adopted FY 2015-16
Glendale $ 221 $ 229 $ 232 $ 235 $ 250
Burbank $ 253 $ 304 $ 301 $ 323 $ 336
Pasadena $ 285 $ 285 $ 291 $ 313 $ 371
Glendale 191,719 193,111 194,478 196,021 199,182 Burbank 104,304 104,427 104,982 105,543 106,084
Pasadena 137,122 139,222 140,020 140,879 141,510
Population
78 of 232

Slide 25 FY 2016-17 Citywide Organizational Profile Per Capita Tri-City Comparison – General Fund
Sales Tax
Adopted FY 2011-12
Adopted FY 2012-13
Adopted FY 2013-14
Adopted FY 2014-15
Adopted FY 2015-16
Glendale $ 149 $ 161 $ 169 $ 174 $ 189
Burbank $ 275 $ 282 $ 281 $ 280 $ 299
Pasadena $ 228 $ 224 $ 226 $ 235 $ 240
Glendale 191,719 193,111 194,478 196,021 199,182 Burbank 104,304 104,427 104,982 105,543 106,084
Pasadena 137,122 139,222 140,020 140,879 141,510
Population
79 of 232
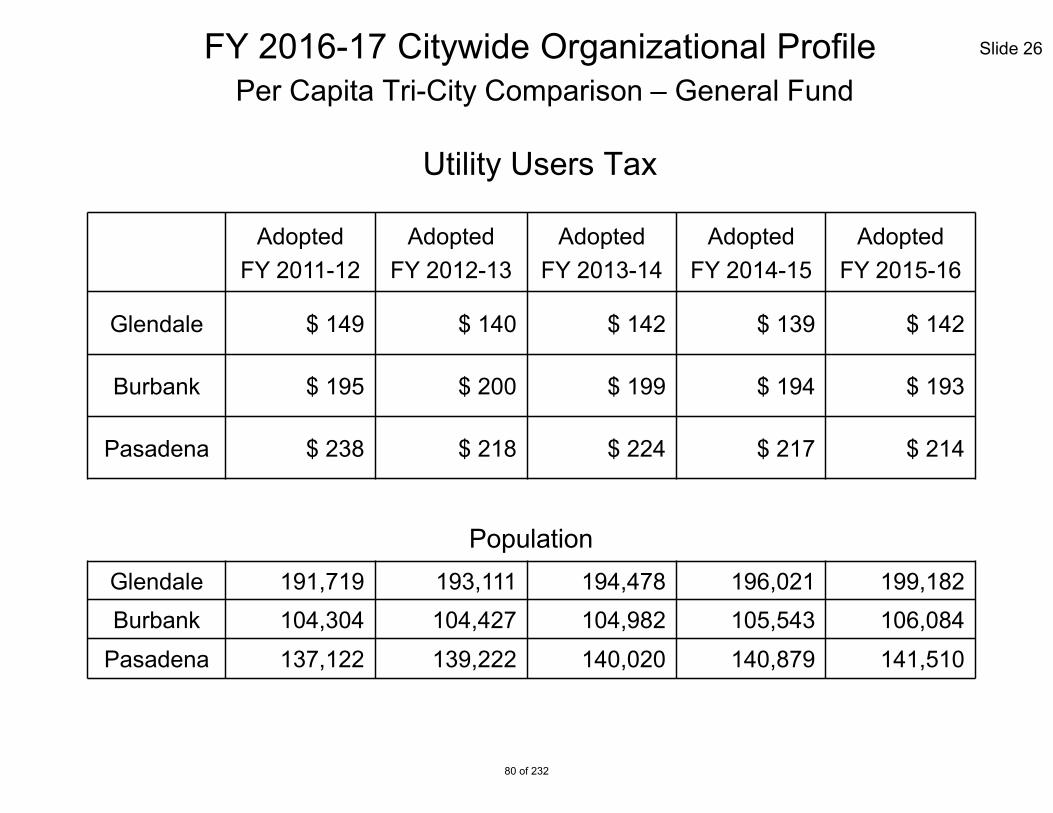
Slide 26 FY 2016-17 Citywide Organizational Profile Per Capita Tri-City Comparison – General Fund
Utility Users Tax
Adopted FY 2011-12
Adopted FY 2012-13
Adopted FY 2013-14
Adopted FY 2014-15
Adopted FY 2015-16
Glendale $ 149 $ 140 $ 142 $ 139 $ 142
Burbank $ 195 $ 200 $ 199 $ 194 $ 193
Pasadena $ 238 $ 218 $ 224 $ 217 $ 214
Glendale 191,719 193,111 194,478 196,021 199,182 Burbank 104,304 104,427 104,982 105,543 106,084
Pasadena 137,122 139,222 140,020 140,879 141,510
Population
80 of 232

Slide 27
Adopted FY 2015-16
Proposed FY 2016-17
% Change from 15-16
Public Safety $ 133,161,030 17.4% $ 140,446,928 17.7% 5.5%
Public Works & Utilities 420,507,037 54.8% 418,643,090 52.8% (0.4%)
Community Development & Transit 67,746,406 8.8% 70,116,501 8.8% 3.5%
Quality of Life 42,133,878 5.5% 56,819,505 7.2% 34.9%
Administration & Internal Service 103,258,801 13.5% 107,117,249 13.5% 3.7%
Total Operational Expenditures* $ 766,807,152 100.0% $ 793,143,273 100.0% 3.4%
*Data excludes transfers
FY 2016-17 Citywide Organizational Profile
81 of 232
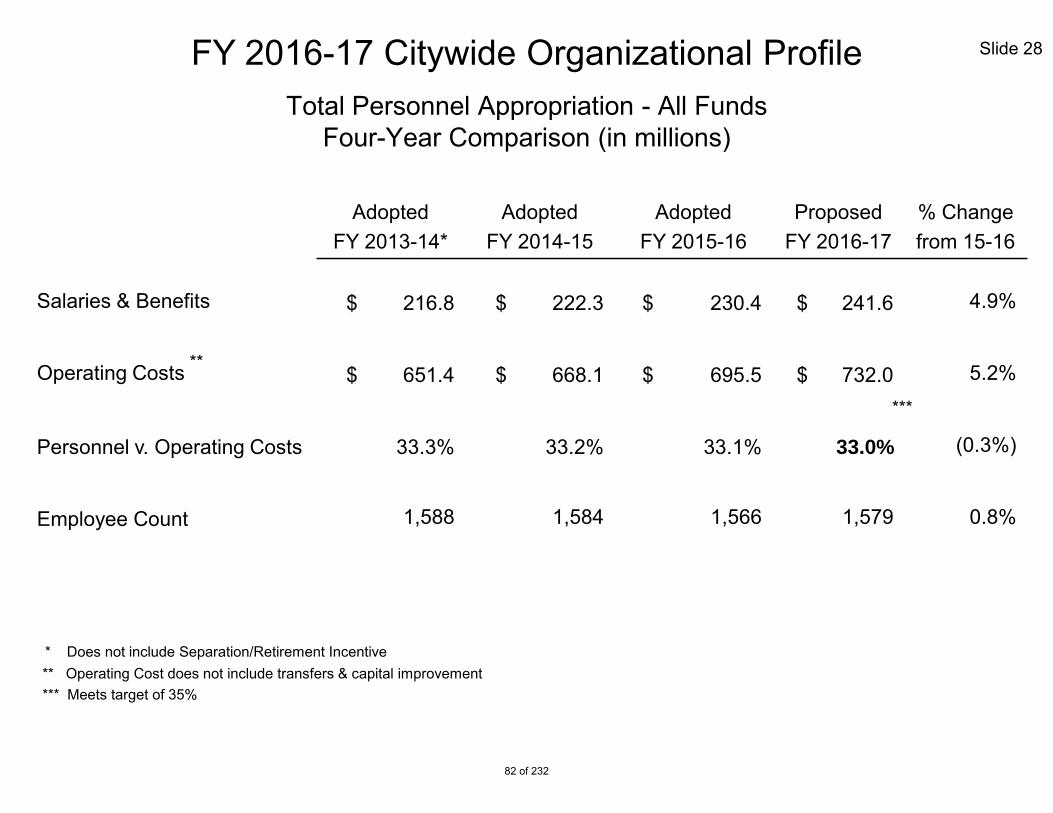
Slide 28
Total Personnel Appropriation - All Funds Four-Year Comparison (in millions)
FY 2016-17 Citywide Organizational Profile
* Does not include Separation/Retirement Incentive ** Operating Cost does not include transfers & capital improvement *** Meets target of 35%
Adopted FY 2013-14*
Adopted FY 2014-15
Adopted FY 2015-16
Proposed FY 2016-17
% Change from 15-16
Salaries & Benefits $ 216.8 $ 222.3 $ 230.4 $ 241.6 4.9%
Operating Costs $ 651.4 $ 668.1 $ 695.5 $ 732.0 5.2%
Personnel v. Operating Costs 33.3% 33.2% 33.1% 33.0% (0.3%)
Employee Count 1,588 1,584 1,566 1,579 0.8%
***
**
82 of 232

Slide 29
Total Personnel Appropriation - General Fund Four-Year Comparison (in millions)
FY 2016-17 Citywide Organizational Profile
* Includes General Fund Balancing Strategies ** Does not include Separation/Retirement Incentive *** Does not meet target of 75%
Adopted FY 2013-14
Adopted FY 2014-15**
Adopted FY 2015-16
Proposed FY 2016-17
% Change from 15-16
Salaries & Benefits $ 134.2 $ 136.9 $ 142.2 $ 147.7 3.9%
Maintenance & Operation / ISF Charges
35.8 38.9 38.6 44.1 14.2%
Capital Outlay 0.3 0.2 0.04 - (100.0%)
Cost Savings Target - - - - -
Annual Appropriations (not including transfers)
$ 170.3 $ 176.0 $ 180.8 $ 191.8 6.1%
Personnel v. M&O 78.8% 77.8% 78.7% 77.0% (2.1%)
Employee Count 905 890 882 866 (1.8%)
***
83 of 232
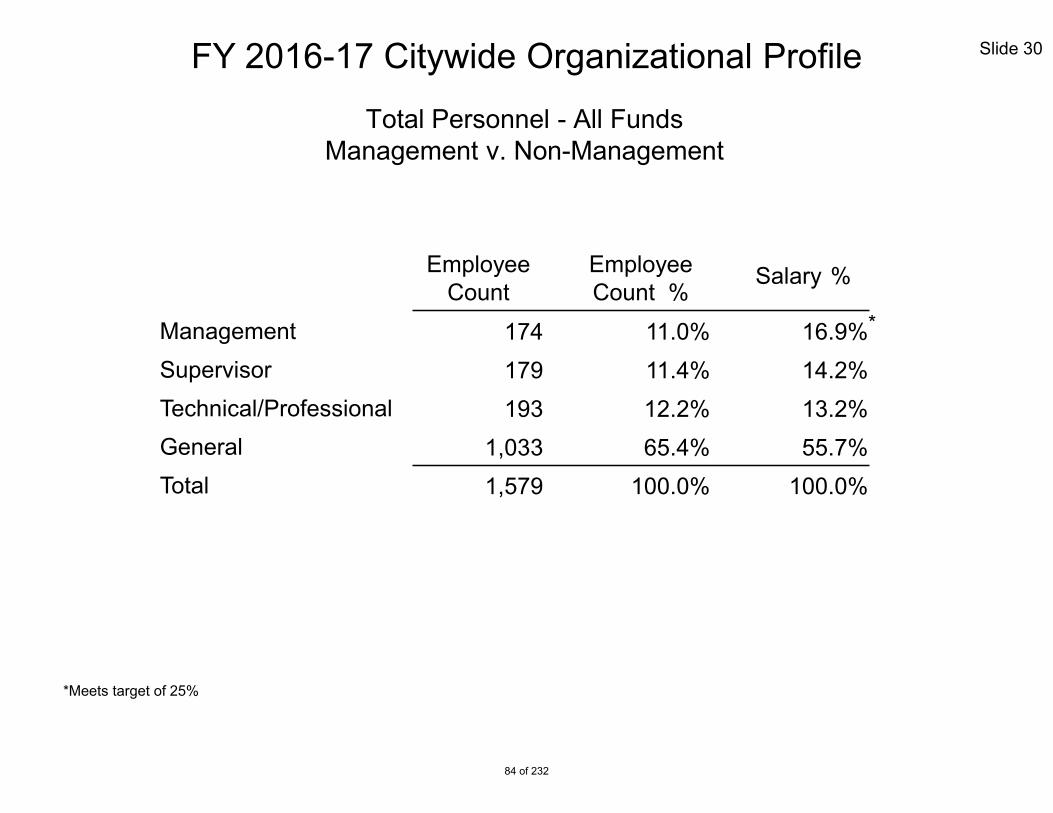
Slide 30
Total Personnel - All Funds Management v. Non-Management
Employee Count
Employee Count %
Salary %
Management 174 11.0% 16.9% Supervisor 179 11.4% 14.2% Technical/Professional 193 12.2% 13.2% General 1,033 65.4% 55.7% Total 1,579 100.0% 100.0%
*Meets target of 25%
FY 2016-17 Citywide Organizational Profile
*
84 of 232

Slide 31
Maintain Structural Balance Consistently apply the lens of long-term sustainability Closely monitor cost-drivers and adapt to changes; be nimble
Programs, Infrastructure and Service Do NOT revert to traditional patterns and work flows: Problem Solvers Restore what can be restored, build and maintain Aggressively pursue Exceptional Customer Service
Field the Best Team Invest in people Balance value propositions – public demands highest level of service;
employees working harder than ever Big Ideas, Moon Shots and Reasons for Optimism
Conclusion FY 2016-17 Budget Themes
85 of 232

Study Session #2

City of Glendale
Budget Study Session #2 May 10, 2016
86 of 232

Slide 2 FY 2016-17 Proposed Budget Agenda
Summary of Appropriations
Capital Improvement Program
Proposed Citywide Fee Schedule Changes
Budget Calendar
Questions & Comments
87 of 232

FY 2016-17 Proposed Budget Summary of Appropriations
88 of 232

Slide 4 Summary of Appropriations All Funds
Fund Type Adopted
FY 2015-16 Proposed FY
2016-17 Increase/
(Decrease) %
Change General Fund $ 182,890,934 $ 194,925,929 $ 12,034,995 6.6%
Special Revenue Funds 103,702,342 100,630,978 (3,071,364) (3.0%)
Debt Service Funds 3,025,000 3,010,000 (15,000) (0.5%)
Capital Improvement Funds 13,755,000 25,362,000 11,607,000 84.4%
Enterprise Funds 390,966,533 385,917,075 (5,049,458) (1.3%)
Internal Service Funds 103,489,784 109,832,418 6,342,634 6.1%
All Funds – Grand Total $ 797,829,593 $ 819,678,400 $ 21,848,807 2.7%
89 of 232

Slide 5
Authorized Full-Time Positions
*Includes General Fund & GWP Balancing Strategies
Fiscal Year
Authorized Positions
2005-06 1,995
2006-07 1,974
2007-08 1,986
2008-09 1,942
2009-10 1,904
2010-11 1,899
2011-12 1,873
2012-13 1,605*
2013-14 1,588
2014-15 1,520
2015-16 1,575
2016-17 Proposed 1,579
90 of 232
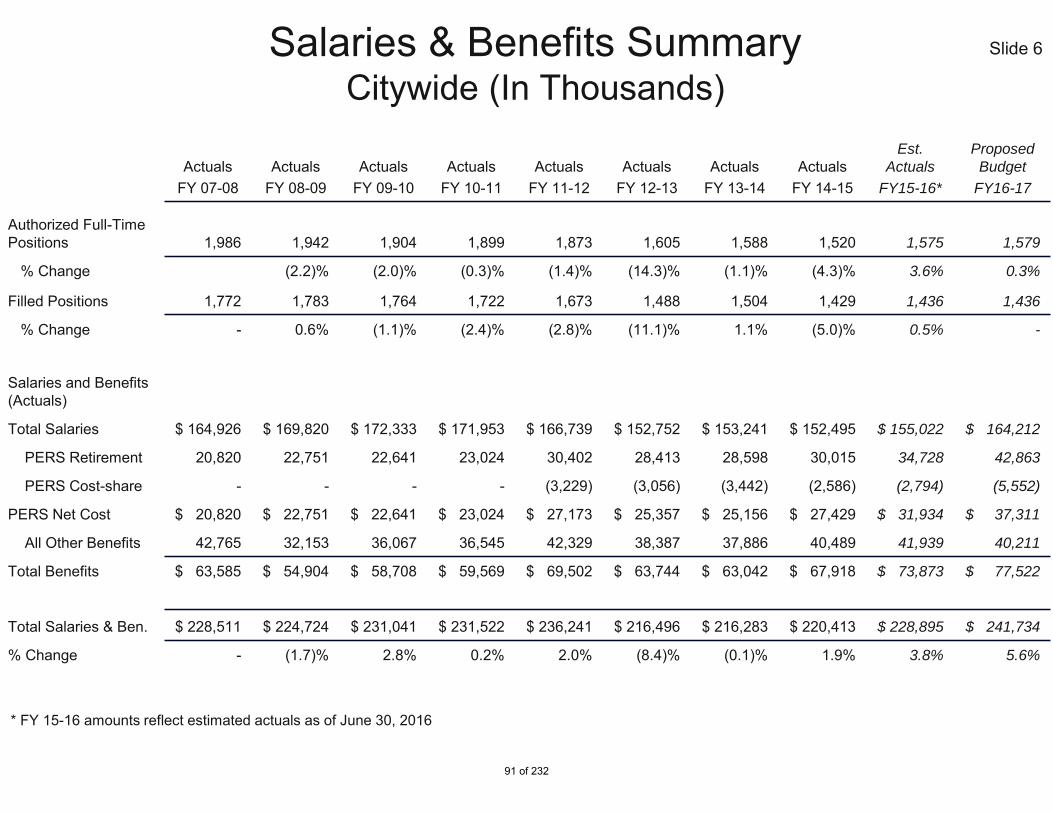
Salaries & Benefits Summary
Citywide (In Thousands)
Actuals FY 07-08
Actuals FY 08-09
Actuals FY 09-10
Actuals FY 10-11
Actuals FY 11-12
Actuals FY 12-13
Actuals FY 13-14
Actuals FY 14-15
Est.
Actuals
FY15-16*
Proposed
Budget
FY16-17
Authorized Full-Time Positions 1,986 1,942 1,904 1,899 1,873 1,605 1,588 1,520 1,575 1,579
% Change (2.2)% (2.0)% (0.3)% (1.4)% (14.3)% (1.1)% (4.3)% 3.6% 0.3%
Filled Positions 1,772 1,783 1,764 1,722 1,673 1,488 1,504 1,429 1,436 1,436
% Change - 0.6% (1.1)% (2.4)% (2.8)% (11.1)% 1.1% (5.0)% 0.5% -
Salaries and Benefits (Actuals)
Total Salaries $ 164,926 $ 169,820 $ 172,333 $ 171,953 $ 166,739 $ 152,752 $ 153,241 $ 152,495 $ 155,022 $ 164,212
PERS Retirement 20,820 22,751 22,641 23,024 30,402 28,413 28,598 30,015 34,728 42,863
PERS Cost-share - - - - (3,229) (3,056) (3,442) (2,586) (2,794) (5,552)
PERS Net Cost $ 20,820 $ 22,751 $ 22,641 $ 23,024 $ 27,173 $ 25,357 $ 25,156 $ 27,429 $ 31,934 $ 37,311
All Other Benefits 42,765 32,153 36,067 36,545 42,329 38,387 37,886 40,489 41,939 40,211
Total Benefits $ 63,585 $ 54,904 $ 58,708 $ 59,569 $ 69,502 $ 63,744 $ 63,042 $ 67,918 $ 73,873 $ 77,522
Total Salaries & Ben. $ 228,511 $ 224,724 $ 231,041 $ 231,522 $ 236,241 $ 216,496 $ 216,283 $ 220,413 $ 228,895 $ 241,734
% Change - (1.7)% 2.8% 0.2% 2.0% (8.4)% (0.1)% 1.9% 3.8% 5.6%
* FY 15-16 amounts reflect estimated actuals as of June 30, 2016
Slide 6
91 of 232

Slide 7 Summary of Appropriations General Fund (1 of 2)
Department Adopted
FY 2015-16 Proposed
FY 2016-17 Increase / (Decrease)
% Change
Administrative Services $ 5,501,035 $ 5,341,567 $ (159,468) (2.9%)
City Attorney 3,190,013 3,548,439 358,426 11.2%
City Clerk 1,054,463 1,349,630 295,167 28.0%
City Treasurer 665,123 742,164 77,041 11.6%
Community Development 9,845,834 14,943,660 5,097,826 51.8%
Community Services & Parks 10,499,841 12,631,020 2,131,179 20.3%
Fire 45,027,061 48,847,789 3,820,728 8.5%
Human Resources 2,660,726 2,654,861 (5,865) (0.2%)
Library, Arts & Culture 8,488,883 9,594,695 1,105,812 13.0%
92 of 232

Slide 8 Summary of Appropriations General Fund (2 of 2)
Department Adopted
FY 2015-16 Proposed
FY 2016-17 Increase / (Decrease)
% Change
Management Services $ 3,869,062 $ 4,392,282 $ 523,220 13.5%
Police 70,301,071 72,730,666 2,429,595 3.5%
Public Works 17,964,870 14,184,318 (3,780,552) (21.0%)
Transfers 2,125,441 3,067,327 941,886 44.3%
Retirement Incentive 897,511 897,511 - -
Non-Departmental 800,000 - (800,000) (100.0%)
General Fund Total $ 182,890,934 $ 194,925,929 $ 12,034,995 6.6%
93 of 232
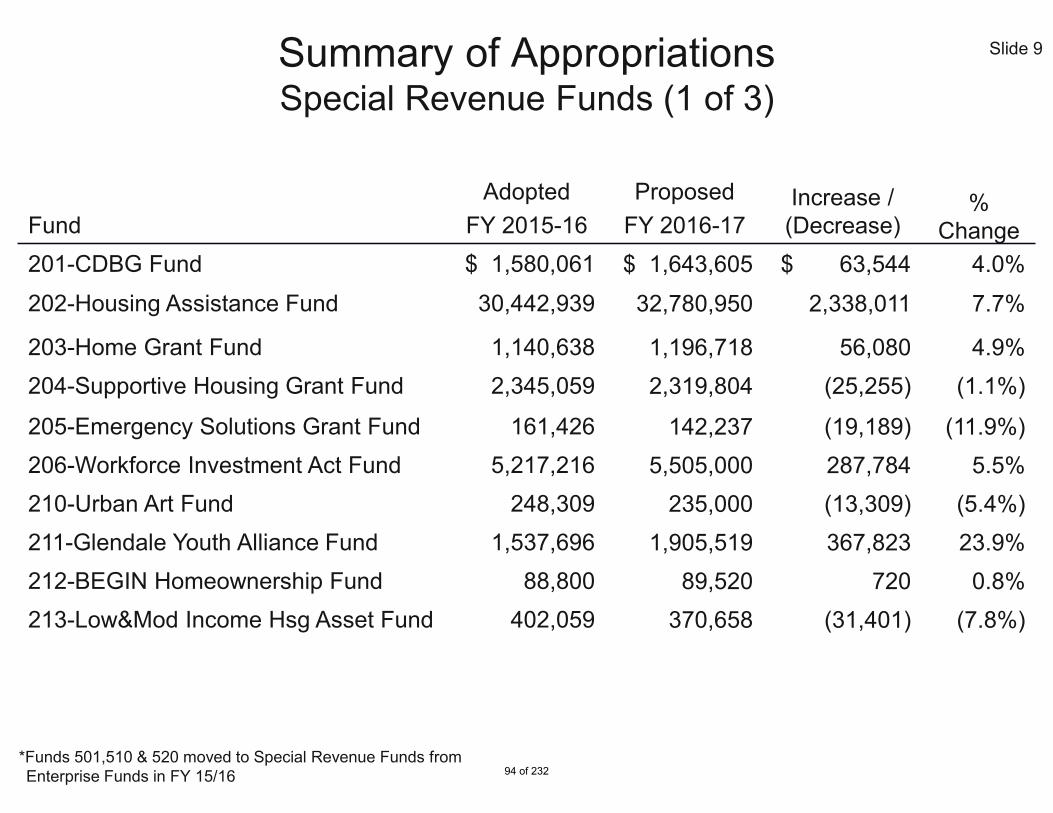
Slide 9 Summary of Appropriations Special Revenue Funds (1 of 3)
Fund Adopted
FY 2015-16 Proposed
FY 2016-17 Increase / (Decrease)
% Change
201-CDBG Fund $ 1,580,061 $ 1,643,605 $ 63,544 4.0%
202-Housing Assistance Fund 30,442,939 32,780,950 2,338,011 7.7%
203-Home Grant Fund 1,140,638 1,196,718 56,080 4.9% 204-Supportive Housing Grant Fund 2,345,059 2,319,804 (25,255) (1.1%)
205-Emergency Solutions Grant Fund 161,426 142,237 (19,189) (11.9%) 206-Workforce Investment Act Fund 5,217,216 5,505,000 287,784 5.5% 210-Urban Art Fund 248,309 235,000 (13,309) (5.4%) 211-Glendale Youth Alliance Fund 1,537,696 1,905,519 367,823 23.9% 212-BEGIN Homeownership Fund 88,800 89,520 720 0.8% 213-Low&Mod Income Hsg Asset Fund 402,059 370,658 (31,401) (7.8%)
*Funds 501,510 & 520 moved to Special Revenue Funds from Enterprise Funds in FY 15/16 94 of 232

Slide 10 Summary of Appropriations Special Revenue Funds (2 of 3)
Fund Adopted
FY 2015-16 Proposed
FY 2016-17 Increase / (Decrease)
% Change
215-Economic Development Fund $ 2,470,705 $ - $(2,470,705) (100%) 216-Miscellaneous Grant Fund 5,540,000 198,000 (5,342,000) (96.4%)
217-Filming Fund 500,852 526,212 25,360 5.1% 251-Air Quality Improvement Fund 307,207 330,089 22,882 7.4%
252-PW Special Grants Fund 23,862 - (23,862) (100%) 253-San Fernando Landscape Fund 81,124 89,986 8,862 10.9% 254-Measure R Local Return Fund 1,915,000 2,409,800 494,800 25.8%
256-Transit Prop A Local Return Fund 3,940,780 7,197,820 3,257,040 82.6% 257-Transit Prop C Local Return Fund 4,224,488 3,950,256 (274,232) (6.5%) 258-Transit Utility Fund 9,528,661 9,604,404 75,743 0.8% 260-Asset Forfeiture Fund 570,092 568,473 (1,619) (0.3%)
*Funds 501,510 & 520 moved to Special Revenue Funds from Enterprise Funds in FY 15/16 95 of 232
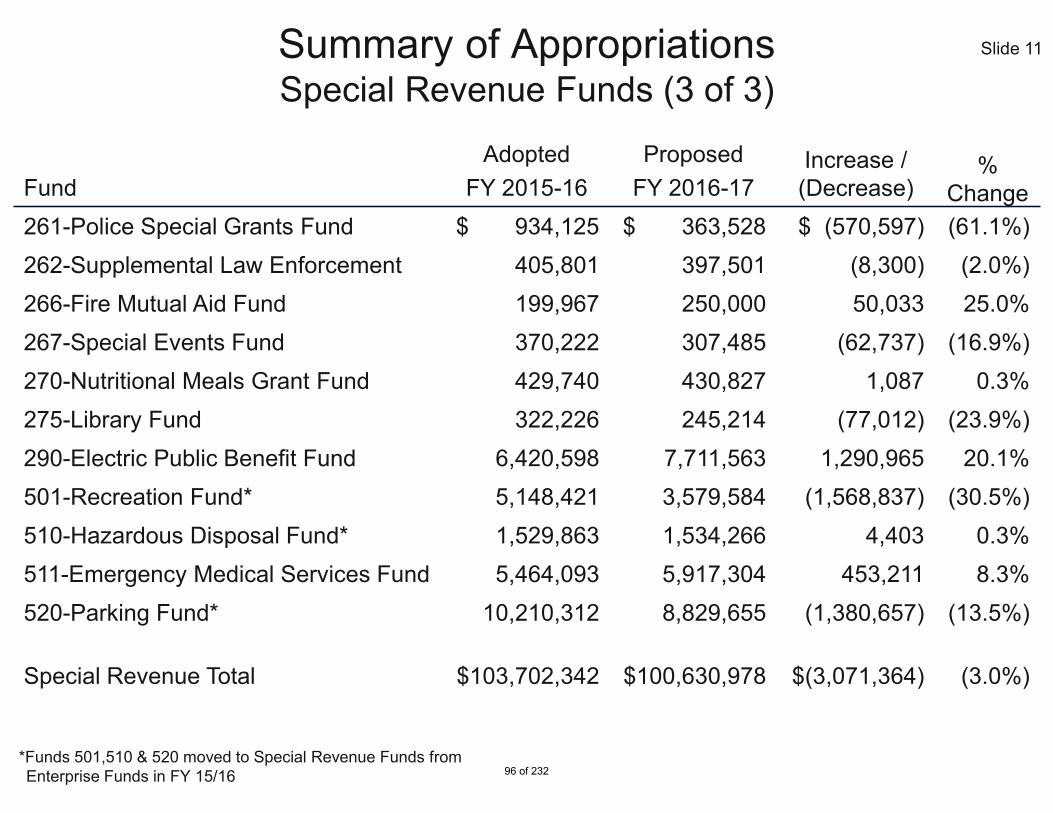
Slide 11 Summary of Appropriations Special Revenue Funds (3 of 3)
Fund Adopted
FY 2015-16 Proposed
FY 2016-17 Increase / (Decrease)
% Change
261-Police Special Grants Fund $ 934,125 $ 363,528 $ (570,597) (61.1%) 262-Supplemental Law Enforcement 405,801 397,501 (8,300) (2.0%) 266-Fire Mutual Aid Fund 199,967 250,000 50,033 25.0% 267-Special Events Fund 370,222 307,485 (62,737) (16.9%) 270-Nutritional Meals Grant Fund 429,740 430,827 1,087 0.3% 275-Library Fund 322,226 245,214 (77,012) (23.9%) 290-Electric Public Benefit Fund 6,420,598 7,711,563 1,290,965 20.1% 501-Recreation Fund* 5,148,421 3,579,584 (1,568,837) (30.5%) 510-Hazardous Disposal Fund* 1,529,863 1,534,266 4,403 0.3% 511-Emergency Medical Services Fund 5,464,093 5,917,304 453,211 8.3% 520-Parking Fund* 10,210,312 8,829,655 (1,380,657) (13.5%)
Special Revenue Total $103,702,342 $100,630,978 $(3,071,364) (3.0%)
*Funds 501,510 & 520 moved to Special Revenue Funds from Enterprise Funds in FY 15/16 96 of 232

Slide 12 Summary of Appropriations Debt Service Funds
Fund Adopted
FY 2015-16 Proposed
FY 2016-17 Increase / (Decrease)
% Change
303-Police Building Project Fund $ 3,025,000 $ 3,010,000 $ (15,000) (0.5%)
Debt Service Total $ 3,025,000 $ 3,010,000 $ (15,000) (0.5%)
97 of 232

Slide 13 Summary of Appropriations Capital Improvement Funds
Fund Adopted
FY 2015-16 Proposed
FY 2016-17 Increase / (Decrease)
% Change
Fund 401 Capital Improvement (GF) Community Services & Parks $ 1,575,000 $ 1,400,000 $ (175,000) (11.1%) Fire 35,000 551,000 516,000 1,474.3% Library, Arts & Culture 950,000 350,000 (600,000) (63.2%)
Public Works 815,000 2,479,000 1,664,000 204.2% Transfers (Scholl Canyon) 2,000,000 2,000,000 - - Total Fund 401 Capital Improvement $ 5,375,000 $ 6,780,000 $ 1,405,000 26.1% 402-State Gas Tax Fund 4,380,000 1,854,000 (2,526,000) (57.7%) 405-Parks Mitigation Fee Fund 4,000,000 16,173,000 12,173,000 304.3% 407-Library Mitigation Fee Fund - 555,000 555,000 100%
Total Capital Improvement Funds $ 13,755,000 $ 25,362,000 $ 11,607,000 84.4%
98 of 232

Slide 14 Summary of Appropriations Enterprise Funds
Fund Adopted
FY 2015-16 Proposed
FY 2016-17 Increase / (Decrease)
% Change
525-Sewer Fund $ 34,059,747 $ 30,480,999 $ (3,578,748) (10.5%) 530-Refuse Disposal Fund 25,706,964 24,657,570 (1,049,394) (4.1%)
552-Electric Works Revenue Fund 233,543,262 251,103,371 17,560,109 7.5% 553-Electric Depreciation Fund 28,565,238 15,768,182 (12,797,056) (44.8%) 555-Electric Customer Paid Fund 2,854,422 1,894,751 (959,671) (33.6%) 572-Water Works Revenue Fund 49,350,121 51,977,680 2,627,559 5.3% 573-Water Depreciation Fund 11,452,736 4,222,618 (7,230,118) (63.1%) 575-Water Customer Paid Fund 1,610,567 1,469,640 (140,927) (8.8%) 701-Fire Communication Fund 3,823,476 4,342,264 518,788 13.6%
Enterprise Total $ 390,966,533 $ 385,917,075 $ (5,049,458) (1.3%)
99 of 232

Slide 15 Summary of Appropriations Internal Service Funds (1 of 2)
Fund Adopted
FY 2015-16 Proposed
FY 2016-17 Increase / (Decrease)
% Change
601-Fleet / Equipment Mgmt Fund $ 14,725,214 $ 16,023,658 $ 1,298,444 8.8%
602-Joint Helicopter Operation Fund 1,475,259 1,626,652 151,393 10.3%
603-ISD Infrastructure Fund 8,236,590 7,773,035 (463,555) (5.6%)
604-ISD Applications Fund 12,558,297 6,498,261 (6,060,036) (48.3%)
607-Building Maintenance Fund - 7,472,899 7,472,899 100%
610-Unemployment Insurance Fund 314,790 78,243 (236,547) (75.1%)
612-Liability Insurance Fund 7,961,959 8,632,422 670,463 8.4%
614-Compensation Insurance Fund 12,220,632 12,928,223 707,591 5.8%
615-Dental Insurance Fund 1,571,908 1,655,291 83,383 5.3%
100 of 232

Slide 16 Summary of Appropriations Internal Service Funds (2 of 2)
Fund Adopted
FY 2015-16 Proposed
FY 2016-17 Increase / (Decrease)
% Change
616-Medical Insurance Fund $ 27,364,869 $ 35,101,482 $ 7,736,613 28.3%
617-Vision Insurance Fund 276,736 294,568 17,832 6.4%
640-Employee Benefits Fund 3,390,800 4,317,791 926,991 27.3%
641-RHSP Benefits Fund 1,723,039 2,017,690 294,651 17.1%
642-Post Employment Benefits Fund 7,850,310 2,220,175 (5,630,135) (71.7%) 660-ISD Wireless Fund 3,819,381 3,192,028 (627,353) (16.4%)
Internal Service Total $ 103,489,784 $ 109,832,418 $ 6,342,634 6.1%
101 of 232

Capital Improvement Program
(CIP)
102 of 232

Slide 18
CIP General Fund (401) • Sales Tax Funding
• FY 2016-17 Proposed Budget & Budget Summary
• Project Summary
CIP Other Funds • Community Services & Parks, Library, Arts & Culture,
Community Development, Public Works, Information Services Department, and Glendale Water & Power
CIP Recap
Capital Improvement Program
103 of 232

Capital Improvement Program
General Fund Fund 401
104 of 232

Slide 20 CIP General Fund (Fund 401) Sales Tax Funding
(In Millions)
Fiscal Year CIP Fund
401 % of Sales
Tax FY 2007-08 3.3 14.00%
FY 2008-09 3.0 14.00%
FY 2009-10 0.9 4.00%
FY 2010-11 - -
FY 2011-12 - -
FY 2012-13 0.3 1.00%
FY 2013-14 0.3 1.00%
FY 2014-15 0.3 1.00%
FY 2015-16 0.5 1.25%
Fiscal Year CIP Fund
401 % of Sales
Tax FY 2016-17 Est 0.6 1.50%
FY 2017-18 Est 0.7 1.75%
FY 2018-19 Est 0.9 2.00%
FY 2019-20 Est 0.9 2.00%
FY 2020-21 Est 0.9 2.00%
FY 2021-22 Est 1.0 2.00%
FY 2022-23 Est 1.2 2.50%
105 of 232

Slide 21 CIP General Fund (Fund 401) FY 2016-17 Proposed Budget
(In Thousands)
Proposed FY 2016-17
Projected Resources
Scholl Canyon Tipping Fee $ 3,995
Transfer in – GF (Sales Tax) 582
Transfer in – GF (Street Improvement Projects) 1,000
Total Resources $ 5,577
Projected Appropriation
Proposed FY 2016-17 Budget $ (4,780)
Transfer to Fund 403 (Landfill) (2,000)
Total Appropriation $ (6,780)
Reprogrammed Appropriation $ 2,703
Net Surplus / (Use of Fund Balance) $ 1,500
106 of 232

Slide 22 CIP General Fund (Fund 401) FY 2016-17 Budget Summary
(In Thousands)
Projected Resources $ 5,577
Less FY 2016-17 New Appropriation (6,780) Reprogrammed Appropriation 2,703 FY 2016-17 Net Surplus / (Use of Fund Balance) $ 1,500
Beginning Fund Balance (Est) @ 7/1/2016 (2,358)
Ending Fund Balance (Est) @ 6/30/2017 $ (858)
Reserved for PEG Capital (24)
Available Ending Fund Balance (Est) @ 6/30/2017 $ (882)
107 of 232

Slide 23 CIP General Fund (Fund 401) Project Summary (1 of 2)
(In Thousands)
Life To Date Project Budget
Remaining Budget 3/31/16
Proposed FY 2016-17
Fire
Fire Station 26 Reconstruction $ 63 $ 22 $ 175
Training Center Burn Bldg Reconstruction 80 19 376
Subtotal $ 143 $ 41 $ 551
Public Works
Signal Power Backup System $ 519 $ 445 $ 179
ADA Facility Modification 785 150 125
Project Management Staff 154 10 100
Police Building Access Control - - 175
Illuminated Street Sign Replacement - - 600
Street Improvements - - 1,300
Subtotal $ 1,458 $ 605 $ 2,479
108 of 232

Slide 24 CIP General Fund (Fund 401) Project Summary (2 of 2)
(In Thousands)
Life To Date Project Budget
Remaining Budget 3/31/16
Proposed FY 2016-17
Community Services & Parks
Rockhaven Rehabilitation $ 956 $ 51 $ 50
Parks Unanticipated Repairs 850 65 150
Glorietta Park Lighting & Irrigation 200 - 450
Deukmejian Nature Ed. Center - - 500
Citywide Playground Equipment - - 250
Subtotal $ 2,006 $ 116 $ 1,400
Library, Arts & Culture
Central Library Renovation 7,527 1,023 250
Branch Libraries 674 314 100
Subtotal $ 8,201 $ 1,337 $ 350
Non-Departmental
Transfer to Fund 403-Landfill Post Closure Fund $ - $ - $ 2,000
CIP General Fund - Total $ 11,808 $ 2,099 $ 6,780
109 of 232

Capital Improvement Program
Other Funds
110 of 232

Slide 26 Community Services & Parks Project Summary
(In Thousands)
Life To Date Project Budget
Remaining Budget 3/31/16
Proposed FY 2016-17
Parks Mitigation Fee Fund 405
Fremont Park Renovation Design $ 2,150 $ 2,113 $ 2,000
Central Park Plaza 150 150 2,000
Verdugo Park-North Community Building 500 500 1,500
Planning and Design Studies 300 105 100
Carr Park Outdoor Fitness Center - - 65
Soccer Field at Columbus Elementary - - 3,450
Soccer Field at Wilson - - 5,050
Verdugo Park All Inclusive Playground - - 825
Maple Park All Inclusive Playground - - 825
Maple Park Shade Structure - - 174
Maryland Avenue Park Shade Structure - - 151
Pacific Park Lighting Improvements - - 33
Total Community Services & Parks $ 3,100 $ 2,868 $ 16,173
111 of 232

Slide 27 Library, Arts & Culture Project Summary
(In Thousands)
Life To Date Project Budget
Remaining Budget 3/31/16
Proposed FY 2016-17
Library Mitigation Fee Fund 407
Central Library Renovation $ 826 $ 815 $ 555
Total Library, Arts & Culture $ 826 $ 815 $ 555
112 of 232
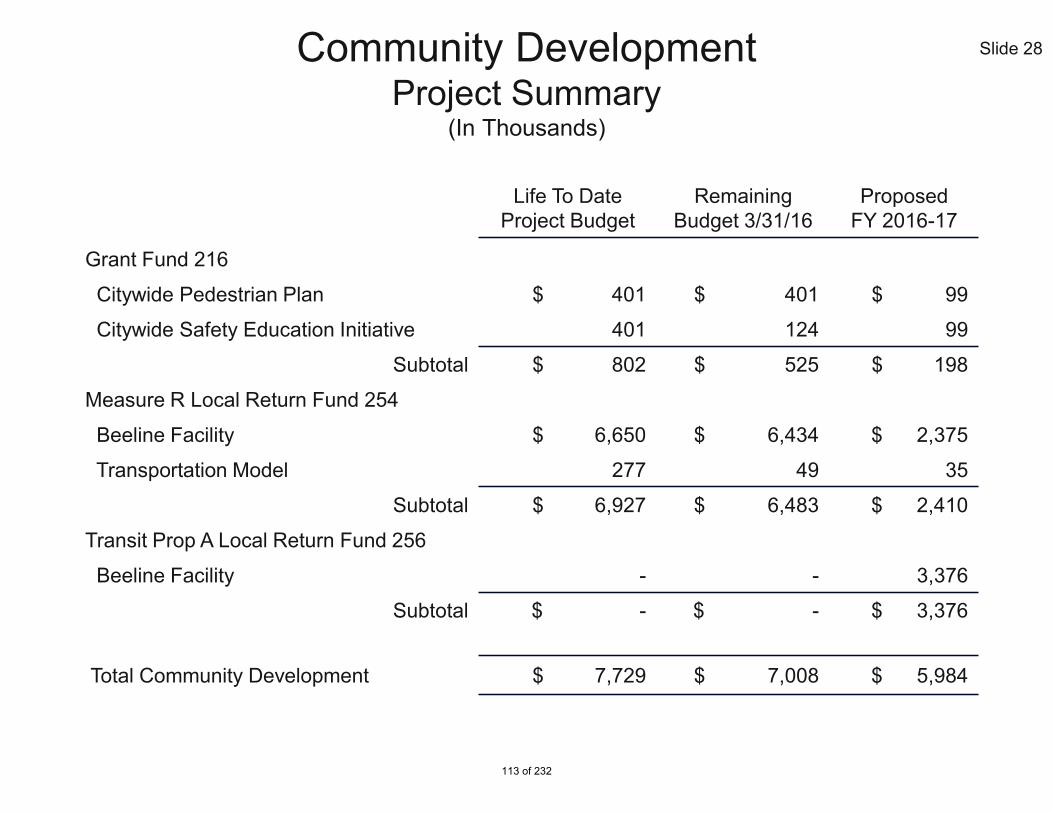
Slide 28 Community Development Project Summary
(In Thousands)
Life To Date Project Budget
Remaining Budget 3/31/16
Proposed FY 2016-17
Grant Fund 216
Citywide Pedestrian Plan $ 401 $ 401 $ 99
Citywide Safety Education Initiative 401 124 99
Subtotal $ 802 $ 525 $ 198
Measure R Local Return Fund 254
Beeline Facility $ 6,650 $ 6,434 $ 2,375
Transportation Model 277 49 35
Subtotal $ 6,927 $ 6,483 $ 2,410
Transit Prop A Local Return Fund 256
Beeline Facility - - 3,376
Subtotal $ - $ - $ 3,376
Total Community Development $ 7,729 $ 7,008 $ 5,984
113 of 232
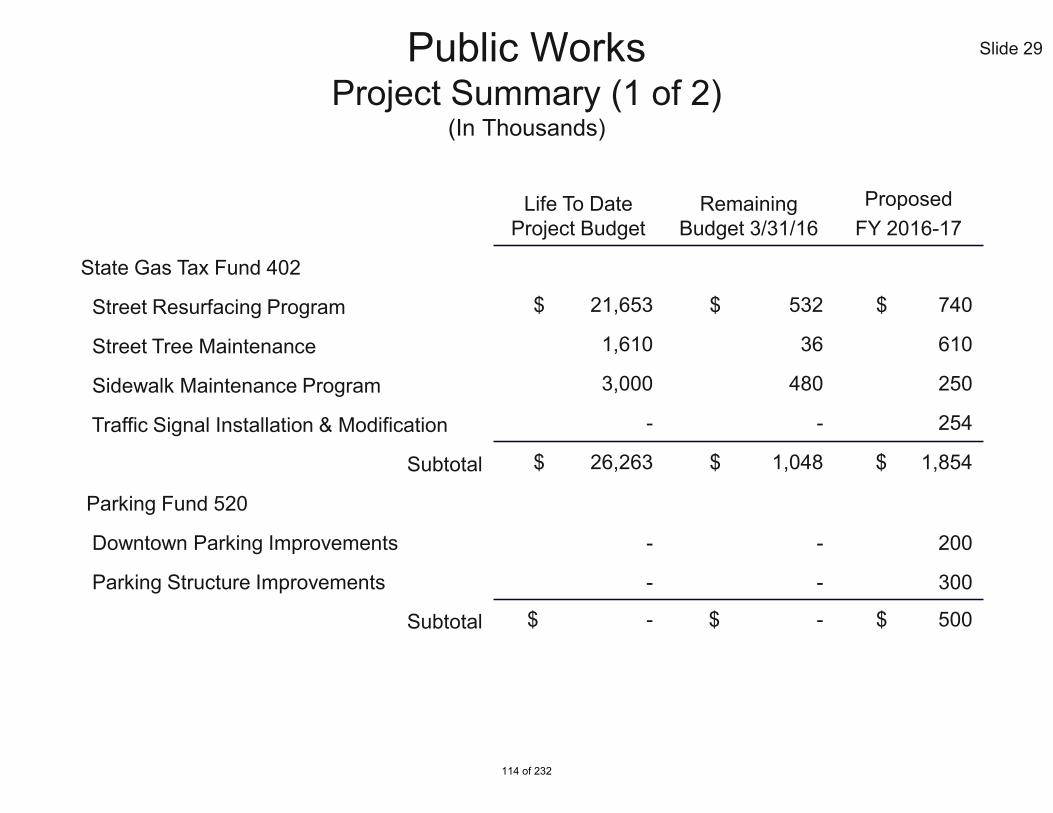
Slide 29 Public Works Project Summary (1 of 2)
(In Thousands)
Life To Date Project Budget
Remaining Budget 3/31/16
Proposed FY 2016-17
State Gas Tax Fund 402
Street Resurfacing Program $ 21,653 $ 532 $ 740
Street Tree Maintenance 1,610 36 610
Sidewalk Maintenance Program 3,000 480 250
Traffic Signal Installation & Modification - - 254
Subtotal $ 26,263 $ 1,048 $ 1,854
Parking Fund 520
Downtown Parking Improvements - - 200
Parking Structure Improvements - - 300
Subtotal $ - $ - $ 500
114 of 232

Slide 30 Public Works Project Summary (2 of 2)
(In Thousands)
Life To Date Project Budget
Remaining Budget 3/31/16
Proposed FY 2016-17
Sewer Fund 525
CMP Replacement $ 762 $ 367 $ 100
Sewer Reconstruction Program 6,615 685 300
Wastewater Capacity Improvement 5,517 1,660 400
Hyperion Wastewater System 19,753 5,571 4,000
LA-Glendale Water Reclaim. Plant 32,000 16,215 5,500
Wastewater Shop Tennant Improvements - - 50
Subtotal $ 64,647 $ 24,498 $ 10,350
Refuse Disposal Fund 530
Automated Container & Refuse Bin Repl. $ - $ - $ 350
Annual CalRecycle Grant - - 52
Subtotal $ - $ - $ 402
Total Public Works $ 90,910 $ 25,546 $ 13,106
115 of 232

Glendale Water & Power Project Summary – Electric (1 of 3)
(In Thousands)
Life To Date Project Budget
Remaining Budget 3/31/16
Proposed FY 2016-17
Electric Depreciation Fund 553
Power Management:
Unit 9 Modifications $ - $ - $ 1,486
Emergency Repairs 1,195 1,195 750
General Plant Capital Outlay 629 475 463
Distribution:
General Plant Allocation 2,233 670 1,459
AMI Modernization IT Support * 561 255 22
Grandview Getaways 2,265 631 117
Grandview Substation 16,242 2,540 43
General Plant Capital Outlay 455 278 533
Streetlight Electric Services 109 84 116
Feeder Conversion at Bel Aire 345 186 162
Slide 31
* Reflects estimated project budget reductions at the end of FY 15-16 to fund proposed FY 16-17 projects
116 of 232

Glendale Water & Power Project Summary – Electric (2 of 3)
(In Thousands)
Life To Date Project Budget
Remaining Budget 3/31/16
Proposed FY 2016-17
Electric Depreciation Fund 553 (Continued)
Distribution (continued):
Meter Purchases 150 81 150
Transformer Purchases 200 123 150
Deteriorated Pole Replacements 505 - 555
Elec Vault Replacements 234 101 450
Cable Replacements 568 61 676
Emergency System Improvement * - - 523
Glen/Grandview South Reconstruction - - 343
Fiber Plan Implementation - - 1,710
Capacity Bank Conversion - - 1,387
ICCP & SCADA Monitoring - - 294
Slide 32
* Reflects estimated project budget reductions at the end of FY 15-16 to fund proposed FY 16-17 projects
117 of 232

Glendale Water & Power Project Summary – Electric (3 of 3)
(In Thousands)
Life To Date Project Budget
Remaining Budget 3/31/16
Proposed FY 2016-17
Electric Depreciation Fund 553 (Continued)
Distribution (continued):
ICON (SCADA Communication) $ - $ - $ 297
Feeder Conversion at Tropico Substation - - 1,946
Subtotal $ 25,691 $ 6,680 $ 13,632
Electric Customer Paid Capital Fund 555 $ 6,220 $ 6,179 $ 1,895
Electric Utility Totals $ 31,911 $ 12,859 $ 15,527
Slide 33
118 of 232

Glendale Water & Power Project Summary - Water (1 of 2)
(In Thousands)
Life To Date Project Budget
Remaining Budget 3/31/16
Proposed FY 2016-17
Water Depreciation Fund 573
General Plant Allocation $ 1,072 $ 335 $ 786
Slope Repair Verdugo 112 110 249
Valve Replacement * 868 173 200
Valve Installation * 450 150 100
General Plant Capital Outlay 70 42 140
Recycled Services/Meters 27 27 26
Potable Service & Meters 54 33 52
Potable Hydrants 16 - 150
Slope Repairs at Various 205 203 499
Cap Recycled Hydrants 27 27 26
Rez Roof Replacement - - 75
Pump Replacement Program - - 50
Slide 34
* Reflects estimated project budget reductions at the end of FY 15-16 to fund proposed FY 16-17 projects
119 of 232

Glendale Water & Power Project Summary - Water (2 of 2)
(In Thousands)
Life To Date Project Budget
Remaining Budget 3/31/16
Proposed FY 2016-17
Water Depreciation Fund 573 (Continued)
Sample Station Installation $ - $ - $ 147
Sodium Hypochlorite Feed Station - - 460
Potable Water Tank Rehab Program - - 199
Surge Tank Rehab Program - - 354
Pipeline Management Program - - 100
Subtotal $ 2,901 $ 1,100 $ 3,613
Water Customer Paid Capital Fund 575 $ 3,551 $ 2,489 $ 1,470
Water Utility Totals $ 6,452 $ 3,589 $ 5,083
Glendale Water & Power Total $ 38,363 $ 16,448 $ 20,610
Slide 35
120 of 232

Slide 36 Information Services Dept. (ISD) Project Summary
(In Thousands)
Life To Date Project Budget
Remaining Budget 3/31/16
Proposed FY 2016-17
ISD Infrastructure Fund 603
Veeam Availability Suite Enterprise $ - $ - $ 59
Palo Alto PA-3060 Firewall - - 53
NEC PBX, Licenses and Phones - - 105
ExeGrid Deduplication Backup - - 221
Copper and Fiber Optic Cabling - - 13
Total ISD $ - $ - $ 451
121 of 232

Slide 37 Capital Improvement Program Recap (In Thousands)
Proposed FY 2016-17
General Fund (401)
Management Services $ -
Fire 551
Public Works 2,479
Community Services & Parks 1,400
Library, Arts & Culture 350
Transfer to Fund 403 (Landfill) 2,000
General Fund Subtotal $ 6,780
Other Funds
Community Services & Parks $ 16,173
Library, Arts & Culture 555
Community Development 5,984
Public Works 13,106
Glendale Water & Power 20,610
Information Services Department 451
Other Funds Subtotal $ 56,879
Grand Total $ 63,659
122 of 232

FY 2016-17 Citywide Fee Schedule Changes
123 of 232

Slide 39 Citywide User Fees, Fines, Rates & Charges Agenda
Fee Setting Guidance
Fee Study Overview
Proposed Fee Changes
Questions & Comments
124 of 232

Slide 40
Proposition 218 Section 6(b)(2)
• “Revenues derived from the fee or charge shall not be used for any
purpose other than that for which the fee or charge was imposed” • Must Pair Revenues to Costs
CA Government Code §66014(a)
• “Those fees may not exceed the estimated reasonable cost of providing the
service for which the fee is charged”
Proposition 26
• Passed in 2010, provided new definition of the term “Tax”, which means, all Fees are Taxes with seven exceptions.
Purpose of the study is to be in compliance with above mentioned propositions
Citywide User Fees, Fines, Rates & Charges Fee Setting Guidance
125 of 232

Slide 41
User Fees: • A fee or rate charged to an individual or group that receives a Private
Benefit from services provided by the City
Not a Tax:
• The service is usually a discretionary activity requested by the payer • If a User Fee does not cover the City’s full cost for the services, taxes
(General Fund) pay for the remainder
Citywide User Fees, Fines, Rates & Charges Fee Study Overview
126 of 232

Slide 42
Examples:
(1) Building Permits; Some Rec. Programs
(2) Youth Programs
(3) Historic Preservation
(4) Police Patrol
Citywide User Fees, Fines, Rates & Charges Fee Study Overview
Fee vs. Tax
User Fees
User Fees
User Fees
Taxes (GF)
Taxes (GF)
Taxes (GF)
0%
100%
100%PrivateBenefit
(1)
SomePublicBenefit
(2)
SomePrivateBenefit
(3)
100%PublicBenefit
(4)
Source of Service Funding
127 of 232

Slide 43
Cost of Service Analysis
Full Cost of Service Recoverable in Fees
x Estimated Time to Provide Individual
Service
Fully-Burdened
Hourly Rates for All Personnel
Directly Involved in Service
Other Materials or Supplies
Outcome
Maximum Fee Amount
Citywide User Fees, Fines, Rates & Charges Cost Study Approach & Methodology
+
128 of 232

Slide 44
Total Number of Fees for City Services – 2,421
No Changes – 1,674
Fee Deletion – 77
Decreases to Existing Fees – 72
Increase to Existing Fees – 243
CPI Increases to Existing Fees – 302
New Fees – 53
Citywide User Fees, Fines, Rates & Charges Proposed Fee Changes
129 of 232

Slide 45 Citywide User Fees, Rates and Charges Fee Deletions
Fee#
Page # Fee Title Dept/Div
FY 2015-16 Fee
- - Technology Surcharge Citywide 18.38%
4 31 Maintenance Fee Library $37.00
5 31 Reception Fee (When food is served at event and/or for use of kitchen)
Library $50.00
10 43 Records Fees; Permit Search Building Hourly Rate
6 64 Cassette Reproduction Planning $28.00
130 of 232

Slide 46 Citywide User Fees, Rates and Charges Increases to Existing Fees – PW/Engineering (1 of 3)
Review Fee
# Page
# Fee Title Full Cost Current
Fee Proposed
Fee Cost Study
41 8 Construction - Encroachment Permit
$1,733.30 $1,452.00 $1,733.00
Cost Study
54 9 Construction – Right of Way Improvements – Permit & Inspection Application Fees
$614.73 $533.00 $614.00
Cost Study
86 11 Street Use Permit (temporary Use of Streets, Sidewalk Parkway, Parking Lot or Alleys- one time plus daily) Flat Fee
$331.23 $222.00 $331.00
131 of 232

Slide 47 Citywide User Fees, Rates and Charges Increases to Existing Fees – PW/Parking (2 of 3)
Review Fee
# Page
# Fee Title Full Cost Current
Fee Proposed
Fee Market
Research 3 26 Market Place Parking (120
S. Maryland Ave) Transient Parking Rate Maximum Fee
N/A $6.00 $9.00
Market Research
15 26 Exchange Parking (115 N. Maryland Ave) Transient Parking Rate Maximum Fee
N/A $6.00 $9.00
Market Research
21 27 The Orange Street Parking Structure (222 N. Orange St.) Transient Parking Rate Maximum Fee
N/A $6.00 $9.00
132 of 232
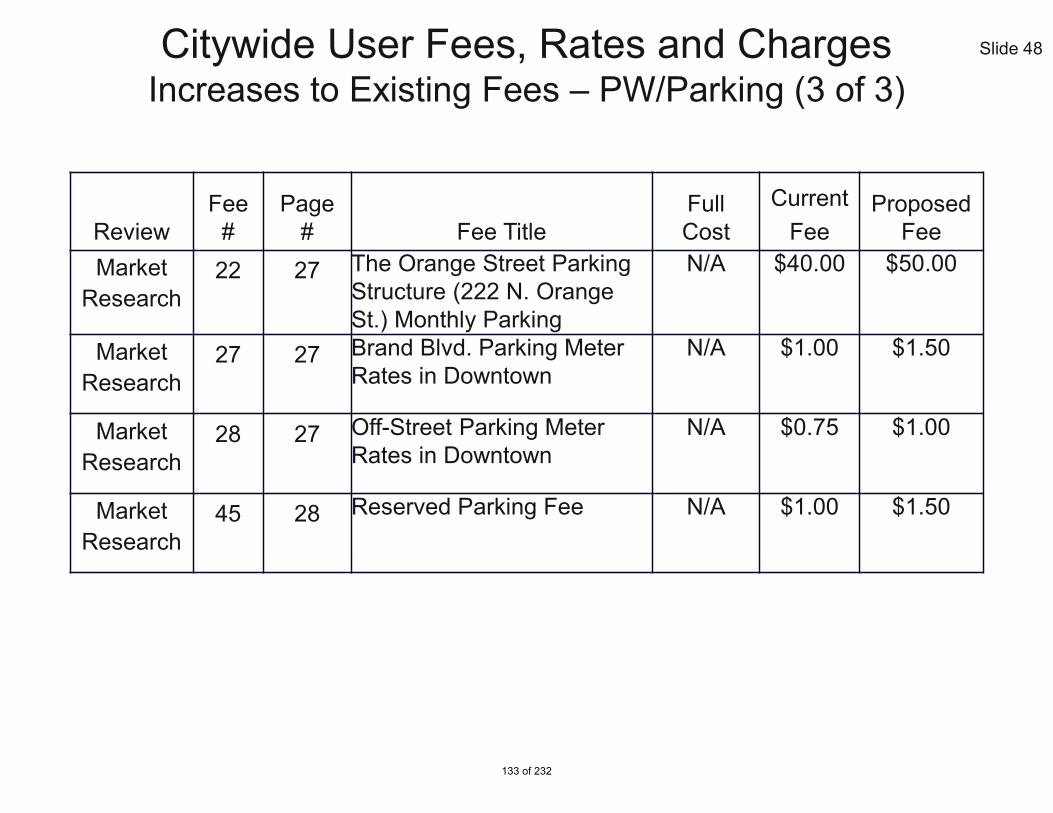
Slide 48 Citywide User Fees, Rates and Charges Increases to Existing Fees – PW/Parking (3 of 3)
Review Fee
# Page
# Fee Title Full Cost
Current Fee
Proposed Fee
Market Research
22 27 The Orange Street Parking Structure (222 N. Orange St.) Monthly Parking
N/A $40.00 $50.00
Market Research
27 27 Brand Blvd. Parking Meter Rates in Downtown
N/A $1.00 $1.50
Market Research
28 27 Off-Street Parking Meter Rates in Downtown
N/A $0.75 $1.00
Market Research
45 28 Reserved Parking Fee N/A $1.00 $1.50
133 of 232

Slide 49 Citywide User Fees, Rates and Charges Increases to Existing Fees – Library
Review Fee
# Page
# Fee Title Full Cost
Current Fee
Proposed Fee
Market Research
12 31 Central Library Auditorium Fees Glendale Individual and Commercial 3 Hours minimum Standard/Private (includes $50 Non-Refundable booking fee) Per Hour
N/A $220.00 $100.00 Per Hour (Min. 3 Hours)
Market Research
16 32 Central Library Auditorium Fees Non-Glendale Individual and Commercial 3 Hours minimum (includes $50 Non-Refundable booking fee) Per Hour
N/A $290.00 $150.00 Per Hour (Min. 3 Hours)
134 of 232

Slide 50 Citywide User Fees, Rates and Charges Increases to Existing Fees – CDD/Building (1 of 6)
Review Fee
# Page
# Fee Title Full Cost
Current Fee
Proposed Fee
Cost Study
1 43 Administrative Processing Fees Changes to Permits (Owner, contractor, etc.)
$89.52 $35.00 $62.00
Cost Study
2 43 Administrative Processing Fees Minimum Fee Retained for Refunds
$137.11 $35.00 $65.00
Cost Study
46 46 Use of Land Permit for Parking Lots
$562.33 $100.00 $281.00
Cost Study
51 46 Special Fees for Single Family Properties Wood, wrought iron, or chain link fences
$551.44 $167.00 $300.00
135 of 232

Slide 51 Citywide User Fees, Rates and Charges Increases to Existing Fees – CDD/Building (2 of 6)
Review Fee
# Page
# Fee Title Full Cost
Current Fee
Proposed Fee
Cost Study
55 47 Special Fees for Single Family Properties Replacement of windows
$603.93 $143.00 (Plus $25
per window)
$150.00 (Plus $25
per window)
Cost Study
130 54 Electrical Permit Fees Electrical Permit Fees Minimum Inspection Fee (If the total inspection fees equal less than $38.00, the minimum inspection fee shall apply)
$180.59 $38.00 $75.00
Cost Study
132 54 Electrical Permit Fees Single Family Homes Electrical Services 101 to 200 amps
$255.61 $75.00 $100.00
136 of 232

Slide 52 Citywide User Fees, Rates and Charges Increases to Existing Fees – CDD/Planning (3 of 6)
Review Fee
# Page
# Fee Title Full Cost
Current Fee
Proposed Fee
Cost Study
1 64 Administration Exception Single Family Projects (Per Project)
$1,283.55 $750.00 $780.00
Cost Study
54 66 Historic Preservation Commission review of single family dwelling modification or demolition
$4,939.92 $4,500.00 $4,707.00
Cost Study
55 66
Historic Preservation Commission review of modification or demolition of buildings/structures/features other than single family dwellings
$4,939.92 $4,881.00 $4,939.00
Cost Study
56 66 Historic Preservation Process a Mills Act Request
$7,681.08 $1,250.00 $1,300.00
Cost Study
62 67 Parking Reduction Permit $6,221.31 $5,403.00 $6,221.00
Cost Study
109 69 Business Registration Certificate Fee
$240.23 $198.00 $240.00
137 of 232

Slide 53 Citywide User Fees, Rates and Charges Increases to Existing Fees – CDD/NS (4 of 6)
Review Fee
# Page
# Fee Title Full Cost
Current Fee
Proposed Fee
Cost Study
3 71 Inspection Fee: Inspection of any violation
$352.95 $293.00 $352.00
Cost Study
12 71 News Racks Abatement Fee $188.49 $40.00 $188.00
Cost Study
20 71 Smoking Permitted Area - Initial $450.69 $209.00 $450.00
Cost Study
21 71 Smoking Permitted Area - Renewal $447.84 $207.00 $447.00
138 of 232

Slide 54 Citywide User Fees, Rates and Charges Increases to Existing Fees – CDD/NS/Licenses (5 of 6)
Review Fee
# Page
# Fee Title Full Cost
Current Fee
Proposed Fee
Cost Study
2 74 Animal License Dog License-Unaltered (Annual)
$61.69 $33.00 $45.00
Cost Study
3 74 Animal License Dog License-Unaltered/Senior (Per GMC, Senior applicants receive a 50% discount from the applicable license fee)
$61.69 $21.00 $22.50
Cost Study
4 74 Animal License Dog License-Altered $62.13 $21.00 $30.00
Cost Study
6 74 Animal License 3 Year - Dog License/Unaltered
$61.69 $52.00 $61.00
Cost Study
8 74 3 Year - Dog License/Altered $62.13 $40.00 $50.00
Cost Study
11 74 Animal License Dog License Replacement Tag (Permanent)
$9.90 $5.00 $9.00
139 of 232

Slide 55 Citywide User Fees, Rates and Charges Increases to Existing Fees – CDD/NS/Licenses (6 of 6)
Review Fee
# Page
# Fee Title Full Cost
Current Fee
Proposed Fee
Cost Study
13 74 Amusement Machine (Coin Operated) Application (Per Application Per Site)
$338.69 $146.00 $338.00
Cost Study
16 74 Arcade Devices Application (Per Application)
$338.69 $146.00 $338.00
Cost Study
22 75 Billiard Room - Application & License / Permit (Annual)
$887.27 $500.00 $600.00
Cost Study
28 75 Dance Academy (Annual) $812.43 $128.00 $250.00
Cost Study
37 75 Gasoline Dealers (Annual) $507.41 $204.00 $507.00
Cost Study
45 75 Kennel Permit License - 1 Year (Annual - Per Kennel)
$190.89 $132.00 $190.00
140 of 232

Slide 56 Citywide User Fees, Rates and Charges Increases to Existing Fees – Police
Review Fee
# Page
# Fee Title Full Cost Current
Fee Proposed
Fee Cost Study
1 143 Alarm Permit Fee – Residential (No Permit renewal fee charged if no false alarms in prior permit year)
$245.00 $100.00 $105.00
Cost Study
2 143 Alarm Permit Fee – Commercial (No Permit renewal fee charged if no false alarms in prior permit year)
$732.81 $150.00 $155.00
Cost Study
20 143 Permit for the retail Sales of Weapons
$425.74 $250.00 $260.00
141 of 232

Slide 57 Citywide User Fees, Rates and Charges Increases to Existing Fees – Fire (1 of 2)
Review Fee
# Page
# Fee Title Full Cost Current
Fee Proposed
Fee Cost Study
24 151 Fire Alarm System: Permit and Inspection Base fee for Installation of new system
$489.38 $485.00 $489.00
Cost Study
42 152 Fire Sprinkler system: Inspection Additional fee per inlet and/or outlet for Fire Sprinkler, standpipe or combined system
$23.86 $6.00 $23.00
Cost Study
43 152 Fire Sprinkler system: Inspection Additional fee per head for Fire Sprinkler, standpipe or combined system
$4.72 $2.00 $4.00
142 of 232
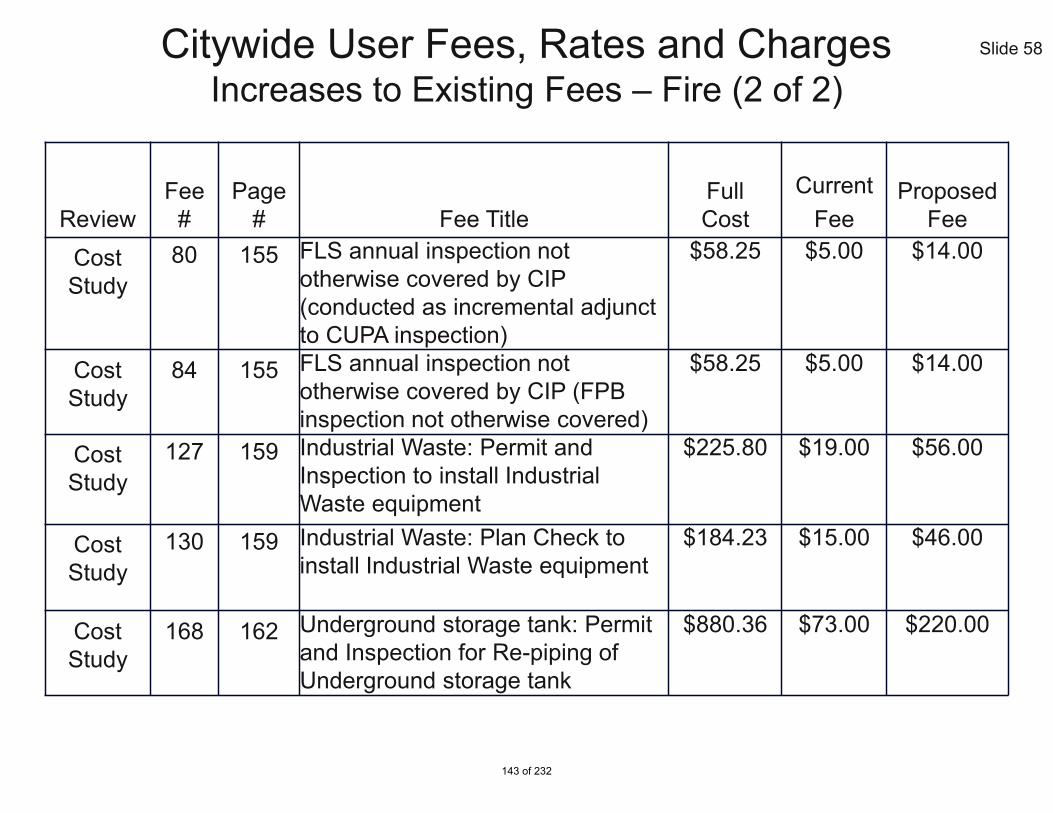
Slide 58 Citywide User Fees, Rates and Charges Increases to Existing Fees – Fire (2 of 2)
Review
Fee
# Page
# Fee Title Full Cost
Current Fee
Proposed Fee
Cost Study
80 155 FLS annual inspection not otherwise covered by CIP (conducted as incremental adjunct to CUPA inspection)
$58.25 $5.00 $14.00
Cost Study
84 155 FLS annual inspection not otherwise covered by CIP (FPB inspection not otherwise covered)
$58.25 $5.00 $14.00
Cost Study
127 159 Industrial Waste: Permit and Inspection to install Industrial Waste equipment
$225.80 $19.00 $56.00
Cost Study
130 159 Industrial Waste: Plan Check to install Industrial Waste equipment
$184.23 $15.00 $46.00
Cost Study
168 162 Underground storage tank: Permit and Inspection for Re-piping of Underground storage tank
$880.36 $73.00 $220.00
143 of 232

Slide 59 Citywide User Fees, Rates and Charges Increases to Existing Fees – GWP
Review Fee
# Page
# Fee Title Current
Fee Proposed
Fee Dept. Fee
Review
1 168 Water Service Installations, 1” Water
Meter and Service, 10’ or less in length $5,700.00 $6,420.00
Dept. Fee
Review
2 168 Water Service Installations, 1” Water
Meter and Service, 10’ and 20’ in length $7,400.00 $7,900.00
Dept. Fee
Review
13 169 Fire Line Protection Service Installations; 4" Fire Line; 10' or less in length
$11,400.00 $13,600.00
Dept. Fee
Review
15 169 Fire Line Protection Service Installations; 6" Fire Line; 10' or less in length
$11,600.00 $13,850.00
144 of 232

Slide 60 Other Staff Recommendations CPI Adjustments
Department CPI Adjustment
City Clerk 3.1%
Filming 3.1%
CDD 3.1%
Fire 3.1%
Library, Arts & Culture 3.1%
Police 3.1%
Public Works 3.1%
Note: CPI adjustment of 3.1% (Issued by the Bureau of Labor Statistics -- for the year ending January 2016) applies to various departments/divisions as indicated in the
FY 2016-17 Proposed Citywide Fee Schedule
145 of 232

Slide 61 Citywide User Fees, Rates and Charges New Proposed Fees (1 of 2)
Fee#
Page # Fee Title Dept/Div
Proposed Fee
10 3 Citywide Credit Card Service Fee Recovery Citywide 2.5%
79 23 Private Hauler Permit (Integrated Waster Management) for New and Renewal
P.W./ Integrated
Waste
$1,289
47 28 Appeal of Preferential Parking Decision by Transportation and Parking Commission to the City Council
PW/ Parking $306.31
218 62 Electrical permit fees; Alternative fee for Office Tenant Improvement including low voltage – Per Square Foot [The Cost analysis is based upon 1,500 sf. Single SF charge will based upon dividing the final cost by 1,500]
CDD/Building $0.17 Per Square
Foot
219 62 Covenant and Agreement Fee CDD/Building $2,300
146 of 232

Slide 62 Citywide User Fees, Rates and Charges New Proposed Fees (2 of 2)
Fee#
Page # Fee Title Dept/Div
Proposed Fee
120 69 Variance – Use /Single Family Zone - Projects Approved Prior to Adoption of Ordinance #5644
CDD/ Planning
$1,225
72 77 Appeal (e.g. License/Permit Denial, Citations) CDD/ N.S. / Licenses
$145
123 84 Storm water pollutant discharge – control of storm water discharge from construction site required
CDD/ Admin
Citations
$100 $200 $500
2 98 Density Bonus Review of Density Bonus Housing Plan – Housing Fee
CDD/ Housing
$8,811
44 145 Alarm Company – Failure to report new install Police $50
197 165 Express plan check fee: Fee to expedite the initial plan review process to eliminate “backlog
time” on an as available, overtime basis. In
addition to regular plan check fees
Fire 150% of the regular plan check fees
147 of 232

Slide 63
Total Number of Fees for City Services – 2,421
No Changes – 1,674
Fee Deletion – 77
Decreases to Existing Fees – 72
Increase to Existing Fees – 243
CPI Increases to Existing Fees – 302
New Fees – 53
Citywide User Fees, Fines, Rates & Charges Proposed Fee Changes
148 of 232

Study Session #3
City of Glendale Budget Study Session #3
May 17, 2016
149 of 232

Slide 2
FY 2016-17 Proposed Budget Study Session #3 Agenda
City Council Priorities • Principles of Compensation Management
Salaries & Benefit History & General Fund Forecast
Summary of Appropriations • General Fund by Department
• All Funds
Citywide Fee Schedule
Alternative Budget Scenarios • Background
• General Fund Reduction Options
• Revenue / Resources Options
Budget Calendar
Questions & Comments
150 of 232

Slide 3 FY 2016-17 City Council Priorities City of Glendale
I. Fiscal Responsibility – We must achieve structural balance, be
realistic in our assumptions and prudent in our expenditures
II. Exceptional Customer Service – We must be empathetic
problem-solvers, exhibiting respect and a sincere desire to aid
our residents and customers
III. Economic Vibrancy – This is our business plan, to attract
investment and grow new revenue and opportunities for
Glendale
IV. Informed & Engaged Community – An informed public makes
better policy. We will combat cynicism with knowledge and we
will combat apathy with a genuine desire to listen
151 of 232

Slide 4 FY 2016-17 City Council Priorities City of Glendale
V. Safe & Healthy Community – Protection of life and property is a
foundational mission for this organization. We will offer
assistance to anyone in need, and do so offering respect and
dignity
VI. Balanced, Quality Housing – Ensuring safe, sanitary and
descent housing is elemental to building an engaged citizenry.
At the same time, we will ensure that neighborhoods are
protected and their quality of life is unimpeded
VII. Community Services & Facilities – Offering safe, clean and
interesting opportunities for our residents to recreate and relax
is important to their health and wellbeing
152 of 232

Slide 5 FY 2016-17 City Council Priorities City of Glendale
VIII. Infrastructure & Mobility – Public infrastructure in all its forms is
part of our legacy and part of the public trust; we must find
ways to improve it for Glendale’s next generation of leaders
IX. Arts & Culture – We value the whole person, and we hope to
inspire our residents and businesses with thoughtful
investments in the arts and cultural efforts
X. Sustainability – Preserving natural resources may be a global
endeavor, but Glendale will act locally to adopt progressive yet
practical policies to protect our planet
153 of 232

Slide 6
I. The City shall seek to balance the Council priorities of Fiscal Responsibility and Exceptional Customer Service by attracting and employing quality city personnel within a sustainable financial structure.
II. All elements of employee compensation must be funded and secured, and based on the City’s ability to pay.
III. The City shall periodically endeavor to calibrate compensation for classifications at the average of comparable cities in the defined market. However, the City may establish select compensation classifications more competitively within the market, based on department mission, program priority, and market forces.
• The City shall pay average market salary and expect exceptional execution and performance
IV. In addition to consideration of market comparisons, the City shall also endeavor to analyze internal organizational equity within comparable job classifications and amongst the respective bargaining units.
Principles of Compensation Management
154 of 232

Slide 7
V. Merit compensation increases and/or bonus consideration shall be based solely on employee performance and on the City’s ability to pay in a non-discriminatory fashion.
VI. In order to sustain the defined-benefit model, employees shall participate in funding retirement costs to the maximum extent possible.
VII. The City’s PERS program participation will reflect sustainable actuarial
horizons.
VIII. The City’s total General Fund workforce costs should not exceed 75% of
net operating expenses on an annual basis; Citywide workforce costs should not exceed 35% of net operating expenses on an annual basis
IX. The City’s total management costs should not exceed 25% of its total
personnel costs, ensuring a trim and efficient organizational structure.
X. Employee time accruals will be monitored and utilized to ensure that separating employees’ payouts are minimized.
Principles of Compensation Management (cont’d)
155 of 232

Citywide Salaries & Benefit History &
General Fund Forecast
156 of 232

Salaries & Benefits History
Citywide (In Thousands)
Actuals
FY 07-08
Actuals
FY 08-09
Actuals
FY 09-10
Actuals
FY 10-11
Actuals
FY 11-12
Actuals
FY 12-13
Actuals
FY 13-14
Actuals
FY 14-15
Est.
Actuals
FY15-16*
Proposed
Budget
FY16-17
Authorized Full-
Time Positions 1,986 1,942 1,904 1,899 1,873 1,605 1,588 1,520 1,575 1,579
% Change (2.2%) (2.0%) (0.3%) (1.4%) (14.3%) (1.1%) (4.3%) 3.6% 0.3%
Filled Positions 1,772 1,783 1,764 1,722 1,673 1,488 1,504 1,429 1,436 1,436
% Change - 0.6% (1.1%) (2.4%) (2.8%) (11.1%) 1.1% (5.0%) 0.5% -
Salaries and
Benefits (Actuals)
Total Salaries $ 164,926 $ 169,820 $ 172,333 $ 171,953 $ 166,739 $ 152,752 $ 153,241 $ 152,495 $ 155,022 $ 164,212
PERS Retirement 20,820 22,751 22,641 23,024 30,402 28,413 28,598 30,015 34,728 42,863
PERS Cost-share - - - - (3,229) (3,056) (3,442) (2,586) (2,794) (5,552)
PERS Net Cost $ 20,820 $ 22,751 $ 22,641 $ 23,024 $ 27,173 $ 25,357 $ 25,156 $ 27,429 $ 31,934 $ 37,311
All Other Benefits 42,765 32,153 36,067 36,545 42,329 38,387 37,886 40,489 41,939 40,211
Total Benefits $ 63,585 $ 54,904 $ 58,708 $ 59,569 $ 69,502 $ 63,744 $ 63,042 $ 67,918 $ 73,873 $ 77,522
Total Salaries & Ben $ 228,511 $ 224,724 $ 231,041 $ 231,522 $ 236,241 $ 216,496 $ 216,283 $ 220,413 $ 228,895 $ 241,734
% Change - (1.7%) 2.8% 0.2% 2.0% (8.4%) (0.1%) 1.9% 3.8% 5.6%
* FY 15-16 amounts reflect estimated actuals as of June 30, 2016
Slide 9
157 of 232

General Fund Forecast Slide 10
(In thousands)
Adopted
FY 15-16
Proposed
FY 16-17 FY 17-18 FY 18-19 FY 19-20 FY 20-21 FY 21-22
Resources: $ 185.7 $ 192.9 $ 200.5 $ 206.6 $ 212.3 $ 217.6 $ 223.2
Assigned Fund Balance – Econ Dev - 0.9 0.7 0.7 - - -
Total Projected Resources: $ 185.7 $ 193.8 $ 201.2 $ 207.3 $ 212.3 $ 217.6 $ 223.2
Appropriations:
Base Line $ 122.8 $ 124.7 $ 127.1 $ 128.4 $ 129.3 $ 130.3 $ 131.0
PERS 25.9 28.7 31.5 34.0 36.6 37.3 38.3
PERS Cost Share (2.8) (3.3) (3.3) (3.3) (3.4) (3.4) (3.4)
PERS Net of Cost Share: $ 23.1 $ 25.4 $ 28.2 $ 30.7 $ 33.2 $ 33.9 $ 34.9
CIP 0.5 1.6 0.7 0.9 1.9 3.0 3.5
ISF’s 36.0 41.5 43.5 44.9 46.5 47.5 48.4
COP’s 0.5 0.8 0.8 1.0 1.0 1.0 1.0
Assigned Fund Balance – Econ Dev - 0.9 0.7 0.7 - - -
Total Appropriations $ 182.9 $ 194.9 $ 201.0 $ 206.6 $ 211.9 $ 215.7 $ 218.8
Net Surplus/(Deficit) $ 2.8 $ (1.1) $ 0.2 $ 0.7 $ 0.4 $ 1.9 $ 4.4
Budget Adjustments as of 3/31/16 (2.2) - - - - - -
Revenue Adjustments as of 3/31/16 1.5 - - - - - -
Est. Savings 0.3 - - - - - -
Net Surplus/(Deficit) $ 2.4 $ (1.1) $ 0.2 $ 0.7 $ 0.4 $ 1.9 $ 4.4
158 of 232

Summary of Appropriations
159 of 232

Slide 12 Summary of Appropriations General Fund (1 of 2)
Department Adopted
FY 2015-16 Proposed
FY 2016-17 Increase / (Decrease)
% Change
Administrative Services $ 5,501,035 $ 5,341,567 $ (159,468) (2.9%)
City Attorney 3,190,013 3,548,439 358,426 11.2%
City Clerk 1,054,463 1,349,630 295,167 28.0%
City Treasurer 665,123 742,164 77,041 11.6%
Community Development 9,845,834 14,943,660 5,097,826 51.8%
Community Services & Parks 10,499,841 12,631,020 2,131,179 20.3%
Fire 45,027,061 48,847,789 3,820,728 8.5%
Human Resources 2,660,726 2,654,861 (5,865) (0.2%)
Library, Arts & Culture 8,488,883 9,594,695 1,105,812 13.0%
160 of 232
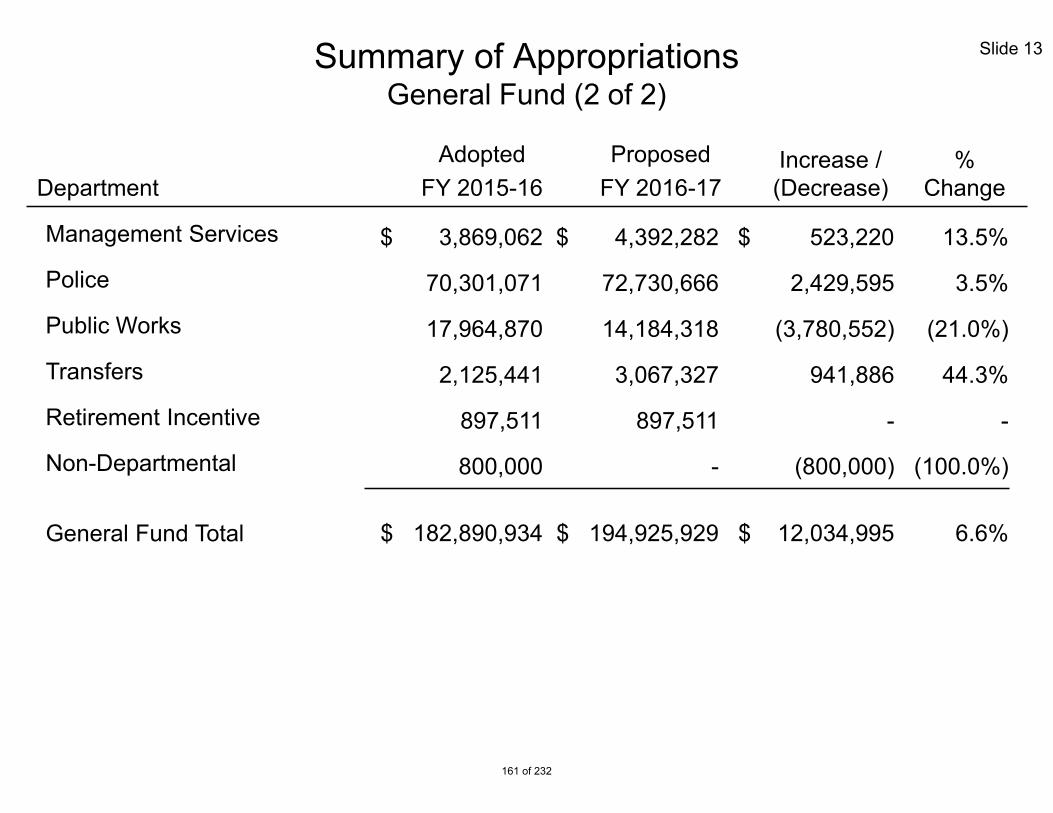
Slide 13 Summary of Appropriations General Fund (2 of 2)
Department Adopted
FY 2015-16 Proposed
FY 2016-17 Increase / (Decrease)
% Change
Management Services $ 3,869,062 $ 4,392,282 $ 523,220 13.5%
Police 70,301,071 72,730,666 2,429,595 3.5%
Public Works 17,964,870 14,184,318 (3,780,552) (21.0%)
Transfers 2,125,441 3,067,327 941,886 44.3%
Retirement Incentive 897,511 897,511 - -
Non-Departmental 800,000 - (800,000) (100.0%)
General Fund Total $ 182,890,934 $ 194,925,929 $ 12,034,995 6.6%
161 of 232

Slide 14 Summary of Appropriations All Funds
Fund Type Adopted
FY 2015-16 Proposed FY
2016-17 Increase/
(Decrease) %
Change General Fund $ 182,890,934 $ 194,925,929 $ 12,034,995 6.6%
Special Revenue Funds 103,702,342 100,630,978 (3,071,364) (3.0%)
Debt Service Funds 3,025,000 3,010,000 (15,000) (0.5%)
Capital Improvement Funds 13,755,000 25,362,000 11,607,000 84.4%
Enterprise Funds 390,966,533 385,917,075 (5,049,458) (1.3%)
Internal Service Funds 103,489,784 109,832,418 6,342,634 6.1%
All Funds – Grand Total $ 797,829,593 $ 819,678,400 $ 21,848,807 2.7%
162 of 232

Citywide Fee Schedule
163 of 232

Slide 16 Fee Options for Council Consideration Credit Card Fees
Fee Title Current
Fee FY 2016-17
Fee Citywide Credit Card Service Fee Recovery
- 2.5%
- Page 3, Fee #10
164 of 232

Slide 17 Fee Options for Council Consideration PW - Parking Fees
- Page 26 Fee #3 & #15, Page 27 Fee #21, #33, #27, #28 and Page 28 Fee #45
Increase Daily Maximum Rate at all garages from $6 to $9 • Facilitates a better value for longer-term parking
• The Daily maximum at the City Garages is far below comparable private garages
• This increase would move the City closer to the market rate but still below the average
Increase Brand Meter Rates from $1 to $1.50 per hour • Based on occupancy levels & Parking Program Goals
• Incremental approach to encourage more turnover of on-street parking
• Perhaps one/two more incremental increases in coming years
Increase Off-Street Meter Rates from $0.75 to $1 per hour • Same rationale as above; marginally lower cost than Brand Boulevard stalls
165 of 232

Slide 18 Fee Options for Council Consideration PW - Parking Fees
- Page 26 Fee #3 & #15, Page 27 Fee #21, #33, #27, #28 and Page 28 Fee #45
Increase Monthly Parking at Orange Street from $40 to $50 • Based on Market Rate Study
• To bring Orange St. monthly rates closer to other City Garage Rates of $60
Increase Reserved Parking Fee from $1 to $1.50 • This would set the rate consistent with the highest metered rate in the City
Ultimately, parking rates will reflect priority of Brand Boulevard, then side streets and surface lots, then public garages
Ongoing public-private comparison to ensure affordability
166 of 232

Slide 19 Fee Options for Council Consideration CDD - Building & Safety Fees
Fee Title Total Current
Fee* Full Cost
Revised Proposed
Fee Electrical Permit Fees Other Electrical Items: Commercial Services 600 volts or less; Over 200 amperes and including 600 amperes
$118.38 $360.44 $200.00
- Page 57, Fee #165, (To be consistent with the related fees #133/#134 and #142/#143) * Total Current Fee includes Technology Surcharge for 2015-16
167 of 232

Slide 20 Fee Options for Council Consideration CDD - Planning Fees
Fee Title Total Current
Fee* FY 2016-17 Fee Options
Cost Recovery Rate
Historic Preservation Process a Mills Act Request
$1,479.75 $7,681.08 $5,760.81 $3,840.54 $1,920.27
100% 75% 50% 25%
- Page 66, Fee #56 * Total Current Fee includes Technology Surcharge for 2015-16
Owners’ average tax savings per property per year: $8,000
City’s average tax loss revenues per property per year: $1,000
City’s total tax loss revenues per year: $75,000
168 of 232

Slide 21 Fee Options for Council Consideration CDD - Planning Fees
Fee Title Total Current
Fee* FY 2016-17 Fee Options
Cost Recovery Rate
Subdivision Condominium or Condominium Conversion
$11,838.00 $11,550.21 $8,662.66 $5,775.11 $2,887.55
100% 75% 50% 25%
• Page 67, Fee #76 • Total Current Fee includes Technology Surcharge for 2015-16
169 of 232

Slide 22
Fee Title Total Current
Fee* FY 2016-17 Fee Options
Cost Recovery Rate
Animal License Dog License-Unaltered (Annual)
$39.07 $61.69 $46.27 $30.85 $15.42
100% 75% 50% 25%
Animal License Dog License-Altered
$24.86 $62.13 $46.60 $31.07 $15.53
100% 75% 50% 25%
- Page 74, Fee #2 – 11 (Per GMC Section 6.08.080(A), qualified Senior Applicants receive a 50% discount from the applicable license fee)
* Total Current fees include the Technology Surcharge for FY 2015-16
Fee Options for Council Consideration CDD - NS / Licenses & Permits
170 of 232

Slide 23
Fee Title Total Current
Fee* FY 2016-17 Fee Options
Cost Recovery Rate
Animal License 3 Year - Dog License/Unaltered
$61.56
$61.69 $46.27 $30.85 $15.42
100% 75% 50% 25%
Animal License 3 Year - Dog License/Altered
$47.35 $62.13 $46.60 $31.07 $15.53
100% 75% 50% 25%
Animal License Dog License Replacement Tag (Permanent)
$5.92 $9.90 $7.43 $4.95 $2.48
100% 75% 50% 25%
- Page 74, Fee #2 – 11 (Per GMC Section 6.08.080(A), qualified Senior Applicants receive a 50% discount from the applicable license fee)
* Total Current fees include the Technology Surcharge for FY 2015-16
Fee Options for Council Consideration CDD - NS / Licenses & Permits
171 of 232

Slide 24
Fee Title Total Current
Fee* Revised
Proposed Fee Cost Recovery
Rate Billiard Room - Application & License / Permit (Annual)
$591.90 $300.00 34%
Arcade / Billiard Establishment (Annual)
$628.60 $545.00 100%
A Billiard Room License is required for businesses with 1 or 2 billiard tables
A Billiard Establishment License is required for businesses with 3 or more billiard tables
- Page 75, Fee #22 - Page 74, Fee #19 * Total Current fee includes the Technology Surcharge for FY 2015-16
Fee Options for Council Consideration CDD - NS / Licenses & Permits
172 of 232

Slide 25
Fee Title Total Current
Fee* Full Cost
Revised Proposed Fee
Kennel Application – Initial $114.83 $104.80 $104.00
Kennel Permit (Annual – Per Kennel)
$156.26 $190.89 $132.00
Kennel Permit – 3 Years $192.96 $163.01 $163.00
- Page 75, Fee #44-45 and Page 76, Fee #66 * Total Current Fee includes Technology Surcharge for 2015-16
Council may consider a 50% discount for qualified seniors, same as Animal Licenses
Fee Options for Council Consideration CDD - NS / Licenses & Permits
173 of 232

Measure N Utility Users Tax Repeal
Alternative Budget Scenarios
Slide 26
174 of 232

Slide 27
UUT Rate Comparison
- In 2009 Glendale voters approved a rate reduction for Telecommunications and Video (reduced from 7% to 6.5%)
Glendale Burbank Pasadena Los Angeles
Electricity 7.00% 7.00% 7.67% 10.00%
Water 7.00% - 7.67% -
Gas 7.00% 7.00% 7.90% 10.00%
Communications 6.50% 7.00% 8.28% - 9.40% 9.00%
175 of 232

Slide 28
Per Capita Tri-City Comparison – Utility Users Tax
Glendale $28,515,000 $27,000,000 $27,600,000 $27,746,000 $28,250,000 Burbank $20,292,313 $20,860,498 20,860,498 $20,430,498 $20,431,108
Pasadena $32,620,851 $30,342,000 $31,302,000 $30,602,000 $30,352,000
FY 2011-12 FY 2012-13 FY 2013-14 FY 2014-15 FY 2015-16 Glendale 191,719 193,111 194,478 196,021 199,182
Burbank 104,304 104,427 104,982 105,543 106,084
Pasadena 137,122 139,222 140,020 140,879 141,510
Population
Glendale $ 149 $ 140 $ 142 $ 139 $ 142 Burbank $ 195 $ 200 $ 199 $ 194 $ 193
Pasadena $ 238 $ 218 $ 224 $ 217 $ 214
UUT Revenues
Per Capita
- The above data is based on Adopted Budgets for Glendale, Burbank & Pasadena
176 of 232

Slide 29
Average UUT Cost per Residence
* Population is based on Department of Finance estimates
UUT Category Budget Population*
Annual
Per Capita
Monthly
Per Capita
Weekly
Per Capita
Electricity $12,000,000 199,182 $60.25 $5.02 $1.16
Water 2,950,000 199,182 $14.81 $1.23 $0.28
Gas 2,550,000 199,182 $12.80 $1.07 $0.25
Potential Loss: $17,500,000 $87.86 $7.32 $1.69
Communication 10,750,000 199,182 $53.97 $4.49 $1.04
Total UUT $28,250,000 $141.83 $11.81 $2.73
177 of 232

Slide 30 FY 2015-16 General Fund Resources vs Appropriations
OTHER RESOURCES $14,523,983 - 7.8%
INTERNAL SERVICE DEPARTMENTS
$20,763,374 - 11.4%
OTHER LICENSES, PERMITS & TAXES
$19,105,000 - 10.3%
LIBRARY $8,488,883 - 4.6%
INTERFUND REVENUE
$15,090,577 8.1% C. S. & PARKS
$10,499,841 - 5.7%
TRANSFER FROM OTHER FUNDS
$21,257,000 11.4%
CDD $9,845,834 - 5.4%
UTILITY USERS TAXES $28,250,000
15.2%
PUBLIC WORKS $17,964,870
9.8%
SALES TAXES $37,700,000
20.3%
FIRE $45,027,061
24.6%
PROPERTY TAXES $49,740,000
26.8% POLICE
$70,301,071 38.4%
$-
$20,000,000
$40,000,000
$60,000,000
$80,000,000
$100,000,000
$120,000,000
$140,000,000
$160,000,000
$180,000,000
$200,000,000
Resources$185,666,560
Appropriations$182,890,934178 of 232

Alternative Scenarios Options for General Fund Reductions
179 of 232

Option 1: Police and Fire Departments • Significant reductions to Police & Fire Departments
– Elimination of many full-time positions (as many as 90), programs and services – Longer response times – Loss of proactive police services – Higher property insurance & loss of real estate value
OR • Contract out services to LA County AND reduce staffing
– Cost of services are equal to or higher than Glendale – “Purchase” reduced services from Sheriffs and County Fire – Loss of local control and priorities
Option 2: Parks and Library Departments • Eliminate both departments in their entirety • Loss of community services for residents, seniors and youth • Termination of public operation of parks, pool, ballfields, recreation centers and libraries
Slide 32 Options for General Fund Reductions
180 of 232

Option 3: Combination of reductions in all 4 departments offset by deficit spending • Police
– Reduction of 6 vacant full-time sworn positions – Loss of some programs and services; increased response times
• Fire – Reduction of 14 vacant full-time sworn positions – Loss of some programs and services; “brown-outs”; increased response times
• Community Services & Parks – Closure of 5 park facilities and reduced hours at all others – Less frequent park and facility maintenance; loss of programs and services
• Library, Arts & Culture – Closure of all 6 neighborhood libraries; loss of programs and services
• Use of General Fund Reserves to make-up difference
Slide 33 Options for General Fund Reductions
181 of 232

General Fund Reductions Option 3 Details
Department
Proposed 2016-17
GF Budget (millions)
2016-17 Reduction Amount (millions)
Reduction % of Dept GF
Budget
Police Department $ 72.7 $ 1.8 2.5% Fire Department 48.8 3.9 8.0% Community Svs & Parks Department 12.6 5.5 44.0% Library, Arts & Culture Department 9.6 2.4 25.0% Use of General Fund Reserves 3.9
Total $17.5
Slide 34
182 of 232

General Fund Reductions Option 3: Police Department Details
Department
Proposed 2016-17
GF Budget (millions)
2016-17 Reduction Amount (millions)
Reduction % of Dept GF
Budget
Police Department $ 72.7 $ 1.8 2.5% Fire Department 48.8 3.9 8.0% Community Svs & Parks Department 12.6 5.5 44.0% Library, Arts & Culture Department 9.6 2.4 25.0% Use of General Fund Reserves 3.9
Total $17.5
Slide 35
2.5% Budget Reduction or $1.8 million • Elimination of 6 full-time vacant sworn officer positions • Longer response times • Programs eliminated all or in part
183 of 232
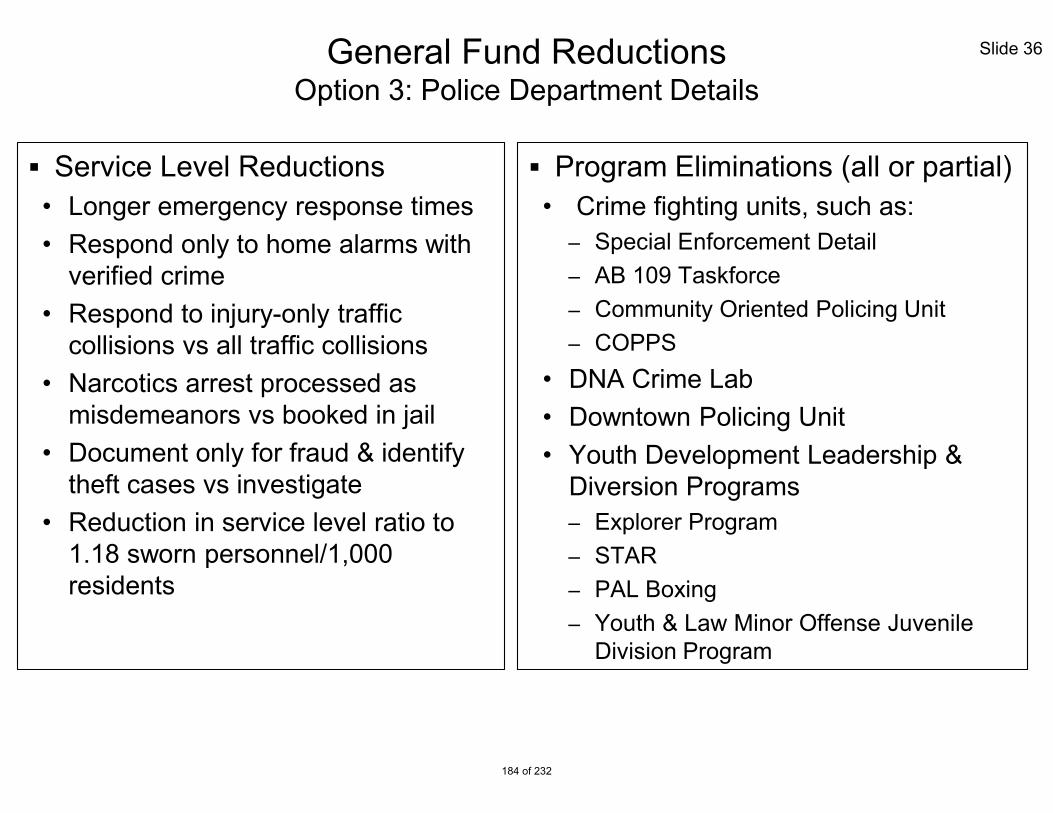
Slide 36
Service Level Reductions • Longer emergency response times • Respond only to home alarms with
verified crime • Respond to injury-only traffic
collisions vs all traffic collisions • Narcotics arrest processed as
misdemeanors vs booked in jail • Document only for fraud & identify
theft cases vs investigate • Reduction in service level ratio to
1.18 sworn personnel/1,000 residents
Program Eliminations (all or partial) • Crime fighting units, such as:
– Special Enforcement Detail – AB 109 Taskforce – Community Oriented Policing Unit – COPPS
• DNA Crime Lab • Downtown Policing Unit • Youth Development Leadership &
Diversion Programs – Explorer Program – STAR – PAL Boxing – Youth & Law Minor Offense Juvenile
Division Program
General Fund Reductions Option 3: Police Department Details
184 of 232

General Fund Reductions Option 3: Fire Department Details
Slide 37
8.0% Budget Reduction or $3.9 million • Elimination of 14 vacant full-time sworn positions • Longer response times • Loss of Class 1 ISO rating
Department
Proposed 2016-17
GF Budget (millions)
2016-17 Reduction Amount (millions)
Reduction % of Dept GF
Budget
Police Department $ 72.7 $ 1.8 2.5% Fire Department 48.8 3.9 8.0% Community Svs & Parks Department 12.6 5.5 44.0% Library, Arts & Culture Department 9.6 2.4 25.0% Use of General Fund Reserves 3.9
Totals $17.5
185 of 232

Slide 38
Service Level Reductions • Longer emergency response times • Less statewide mutual aid • Fire station brown-outs • Fewer available paramedics • Loss of Class 1 ISO rating; higher
property insurance rates • Reduction in service level ratio to
0.75 sworn personnel / 1,000 residents
Program Eliminations (all or partial) • Emergency Services, such as:
– Arson investigator position – Urban Search & Rescue Unit – Hazardous Materials Unit – Staff Assistants
• EMS programs – Community Paramedic Program – Alternate Transportation Program – Community EMT programs
• Resident Education Programs – CERT Program – Junior Fire Program
General Fund Reductions Option 3: Fire Department Details
186 of 232

General Fund Reductions Option 3: Community Services & Parks Department Details
Slide 39
44% Budget Reduction or $5.5 million • Elimination of 21 full-time & 52 FTE hourly positions (GF & Rec Fund) • Closure of 5 facilities & reduced hours at others • Reduction in park maintenance & Elimination of programs • Determination of remaining DIF funds
Department
Proposed 2016-17
GF Budget (millions)
2016-17 Reduction Amount (millions)
Reduction % of Dept GF
Budget
Police Department $ 72.7 $ 1.8 2.5% Fire Department 48.8 3.9 8.0% Community Svs & Parks Department 12.6 5.5 44.0% Library, Arts & Culture Department 9.6 2.4 25.0% Use of General Fund Reserves 3.9
Totals $17.5
187 of 232

Slide 40
Closed Facilities • Maple Park Community Center • Sparr Heights Community Center • Skate Park • Pacific Pool • Civic Auditorium
Reduced Hours • Pacific Community Center • Adult Recreation Center • 28 Parks with gates, restrooms
and/or tennis courts
General Fund Reductions Option 3: Community Services & Parks Department Details
188 of 232

Slide 41
Park Maintenance Reductions • Reduction in the frequency of
activity, for example: – Daily general park maintenance to 3x
per week – Daily restroom maintenance to 2x per
week – Weekly shrub maintenance to monthly – Weekly park turf to monthly – Daily ballfield maintenance to Little
Leagues performing maintenance unless rented
– 24 hour response pushed to 72 hours for clean up of vandalism/graffiti
– Ballfield lights from being on nightly to only for paid rentals
Program Eliminations • All or partial programs eliminated, for
example: – All youth programs – All Aquatics programs – Senior case management & recreation
programming – All Special events (e.g. Cruise Night,
Easter Eggstravaganza, Montrose Christmas Parade, CV Fireworks)
– All day camps except at Pacific park – Contract classes
General Fund Reductions Option 3: Community Services & Parks Department Details
189 of 232

General Fund Reductions Option 3: Library, Arts & Culture Department Details
Slide 42
25% Budget Reduction or $2.4 million • Elimination of 9 full-time & 9 FTE hourly positions • Closure of 6 neighborhood libraries • Loss of access to community meeting spaces • Determination of remaining DIF funds
Department
Proposed 2016-17
GF Budget (millions)
2016-17 Reduction Amount (millions)
Reduction % of Dept GF
Budget
Police Department $ 72.7 $ 1.8 2.5% Fire Department 48.8 3.9 8.0% Community Svs & Parks Department 12.6 5.5 44.0% Library, Arts & Culture Department 9.6 2.4 25.0% Use of General Fund Reserves 3.9
Totals $17.5
190 of 232

Slide 43
Closed Facilities • Library Connection @ Adams
Square • Casa Verdugo Library • Chevy Chase Library • Grandview Library • Montrose Library • Pacific Park Library
Overall loss of service • Convenient access to library services
and community spaces • Children, teen and adult
programming • Free access to computers and wi-fi • Literacy, ESL and tutoring support • School partnerships; after-school
and summer programming • Global language materials; multi-
lingual staff • Meeting rooms; Small business work
spaces
General Fund Reductions Option 3: Library, Arts & Culture Department Details
191 of 232

General Fund Reductions Option 3: Summary
Slide 44
Department
Proposed 2016-17
GF Budget (millions)
2016-17 Reduction Amount (millions)
Reduction % of Dept GF
Budget
Police Department $ 72.7 $ 1.8 2.5% Fire Department 48.8 3.9 8.0% Community Svs & Parks Department 12.6 5.5 44.0% Library, Arts & Culture Department 9.6 2.4 25.0% Use of General Fund Reserves 3.9
Totals $17.5
Total of $17.5 million • Elimination of 50 full-time positions & 61 FTE hourly positions • Loss of proactive policing • Fire station brown-outs • Longer safety response times • Closure of 6 libraries & 5 park facilities with reduced hours at others • Loss of many senior & youth programs
192 of 232
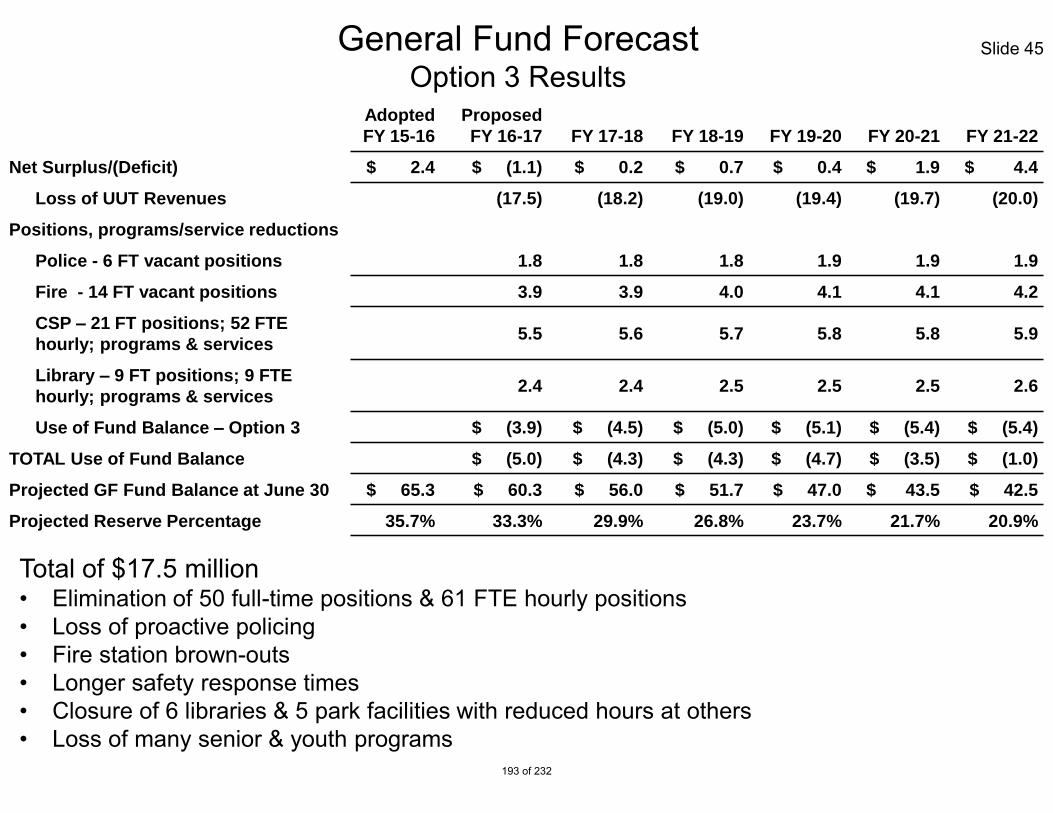
General Fund Forecast Option 3 Results
Slide 45
Adopted
FY 15-16
Proposed
FY 16-17 FY 17-18 FY 18-19 FY 19-20 FY 20-21 FY 21-22
Net Surplus/(Deficit) $ 2.4 $ (1.1) $ 0.2 $ 0.7 $ 0.4 $ 1.9 $ 4.4
Loss of UUT Revenues (17.5) (18.2) (19.0) (19.4) (19.7) (20.0)
Positions, programs/service reductions
Police - 6 FT vacant positions 1.8 1.8 1.8 1.9 1.9 1.9
Fire - 14 FT vacant positions 3.9 3.9 4.0 4.1 4.1 4.2
CSP – 21 FT positions; 52 FTE
hourly; programs & services 5.5 5.6 5.7 5.8 5.8 5.9
Library – 9 FT positions; 9 FTE
hourly; programs & services 2.4 2.4 2.5 2.5 2.5 2.6
Use of Fund Balance – Option 3 $ (3.9) $ (4.5) $ (5.0) $ (5.1) $ (5.4) $ (5.4)
TOTAL Use of Fund Balance $ (5.0) $ (4.3) $ (4.3) $ (4.7) $ (3.5) $ (1.0)
Projected GF Fund Balance at June 30 $ 65.3 $ 60.3 $ 56.0 $ 51.7 $ 47.0 $ 43.5 $ 42.5
Projected Reserve Percentage 35.7% 33.3% 29.9% 26.8% 23.7% 21.7% 20.9%
Total of $17.5 million • Elimination of 50 full-time positions & 61 FTE hourly positions • Loss of proactive policing • Fire station brown-outs • Longer safety response times • Closure of 6 libraries & 5 park facilities with reduced hours at others • Loss of many senior & youth programs
193 of 232

Potential UUT Impacts Revenue / Resource Options
194 of 232

Potential UUT Impacts Revenue / Resource Options
Use of General Fund Reserves New Taxes
• General Taxes – requires majority vote – Business License Tax – Local Sales Tax
• Special Taxes – requires 2/3’s vote – Parcel Tax – Assessment Districts
Increase in Electric Utility transfer • Charter mandates 25% unless City Council reduces amount • Currently at 10% of electric revenues
Slide 47
195 of 232

Budget Hearing
City of Glendale Budget Hearing May 24, 2016
196 of 232

Slide 2
FY 2016-17 Proposed Budget Agenda
General Fund Proposed Budget
Summary of All Funds
Citywide Organizational Profile
Fee Discussion
Questions & Comments
197 of 232

FY 2016-17 General Fund Proposed Budget
198 of 232

Slide 4
Starting Revenue Estimate: $ 187,143,560
Adjustments:
Property Tax/VLF Backfill $ 4,852,500
Sales Tax 1,508,000
Utility Users Tax 495,000
Occupancy/Franchise 750,000
Building Permits & Licenses 598,000
Cost Allocation (755,780)
GRA Loan Repayment* (920,953)
All Other Revenues (net) (812,800) $ 5,713,967
FY 2016-17 Revenue Estimate: $ 192,857,527
Use of Assigned Econ Dev Fund Balance $ 920,013
Use of Unassigned General Fund- Fund Balance $ 1,003,123
FY 2016-17 Proposed Resources: $ 194,780,663
FY 2016-17 General Fund Proposed Budget Proposed Resources
*Depending on CA Department of Finance payment 199 of 232

Slide 5
Starting Budget $ 182,890,934
Salaries & Benefits Increase
Salaries $ 1,730,038
PERS, Net of Cost Share 2,327,775
Hourly Wages-Less Econ Dev 546,439
Overtime 112,896
All Other Benefits (Medical, Dental, Vision, Work’ Comp, etc.) 120,488
Total Salaries & Benefits Increase $ 4,837,636
Use of Assigned Econ Dev Fund Balance-Hourly Wages & Benefits $ 723,960 $ 5,561,596
Maintenance & Operation Increase / (Decrease)
Liability Insurance (605,541)
Fleet/Equipment Rental Charge (140,904)
ISD Service Charge 825,579
All Other M&O 5,146,060
Total Maintenance & Operations Increase $ 5,225,194
Use of Assigned Econ Dev Fund Balance-Contractual Services $ 196,053 $ 5,421,247
Transfers Out/Capital Outlay $ 906,886
Proposed FY 2016-17 General Fund Budget $ 193,860,650
Use of Assigned Econ Dev Fund Balance $ 920,013
Total Proposed FY 2016-17 General Fund Budget $ 194,780,663
FY 2016-17 General Fund Proposed Budget Proposed Appropriations
200 of 232

Slide 6
Salaries & Benefits total increase of $5.6 million compared to $5.2 million last year
• $700 thousand net cost for Cost of Living Adjustments for GMA (3%), GCEA (3%)
– Offset by an increase of 1% in PERS cost share
• Net PERS increase of $2.3 million compared to $3.0 million last year
• Workers’ Comp increase of $270 thousand
– Fund Balance deficit is $14.4 million as of June 30, 2015
– Will be amortized over next 5 years
• $1.7 million in increase for program restoration in personnel costs
• $724 thousand is for Economic Development Hourly Wages and Benefits using Assigned Fund Balance
FY 2016-17 General Fund Proposed Budget Salaries & Benefit Changes
201 of 232

Slide 7
Maintenance & Operation increase by $5.4 million
• $2.5 million increase due to Building Maintenance costs shifting to Maintenance & Operation offset by Salaries and Benefits decreases
• $1.1 million increase in Economic Development Shifting to the General Fund
• $825 thousand increase in ISD Service Charge
• $711 thousand increase in Program Restoration
• $179 thousand increase due to adjustments in the Elections budget
• $100 thousand increase due to Maintenance of Graphics Printers
FY 2016-17 General Fund Proposed Budget Maintenance & Operation Changes
202 of 232

Slide 8
Transfers and Capital Outlay increase by $907 thousand primarily due to the following:
• $1.1 million increase to Capital Improvement primarily for Street Improvement Projects
• $300 thousand increase in transfer for Certificates of Participation (COP’s)
• $300 thousand decrease in transfer to Economic Development
• $184 thousand decrease to Low & Moderate Income Housing Fund for the 20% of the GSA Loan Repayment
• $35 thousand decrease in Capital Outlay
• $14 thousand increase for Nutritional Meals
FY 2016-17 General Fund Proposed Budget Transfers Out/Capital Outlay
203 of 232
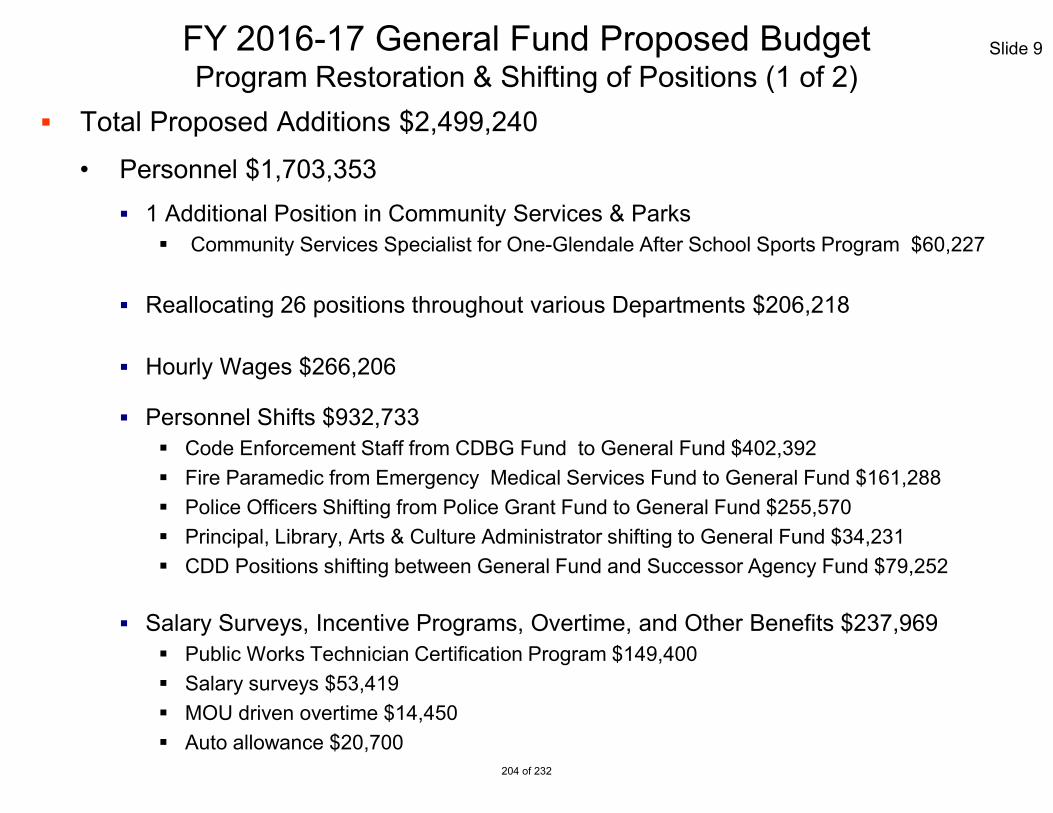
Slide 9
Total Proposed Additions $2,499,240
• Personnel $1,703,353 1 Additional Position in Community Services & Parks
Community Services Specialist for One-Glendale After School Sports Program $60,227 Reallocating 26 positions throughout various Departments $206,218 Hourly Wages $266,206
Personnel Shifts $932,733 Code Enforcement Staff from CDBG Fund to General Fund $402,392 Fire Paramedic from Emergency Medical Services Fund to General Fund $161,288 Police Officers Shifting from Police Grant Fund to General Fund $255,570 Principal, Library, Arts & Culture Administrator shifting to General Fund $34,231 CDD Positions shifting between General Fund and Successor Agency Fund $79,252
Salary Surveys, Incentive Programs, Overtime, and Other Benefits $237,969 Public Works Technician Certification Program $149,400 Salary surveys $53,419 MOU driven overtime $14,450 Auto allowance $20,700
FY 2016-17 General Fund Proposed Budget Program Restoration & Shifting of Positions (1 of 2)
204 of 232

Slide 10
• Maintenance & Operation, and Transfers-Out $795,887
Community Development Department Revised Code Books $20,000
Community Services & Parks Students as Role Models Program (STAR) After School Program $3,000 Transfer to Nutritional Meals Fund $84,577 One-Glendale After School Sports Program $157,131
Fire
Inspection Code Books $20,000 SCBA Bottle Replacement Program $53,955 Verdugo Dispatch Services $83,140 Hose, Valves, Thermal Imagers for Two Fire Engines $260,084 Emergency Supply Kit Replacement $59,000
Public Works
Fairmont Bridge Crash Cushion Repair & Maintenance $15,000 Traffic Safety Control Paint $40,000
FY 2016-17 General Fund Proposed Budget Program Restoration & Shifting of Positions (2 of 2)
205 of 232

Slide 11
Revenues & Use of Assigned Fund Balance: $ 193,777,540
Appropriations: 194,780,663 Surplus/(Deficit): $ (1,003,123)
FY 2016-17 General Fund Proposed Budget
206 of 232

Slide 12 FY 2016-17 General Fund Proposed Budget Unassigned Fund Balance Projection
Unassigned & Charter Reserve
Projected Beginning Balance, 7/1/2016 $ 65,328,000
Projected Net Surplus/(Deficit) (1,003,123)
Projected Ending Fund Balance, 6/30/2017 $ 64,324,877
Projected Reserve Percentage* 33.2%
* Based on proposed recurring appropriation of $193.9 million. Current policy is floor of 30% with a target of 35%.
207 of 232

FY 2016-17 General Fund Forecast Slide 13
Adopted FY 15-16 FY 16-17 FY 17-18 FY 18-19 FY 19-20 FY 20-21 FY 21-22
Resources: $ 185.7 $ 192.9 $ 200.5 $ 206.6 $ 212.3 $ 217.6 $ 223.2
Assigned Fund Balance – Econ Dev - 0.9 0.7 0.7 - - -
Total Projected Resources: $ 185.7 $ 193.8 $ 201.2 $ 207.3 $ 212.3 $ 217.6 $ 223.2
Appropriations:
Base Line $ 122.8 $ 124.6 $ 126.9 $ 128.3 $ 129.2 $ 130.2 $ 130.9
PERS 25.9 28.7 31.5 34.0 36.6 37.3 38.3
PERS Cost Share (2.8) (3.3) (3.3) (3.3) (3.4) (3.4) (3.4)
PERS Net of Cost Share: $ 23.1 $ 25.4 $ 28.2 $ 30.7 $ 33.2 $ 33.9 $ 34.9
CIP 0.5 1.6 0.7 0.9 1.9 3.0 3.5
ISF’s 36.0 41.5 43.5 44.9 46.5 47.5 48.4
COP’s 0.5 0.8 0.8 1.0 1.0 1.0 1.0
Assigned Fund Balance – Econ Dev - 0.9 0.7 0.7 - - -
Total Appropriations $ 182.9 $ 194.8 $ 200.8 $ 206.5 $ 211.8 $ 215.6 $ 218.7
Net Surplus/(Deficit) $ 2.8 $ (1.0) $ 0.4 $ 0.8 $ 0.5 $ 2.0 $ 4.5
Budget Adjustments as of 3/31/16 (2.2) - - - - - -
Revenue Adjustments as of 3/31/16 1.5 - - - - - -
Est. Savings 0.3 - - - - - -
Net Surplus/(Deficit) $ 2.4 $ (1.0) $ 0.4 $ 0.8 $ 0.5 $ 2.0 $ 4.5
208 of 232

FY 2016-17 Proposed Budget Summary of All Funds
209 of 232

Slide 15 Summary of Appropriations All Funds
Fund Type Adopted
FY 2015-16 Proposed FY
2016-17 Increase/
(Decrease) %
Change General Fund $ 182,890,934 $ 194,780,663 $ 11,889,729 6.5%
Special Revenue Funds 103,702,342 100,630,978 (3,071,364) (3.0%)
Debt Service Funds 3,025,000 3,010,000 (15,000) (0.5%)
Capital Improvement Funds 13,755,000 25,362,000 11,607,000 84.4%
Enterprise Funds 390,966,533 385,917,075 (5,049,458) (1.3%)
Internal Service Funds 103,489,784 109,832,418 6,342,634 6.1%
All Funds – Grand Total $ 797,829,593 $ 819,533,134 $ 21,703,541 2.7%
210 of 232

Slide 16 Summary of Appropriations General Fund (1 of 2)
Department Adopted
FY 2015-16 Proposed
FY 2016-17 Increase / (Decrease)
% Change
Administrative Services $ 5,501,035 $ 5,341,567 $ (159,468) (2.9%)
City Attorney 3,190,013 3,548,439 358,426 11.2%
City Clerk 1,054,463 1,349,630 295,167 28.0%
City Treasurer 665,123 742,164 77,041 11.6%
Community Development 9,845,834 14,943,660 5,097,826 51.8%
Community Services & Parks 10,499,841 12,631,020 2,131,179 20.3%
Fire 45,027,061 48,702,523 3,675,462 8.16%
Human Resources 2,660,726 2,654,861 (5,865) (0.2%)
Library, Arts & Culture 8,488,883 9,594,695 1,105,812 13.0%
211 of 232

Slide 17 Summary of Appropriations General Fund (2 of 2)
Department Adopted
FY 2015-16 Proposed
FY 2016-17 Increase / (Decrease)
% Change
Management Services $ 3,869,062 $ 4,392,282 $ 523,220 13.5%
Police 70,301,071 72,730,666 2,429,595 3.5%
Public Works 17,964,870 14,184,318 (3,780,552) (21.0%)
Transfers 2,125,441 3,067,327 941,886 44.3%
Retirement Incentive 897,511 897,511 - -
Non-Departmental 800,000 - (800,000) (100.0%)
General Fund Total $ 182,890,934 $ 194,780,663 $ 11,889,729 6.5%
212 of 232

Slide 18 Summary of Appropriations Special Revenue Funds (1 of 3)
Fund Adopted
FY 2015-16 Proposed
FY 2016-17 Increase / (Decrease)
% Change
201-CDBG Fund $ 1,580,061 $ 1,643,605 $ 63,544 4.0%
202-Housing Assistance Fund 30,442,939 32,780,950 2,338,011 7.7%
203-Home Grant Fund 1,140,638 1,196,718 56,080 4.9% 204-Continuum of Care Grant Fund 2,345,059 2,319,804 (25,255) (1.1%)
205-Emergency Solutions Grant Fund 161,426 142,237 (19,189) (11.9%) 206-Workforce Investment Act Fund 5,217,216 5,505,000 287,784 5.5% 210-Urban Art Fund 248,309 235,000 (13,309) (5.4%) 211-Glendale Youth Alliance Fund 1,537,696 1,905,519 367,823 23.9% 212-BEGIN Homeownership Fund 88,800 89,520 720 0.8% 213-Low&Mod Income Hsg Asset Fund 402,059 370,658 (31,401) (7.8%)
*Funds 501,510 & 520 moved to Special Revenue Funds from Enterprise Funds in FY 15/16 213 of 232
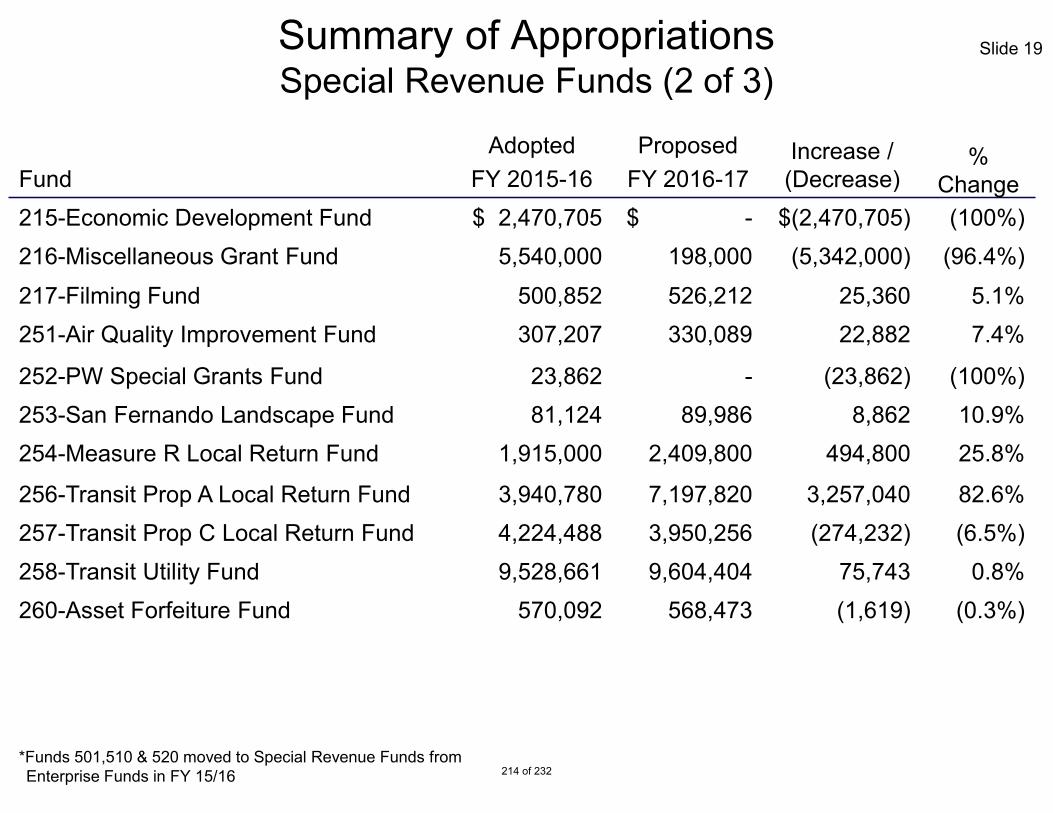
Slide 19 Summary of Appropriations Special Revenue Funds (2 of 3)
Fund Adopted
FY 2015-16 Proposed
FY 2016-17 Increase / (Decrease)
% Change
215-Economic Development Fund $ 2,470,705 $ - $(2,470,705) (100%) 216-Miscellaneous Grant Fund 5,540,000 198,000 (5,342,000) (96.4%)
217-Filming Fund 500,852 526,212 25,360 5.1% 251-Air Quality Improvement Fund 307,207 330,089 22,882 7.4%
252-PW Special Grants Fund 23,862 - (23,862) (100%) 253-San Fernando Landscape Fund 81,124 89,986 8,862 10.9% 254-Measure R Local Return Fund 1,915,000 2,409,800 494,800 25.8%
256-Transit Prop A Local Return Fund 3,940,780 7,197,820 3,257,040 82.6% 257-Transit Prop C Local Return Fund 4,224,488 3,950,256 (274,232) (6.5%) 258-Transit Utility Fund 9,528,661 9,604,404 75,743 0.8% 260-Asset Forfeiture Fund 570,092 568,473 (1,619) (0.3%)
*Funds 501,510 & 520 moved to Special Revenue Funds from Enterprise Funds in FY 15/16 214 of 232

Slide 20 Summary of Appropriations Special Revenue Funds (3 of 3)
Fund Adopted
FY 2015-16 Proposed
FY 2016-17 Increase / (Decrease)
% Change
261-Police Special Grants Fund $ 934,125 $ 363,528 $ (570,597) (61.1%) 262-Supplemental Law Enforcement 405,801 397,501 (8,300) (2.0%) 266-Fire Mutual Aid Fund 199,967 250,000 50,033 25.0% 267-Special Events Fund 370,222 307,485 (62,737) (16.9%) 270-Nutritional Meals Grant Fund 429,740 430,827 1,087 0.3% 275-Library Fund 322,226 245,214 (77,012) (23.9%) 290-Electric Public Benefit Fund 6,420,598 7,711,563 1,290,965 20.1% 501-Recreation Fund* 5,148,421 3,579,584 (1,568,837) (30.5%) 510-Hazardous Disposal Fund* 1,529,863 1,534,266 4,403 0.3% 511-Emergency Medical Services Fund 5,464,093 5,917,304 453,211 8.3% 520-Parking Fund* 10,210,312 8,829,655 (1,380,657) (13.5%)
Special Revenue Total $103,702,342 $100,630,978 $(3,071,364) (3.0%)
*Funds 501,510 & 520 moved to Special Revenue Funds from Enterprise Funds in FY 15/16 215 of 232

Slide 21 Summary of Appropriations Debt Service Funds
Fund Adopted
FY 2015-16 Proposed
FY 2016-17 Increase / (Decrease)
% Change
303-Police Building Project Fund $ 3,025,000 $ 3,010,000 $ (15,000) (0.5%)
Debt Service Total $ 3,025,000 $ 3,010,000 $ (15,000) (0.5%)
216 of 232

Slide 22 Summary of Appropriations Capital Improvement Funds
Fund Adopted
FY 2015-16 Proposed
FY 2016-17 Increase / (Decrease)
% Change
Fund 401 Capital Improvement (GF) Community Services & Parks $ 1,575,000 $ 1,400,000 $ (175,000) (11.1%) Fire 35,000 551,000 516,000 1,474.3% Library, Arts & Culture 950,000 350,000 (600,000) (63.2%)
Public Works 815,000 2,479,000 1,664,000 204.2% Transfers (Scholl Canyon) 2,000,000 2,000,000 - - Total Fund 401 Capital Improvement $ 5,375,000 $ 6,780,000 $ 1,405,000 26.1% 402-State Gas Tax Fund 4,380,000 1,854,000 (2,526,000) (57.7%) 405-Parks Mitigation Fee Fund 4,000,000 16,173,000 12,173,000 304.3% 407-Library Mitigation Fee Fund - 555,000 555,000 100%
Total Capital Improvement Funds $ 13,755,000 $ 25,362,000 $ 11,607,000 84.4%
217 of 232

Slide 23 Summary of Appropriations Enterprise Funds
Fund Adopted
FY 2015-16 Proposed
FY 2016-17 Increase / (Decrease)
% Change
525-Sewer Fund $ 34,059,747 $ 30,480,999 $ (3,578,748) (10.5%) 530-Refuse Disposal Fund 25,706,964 24,657,570 (1,049,394) (4.1%)
552-Electric Works Revenue Fund 233,543,262 251,103,371 17,560,109 7.5% 553-Electric Depreciation Fund 28,565,238 15,768,182 (12,797,056) (44.8%) 555-Electric Customer Paid Fund 2,854,422 1,894,751 (959,671) (33.6%) 572-Water Works Revenue Fund 49,350,121 51,977,680 2,627,559 5.3% 573-Water Depreciation Fund 11,452,736 4,222,618 (7,230,118) (63.1%) 575-Water Customer Paid Fund 1,610,567 1,469,640 (140,927) (8.8%) 701-Fire Communication Fund 3,823,476 4,342,264 518,788 13.6%
Enterprise Total $ 390,966,533 $ 385,917,075 $ (5,049,458) (1.3%)
218 of 232

Slide 24 Summary of Appropriations Internal Service Funds (1 of 2)
Fund Adopted
FY 2015-16 Proposed
FY 2016-17 Increase / (Decrease)
% Change
601-Fleet / Equipment Mgmt Fund $ 14,725,214 $ 16,023,658 $ 1,298,444 8.8%
602-Joint Helicopter Operation Fund 1,475,259 1,626,652 151,393 10.3%
603-ISD Infrastructure Fund 8,236,590 7,773,035 (463,555) (5.6%)
604-ISD Applications Fund 12,558,297 6,498,261 (6,060,036) (48.3%)
607-Building Maintenance Fund - 7,472,899 7,472,899 100%
610-Unemployment Insurance Fund 314,790 78,243 (236,547) (75.1%)
612-Liability Insurance Fund 7,961,959 8,632,422 670,463 8.4%
614-Compensation Insurance Fund 12,220,632 12,928,223 707,591 5.8%
615-Dental Insurance Fund 1,571,908 1,655,291 83,383 5.3%
219 of 232

Slide 25 Summary of Appropriations Internal Service Funds (2 of 2)
Fund Adopted
FY 2015-16 Proposed
FY 2016-17 Increase / (Decrease)
% Change
616-Medical Insurance Fund $ 27,364,869 $ 35,101,482 $ 7,736,613 28.3%
617-Vision Insurance Fund 276,736 294,568 17,832 6.4%
640-Employee Benefits Fund 3,390,800 4,317,791 926,991 27.3%
641-RHSP Benefits Fund 1,723,039 2,017,690 294,651 17.1%
642-Post Employment Benefits Fund 7,850,310 2,220,175 (5,630,135) (71.7%) 660-ISD Wireless Fund 3,819,381 3,192,028 (627,353) (16.4%)
Internal Service Total $ 103,489,784 $ 109,832,418 $ 6,342,634 6.1%
220 of 232

Slide 26 Summary of Appropriations-Recap All Funds
Fund Type Adopted
FY 2015-16 Proposed FY
2016-17 Increase/
(Decrease) %
Change General Fund $ 182,890,934 $ 194,780,663 $ 11,889,729 6.5%
Special Revenue Funds 103,702,342 100,630,978 (3,071,364) (3.0%)
Debt Service Funds 3,025,000 3,010,000 (15,000) (0.5%)
Capital Improvement Funds 13,755,000 25,362,000 11,607,000 84.4%
Enterprise Funds 390,966,533 385,917,075 (5,049,458) (1.3%)
Internal Service Funds 103,489,784 109,832,418 6,342,634 6.1%
All Funds – Grand Total $ 797,829,593 $ 819,533,134 $ 21,703,541 2.7%
221 of 232

Slide 27
Authorized Full-Time Positions
*Includes General Fund & GWP Balancing Strategies
Fiscal Year
Authorized Positions
2005-06 1,995
2006-07 1,974
2007-08 1,986
2008-09 1,942
2009-10 1,904
2010-11 1,899
2011-12 1,873
2012-13 1,605*
2013-14 1,588
2014-15 1,520
2015-16 1,575
2016-17 Proposed 1,579
222 of 232

Salaries & Benefits Summary
Position Reductions Citywide (In Thousands)
Actuals
FY 11-12 Actuals
FY 12-13 Actuals
FY 13-14 Actuals
FY 14-15
Est.
Actuals
FY15-16*
Proposed
Budget
FY16-17
Authorized Full-Time Positions 1,873 1,605 1,588 1,520 1,575 1,579
% Change (1.4)% (14.3)% (1.1)% (4.3)% 3.6% 0.3%
Filled Positions 1,673 1,488 1,504 1,429 1,436 1,436
% Change (2.8)% (11.1)% 1.1% (5.0)% 0.5% -
Salaries and Benefits (Actuals)
Total Salaries $ 166,739 $ 152,752 $ 153,241 $ 152,495 $ 155,022 $ 164,212
PERS Retirement 30,402 28,413 28,598 30,015 34,728 42,863
PERS Cost-share (3,229) (3,056) (3,442) (2,586) (2,794) (5,552)
PERS Net Cost $ 27,173 $ 25,357 $ 25,156 $ 27,429 $ 31,934 $ 37,311
All Other Benefits 42,329 38,387 37,886 40,489 41,939 40,211
Total Benefits $ 69,502 $ 63,744 $ 63,042 $ 67,918 $ 73,873 $ 77,522
Total Salaries & Ben. $ 236,241 $ 216,496 $ 216,283 $ 220,413 $ 228,895 $ 241,734
% Change 2.0% (8.4)% (0.1)% 1.9% 3.8% 5.6%
* FY 15-16 amounts reflect estimated actuals as of June 30, 2016
Slide 28
Position Reductions in Incentive Years
FY 12-13 PARS Retirement Incentive 150
FY 14-15 Separation/Retirement Incentive 86
Position Eliminations & Layoffs 140
Total Position Reductions in Incentive Years: 376
Estimated Incentives Cost & Savings
5-Year Est. Cost: $ (14,200)
5-Year Est. Savings: 65,223
Est. Net Savings of Incentives: $ 51,023
223 of 232
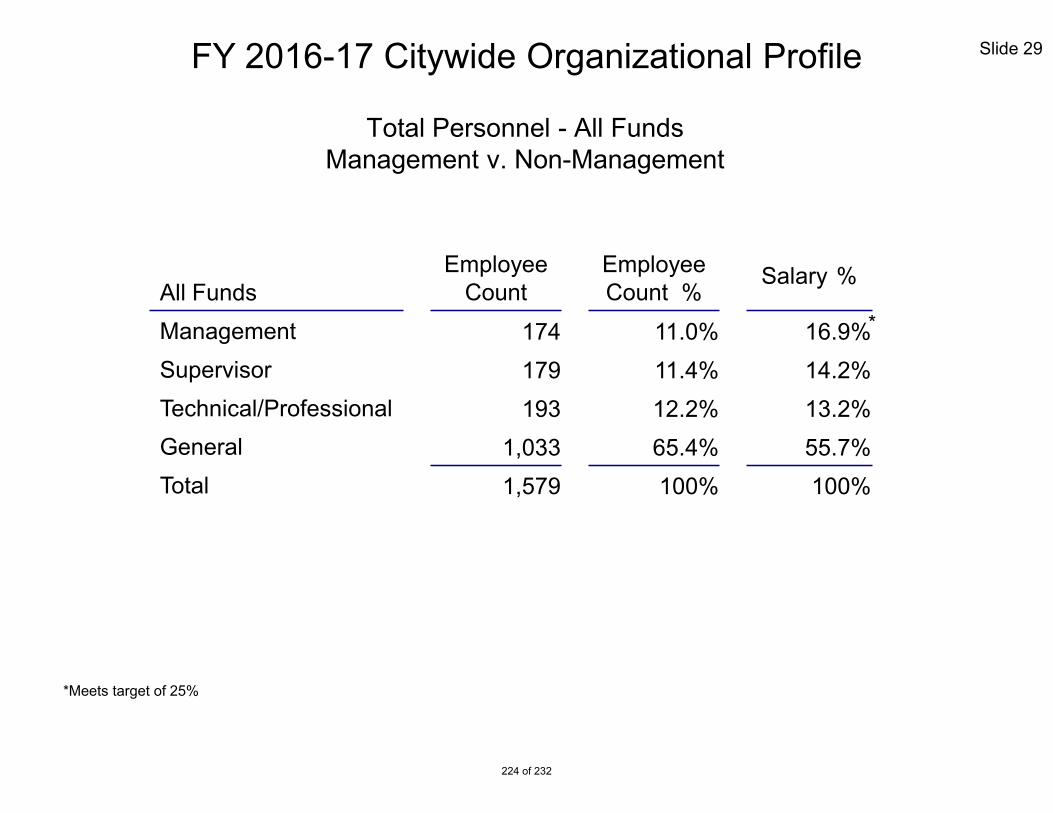
Slide 29
Total Personnel - All Funds Management v. Non-Management
All Funds Employee
Count Employee Count %
Salary %
Management 174 11.0% 16.9% Supervisor 179 11.4% 14.2% Technical/Professional 193 12.2% 13.2% General 1,033 65.4% 55.7% Total 1,579 100% 100%
*Meets target of 25%
FY 2016-17 Citywide Organizational Profile
*
224 of 232

Slide 30
Total Personnel –General Fund Management v. Non-Management
General Fund Employee
Count Employee Count %
Salary
%
Management 104.8 12.1% 17.6% Supervisor 109.9 12.7% 15.7% Technical/Professional 91.5 10.6% 10.6% General 559.9 64.6% 56.1% Total 866.1 100% 100%
FY 2016-17 Citywide Organizational Profile
225 of 232

Slide 31
Total Personnel – Non-General Fund Management v. Non-Management
Non-General Fund Employee
Count Employee Count %
Salary
%
Management 69.2 9.7% 16.0% Supervisor 69.1 9.7% 12.0% Technical/Professional 101. 5 14.2% 17.0% General 473.1 66.4% 55.0% Total 712.9 100% 100%
FY 2016-17 Citywide Organizational Profile
226 of 232
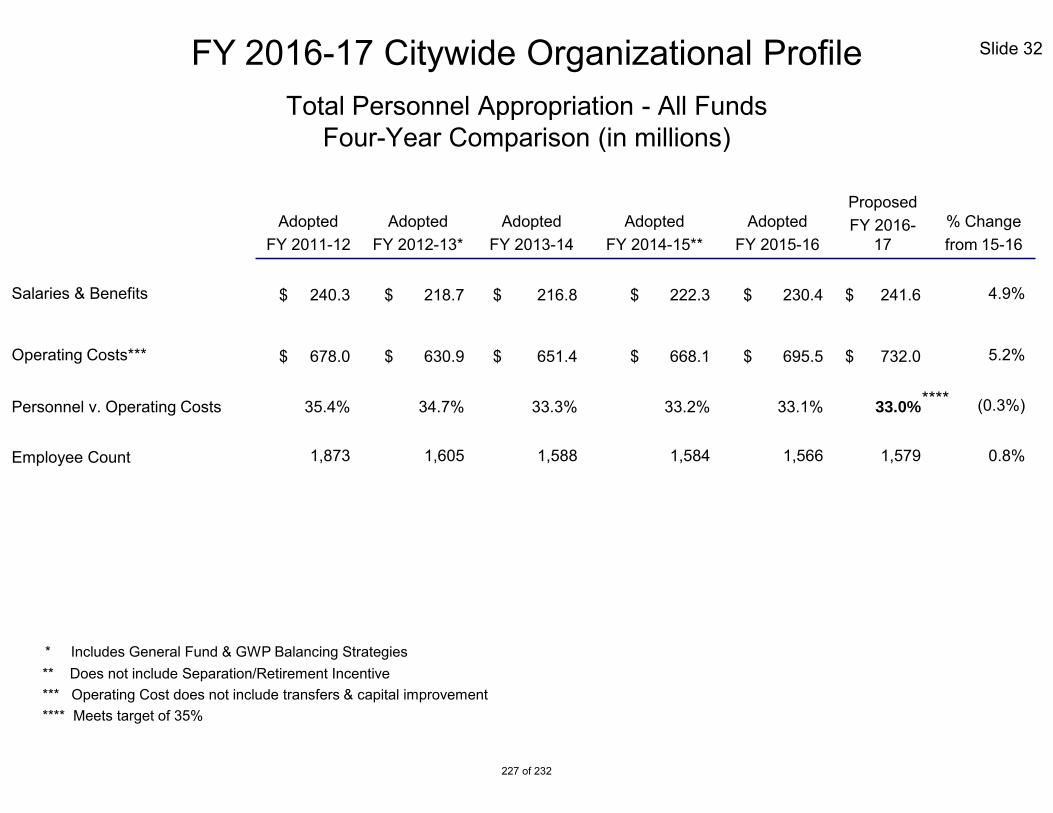
Slide 32
Total Personnel Appropriation - All Funds Four-Year Comparison (in millions)
FY 2016-17 Citywide Organizational Profile
* Includes General Fund & GWP Balancing Strategies ** Does not include Separation/Retirement Incentive *** Operating Cost does not include transfers & capital improvement **** Meets target of 35%
Adopted FY 2011-12
Adopted FY 2012-13*
Adopted FY 2013-14
Adopted FY 2014-15**
Adopted FY 2015-16
Proposed FY 2016-
17 % Change from 15-16
Salaries & Benefits $ 240.3 $ 218.7 $ 216.8 $ 222.3 $ 230.4 $ 241.6 4.9%
Operating Costs*** $ 678.0 $ 630.9 $ 651.4 $ 668.1 $ 695.5 $ 732.0 5.2%
Personnel v. Operating Costs 35.4% 34.7% 33.3% 33.2% 33.1% 33.0% (0.3%)
Employee Count 1,873 1,605 1,588 1,584 1,566 1,579 0.8%
****
227 of 232

Slide 33
Total Personnel Appropriation - General Fund Four-Year Comparison (in millions)
FY 2016-17 Citywide Organizational Profile
Adopted FY 2011-12
Adopted FY 2012-13*
Adopted FY 2013-14
Adopted FY 2014-15**
Adopted FY 2015-16
Proposed FY 2016-17
% Change from 15-16
Salaries & Benefits $ 142.2 $ 131.4 $ 134.2 $ 136.9 $ 142.2 $ 147.7 3.9%
Maintenance & Operation / ISF Charges
32.7 33.4 35.8 38.9 38.6 44.1 14.2%
Capital Outlay 0.1 0.2 0.3 0.2 0.04 - (100.0%)
Cost Savings Target (7.7) (0.6) - - - - -
Annual Appropriations (not including transfers)
$ 167.2 $ 164.4 $ 170.3 $ 176.0 $ 180.8 $ 191.8 6.1%
Personnel v. M&O 85.0% 79.9% 78.8% 77.8% 78.7% 77.0% (2.1%)
Employee Count 998 896 905 890 882 866 (1.8%)
***
* Includes General Fund & GWP Balancing Strategies ** Does not include Separation/Retirement Incentive *** Does not meet target of 75%
228 of 232

FY 2016-17 Proposed Budget Fee Discussion
229 of 232
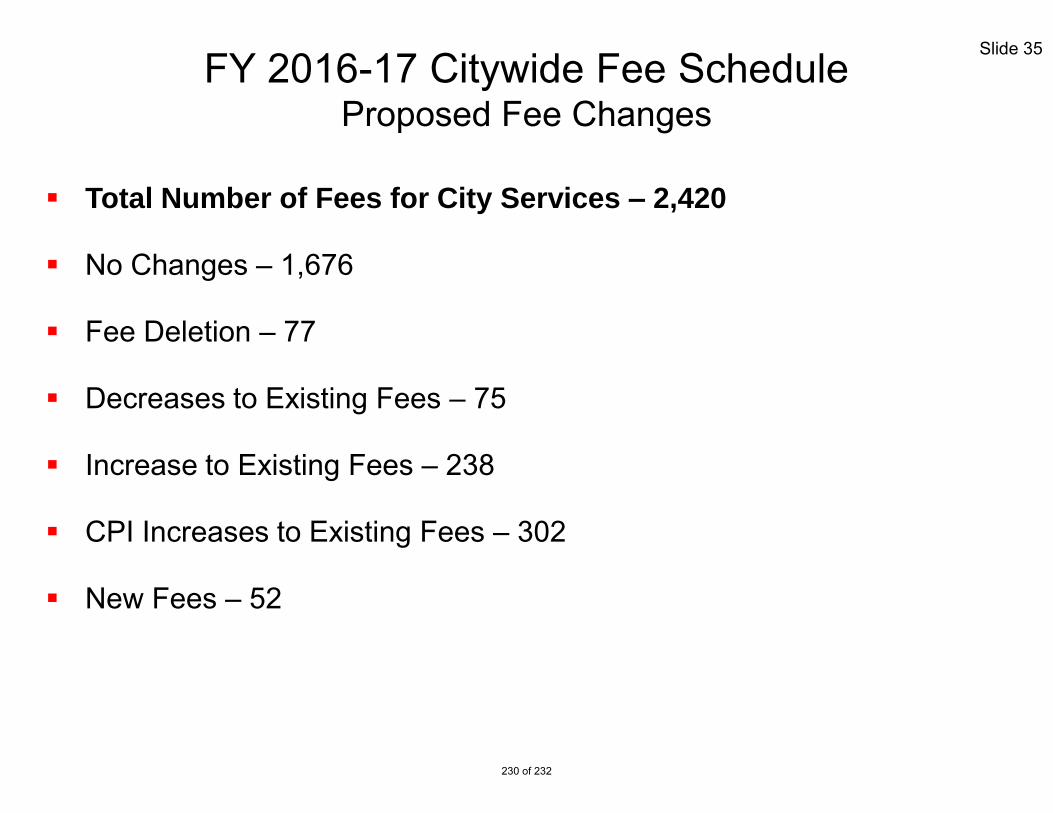
Slide 35
Total Number of Fees for City Services – 2,420
No Changes – 1,676
Fee Deletion – 77
Decreases to Existing Fees – 75
Increase to Existing Fees – 238
CPI Increases to Existing Fees – 302
New Fees – 52
FY 2016-17 Citywide Fee Schedule Proposed Fee Changes
230 of 232

Slide 36 Fee Options for Council Consideration CDD - Planning Fees
Fee Title
Total Current
Fee* FY 2016-17 Fee Options
Cost Recovery
Rate
Revised Proposed
Fee** Historic Preservation Process a Mills Act Request
$1,479.75 $7,681.08 $5,760.81 $3,840.54 $1,920.27
100% 75% 50% 25%
$7,000.00
- Page 60, Fee #56 * Total Current Fee includes Technology Surcharge for 2015-16, also zoning surcharge applies ** The original proposed fee was $1,300
Owners’ Average tax savings per property per year: $7,382
Owners’ Median tax savings: $6,776
City’s average tax loss revenues per property per year: $1,010
Average Percent of Tax Break: 54%
Median Percent of Tax Break: 58%
231 of 232

Slide 37 Comparison with Nearby Jurisdictions Mills Act Fees
City SFR MR/Comm.
/Ind. Fee Basis Los Angeles (i) $250.00 $1,142.00 Designation fully subsidized; Mills Act partially
subsidized (though actual cost to owner may increase per note below)
Pasadena (ii) $1,072.50 $2,145.00 Designation fully subsidized; Mills Act appears partially subsidized (info pending)
South Pasadena $1,115.00 $1,115.00 For Mills Act, figure reflects staff time recapture (per So. Pas. Staff, preservation commission does most of work). Plus $615 Designation fee.
West Hollywood $798.00 $798.00 Designation fully subsidized; Mills Act partially subsidized
Santa Monica (iii) N/A N/A No Fee Long Beach Varies:
$1,103.93 per unit
Varies: $1,103.93
per unit
Fees are partially subsidized per city staff; Plus $83.07 pre-app. Fee, $218.60 annual inspection fee & $912.66 Designation fee.
i - LA Mills Act cost increases for properties priced over the City’s $1.5 million valuation threshold, which also required submission of a costly Historic Structure Report. ii -Pasadena subsidizes designation by waiving the fee; the full cost recovery value for designation is calculated at $3,558 iii - No Fee
232 of 232