fx mar13 presentation
DESCRIPTION
TRANSCRIPT

1
A Unique Play on the Strong European Gas Market
March 2013
POLAND
NASDAQ: FXEN 2
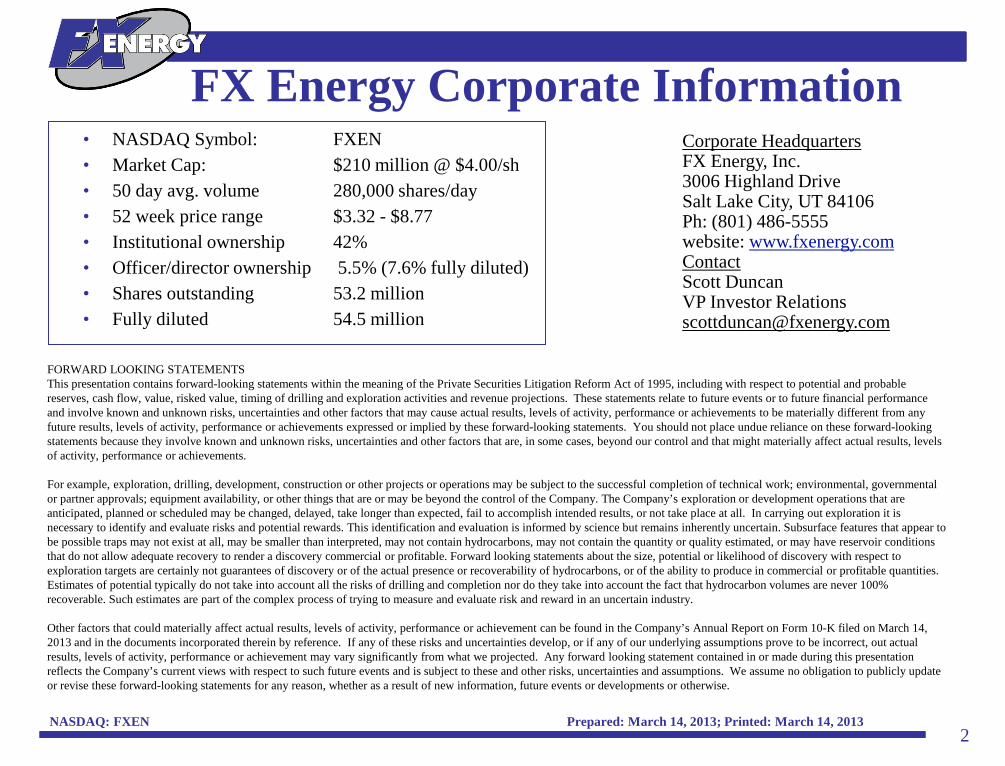
Corporate Headquarters FX Energy, Inc. 3006 Highland Drive Salt Lake City, UT 84106 Ph: (801) 486-5555 website: www.fxenergy.com Contact Scott Duncan VP Investor Relations [email protected]
• NASDAQ Symbol: FXEN • Market Cap: $210 million @ $4.00/sh • 50 day avg. volume 280,000 shares/day • 52 week price range $3.32 - $8.77 • Institutional ownership 42% • Officer/director ownership 5.5% (7.6% fully diluted) • Shares outstanding 53.2 million • Fully diluted 54.5 million
FORWARD LOOKING STATEMENTS This presentation contains forward-looking statements within the meaning of the Private Securities Litigation Reform Act of 1995, including with respect to potential and probable reserves, cash flow, value, risked value, timing of drilling and exploration activities and revenue projections. These statements relate to future events or to future financial performance and involve known and unknown risks, uncertainties and other factors that may cause actual results, levels of activity, performance or achievements to be materially different from any future results, levels of activity, performance or achievements expressed or implied by these forward-looking statements. You should not place undue reliance on these forward-looking statements because they involve known and unknown risks, uncertainties and other factors that are, in some cases, beyond our control and that might materially affect actual results, levels of activity, performance or achievements. For example, exploration, drilling, development, construction or other projects or operations may be subject to the successful completion of technical work; environmental, governmental or partner approvals; equipment availability, or other things that are or may be beyond the control of the Company. The Company’s exploration or development operations that are anticipated, planned or scheduled may be changed, delayed, take longer than expected, fail to accomplish intended results, or not take place at all. In carrying out exploration it is necessary to identify and evaluate risks and potential rewards. This identification and evaluation is informed by science but remains inherently uncertain. Subsurface features that appear to be possible traps may not exist at all, may be smaller than interpreted, may not contain hydrocarbons, may not contain the quantity or quality estimated, or may have reservoir conditions that do not allow adequate recovery to render a discovery commercial or profitable. Forward looking statements about the size, potential or likelihood of discovery with respect to exploration targets are certainly not guarantees of discovery or of the actual presence or recoverability of hydrocarbons, or of the ability to produce in commercial or profitable quantities. Estimates of potential typically do not take into account all the risks of drilling and completion nor do they take into account the fact that hydrocarbon volumes are never 100% recoverable. Such estimates are part of the complex process of trying to measure and evaluate risk and reward in an uncertain industry. Other factors that could materially affect actual results, levels of activity, performance or achievement can be found in the Company’s Annual Report on Form 10-K filed on March 14, 2013 and in the documents incorporated therein by reference. If any of these risks and uncertainties develop, or if any of our underlying assumptions prove to be incorrect, out actual results, levels of activity, performance or achievement may vary significantly from what we projected. Any forward looking statement contained in or made during this presentation reflects the Company’s current views with respect to such future events and is subject to these and other risks, uncertainties and assumptions. We assume no obligation to publicly update or revise these forward-looking statements for any reason, whether as a result of new information, future events or developments or otherwise.
FX Energy Corporate Information
Prepared: March 14, 2013; Printed: March 14, 2013
NASDAQ: FXEN
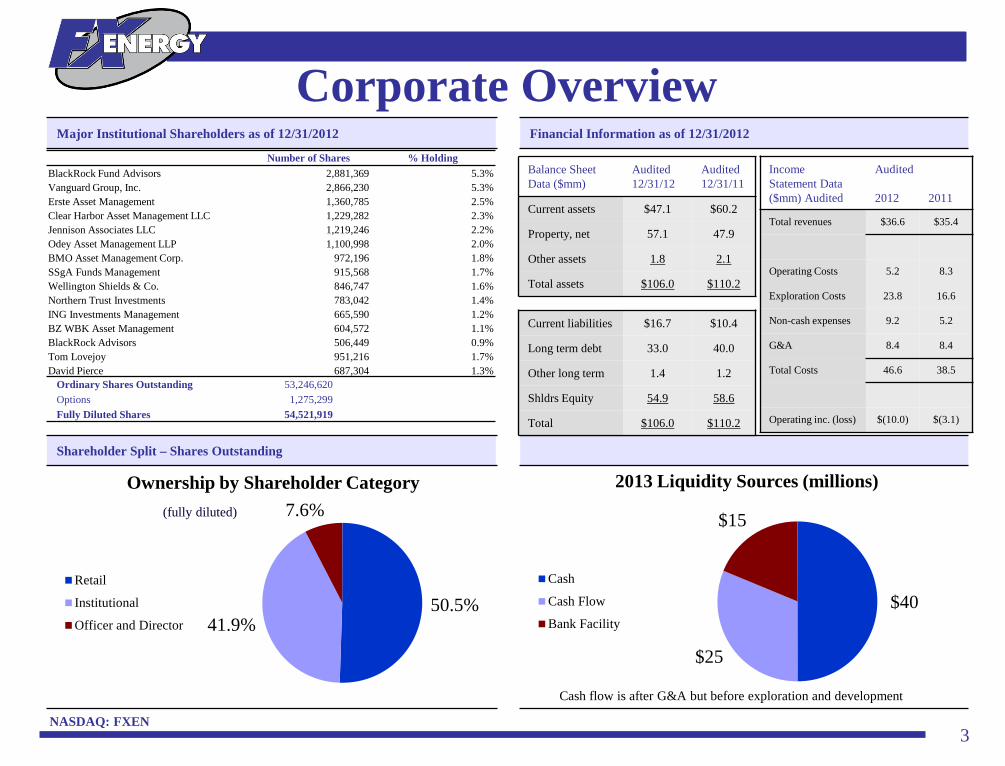
Major Institutional Shareholders as of 12/31/2012 Financial Information as of 12/31/2012
Shareholder Split – Shares Outstanding
Number of Shares % Holding BlackRock Fund Advisors 2,881,369 5.3% Vanguard Group, Inc. 2,866,230 5.3% Erste Asset Management 1,360,785 2.5% Clear Harbor Asset Management LLC 1,229,282 2.3% Jennison Associates LLC 1,219,246 2.2% Odey Asset Management LLP 1,100,998 2.0% BMO Asset Management Corp. 972,196 1.8% SSgA Funds Management 915,568 1.7% Wellington Shields & Co. 846,747 1.6% Northern Trust Investments 783,042 1.4% ING Investments Management 665,590 1.2% BZ WBK Asset Management 604,572 1.1% BlackRock Advisors 506,449 0.9% Tom Lovejoy 951,216 1.7% David Pierce 687,304 1.3%
Ordinary Shares Outstanding 53,246,620 Options 1,275,299 Fully Diluted Shares 54,521,919
3
Corporate Overview Balance Sheet Data ($mm)
Audited 12/31/12
Audited 12/31/11
Current assets $47.1 $60.2
Property, net 57.1 47.9
Other assets 1.8 2.1
Total assets $106.0 $110.2
Current liabilities $16.7 $10.4
Long term debt 33.0 40.0
Other long term 1.4 1.2
Shldrs Equity 54.9 58.6
Total $106.0 $110.2
Income Statement Data ($mm) Audited
Audited
2012 2011
Total revenues $36.6 $35.4
Operating Costs 5.2 8.3
Exploration Costs 23.8 16.6
Non-cash expenses 9.2 5.2
G&A 8.4 8.4
Total Costs 46.6 38.5
Operating inc. (loss) $(10.0) $(3.1)
Cash flow is after G&A but before exploration and development
(fully diluted)
$40
$25
$15
2013 Liquidity Sources (millions)
Cash
Cash Flow
Bank Facility50.5%
41.9%
7.6% Ownership by Shareholder Category
Retail
Institutional
Officer and Director
NASDAQ: FXEN 4
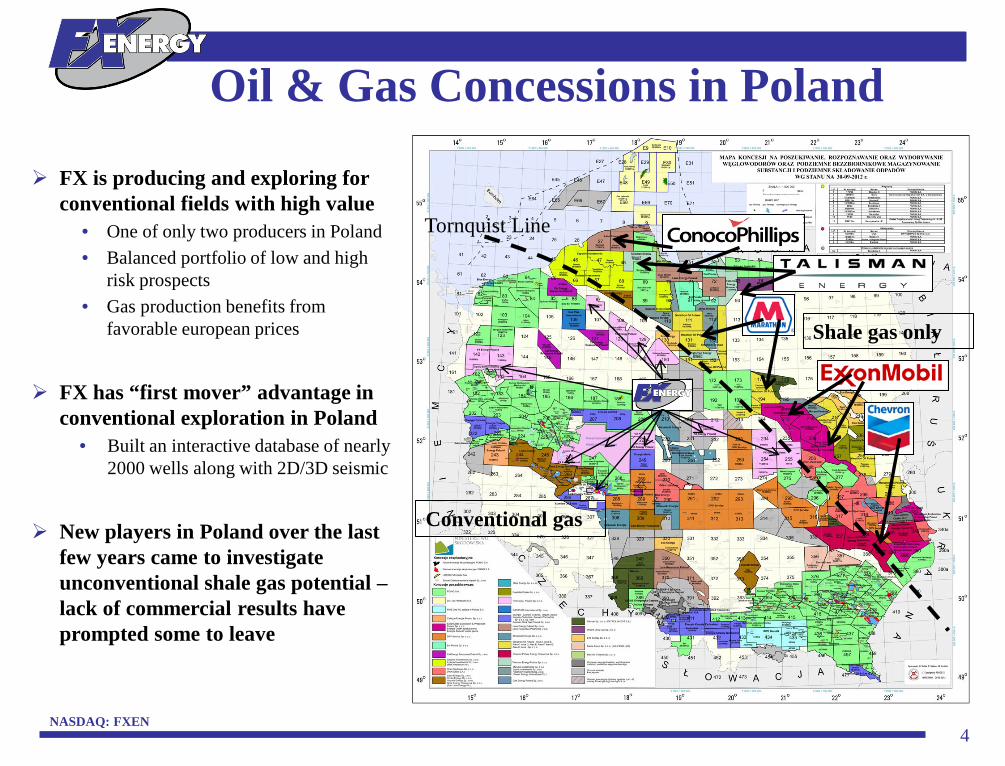
Oil & Gas Concessions in Poland
FX is producing and exploring for conventional fields with high value
• One of only two producers in Poland • Balanced portfolio of low and high
risk prospects • Gas production benefits from
favorable european prices
FX has “first mover” advantage in conventional exploration in Poland
• Built an interactive database of nearly 2000 wells along with 2D/3D seismic
New players in Poland over the last few years came to investigate unconventional shale gas potential – lack of commercial results have prompted some to leave
Shale gas only
Conventional gas
Tornquist Line
Fences Concession PGNiG; FX Energy Poland
NASDAQ: FXEN 5
FX Energy Today Significant assets
• 2.7 million gross (2.0 mm net) acres (over 8,000 net km2) in Poland – 14 licenses • $243 million NAV at 12/31/12 (P50 pre-tax reserves(1)); $4.56/share NAV before prospect and acreage value
High European gas prices • $8.51/mmbtu(2) ($317/Mcm) FX 2012 full year average wellhead price
Strong and growing production and revenues • 2011: 12 Mmcfe/d (322 Mcme/d) net to FX; net revenues of approx. $26mm • 2012: 13.1 Mmcfe/d (354 Mcme/d) net to FX; net revenues of approx. $31mm • 2013: 14.0 Mmcfe/d (375 Mcme/d) net to FX 1Q2013 forecast; Lisewo facility scheduled to start 2H13
Major increase in drilling activity – potential for significant discoveries • 2012 E&P spending: $36 million, plus $20 more for ops running over year end • 2013 E&P commitments anticipated to be $60-70 million • Two-thirds focused on increasing reserves and production in core area (Fences) • One-third focused on finding new production areas (Edge, Block 229, Warsaw South, Block 246) • Tuchola-3 (Edge concession) started drilling 12/2012; Mieczewo (Fences) started drilling 1/2013 • 2013: 2-3 additional wells planned for Fences Lisewo area; 2-4 more non-Fences wells
Note: (1) As per RPS Energy and Hohn Engineering as of 12/31/2012
(2) Based on $1=pln3.26 avg. for full year 2012; at 3/14/2013 $1 ≈ PLN 3.20
WHY POLAND?
6
Sound economy; rule of law
Untapped conventional resources
Strong gas market
Attractive economics
NASDAQ: FXEN 7
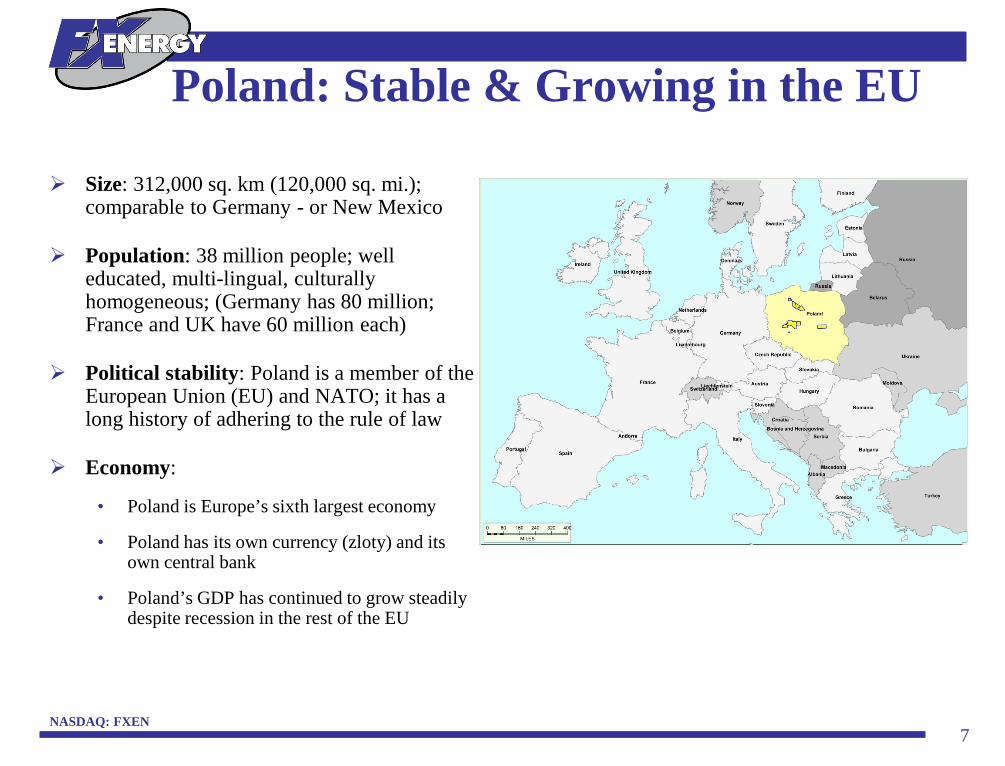
Size: 312,000 sq. km (120,000 sq. mi.); comparable to Germany - or New Mexico
Population: 38 million people; well educated, multi-lingual, culturally homogeneous; (Germany has 80 million; France and UK have 60 million each)
Political stability: Poland is a member of the European Union (EU) and NATO; it has a long history of adhering to the rule of law
Economy:
• Poland is Europe’s sixth largest economy
• Poland has its own currency (zloty) and its own central bank
• Poland’s GDP has continued to grow steadily despite recession in the rest of the EU
Poland: Stable & Growing in the EU

NASDAQ: FXEN
Poland has significant hydrocarbon potential
• Geology doesn’t stop at the border; Poland is just under-explored
• Permian Basin extends across Europe: Permian (Rotliegend) gas fields in Poland are direct analogs to those found in the UK and Dutch sectors of the Southern North Sea and onshore Holland and Germany
• Only one company (state owned) was exploring Poland during the Iron Curtain decades
• The North Sea was (and is) explored by dozens of companies
8
Untapped Resources in Poland
North European
Permian Basin
150 Tcf 4.0 Tcm
40 Tcf 1.1 Tcm
60 Tcf 1.6 Tcm
5 Tcf 0.1 Tcm
FX
NASDAQ: FXEN 9
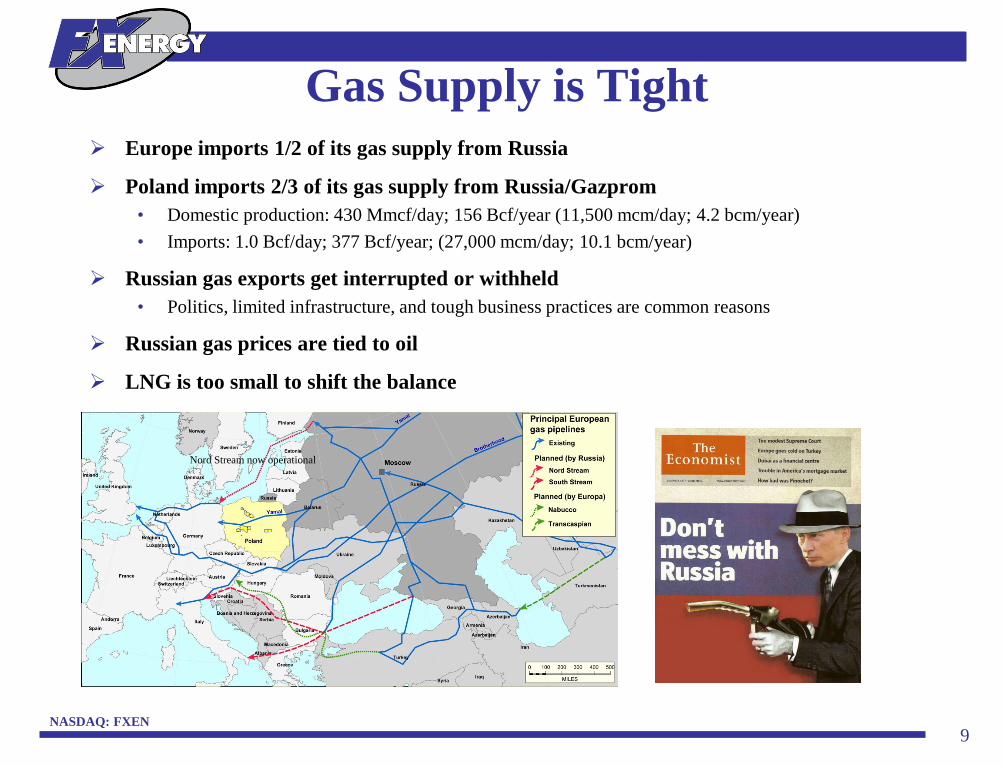
Europe imports 1/2 of its gas supply from Russia
Poland imports 2/3 of its gas supply from Russia/Gazprom • Domestic production: 430 Mmcf/day; 156 Bcf/year (11,500 mcm/day; 4.2 bcm/year) • Imports: 1.0 Bcf/day; 377 Bcf/year; (27,000 mcm/day; 10.1 bcm/year)
Russian gas exports get interrupted or withheld • Politics, limited infrastructure, and tough business practices are common reasons
Russian gas prices are tied to oil
LNG is too small to shift the balance
Gas Supply is Tight
Nord Stream now operational
0 zł
200 zł
400 zł
600 zł
800 zł
1,000 zł
1,200 zł
1,400 zł
Jan-
03
Aug
-03
Apr
-04
Dec
-04
Jul-0
5
Mar
-06
Nov
-06
Jun-
07
Feb-
08
Oct
-08
May
-09
Jan-
10
Sep
-10
Apr
-11
Dec
-11
Aug
-12
Mar
-13
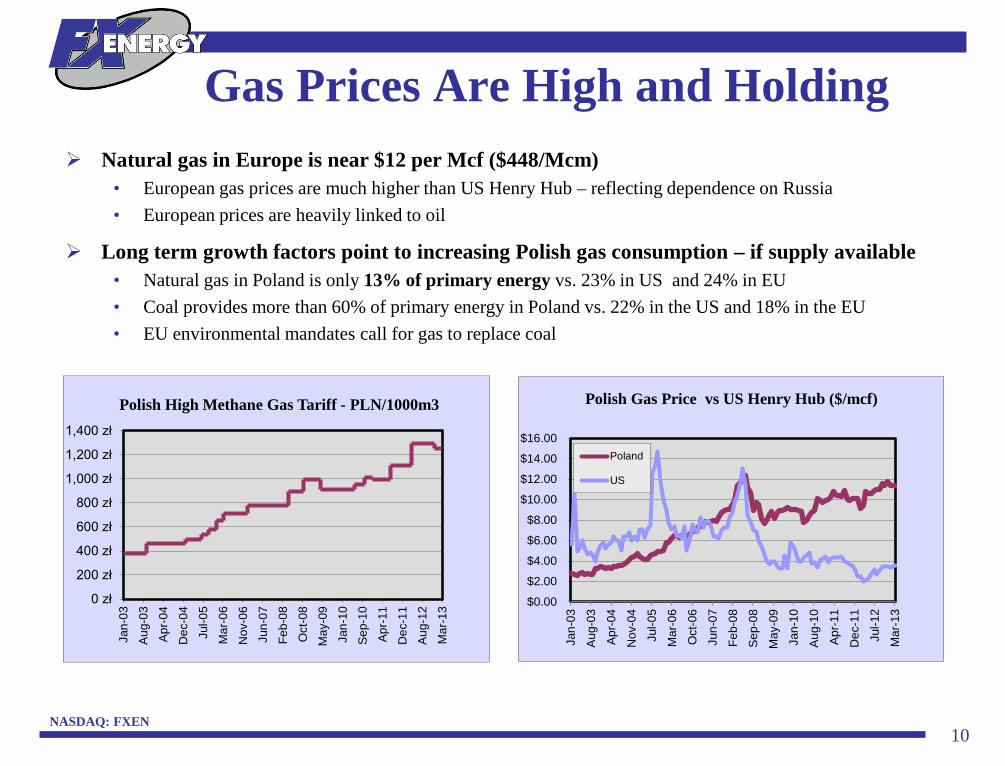
Polish High Methane Gas Tariff - PLN/1000m3
10
Gas Prices Are High and Holding
NASDAQ: FXEN
Natural gas in Europe is near $12 per Mcf ($448/Mcm) • European gas prices are much higher than US Henry Hub – reflecting dependence on Russia • European prices are heavily linked to oil
Long term growth factors point to increasing Polish gas consumption – if supply available • Natural gas in Poland is only 13% of primary energy vs. 23% in US and 24% in EU • Coal provides more than 60% of primary energy in Poland vs. 22% in the US and 18% in the EU • EU environmental mandates call for gas to replace coal
$0.00
$2.00
$4.00
$6.00
$8.00
$10.00
$12.00
$14.00
$16.00
Jan-
03
Aug
-03
Apr
-04
Nov
-04
Jul-0
5
Mar
-06
Oct
-06
Jun-
07
Feb-
08
Sep
-08
May
-09
Jan-
10
Aug
-10
Apr
-11
Dec
-11
Jul-1
2
Mar
-13
Polish Gas Price vs US Henry Hub ($/mcf)
Poland
US
NASDAQ: FXEN
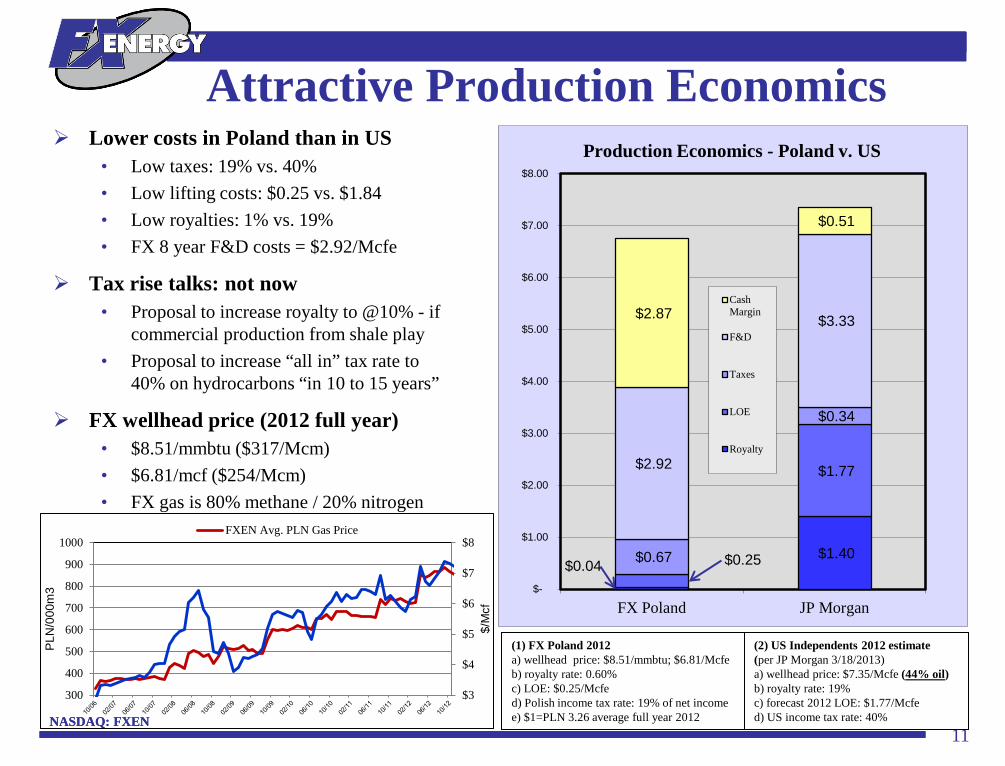
$0.04 $1.40 $0.25
$1.77
$0.67
$0.34
$2.92
$3.33 $2.87
$0.51
$-
$1.00
$2.00
$3.00
$4.00
$5.00
$6.00
$7.00
$8.00
FX Poland JP Morgan
CashMargin
F&D
Taxes
LOE
Royalty
Production Economics - Poland v. US
11
Lower costs in Poland than in US • Low taxes: 19% vs. 40% • Low lifting costs: $0.25 vs. $1.84 • Low royalties: 1% vs. 19% • FX 8 year F&D costs = $2.92/Mcfe
Tax rise talks: not now • Proposal to increase royalty to @10% - if
commercial production from shale play • Proposal to increase “all in” tax rate to
40% on hydrocarbons “in 10 to 15 years”
FX wellhead price (2012 full year) • $8.51/mmbtu ($317/Mcm) • $6.81/mcf ($254/Mcm) • FX gas is 80% methane / 20% nitrogen
(2) US Independents 2012 estimate (per JP Morgan 3/18/2013) a) wellhead price: $7.35/Mcfe (44% oil) b) royalty rate: 19% c) forecast 2012 LOE: $1.77/Mcfe d) US income tax rate: 40%
(1) FX Poland 2012 a) wellhead price: $8.51/mmbtu; $6.81/Mcfe b) royalty rate: 0.60% c) LOE: $0.25/Mcfe d) Polish income tax rate: 19% of net income e) $1=PLN 3.26 average full year 2012
Attractive Production Economics
NASDAQ: FXEN
$3
$4
$5
$6
$7
$8
300
400
500
600
700
800
900
1000
$/M
cf
PLN
/000
m3
FXEN Avg. PLN Gas Price
NASDAQ: FXEN
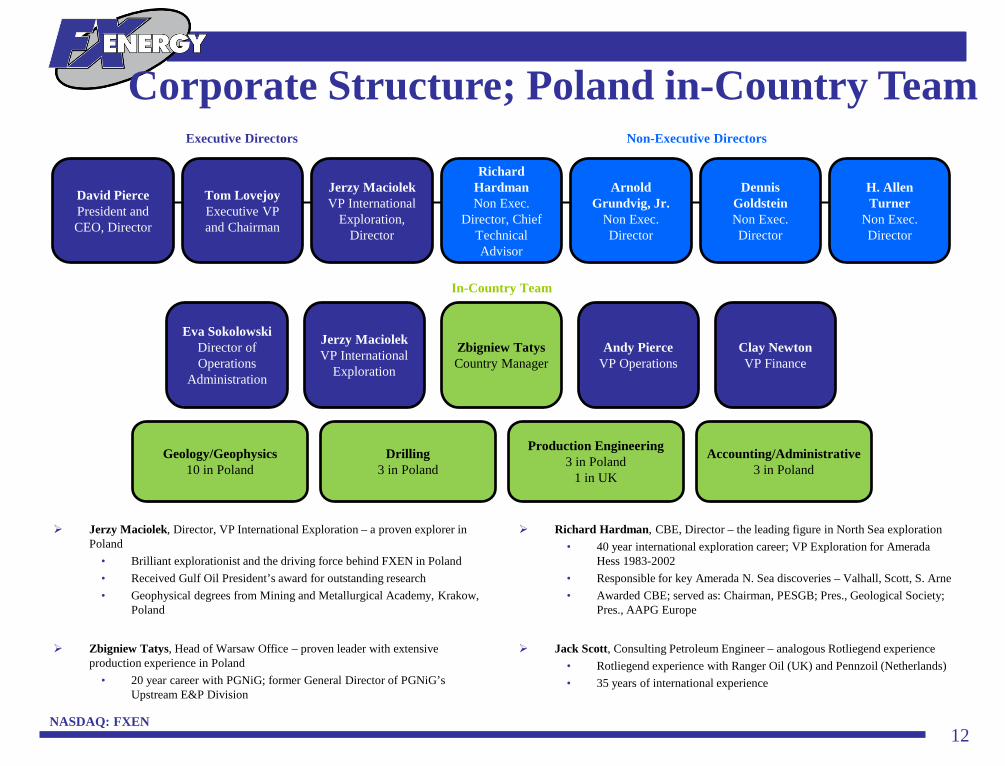
David Pierce President and CEO, Director
Jerzy Maciolek VP International
Exploration, Director
Arnold Grundvig, Jr.
Non Exec. Director
Dennis Goldstein Non Exec. Director
Richard Hardman Non Exec.
Director, Chief Technical Advisor
Tom Lovejoy Executive VP and Chairman
12
Corporate Structure; Poland in-Country Team
H. Allen Turner
Non Exec. Director
Executive Directors Non-Executive Directors
In-Country Team
Zbigniew Tatys Country Manager
Geology/Geophysics 10 in Poland
Drilling 3 in Poland
Production Engineering 3 in Poland
1 in UK
Accounting/Administrative 3 in Poland
Jerzy Maciolek, Director, VP International Exploration – a proven explorer in Poland
• Brilliant explorationist and the driving force behind FXEN in Poland • Received Gulf Oil President’s award for outstanding research • Geophysical degrees from Mining and Metallurgical Academy, Krakow,
Poland
Zbigniew Tatys, Head of Warsaw Office – proven leader with extensive production experience in Poland
• 20 year career with PGNiG; former General Director of PGNiG’s Upstream E&P Division
Richard Hardman, CBE, Director – the leading figure in North Sea exploration • 40 year international exploration career; VP Exploration for Amerada
Hess 1983-2002 • Responsible for key Amerada N. Sea discoveries – Valhall, Scott, S. Arne • Awarded CBE; served as: Chairman, PESGB; Pres., Geological Society;
Pres., AAPG Europe
Jack Scott, Consulting Petroleum Engineer – analogous Rotliegend experience • Rotliegend experience with Ranger Oil (UK) and Pennzoil (Netherlands) • 35 years of international experience
Jerzy Maciolek VP International
Exploration
Andy Pierce VP Operations
Clay Newton VP Finance
Eva Sokolowski Director of Operations
Administration

PRODUCTION and DEVELOPMENT
---
The Fences Concession
13
65.0%
35.0%
2013 Capital Allocation (est.)
Fences
Non-Fences
NASDAQ: FXEN 14
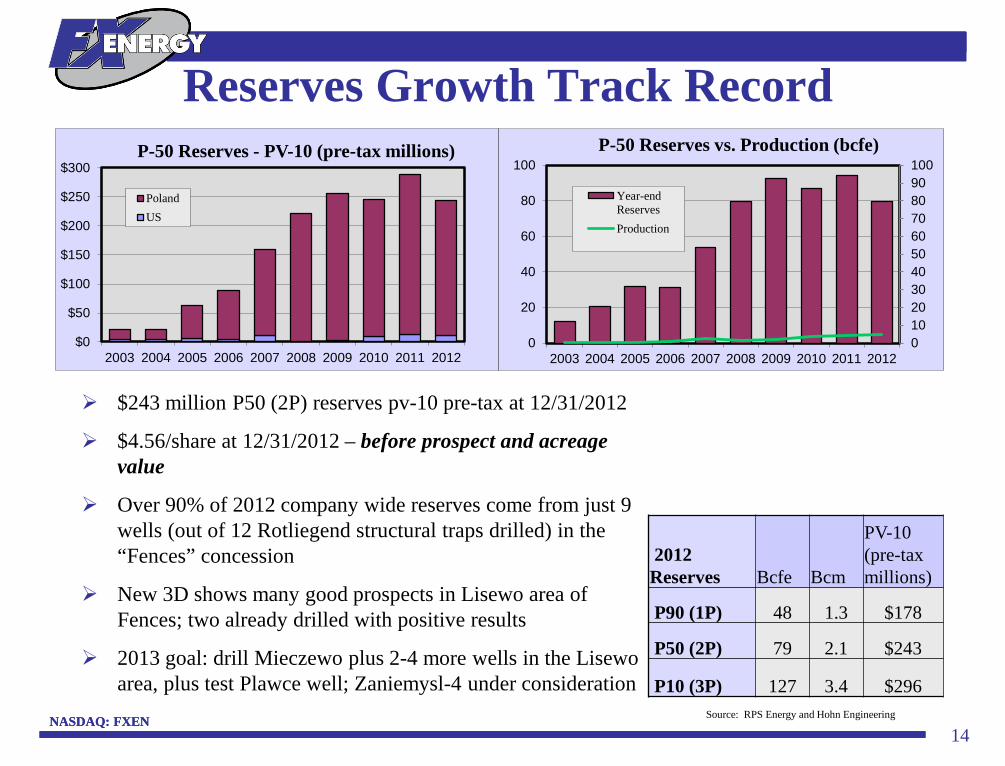
$243 million P50 (2P) reserves pv-10 pre-tax at 12/31/2012
$4.56/share at 12/31/2012 – before prospect and acreage value
Over 90% of 2012 company wide reserves come from just 9 wells (out of 12 Rotliegend structural traps drilled) in the “Fences” concession
New 3D shows many good prospects in Lisewo area of Fences; two already drilled with positive results
2013 goal: drill Mieczewo plus 2-4 more wells in the Lisewo area, plus test Plawce well; Zaniemysl-4 under consideration
NASDAQ: FXEN
Reserves Growth Track Record
2012 Reserves Bcfe Bcm
PV-10 (pre-tax millions)
P90 (1P) 48 1.3 $178
P50 (2P) 79 2.1 $243
P10 (3P) 127 3.4 $296 Source: RPS Energy and Hohn Engineering
$0
$50
$100
$150
$200
$250
$300
2003 2004 2005 2006 2007 2008 2009 2010 2011 2012
P-50 Reserves - PV-10 (pre-tax millions)
PolandUS
0102030405060708090100
0
20
40
60
80
100
2003 2004 2005 2006 2007 2008 2009 2010 2011 2012
P-50 Reserves vs. Production (bcfe)
Year-endReservesProduction
NASDAQ: FXEN 15
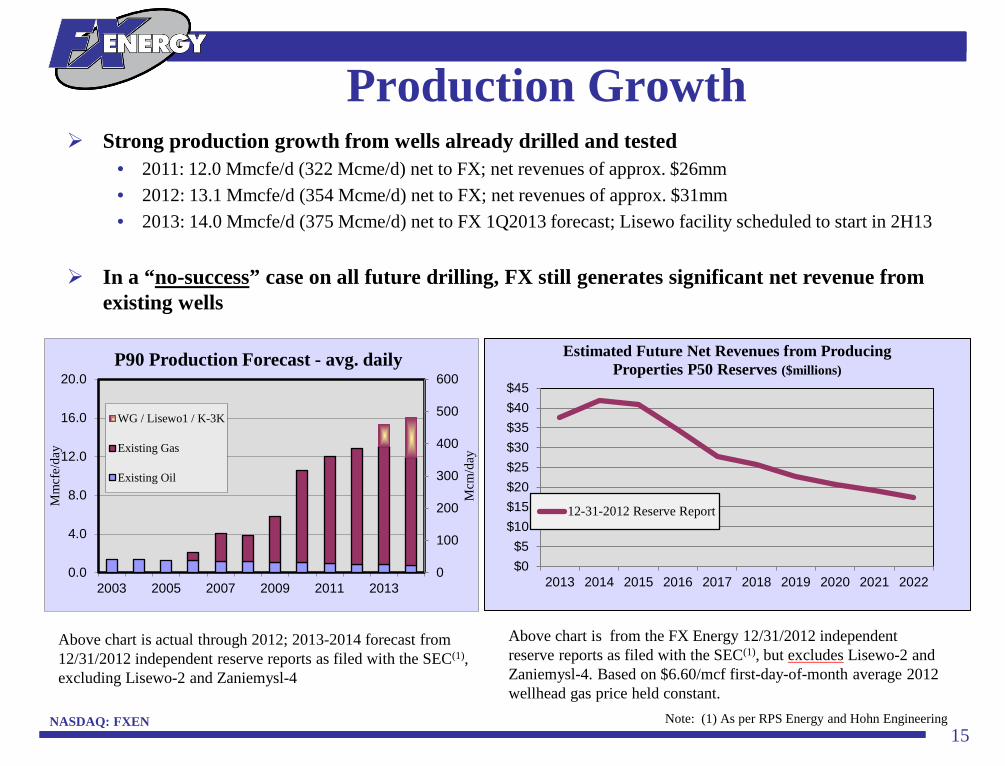
Production Growth Strong production growth from wells already drilled and tested
• 2011: 12.0 Mmcfe/d (322 Mcme/d) net to FX; net revenues of approx. $26mm • 2012: 13.1 Mmcfe/d (354 Mcme/d) net to FX; net revenues of approx. $31mm • 2013: 14.0 Mmcfe/d (375 Mcme/d) net to FX 1Q2013 forecast; Lisewo facility scheduled to start in 2H13
In a “no-success” case on all future drilling, FX still generates significant net revenue from
existing wells
Above chart is from the FX Energy 12/31/2012 independent reserve reports as filed with the SEC(1), but excludes Lisewo-2 and Zaniemysl-4. Based on $6.60/mcf first-day-of-month average 2012 wellhead gas price held constant.
Note: (1) As per RPS Energy and Hohn Engineering
Above chart is actual through 2012; 2013-2014 forecast from 12/31/2012 independent reserve reports as filed with the SEC(1), excluding Lisewo-2 and Zaniemysl-4
0
100
200
300
400
500
600
0.0
4.0
8.0
12.0
16.0
20.0
2003 2005 2007 2009 2011 2013
Mcm
/day
Mm
cfe/
day
P90 Production Forecast - avg. daily
WG / Lisewo1 / K-3K
Existing Gas
Existing Oil
$0$5
$10$15$20$25$30$35$40$45
2013 2014 2015 2016 2017 2018 2019 2020 2021 2022
Estimated Future Net Revenues from Producing Properties P50 Reserves ($millions)
12-31-2012 Reserve Report
NASDAQ: FXEN 16
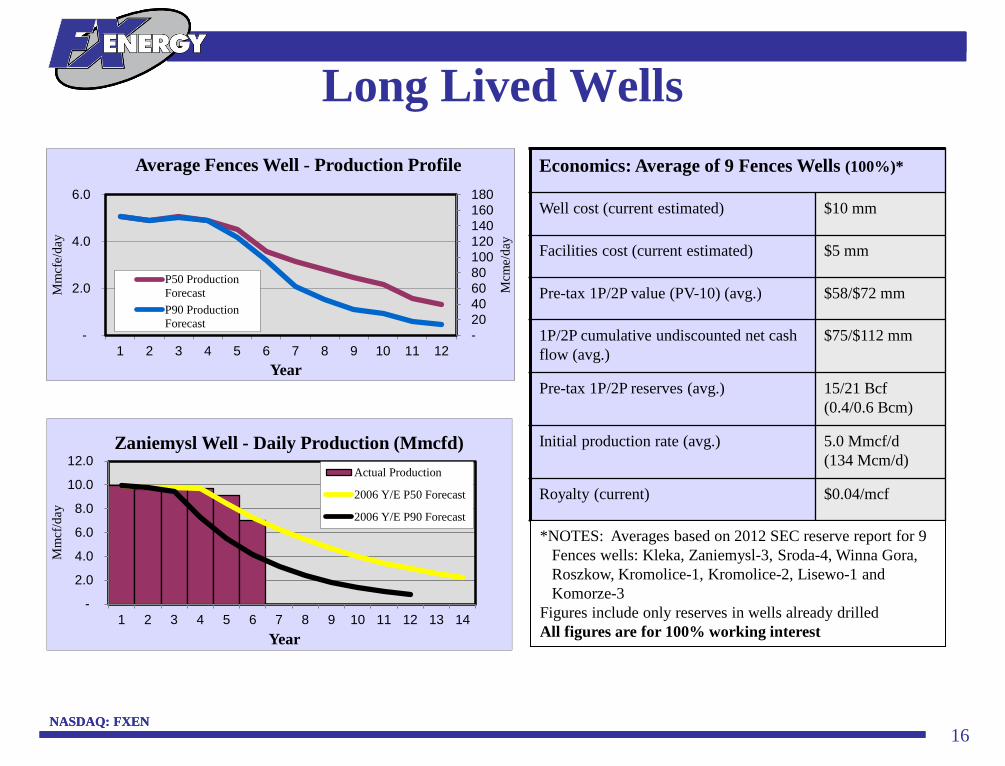
Economics: Average of 9 Fences Wells (100%)*
Well cost (current estimated) $10 mm
Facilities cost (current estimated) $5 mm
Pre-tax 1P/2P value (PV-10) (avg.) $58/$72 mm
1P/2P cumulative undiscounted net cash flow (avg.)
$75/$112 mm
Pre-tax 1P/2P reserves (avg.) 15/21 Bcf (0.4/0.6 Bcm)
Initial production rate (avg.) 5.0 Mmcf/d (134 Mcm/d)
Royalty (current) $0.04/mcf
*NOTES: Averages based on 2012 SEC reserve report for 9 Fences wells: Kleka, Zaniemysl-3, Sroda-4, Winna Gora, Roszkow, Kromolice-1, Kromolice-2, Lisewo-1 and Komorze-3
Figures include only reserves in wells already drilled All figures are for 100% working interest
NASDAQ: FXEN
Long Lived Wells
-
2.0
4.0
6.0
8.0
10.0
12.0
1 2 3 4 5 6 7 8 9 10 11 12 13 14
Mm
cf/d
ay
Year
Zaniemysl Well - Daily Production (Mmcfd) Actual Production
2006 Y/E P50 Forecast
2006 Y/E P90 Forecast
- 20 40 60 80 100 120 140 160 180
-
2.0
4.0
6.0
1 2 3 4 5 6 7 8 9 10 11 12
Mcm
e/da
y
Mm
cfe/
day
Year
Average Fences Well - Production Profile
P50 ProductionForecastP90 ProductionForecast

NASDAQ: FXEN
Fences concession: 850,000 acres (3,440 km2) surrounding PGNiG’s 390 Bcf (10.5 Bcm) Radlin Gas Field
17
Rotliegend gas potential • Rotliegend gas fields from the
1980’s showed area potential
• PGNiG had moved on to other plays (Zechstein) in Poland
• Seismic advances from the North Sea had not been applied
• FX saw high potential with limited “wildcat” risk
• Fences: FX earned 49%; PGNiG holds 51% and operates
Fences
Fences Concession – FX Core Area
Block 246 FX 100%
PGNiG’s Paproc field 267 Bcf (7.2 Bcm) disc. 1982
PGNiG’s Radlin field 390 Bcf (10.5 Bcm) disc. 1985
Fences FX 49%
FX 24.5%
NASDAQ: FXEN 18
NASDAQ: FXEN
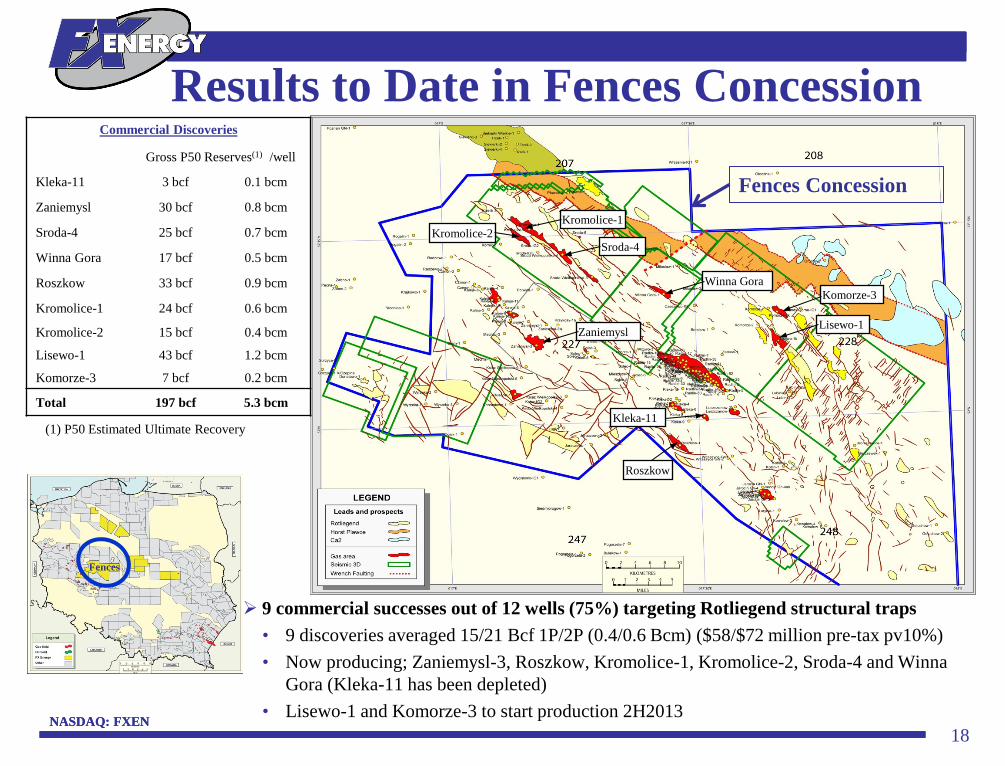
Results to Date in Fences Concession
(1) P50 Estimated Ultimate Recovery
9 commercial successes out of 12 wells (75%) targeting Rotliegend structural traps • 9 discoveries averaged 15/21 Bcf 1P/2P (0.4/0.6 Bcm) ($58/$72 million pre-tax pv10%) • Now producing; Zaniemysl-3, Roszkow, Kromolice-1, Kromolice-2, Sroda-4 and Winna
Gora (Kleka-11 has been depleted) • Lisewo-1 and Komorze-3 to start production 2H2013
Fences
Kromolice-1 Kromolice-2
Zaniemysl Lisewo-1
Kleka-11
Roszkow
Winna Gora
Sroda-4
Fences Concession
Komorze-3
Commercial Discoveries
Gross P50 Reserves(1) /well
Kleka-11 3 bcf 0.1 bcm
Zaniemysl 30 bcf 0.8 bcm
Sroda-4 25 bcf 0.7 bcm
Winna Gora 17 bcf 0.5 bcm
Roszkow 33 bcf 0.9 bcm
Kromolice-1 24 bcf 0.6 bcm
Kromolice-2 15 bcf 0.4 bcm
Lisewo-1 43 bcf 1.2 bcm
Komorze-3 7 bcf 0.2 bcm
Total 197 bcf 5.3 bcm

NASDAQ: FXEN
2012 Carryover Operations • Production: Winna Gora
facility came online 1Q2013 • Drilling: Mieczewo-1 started
drilling January 2013; Plawce-2 frac scheduled 2Q2013; Zaniemysl-4 under consideration
• 3-D seismic: continue expanding 3-D coverage for drilling targets beyond 2013
19 NASDAQ: FXEN
2013 Operations Plan
2013 Operations • Build Production in Lisewo Area: Lisewo-1 and Komorze-3 to start production
in 2H2013, along with Lisewo-2 if successful • Drilling in Lisewo Area: many good prospects on new 3D seismic in Lisewo
area; two are discoveries; FX goal: drill 2-4 more in Lisewo area in 2013
Fences
Lisewo/Komorze production 2H2013
Mieczewo spud 1/2013
Komorze-3
Lisewo-2: 1H2013
WG prod 1Q2013
Plawce-2 frac/test 1H2013 Fences Concession
Zaniemysl-4?
NASDAQ: FXEN 20
NASDAQ: FXEN
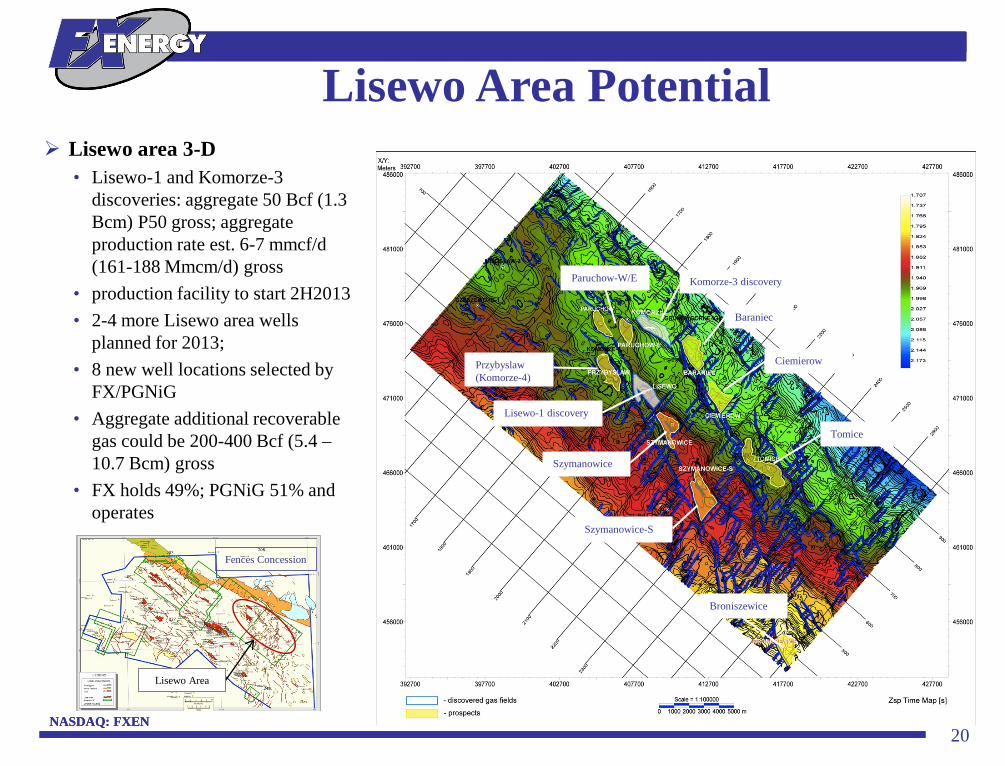
Lisewo Area Potential Lisewo area 3-D
• Lisewo-1 and Komorze-3 discoveries: aggregate 50 Bcf (1.3 Bcm) P50 gross; aggregate production rate est. 6-7 mmcf/d (161-188 Mmcm/d) gross
• production facility to start 2H2013 • 2-4 more Lisewo area wells
planned for 2013; • 8 new well locations selected by
FX/PGNiG • Aggregate additional recoverable
gas could be 200-400 Bcf (5.4 – 10.7 Bcm) gross
• FX holds 49%; PGNiG 51% and operates
Przybyslaw (Komorze-4)
Lisewo-1 discovery
Paruchow-W/E
Baraniec
Ciemierow
Tomice
Szymanowice
Szymanowice-S
Broniszewice
Fences Concession
Lisewo Area
Komorze-3 discovery
21
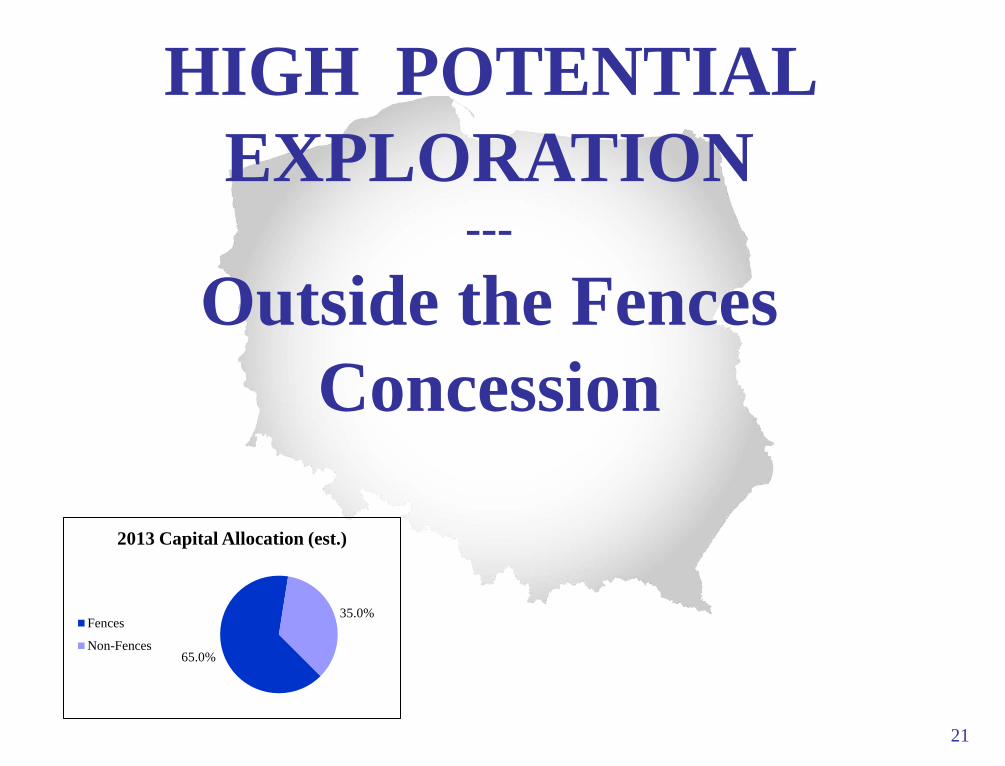
HIGH POTENTIAL EXPLORATION
---
Outside the Fences Concession
65.0%
35.0%
2013 Capital Allocation (est.)
Fences
Non-Fences
NASDAQ: FXEN 22
NASDAQ: FXEN
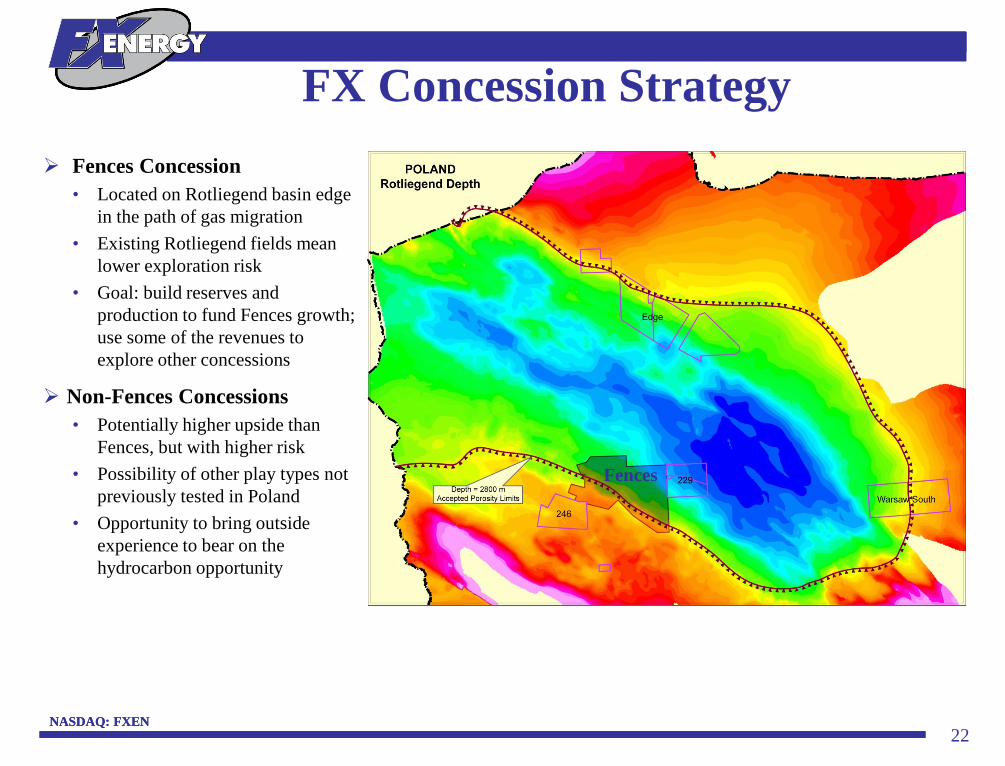
FX Concession Strategy Fences Concession
• Located on Rotliegend basin edge in the path of gas migration
• Existing Rotliegend fields mean lower exploration risk
• Goal: build reserves and production to fund Fences growth; use some of the revenues to explore other concessions
Non-Fences Concessions • Potentially higher upside than
Fences, but with higher risk • Possibility of other play types not
previously tested in Poland • Opportunity to bring outside
experience to bear on the hydrocarbon opportunity
Fences
NASDAQ: FXEN 23
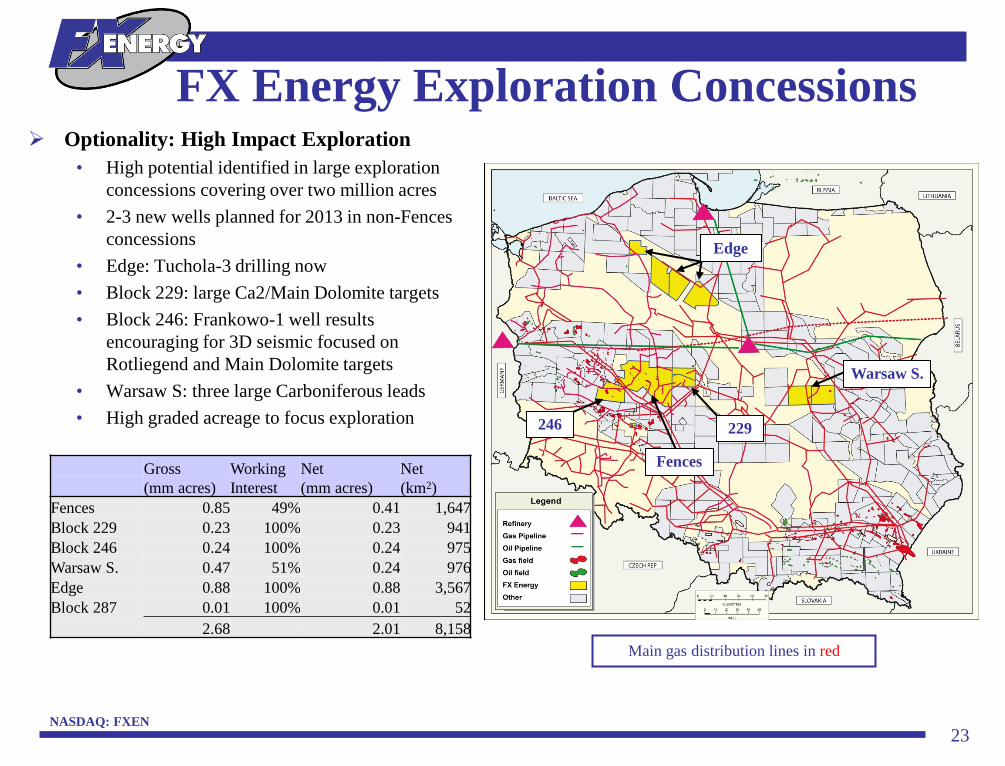
Optionality: High Impact Exploration • High potential identified in large exploration
concessions covering over two million acres • 2-3 new wells planned for 2013 in non-Fences
concessions • Edge: Tuchola-3 drilling now • Block 229: large Ca2/Main Dolomite targets • Block 246: Frankowo-1 well results
encouraging for 3D seismic focused on Rotliegend and Main Dolomite targets
• Warsaw S: three large Carboniferous leads • High graded acreage to focus exploration
FX Energy Exploration Concessions
Main gas distribution lines in red
Gross (mm acres)
Working Interest
Net (mm acres)
Net (km2)
Fences 0.85 49% 0.41 1,647 Block 229 0.23 100% 0.23 941 Block 246 0.24 100% 0.24 975 Warsaw S. 0.47 51% 0.24 976 Edge 0.88 100% 0.88 3,567 Block 287 0.01 100% 0.01 52 2.68 2.01 8,158
229
Fences
246
Warsaw S.
Edge

NASDAQ: FXEN 24
NASDAQ: FXEN
Edge Concession – Tuchola-3K Well
Edge
Edge concessions
Tuchola prospect
Unislaw prospect
Tuchola 3-K drilling
Apache Tuchola-2 (2001) tested gas
Ca2 2600m
Devonian 3800m
Edge Concessions
• 880,000 gross and net acres/3,567 km2; FX operates, holds 100%. • Tuchola-3K drilling: Ca2 gas potential up to 30 Bcf recoverable at
2600m; plus Devonian oil potential up to 70 mmbo in place at 3800m • The 2001 Apache Tuchola-2 well tested Ca2 gas at 9.5 mmcf/d; 90
Bcf (2.4 Bcm) of p50 reserves; over-ambitious acid job drew in water • Tuchola-3 well started drilling 12/2012; 1-2 more Edge wells in 2013
NASDAQ: FXEN 25
NASDAQ: FXEN
Block 229
229
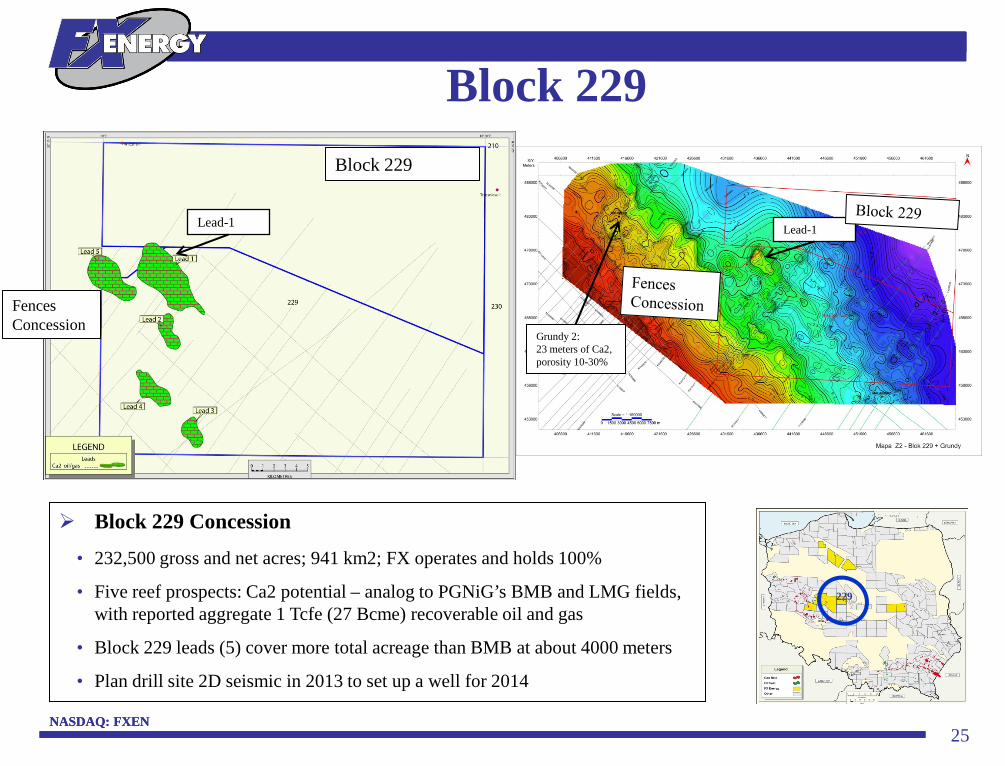
Block 229 Concession
• 232,500 gross and net acres; 941 km2; FX operates and holds 100%
• Five reef prospects: Ca2 potential – analog to PGNiG’s BMB and LMG fields, with reported aggregate 1 Tcfe (27 Bcme) recoverable oil and gas
• Block 229 leads (5) cover more total acreage than BMB at about 4000 meters
• Plan drill site 2D seismic in 2013 to set up a well for 2014
Lead-1
Grundy 2: 23 meters of Ca2, porosity 10-30%
Lead-1
Block 229
Fences Concession
NASDAQ: FXEN
246
26 NASDAQ: FXEN
Block 246
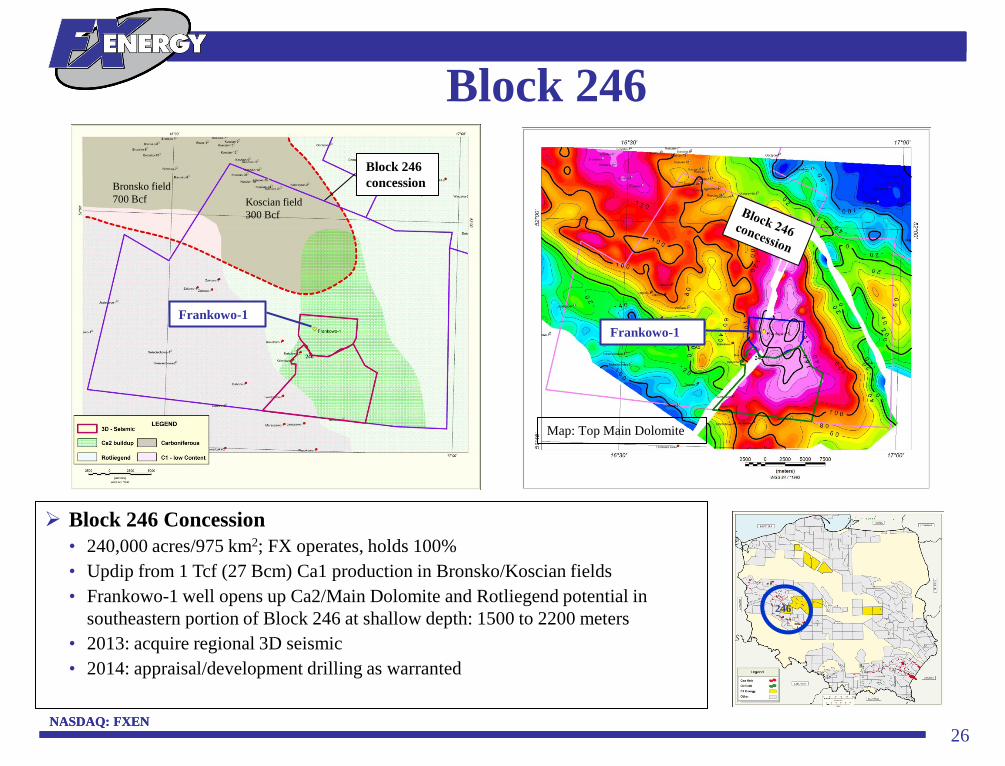
Block 246 Concession • 240,000 acres/975 km2; FX operates, holds 100% • Updip from 1 Tcf (27 Bcm) Ca1 production in Bronsko/Koscian fields • Frankowo-1 well opens up Ca2/Main Dolomite and Rotliegend potential in
southeastern portion of Block 246 at shallow depth: 1500 to 2200 meters • 2013: acquire regional 3D seismic • 2014: appraisal/development drilling as warranted
Block 246 concession Bronsko field
700 Bcf Koscian field 300 Bcf
Frankowo-1 Frankowo-1
Map: Top Main Dolomite
NASDAQ: FXEN
W-S
27 NASDAQ: FXEN
Warsaw South Concessions
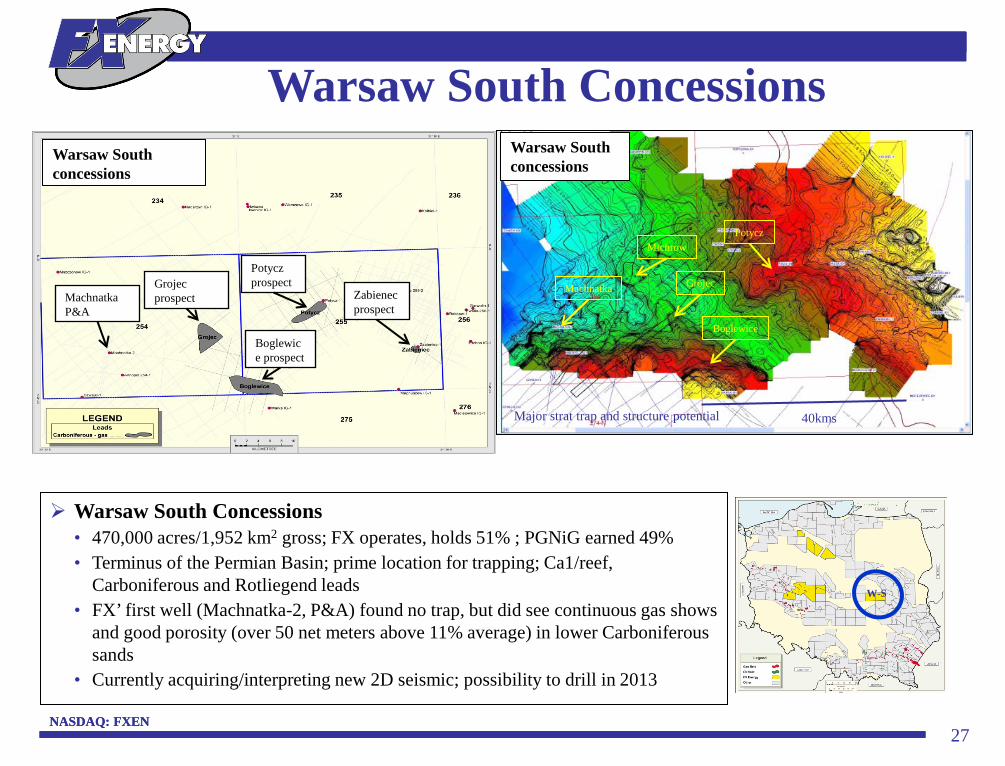
Warsaw South Concessions • 470,000 acres/1,952 km2 gross; FX operates, holds 51% ; PGNiG earned 49% • Terminus of the Permian Basin; prime location for trapping; Ca1/reef,
Carboniferous and Rotliegend leads • FX’ first well (Machnatka-2, P&A) found no trap, but did see continuous gas shows
and good porosity (over 50 net meters above 11% average) in lower Carboniferous sands
• Currently acquiring/interpreting new 2D seismic; possibility to drill in 2013
Machnatka P&A
Boglewice prospect
Grojec prospect
Potycz prospect
Warsaw South concessions
Zabienec prospect
40kms
Machnatka Grojec
Michrow
Major strat trap and structure potential
Boglewice
Potycz
Warsaw South concessions
NASDAQ: FXEN 28
FX 2012 year end reserves • 79 Bcfe (2.1 Bcme) of 2P(P50) reserves at 12/31/2012; $243 mm pre-tax pv10% • Each of the projects below has the potential to more than double those numbers
Fences • Lisewo Area: Potential up to 100-200 Bcf (2.7–5.4 Bcm) net to FX fully developed from
multiple prospects on 3-D seismic (plus Lisewo-1 and Komorze-3 discoveries); 2-4 new wells planned for 2013 in Lisewo area
• Plawce: Potential up to 125 Bcf (3.4 Bcm) net to FX fully developed from tight sand prospect; Plawce-2 well to frac and test 2Q2013
Edge (Tuchola-3) • Potential up to 110 Bcfe (2.9 Bcme) net to FX fully developed from Tuchola prospect: potential
for gas in Ca2 and oil in Devonian; started drilling 12/2012; 1-2 more wells planned for 2013
Warsaw South • New seismic on two large prospects; possibility to drill in 2013
Block 246 (Frankowo-1) • Frankowo-1 well provided data and encouragement; regional 3D seismic in 2013 planned for
Main Dolomite and Rotliegend; appraisal/development drilling in 2014 as warranted
Block 229 (Ca2/Main Dolomite) • Potential up to several hundred Bcfe including oil potential; analog to PGNiG’s 1Tcfe (27
Bcme) BMB and LMG fields; drillsite seismic this winter, first well 2014
Upside Potential in 5 Project Areas
NASDAQ: FXEN 29
NASDAQ: FXEN
NAV and Forward Drilling Program
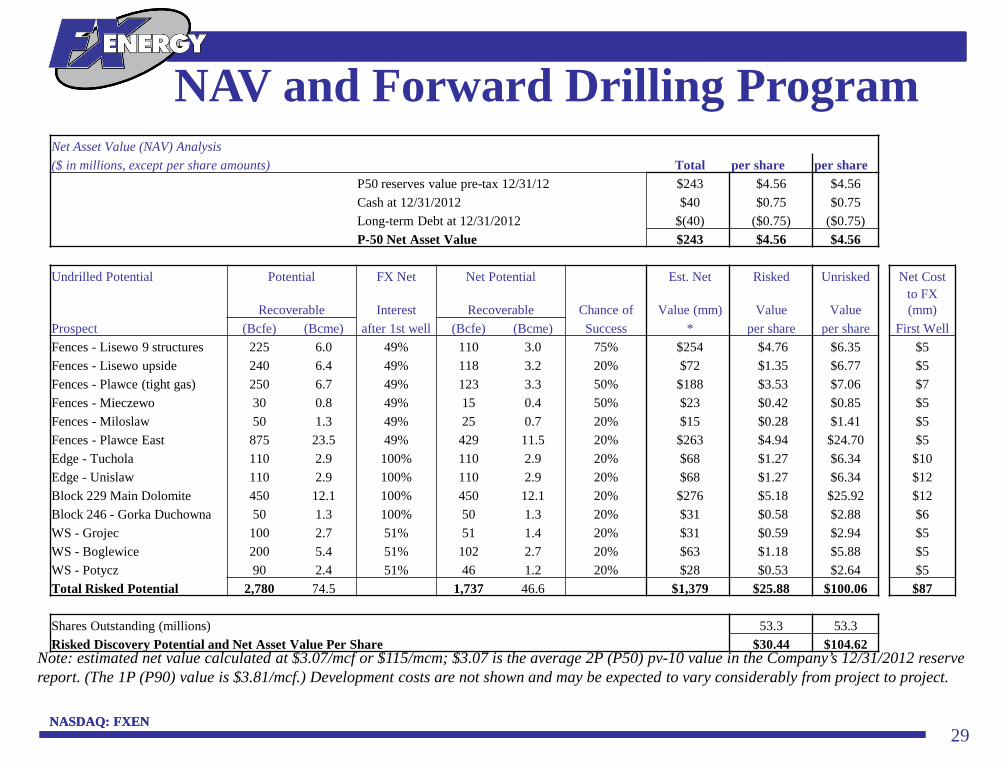
Note: estimated net value calculated at $3.07/mcf or $115/mcm; $3.07 is the average 2P (P50) pv-10 value in the Company’s 12/31/2012 reserve report. (The 1P (P90) value is $3.81/mcf.) Development costs are not shown and may be expected to vary considerably from project to project.
Net Asset Value (NAV) Analysis ($ in millions, except per share amounts) Total per share per share P50 reserves value pre-tax 12/31/12 $243 $4.56 $4.56 Cash at 12/31/2012 $40 $0.75 $0.75 Long-term Debt at 12/31/2012 $(40) ($0.75) ($0.75) P-50 Net Asset Value $243 $4.56 $4.56
Undrilled Potential Potential FX Net Net Potential Est. Net Risked Unrisked Net Cost
Recoverable Interest Recoverable Chance of Value (mm) Value Value to FX (mm)
Prospect (Bcfe) (Bcme) after 1st well (Bcfe) (Bcme) Success * per share per share First Well Fences - Lisewo 9 structures 225 6.0 49% 110 3.0 75% $254 $4.76 $6.35 $5 Fences - Lisewo upside 240 6.4 49% 118 3.2 20% $72 $1.35 $6.77 $5 Fences - Plawce (tight gas) 250 6.7 49% 123 3.3 50% $188 $3.53 $7.06 $7 Fences - Mieczewo 30 0.8 49% 15 0.4 50% $23 $0.42 $0.85 $5 Fences - Miloslaw 50 1.3 49% 25 0.7 20% $15 $0.28 $1.41 $5 Fences - Plawce East 875 23.5 49% 429 11.5 20% $263 $4.94 $24.70 $5 Edge - Tuchola 110 2.9 100% 110 2.9 20% $68 $1.27 $6.34 $10 Edge - Unislaw 110 2.9 100% 110 2.9 20% $68 $1.27 $6.34 $12 Block 229 Main Dolomite 450 12.1 100% 450 12.1 20% $276 $5.18 $25.92 $12 Block 246 - Gorka Duchowna 50 1.3 100% 50 1.3 20% $31 $0.58 $2.88 $6 WS - Grojec 100 2.7 51% 51 1.4 20% $31 $0.59 $2.94 $5 WS - Boglewice 200 5.4 51% 102 2.7 20% $63 $1.18 $5.88 $5 WS - Potycz 90 2.4 51% 46 1.2 20% $28 $0.53 $2.64 $5 Total Risked Potential 2,780 74.5 1,737 46.6 $1,379 $25.88 $100.06 $87
Shares Outstanding (millions) 53.3 53.3 Risked Discovery Potential and Net Asset Value Per Share $30.44 $104.62
Zaniemysl Production Facility
Aug. 2, 2008
Kromolice-1 rig floor during drill stem test
Aug. 22, 1995
First FX Concessions David Pierce, Dr.
Krzysztof Szamalek, Marek Hoffmann,
Tomasz Minkiewicz
Ostrowiec Well Rig floor
May. 29, 2009
Aug. 7, 2003
Mar. 13, 2009
Kromolice-2 rig and production test flare
Aug. 6, 2003
Wilga Production Facility
Zbigniew Kulczak, Clay Newton, Tom Lovejoy, David Pierce, Zbigniew
Tatys
Feb. 14, 2007
Winna Gora production test flare
Jun. 3, 2009
Roszkow Production Facility Andy Pierce, Aleksander
Nowak
Jan. 26, 2007
Grabowka JV Jerzy Maciolek, Zbigniew
Tatys, Eva Sokolowski, David Pierce, Piotr Buszka
Mar. 9, 2009
Roszkow Production Facility
Oct. 30, 2003
Zaniemysl-3 Drilling
May 29, 2009
Ostrowiec Drill Pad
Oct. 25, 2003
Zaniemysl-3 Drilling
June 2, 2009
Ostrowiec Drillsite Henry Dytko, Andy Pierce,
Aleksander Nowak
May 29, 2009
Ostrowiec Well Oct. 1, 2008
Seismic Acquisition Zerkow-Pleszew
Dec. 16, 2003
Zaniemysl Well Head
May 26, 2009
Ostrowiec Well